Article

In Vitro Antioxidant, Antibacterial and Mechanisms of Action of Ethanolic Extracts of Five Tunisian Plants against Bacteria

1
LR11INRGREF0 Laboratory of Management and Valorization of Forest Resources, National Research Institute of Rural Engineering, Water and Forests (INRGREF), Carthage University, Ariana 2080, Tunisia
2
Laboratory of Aromatic and Medicinal Plants, Biotechnology Center in Borj-CedriaTechnopark, P.O. Box 901, Hammam-Lif 2050, Tunisia
*
Author to whom correspondence should be addressed.
Appl. Sci. 2022, 12(10), 5038; https://doi.org/10.3390/app12105038
Submission received: 12 April 2022 / Revised: 2 May 2022 / Accepted: 12 May 2022 / Published: 16 May 2022

Abstract

:
Pistacia lentiscus, Rosmarinus officinalis, Erica multiflora, Calicotome villosa, and Phillyrea latifolia were considered important medicinal herbs and were used to treat various ailments. The present study was designed to evaluate the antioxidant and antimicrobial activities of ethanolic extracts (EEs). P. lentiscus and R. officinalis were the richest species in phenolic compounds. Similarly, both species showed the highest values of flavonoids. While the EEs of P. lentiscus, E. multiflora, and C. villosa had higher amounts of tannins. These phenolic compounds were evaluated by two different tests, namely diphenyl picrylhydrazyl (DPPH) and ferric iron-reducing power (FRAP). The IC50 values were found to be significant (p < 0.05) for P. lentiscus and E. multiflora. Similarly, both plants showed the highest ferric-reducing antioxidant power (FRAP). This study has been conducted to evaluate the antibacterial potential of EEs against selected bacteria—Gram-positive bacteria (Staphylococcus aureus ATCC 29213, Listeria monocytogenes ATCC 7644) and Gram-negative bacteria (Escherichia coli ATCC 8739, Salmonella typhimurium NCTC 6017)—and determine their modes of action. The ethanolic extracts inhibited bacterial growth by producing concentration-dependent zones of inhibition. Treatment with these extracts at their minimum inhibitory concentrations (MICs) showed a significant reduction (p < 0.05) in the viability of bacteria. The extracts did not induce total lysis. Bacteria organisms treated with EEs at MICs showed a significant (p < 0.05) loss of tolerance to NaCl (5%). Our results highlighted the use of plant extracts as natural antibacterials that can be safely used in health care and led to the understanding of the antibacterial mechanism of plant extracts.

1. Introduction

Aromatic and medicinal plants (AMPs) constitute, by their diversity, a reservoir of biologically active substances. These plants represent between 20,000 species of plants used in the world for pharmaceutical, therapeutic, agri-food, cosmetological, and industrial purposes [1,2,3,4]. The Mediterranean region, one of the world’s biodiversity hotspots, is known for its high richness of vegetation, especially aromatic and medicinal plants [5,6]. While in Tunisia, the diversity of the flora is characterized by a richness of species (estimated at 2100 species) in addition to 149 medicinal species and 38 aromatic plants [2,3]. Aromatic and medicinal plants contain various phytochemicals, such as tannins, alkaloids, terpenoids, and flavonoids, which are characterized by antioxidant and antimicrobial powers [7].
Regarding the studied species, they are characterized by their antioxidant, antimicrobial, anti-inflammatory, and anti-cancer power. Calicotome villosa (belonging to the Fabaceae family) and Erica multiflora (belonging to the Ericaceae family) are species used as antitumor remedies, and they are also used to treat boils, skin abscesses and chilblains [8,9]. Phillyrea latifolia (belonging to the Oleaceae family) and Pistacia lentiscus (belonging to the Anacardiaceae family) possess hypotensive action [10], and these species were studied for alterations in gastrointestinal nematode larvae [11]. Rosmarinus officinalis (belonging to the Lamiaceae family) has antioxidant, vasodilator, and anti-inflammatory properties [12].
In traditional medicine, crude extracts of different parts of aromatic and medicinal plants, including the fruit, flower, stem, root, and twigs, were largely used to treat certain bacterial diseases [13]. Recently, the use of plant-derived natural products as treatment strategies has gained prominence, and this is mainly due to the fight against the secondary effects of allopathic forms of medicine and the increasing incidence of antibiotic resistance [5,14]. Additionally, this undesirable change in antibiotic efficacy has prompted scientists to find another approach that can play a similar role with greater benefits and fewer disadvantages [15]. As a result, AMP is considered one of the “classic” forms of health care. Medicinal plants possess an important role in the treatment of complementary strategies and alternative forms of medicine because they produce a large variety of natural compounds with high therapeutic properties [16,17].
Several plant species have been tested for their antimicrobial activity, but the vast majority of these plants have not been adequately investigated [18]. Furthermore, information on the mechanism of action of antibacterial activity of the AMP extracts and associated bioactive compounds are still lacking [19]. It is well known that the general mechanism of antimicrobial compounds implicates the disruption of membrane potential or the permeabilization of the bacterial membrane or inhibition of macromolecular production [17]. Moreover, classical antibiotics act on microbes by affecting the synthesis of proteins and nucleic acids, the cell wall, and metabolite activity. Therefore, it would be beneficial if the mechanism of action of the supplemental antimicrobial agent was not the same as that of the antibiotic employed. AMP extracts or active ingredients of plant-based products that are not toxic to cells would be the best choice to be combined with antibiotics [1,2,3,4,17,20,21].
Consequently, the aim of the current study is first to determine the secondary metabolites of Pistacia lentiscus, Rosmarinus officinalis, Erica multiflora, Calicotome villosa, and Phillyrea latifolia and to estimate their antioxidant activities. Then, the potential protective effects of these extracts were evaluated against certain pathogenic bacteria. Finally, the mechanisms of action of the antibacterial activity of studied extracts were studied against Escherichia coli, Salmonella typhimurium, Listeria monocytogenes, and Staphylococcus aureus strains.

2. Materials and Methods

2.1. Plant Material

Leaves of five Tunisian medicinal plants (Pistacia lentiscus, Rosmarinus officinalis, Erica multiflora, Calicotome villosa, and Phillyrea latifolia, i.e., three plants per species and plot) were collected in the spring (27th March) of 2021 from the region of Zaghouan (northeast of Tunisia: 36°22′ N, 10°07 E, 340 m above sea level), transported in a portable cooler and identified in our laboratory in the National Research Institute of Rural Engineering, Waters and Forests (INRGREF) and then stocked at −20 °C until freeze-dried. The leaves of the species were crushed in a 2 mm diameter grinder.

2.2. Polyphenol Extraction

2.2.1. Preparation of Ethanolic Extracts (EE)

In 10 mL of pure ethanol, one gram of the plant’s powder was suspended. The suspension was stirred with a magnetic stirrer and kept at 4 °C in the dark for 24 h. On ashless filter paper, the mixture was then filtered. Finally, the extract was placed at 4 °C in the dark for future utilization.

2.2.2. Total Polyphenol Contents

Total polyphenols were assessed by Folin–Ciocalteu reagent in accordance with the Dewento method [22]. A total of 500 µL of distilled water was used to make the suspension and 125 microliters of Folin–Ciocalteu reagent to 125 microliters of EEs. After allowing the liquid to sit for 3 min, sodium carbonate (Na2CO3, 7%) was added to adjust the final volume to 3 milliliters. The suspension was then incubated at room temperature for 90 min in the dark. A UV/VIS spectrophotometer was used to measure the absorbance at 760 nm. (Cecil Aurius Series CE 2021, SelectScience, Bath, UK). The standard range is prepared with gallic acid. Total polyphenol contents are expressed as milligrams of gallic acid equivalent per gram of dry weight (mg GA/gDW).

2.2.3. Total Flavonoid Contents

The flavonoid contents were assessed as described by Dewento et al. [22] using sodium nitrite (NaNO2, 5%), aluminum chloride (AlCl3 6H2O, 10%) and sodium hydroxide (NaOH, 1 M). A UV/VIS spectrophotometer (Cecil Aurius Series CE 2021, SelectScience, Bath, UK) was used to measure the absorbance at 510 nm. Catechin was used to produce the standard range, which ranged from 50 to 500 mg/mL. The amount of flavonoids is measured in mg catechin equivalent per gram of dry weight (mg EC/g DW).

2.2.4. Condensed Tannin Content

Broadhurst and Jones’ [23] vanillin assay was used to determine tannin in plant EEs. Three mL of vanillin (4%) and then 1.5 mL of diluted EEs was added to 1.5 mL of pure sulfuric acid (H2SO4). The mixture was incubated for 15 min at room temperature after homogenization. At 500 nm, the absorbance was compared to a blank containing pure acetone [24]. Condensed tannin contents are determined by using a standard curve (0 to 500 µg/mL catechin). As for flavonoids, amounts of condensed tannins were determined in mg of catechin equivalent per gram of DW.

2.3. Antioxidant Activity Evaluation

2.3.1. Evaluation of the Total Antioxidant Activity (TAA)

The TAA of the studied plant extracts was estimated using the colorimetric assay at 695 nm using a visible–UV spectrophotometer (Cecil Aurius Series CE 2021) according to Prieto and Aguilar [25]. The TAA was expressed as mg GAE/g DW (milligrams of Gallic Acid equivalent per gram of dry weight).

2.3.2. DPPH Radical Scavenging Activity

Burits and Bucar [26] and Cuendet et al. [27] have used a spectrophotometric approach to measure the scavenging potential of the examined ethanolic extracts, which was based on the reduction a methanol solution of DPPH radical.
The inhibition capacity of the DPPH free radical (expressed in percent %) was estimated by the following equation:
IC   % = Ablank     Asample Ablank 100
where Ablank and Asample are the control and sample absorbances at 517 nm, respectively. The graph showing inhibition percentage versus extract concentration yielded the extract concentration that provided 50% inhibition (IC50).

2.3.3. Determination of the Ferric-Reducing Antioxidant Power (FRAP)

The method proposed by Oyaizu [28] was used to determine the reducing power. One mL of the extract at various concentrations (0.1 to 1.5 mg/mL) is mixed with 2.5 mL of phosphate buffer (0.2 mol/L, pH 6.6) and 2.5 mL of K3Fe(CN)6 (1%) in this technique. At 50 °C, the resultant mixture is incubated for 20 min. Following this incubation, 2.5 mL of TCA (10%) was added to stop the reaction, which was then centrifuged at 650× g for 10 min at room temperature. Finally, the supernatant is diluted with 2.5 mL distilled water and 0.5 mL FeCl3 (0.1%) (2.5 mL). At 700 nm, the absorbance is measured (the blank is the extraction buffer). Ascorbic acid or BHA (0.01–1 mg/mL) is used as a positive control. The data are given in effective concentration (EC50, g/mL), which is the extract concentration that corresponds to an absorbance of 0.5.

2.4. Antibacterial Activity Assessment

The antibacterial efficacies of the ethanolic extract of C. villosa, P. lentiscus, R. officinalis, E. multiflora, and P. latifolia were tested against microorganisms, including Gram-positive bacteria (Staphylococcus aureus ATCC 29213; Listeria monocytogenes ATCC 7644) and Gram-negative bacteria (Escherichia coli ATCC 8739; Salmonella typhimurium NCTC 6017). Bacterial Species were generously provided by the Biotechnology Center in Borj Cédria Technopole, Tunisia.
The antibacterial efficiency of tested ethanolic extracts was qualitatively and quantitatively evaluated.
The disc diffusion method was employed to assess the antibacterial potential of the extracts that were evaluated [29]. Fifteen µL of the EEs (Concentrations = MIC) were added to the sterile filter paper discs (6 mm diameter). Then, these discs were placed on the agar that had been previously inoculated with the selected bacteria. Gentamicin (10 µg/disc) was used as a positive control. Negative control corresponded to a disc without a sample (disc contains ethanol to determine the solvent activity). The culture plates were incubated for 24 h at room temperature (37 °C). The qualitative antibacterial activity of the tested extracts was determined by measuring the diameter of the inhibited growth zone (with the diameter of the 6 mm disc). Three repetitions were carried out for these experiments.
Secondly, the determination of the minimum inhibitory concentrations (MIC) and the minimum bactericidal concentrations (MBC) of tested ethanolic extracts presented the quantitative antibacterial activity and were estimated using the broth dilution method as described by Cosentino et al. [30]. Different concentrations of ethanolic plant extracts, ranging from 1.56 to 50 mg/mL, were prepared using the serial dilution technique, including a growth control and a sterility control.
After incubation at 37 °C for 24 h, Petri plates were inoculated with 10 µL of each dilution and incubated overnight at 37 °C. The growth of tested isolates (MIC) was determined by the lowest number of colonies formed in each bacterium at 37 °C overnight. The MBC refers to the minimum concentration of the extract at which isolates were killed completely. Experiments were performed at least in triplicates.

2.5. Mode of Action of Ethanolic Extract

The mode of action of the antibacterial activity of C. villosa, P. lentiscus, R. officinalis, E. multiflora, and P. latifolia EEs was assessed against Escherichia coli, Salmonella typhimurium, Listeria monocytogenes, and Staphylococcus aureus was investigated using different tests.

2.5.1. Time Kill Assay

Time-kill research evaluates the reduction in bacterial count in the presence of extracts at their MIC over several hours to characterize the antibacterial activity of the tested extract. Activities of tested products used were assessed by the determination of the reduction in the number of colony-forming units (CFUs) per mL over 0, 2, 4, and 24 h, as reported by Carson [31]. By graphing viable colony counts (CFU/mL) against time, the killing rate was calculated. Experiments were performed in triplicates.

2.5.2. Bacteriolysis

To evaluate the possible bacteriolytic action of tested plant extracts, absorbance at 620 nm was determined: an unlysed bacterium absorbs at 620 nm; thus, bacteriolysis may occur if the absorbance at 620 nm decreases over time [31].
Two bacterial colonies, obtained from an 18 h culture, were used to inoculate 400 mL of nutrient medium and incubated at 37 °C for 18 h under agitation. The bacteria were then separated from the culture medium by centrifugation at 10,000 rpm for 12 min at 4 °C. Sodium phosphate buffer (PBS) was used to wash the bacterial pellet (wash 2 times). The pellet was suspended in PBS-Tween 80 (0.01%, v/v). The bacterial culture was calibrated so that a 1/100 dilution’s optical density at 620 nm (OD620) was 0.310. At a concentration corresponding to each MIC, the EEs were incorporated into the bacterial suspension. The control suspension was mixed with PBS-T. A stirring with a Vortex mixer is carried out for the suspensions obtained for the 20 s. Samples (10 μL) were taken in duplicate at 0, 30, 60, 120 min, and 24 h, serially 10-fold diluted, and the OD620wasmeasuredimmediately).

2.5.3. Loss of Salt Tolerance

The ability of E. coli and S. aureus strains treated with the tested EEs to grow on nutrient agar (NA) supplemented with NaCl was studied according to the method previously described by Carson et al. [31]. Untreated bacterial suspensions were treated for 30 min with the EEs of C. villosa, P. lentiscus, R. officinalis, E. multiflora, and P. latifolia at at a concentration corresponding to each MIC was plated on NA containing NaCl at 0 to 50 g/L. After incubation at 37 °C for 24 h, colonies were counted. The number of CFUs per milliliter obtained on the nutrient agar with or without NaCl was compared, and the result was expressed in terms of percentage.

2.6. Statistical Analyses

Statistical analysis was conducted using SAS 9.4 (Texas A&M University, College Station, TX, USA) by analysis of variance (ANOVA) in addition to Pearson’s test for the evaluation of the significance of the difference between parameters. Data values were expressed as means ± standard deviation using Duncan multiple range tests at p < 0.05. For each measurement, at least three replicates were performed.

3. Results

3.1. Determination of Total Phenols, Flavonoids, and Tannin Contents

The total polyphenol, flavonoid, and tannin contents of the leaves revealed significant differences (p < 0.05) between ethanolic extracts (Figure 1). The results showed that P. lentiscus and R. officinalis were the richest species in phenolic compounds with values of 57.83 ± 3.58 and 64.16 ± 4.71 mg GAE/gDW, respectively (Figure 1A). In addition, the EEs of both species were also the richest in flavonoids compared to the other species studied. They had 8.36 ± 0.34 mg CE/gDW for P. lentiscus and 9.27 ± 0.50 mg CE/gDW for R. officinalis (Figure 1B). Thereby, tannins were less abundant than flavonoids in the leaves EEs of all species. The EE of P. lentiscus, E. multiflora, and C. villosa had the highest amounts of tannins, which are 17.36 ± 0.60, 25.82 ± 0.69, and 25.79 ± 3.01 of mg CE/gDW), respectively (Figure 1C).

3.2. Biological Activities

3.2.1. Determination of Antioxidant Activity

The antioxidant activity revealed significant differences (p < 0.05) between ethanolic extracts of the studied species. The total antioxidant capacity (TAC) was determined using the phosphomolybdenum method. The most important TAC was shown in C. villosa (15.33 ± 0.39 mg GAE/gDW) and P. latifolia (20.16 ± 0.32 mg GAE/gDW).
Indeed, in this part of the study, two tests were used: DPPH and FRAP. All the tests are based on electron or hydrogen transfer to assess the free radical scavenging activity. Results showed significant differences (p < 0.05) between ethanolic extracts (Table 1). Since IC50 is in inverse proportion to the antioxidant capacity to antioxidant capacity, the lowest IC50 value corresponds to the most potent antioxidant. Our results showed that the highest DPPH free radical reduction activity in EE species was detected for C. villosa, and the lowest were those corresponding to P. lentiscus and E. multiflora. Similarly, ferric reductase activity exhibited the same pattern compared to that of DPPH. P. lentiscus and E. multiflora showed the greatest ability to reduce ferric ions (Fe3+).

3.2.2. Determination of Minimum Inhibitory and Bactericidal Concentrations

The results of antibacterial activity, evaluated by the presence or absence of inhibition zones, MIC, and MBC values, illustrated important significant differences (p < 0.05) between ethanolic extracts (Table 2). The obtained results indicated that the studied EEs showed significant antibacterial activity with inhibition zones and MICs varying from 13 to 16 mm and 0.04 to 25 mg/mL, respectively. EE of P. lentiscus was most effective against Listeria monocytogenes with a MIC of 0.04 mg/mL. Nevertheless, E. multiflora presented the same antibacterial potential against S. aureus and E. coli, and the MIC was 0.04 mg/mL (Table 2). Moreover, Salmonella typhimurium was almost inhibited by the same MIC of all EEs (3.84 mg/mL).

3.2.3. Mode of Action of Ethanolic Extract
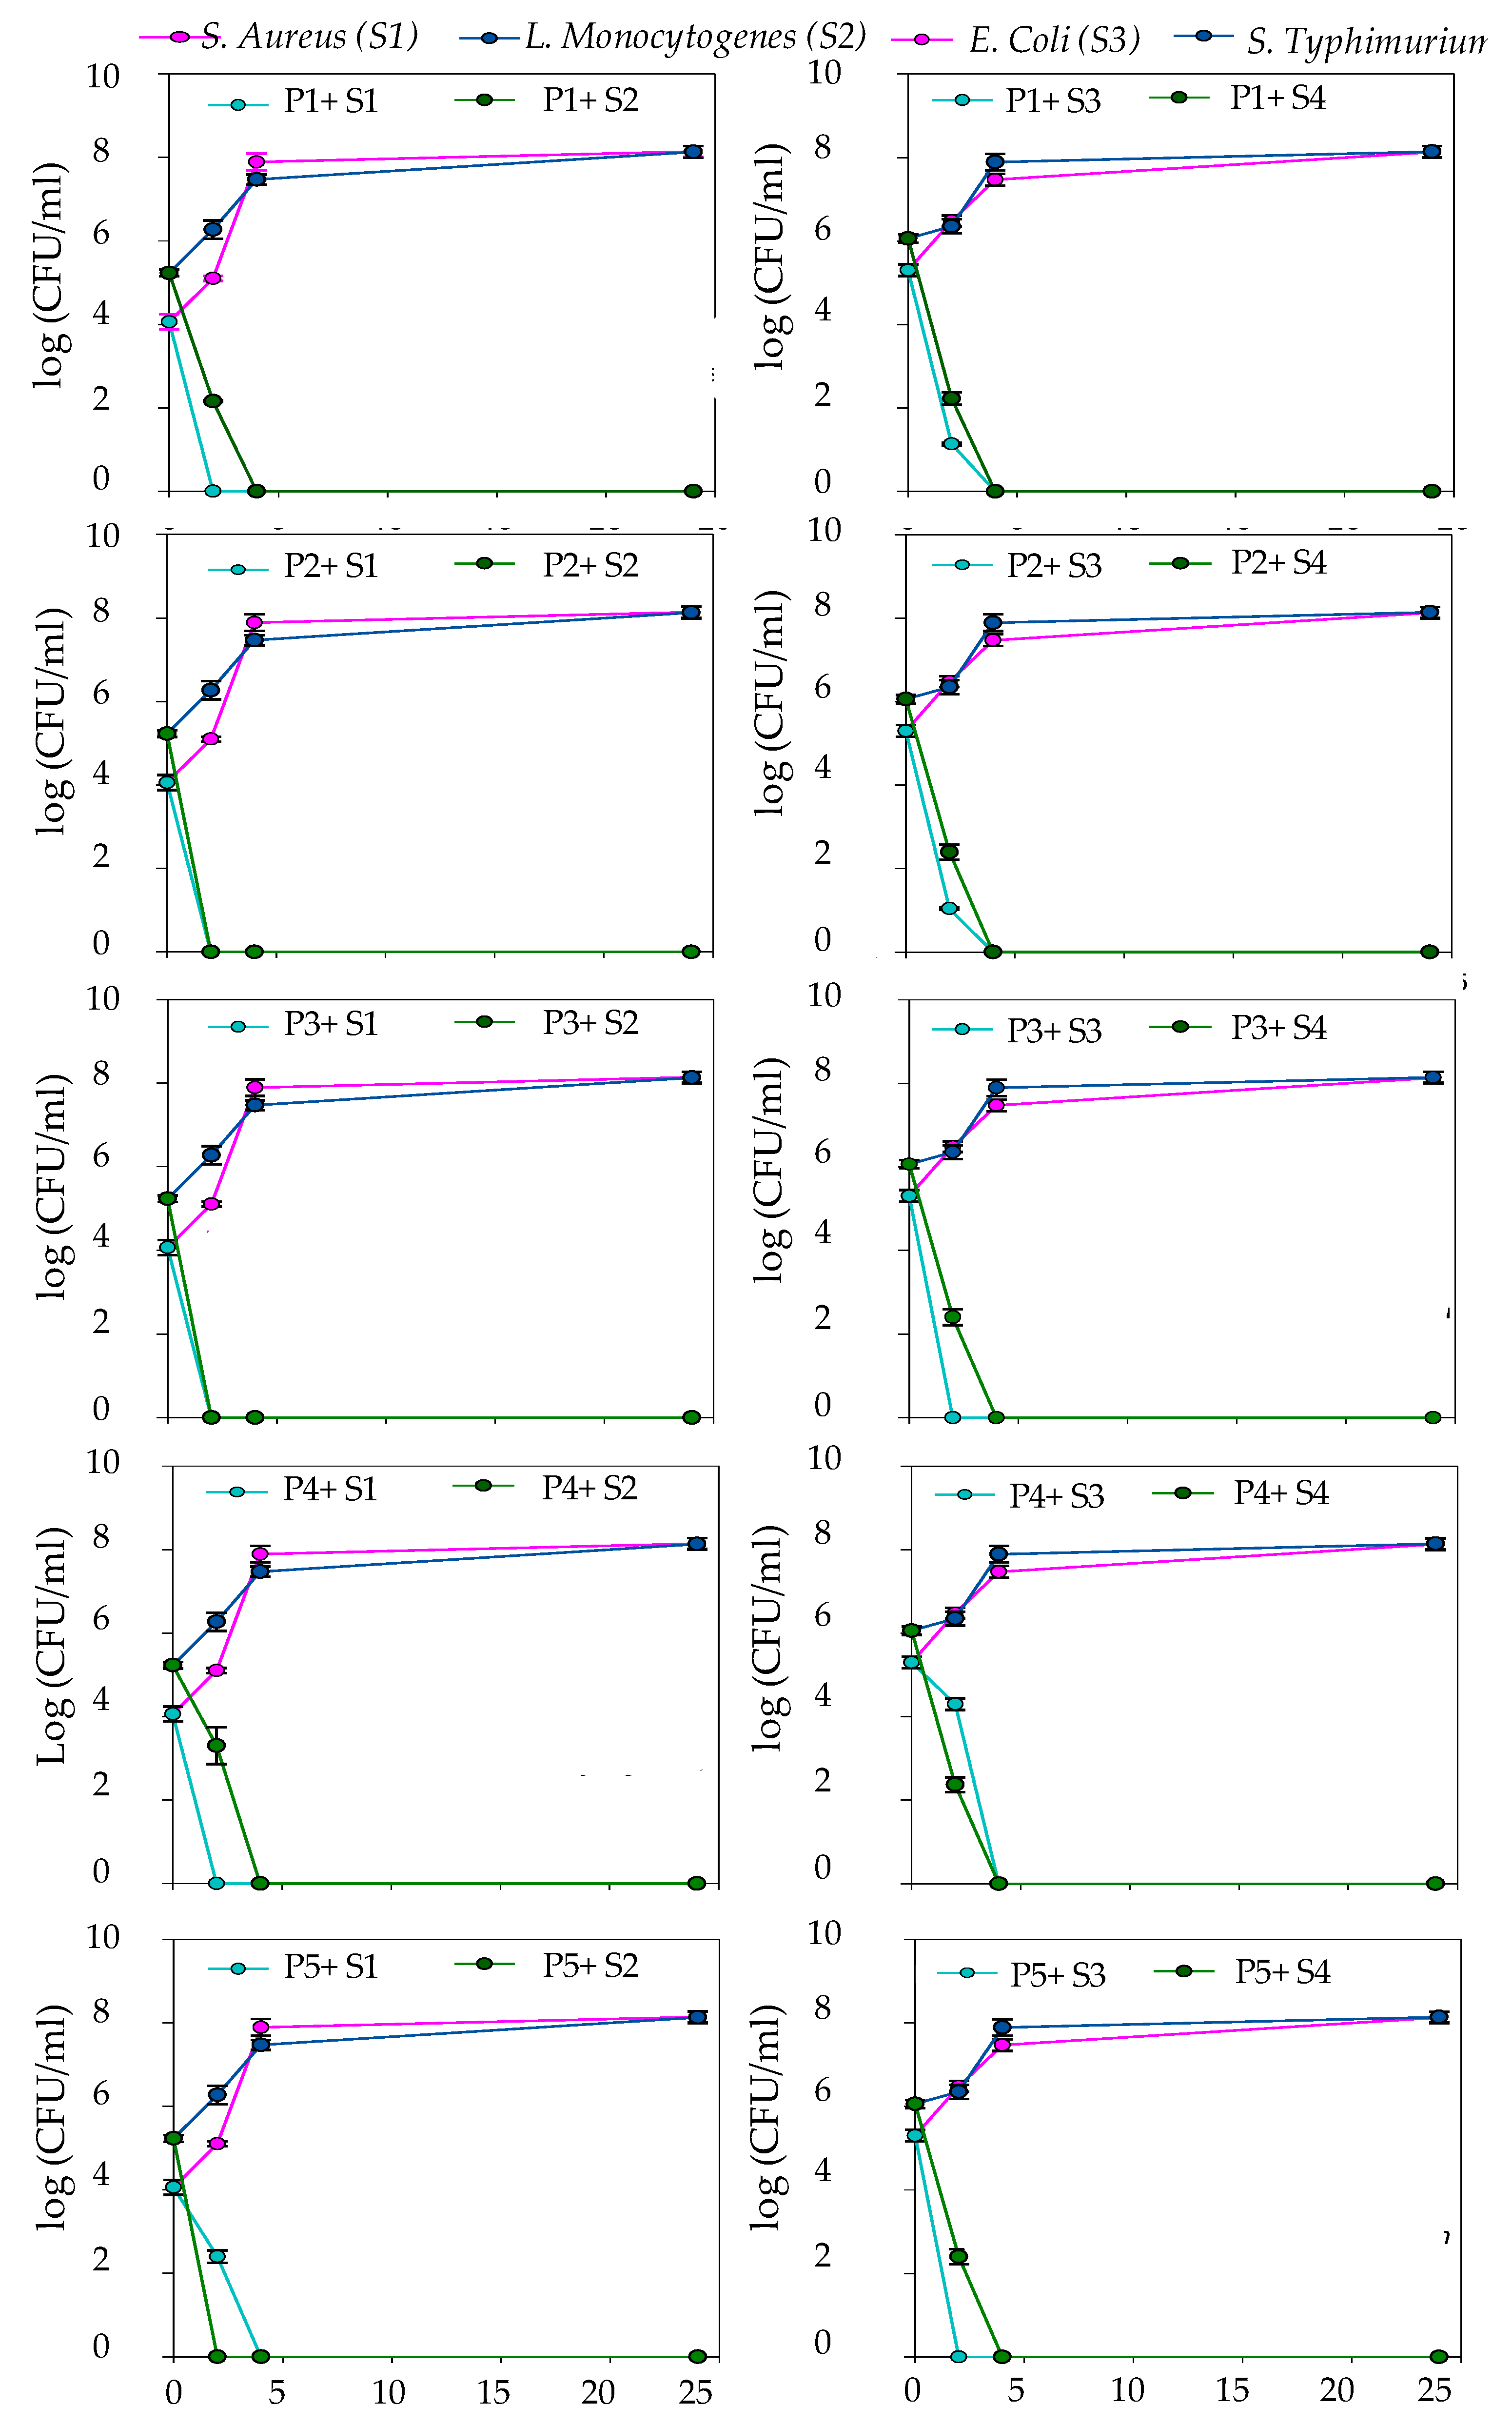
Time Kill Assays

The speed and duration of antibacterial property of ethanolic extracts of studied plants against tested strains posted a significant difference (p < 0.05). The studied strains were evaluated by analysis of lysis and kill time. Bacterial counts were plotted against time to obtain the kill time graph (Figure 2). Data were presented in terms of colony-forming units. This kill kinetics study was performed against the studied strains at a concentration equivalent to the MIC and for 24 h against the strains studied at a concentration equivalent to the MIC.
The control bacterial population exhibited a classic three-phase growth curve (growth, stationary, and decline). In the presence of each extract at a concentration corresponding to the MIC, the shape of the growth curve was inverted, and the three phases disappeared. This indicated the stop of growth of the four bacterial strains after 24 h incubation at 37 °C with the EEs at the MIC concentration.
The EE of C. villosa, P. lentiscus, R. officinalis, and E. multiflora caused the most significant decrease in the growth pattern of S. aureus within the first few minutes. Whereas the EEs of P. latifolia and E. multiflora produced a drop in the growth of E. coli at t = 2 h. Moreover, it was also observed that after exposure of the tested L. monocytogenes to the EE of E. multiflora, P. latifolia, and R. officinalis, the microorganisms showed lysis after 2 h.

Determination of the Lytic Action of Ethanolic Extracts

To determine the lytic action of C. villosa, P. lentiscus, R. officinalis, E. multiflora, and P. latifolia EEs on four bacterial species (S. aureus, L. monocytogenes, S. Typhimurium, and E. coli), the absorbance of the bacterial strains in the absence and presence of the extract at a concentration corresponding to MIC for 0, 60, 120 min, and 24 h were measured. The results revealed a significant difference (p < 0.05).
The obtained (Table 3) results indicated that in the case of the control (without extract), the absorbance of four bacterial strains was around 100%, signifying the absence of cell lysis. While the addition of extracts led to a diminution in the initial absorbance of all bacteria after 60 min of incubation. The EEs had lytic power against the strains. Indeed, optical density decreased after 2 h of incubation to ≈50 and 60% for all treated bacteria with EEs. Particularly, OD620s of treated suspensions were reduced to ≈25% with extracts of E. multiflora, P. lentiscus, and P. latifolia and to ≈35% with extracts of C. villosa and R. officinalis.

3.2.4. Loss of Salt Tolerance

The obtained results for the colony-forming capacity of E. coli, L. monocytogenes, S. typhimurium, and S. aureus in NA supplemented with 2.5% and 5% NaCl, respectively, after exposure to C. villosa, E. multiflora, P. lentiscus, R. officinalis, and P. latifolia EEs illustrated a significant difference (p < 0.05) (Table 4). Bacteria treated with ethanolic extracts of R. officinalis showed no bacterial growth in NA dishes supplemented with 2.5 and 5% NaCl. Indeed, E. coli treated with 5% NA and EEs of P. lentiscus, P. latifolia, and E. multiflora experienced a total growth arrest with cell death.

3.3. Bioactive Compounds Investigation by HPLC Analysis

In the literature, many compounds had been confirmed with reference standards in studied species using HPLC for its precision, versatility, and freedom from interferences [32]. According to HPLC data (Table 5), Turan and Mammadov [33] showed that vanillic acid, 4 hydroxybenzoic acid, and chlorogenic acid were the most important compounds in the extract of the C. villosa plant. Concerning Rosmarinus officinalis, previous research found that rosmarinic acid, carnosic acid, and chlorogenic acid were the principal compounds in the ethanolic extracts [12,34], while chlorogenic acid, 3,4,5 tri-O-galloyquinic acid, and rutin were the most abundant phenolic compounds in the ethanolic extract of Pistacia lentiscus in previous studies [10,11]. Erica multiflora was characterized by three major compounds, which were quercetin, rutin, and catechin [9]. The last plant was Phillyrea latifolia, which contained tyrosol, quercetin-7-O-rutinoside, and oleuropein [11].

4. Discussion

In this study, the secondary metabolites content (including total polyphenol, flavonoid, and tannin) of the EEs of five Tunisian plants—Pistacia lentiscus, Rosmarinus officinalis, Erica multiflora, Calicotome villosa, and Phillyrea latifolia were measured. Moreover, the antioxidant and antimicrobial activities of these five EEs were evaluated, and finally, the mechanisms of action were studied.
The studied plants were a great reservoir of phenolic compounds (Table 5). They were among the most versatile herbs that have been studied for their pharmacological and therapeutic effects. Tested plants were characterized by their high content of total polyphenols, tannins, and flavonoids [35]. The highest values of these biomolecules were demonstrated in P. lentiscus, followed by R. officinalis. However, E. multiflora and C. villosa showed the highest values of tannins. Similarly, previous research had found a similar richness in phenolic compounds [36,37,38]. Phenolic compounds are important biomolecules in plants due to their capacity to eliminate free radicals [39]. The most important total activity antioxidant was shown higher in C. villosa (15.33 ± 0.39 mg GAE/gDW) and P. latifolia (20.16 ± 0.32 mg GAE/gDW). Additionally, the antioxidant activities of the EEs of the studied plants were evaluated by two different assay methods, which were DPPH and FRAP assays. The EEs of P. lentiscus and E. multiflora showed the highest DPPH inhibition capacity. Similarly, the latter plants showed the highest iron-reducing capacity. These results were in accordance with previous data indicating a pronounced antioxidant effect of the studied plants [40]. This potentiality is mainly correlated with their richness in phenolic compounds known for their important reactivity as hydrogen or electron donors [41,42,43,44].
The antibacterial activity of EEs from the leaves of Rosmarinus officinalis, Erica multiflora, Pistacia lentiscus, Calicotome villosa, and Phillyrea latifolia was determined by measuring the zone of inhibition made against important pathogens (Escherichia coli, Salmonella typhimurium, Listeria monocytogenes and Staphylococcus aureus). The intensity of antibacterial activity was estimated by the double serial dilution method to determine the minimum inhibitory concentration (MIC) of the ethanolic extracts, whereas the bactericidal activity was determined by the in vitro killing time test, salt tolerance, and bacteriolysis.
The results demonstrated that EEs had good antibacterial activity at different concentrations against Gram-positive and Gram-negative bacteria (Table 2). The agar diffusion assay revealed that the bacteria were inhibited by the ethanolic extract to produce concentration-dependent zones of inhibition. At the MIC utilized, all bacteria strains were inhibited. The zones of inhibition produced by 0.04 to 3.84 mg/mL of EEs ranged from 13 mm to 16 mm for all bacteria. Among the plants that had a high degree of antibacterial activity (MIC = 0.04 mg/mL), the most important were P. lentiscus and E. multiflora. Concerning BMC, the values were the same or 2 to 4 times higher than the similar or 2 to 4 times higher than the MIC values of EEs. The variation between the activities of the EEs and the standard antimicrobial medicament may be attributed to the combinations of bioactive compounds that exist in the extract as compared to the pure compounds present in the standard antibiotics, which rarely have the same potency as the unrefined extract at comparable concentrations or doses of the active substance [45]. Previous studies had shown that Gram-positive bacterial strains were known to be more sensitive to plant extracts than Gram-negative bacterivores, which are more resistant [46,47,48]. This sensitivity is attributed to the availability of hydrophobic lipopolysaccharides in the outer membrane of Gram-negative bacteria. Thus, Gram-negative bacteria are more difficult to control due to their double-layered membrane [49]. Furthermore, our results highlight that the EEs were quite effective in controlling the bacteria compared to other previous studies [42,50]. None of our EEs demonstrated selective antimicrobial activity based on differences in bacterial cell walls.
Antimicrobial compounds in EEs of plants can inhibit bacterial growth through different mechanisms. Interactions with hydrophobic structures of bacterial strains had a key role in the antimicrobial actions of secondary plant metabolites [51,52]. In the present study, L. monocytogenes and E. coli cells were destroyed and killed in the stationary phase of growth (after 2 h) by P. latifolia, R. officinalis, and E. multiflora EEs, while C. villosa, E. multiflora, and P. lentiscus EEs inhibited the growth of S. aureus after 2 h. S. typhimurium was the only bacterium inhibited by all EEs after 4 h. In this growth phase, organisms are generally less susceptible to injury than those in the exponential phase [52]. Antimicrobial agents affecting cell synthesis processes often have little impact on organisms in the stationary phase of growth [53], and these results suggest that that the macromolecular synthesis process was not the primary target of EEs.
In recent years, several studies have attempted to identify and explain the mechanisms of action of certain medicinal plant extracts on pathogenic bacterial strains. The essential oils of rosewood, oregano, thyme [54], and tea tree [31] have been described as producing damage to the bacterial membrane and inducing cell lysis. Additionally, the essential oil of B. pandurata has been signaled to affect the membrane permeability of Escherichia coli [55]. In the present study, it was demonstrated that treatment of the studied bacterial cells with the studied plant EEs induced cell lysis. This possible mechanism of action may be related to the cell wall and membrane. Certain antimicrobial substances produce significant damage to the membrane and lead to lysis of the whole cell [31]. This phenomenon has been described previously for Jatropha curcas, oregano, and thyme EEs [54]. The inability of Pistacia lentiscus, Rosmarinus officinalis, Erica multiflora, Calicotome villosa, and Phillyrea latifolia or their components to lyse Escherichia coli, Salmonella typhimurium, Listeria monocytogenes, and Staphylococcus aureus cells suggested that cell wall destruction is not their principal mechanism of action. Treatment-induced release of autolytic enzymes from the membrane-bound cell wall eventually induces lysis [31], which may explain the delayed lysis of Escherichia coli, Salmonella typhimurium, Listeria monocytogenes, and Staphylococcus aureus noticed when suspensions were re-examined after several hours. In the same context, previous research had revealed that flavonoids could inhibit pathogen spore germination [56]; tannins are therefore likely to inhibit extracellular microbial enzymes, to derive the substrates necessary for microbial proliferation or to have a direct action on microbial metabolism by inhibiting oxidative phosphorylation [57]. The antimicrobial activity exhibited in our study could be due to the abundant content of phenolic compounds such as flavonoids and condensed tannins, known as antibacterial agents, in the EEs of the plants studied. In addition, the antibacterial activity of the studied plant extracts could be due to the existence of their major compounds (Table 5) or synergy between these compounds against various species of bacteria studied. Synergistic effects can be created if constituents of an extract affect different targets or have an interaction with each other to enhance the solubility and, thereby, the bioavailability of one or more constituents of an extract [58].
The results of the salt tolerance test showed that the strains could tolerate a high concentration of NaCl (5%). Escherichia coli, Salmonella typhimurium, Listeria monocytogenes and Staphylococcus aureus are halophilic bacteria tolerating hyperosmotic conditions by increasing solutes inside their cells such as betaine, glycine, ectoine, glutamate, proline, and trehalose [59]. The outer membrane determines the capacity of bacteria to have the ability to tolerate a particular change in a set of ionic media [60]. Tolerance to salts or other potentially toxic compounds induces membrane damage or weakening and leads to cell lysis by structural disruption, increased cell leakage [61,62], and loss of osmoregulation of bacterial cells to salts [63]. Treatment of strains studied with C. villosa and P. latifolia and their components substantially decreased the capacity of survivors to form colonies on media with NaCl. While treatment of strains with R. officinalis and its components completely inhibited the ability to develop colonies on NaCl-containing media.
The obtained results from this investigation suggested that the studied plant ethanolic extracts could be useful as naturally occurring bioactive compounds in food preservation and thus in order to inhibit or monitor the growth of spoilage and pathogenic microorganisms. In addition, we will continue on the same axis of research using clinical and veterinary strains.

5. Conclusions

P. lentiscus, R. officinalis, E. multiflora, C. villosa, and P. latifolia were considered important medicinal plants and were used to treat studied bacterial strains and to highlight the modes of action of their ethanolic extracts. Gathered results clearly showed that P. lentiscus and R. officinalis were the richest species in flavonoids and phenolic compounds. While the EEs of P. lentiscus, E. multiflora, and C. villosa had the greatest amounts of tannins. In addition, P. lentiscus and E. multiflora showed the highest FRAP and DPPH potentials. Then, the higher TAC was registered in Phillyrea latifolia and Calicotome villosa.
The studied EEs presented important antibacterial activities against Escherichia coli, Salmonella typhimurium, Listeria monocytogenes and Staphylococcus aureus strains. Among the plants that had a high degree of antibacterial activity were P. lentiscus and E. multiflora. From the kinetics of time-kill tests, we can conclude that our EEs are very efficient at inhibiting and killing bacterial strains with an average duration of 2 or 4 h. In addition, EEs have lytic power against strains. Bacteria organisms treated with EEs at MICs showed a loss of tolerance to salt. This has encouraged their utilization in alternative medicine for the treatment of infections and their potential application as antimicrobial and antioxidant agents. The antibacterial properties and capacity of these plant extracts can be exploited to treat infections as an alternative to conventional antibiotics.

Author Contributions

Methodology, M.B.J.; Project administration, M.B.; Supervision, K.M. and Z.N.; Writing—original draft, K.N.; Writing—review & editing, S.D. All authors have read and agreed to the published version of the manuscript.

Funding

This research received no external funding.

Informed Consent Statement

Not applicable.

Conflicts of Interest

The authors declare no conflict of interest.

References

  1. Parekh, J. In vitro screening of antibacterial activity of aqueous and alcoholic extracts of various Indian plant species against selected pathogens from Enterobacteriaceae. Afr. J. Microbiol. Res. 2007, 1, 92–99. [Google Scholar]
  2. Aulifa, D.L.; Fitriansyah, S.N.; Ardiansyah, S.A.; Wibowo, D.P.; Julata, Y.A.; Christy, D.S. Phytochemical screening, antibacterial activity, and mode of action on Morus nigra. Pharmacogn. J. 2018, 10, 167–171. [Google Scholar] [CrossRef] [Green Version]
  3. Saavedra-Leos, M.Z.; Leyva-Porras, C.; Toxqui-Terán, A.; Espinosa-Solis, V. Physicochemical Properties and Antioxidant Activity of Spray-Dry Broccoli (Brassica oleracea var Italica) Stalk and Floret Juice Powders. Molecules 2021, 26, 1973. [Google Scholar] [CrossRef] [PubMed]
  4. Gonelimali, F.D.; Lin, J.; Miao, W.; Xuan, J.; Charles, F.; Chen, M.; Hatab, S.R. Antimicrobial properties and mechanism of action of some plant extracts against food pathogens and spoilage microorganisms. Front. Microbiol. 2018, 9, 1639. [Google Scholar] [CrossRef]
  5. Adeniyi, A.; Asase, A.; Ekpe, P.K.; Asitoakor, B.K.; Adu-Gyamfi, A.; Avekor, P.Y. Ethnobotanical study of medicinal plants from Ghana; confirmation of ethnobotanical uses, and review of biological and toxicological studies on medicinal plants used in Apra Hills Sacred Grove. J. Herb. Med. 2018, 14, 76–87. [Google Scholar] [CrossRef]
  6. Perrino, E.; Tomaselli, V.; Costa, R.; Pavone, P. Conservation status of habitats (Directive 92/43 EEC) of coastal and low hill belts in a Mediterranean biodiversity hot spot (Gargano–Italy). Plant Biosyst.-Int. J. Deal. All Asp. Plant Biol. 2013, 147, 1006–1028. [Google Scholar] [CrossRef]
  7. Talib, W.H.; Mahasneh, A.M. Antimicrobial, cytotoxicity and phytochemical screening of Jordanian plants used in traditional medicine. Molecules 2010, 15, 1811–1824. [Google Scholar] [CrossRef] [Green Version]
  8. Elkhamlichi, A.; El Antri, A.; El Hajaji, H.; El Bali, B.; Oulyadi, H.; Lachkar, M. Phytochemical constituents from the seeds of Calycotome villosa subsp. intermedia. Arab. J. Chem. 2017, 10, S3580–S3583. [Google Scholar] [CrossRef] [Green Version]
  9. Fatma, G.; Sami, B.H.A.; Ahmed, L. Investigation of extracts from Tunisian ethnomedicinal plants as antioxidants, cytotoxins, and antimicrobials. Biomed. Environ. Sci. 2017, 30, 811–824. [Google Scholar]
  10. Romani, A.; Pinelli, P.; Galardi, C.; Mulinacci, N.; Tattini, M. Identification and quantification of galloyl derivatives, flavonoid glycosides and anthocyanins in leaves of Pistacia lentiscus L. Phytochem. Anal. Int. J. Plant Chem. Tech. 2002, 13, 79–86. [Google Scholar] [CrossRef]
  11. Azaizeh, H.; Halahleh, F.; Abbas, N.; Markovics, A.; Muklada, H.; Ungar, E.; Landau, S. Polyphenols from Pistacia lentiscus and Phillyrea latifolia impair the exsheathment of gastro-intestinal nematode larvae. Vet. Parasitol. 2013, 191, 44–50. [Google Scholar] [CrossRef]
  12. Amaral, G.P.; de Carvalho, N.R.; Barcelos, R.P.; Dobrachinski, F.; de Lima Portella, R.; da Silva, M.H.; Lugokenski, T.H.; Dias, G.R.M.; da Luz, S.C.A.; Boligon, A.A. Protective action of ethanolic extract of Rosmarinus officinalis L. in gastric ulcer prevention induced by ethanol in rats. Food Chem. Toxicol. 2013, 55, 48–55. [Google Scholar] [CrossRef]
  13. Khan, U.A.; Rahman, H.; Niaz, Z.; Qasim, M.; Khan, J.; Tayyaba; Rehman, B. Antibacterial activity of some medicinal plants against selected human pathogenic bacteria. Eur. J. Microbiol. Immunol. 2013, 3, 272–274. [Google Scholar] [CrossRef] [Green Version]
  14. Ekor, M. The growing use of herbal medicines: Issues relating to adverse reactions and challenges in monitoring safety. Front. Pharmacol. 2014, 4, 177. [Google Scholar] [CrossRef] [Green Version]
  15. Mohan, S.; Abdul, A.B.; Wahab, S.I.A.; Al-Zubairi, A.S.; Elhassan, M.M.; Yousif, M. Antibacterial and antioxidant activities of Typhonium flagelliforme (Lodd) Blume tuber. Am. J. Biochem. Biotechnol. 2008, 4, 402–407. [Google Scholar] [CrossRef] [Green Version]
  16. Nostro, A.; Germano, M.; D’angelo, V.; Marino, A.; Cannatelli, M. Extraction methods and bioautography for evaluation of medicinal plant antimicrobial activity. Lett. Appl. Microbiol. 2000, 30, 379–384. [Google Scholar] [CrossRef]
  17. Saritha, K.; Rajesh, A.; Manjulatha, K.; Setty, O.H.; Yenugu, S. Mechanism of antibacterial action of the alcoholic extracts of Hemidesmus indicus (L.) R. Br. ex Schult, Leucas aspera (Wild.), Plumbago zeylanica L., and Tridax procumbens (L.) R. Br. ex Schult. Front. Microbiol. 2015, 6, 577. [Google Scholar] [CrossRef] [Green Version]
  18. Sudipta, K.; Lokesh, P.; Rashmi, W.; Vijay, R.; Ssn, K.J. Phytochemical screening and in vitro antimicrobial activity of Bougainvillea spectabilis flower extracts. Int. J. Phytomed. 2012, 4, 375. [Google Scholar]
  19. Christaki, E.; Bonos, E.; Giannenas, I.; Florou-Paneri, P.J. Aromatic plants as a source of bioactive compounds. Agriculture 2012, 2, 228–243. [Google Scholar] [CrossRef] [Green Version]
  20. Trigui, M.; Hsouna, A.B.; Tounsi, S.; Jaoua, S. Chemical composition and evaluation of antioxidant and antimicrobial activities of Tunisian Thymelaea hirsuta with special reference to its mode of action. Ind. Crops Prod. 2013, 41, 150–157. [Google Scholar] [CrossRef]
  21. Tomlinson, S.; Palombo, E.A. Characterisation of antibacterial Australian medicinal plant extracts by investigation of the mechanism of action and the effect of interfering substances. J. Basic Microbiol. Int. J. Biochem. Physiol. Genet. Morphol. Ecol. Microorg. 2005, 45, 363–370. [Google Scholar] [CrossRef]
  22. Dewanto, V.; Wu, X.; Adom, K.K.; Liu, R.H. Thermal processing enhances the nutritional value of tomatoes by increasing total antioxidant activity. J. Agric. Chem. 2002, 50, 3010–3014. [Google Scholar] [CrossRef]
  23. Broadhurst, R.B.; Jones, W.T.J. Analysis of condensed tannins using acidified vanillin. J. Sci. Food 1978, 29, 788–794. [Google Scholar] [CrossRef]
  24. Sun, B.; Ricardo-da-Silva, J.M.; Spranger, I.J. Critical factors of vanillin assay for catechins and proanthocyanidins. J. Agric. Chem. 1998, 46, 4267–4274. [Google Scholar] [CrossRef]
  25. Prieto, P.; Pineda, M.; Aguilar, M.J. Spectrophotometric quantitation of antioxidant capacity through the formation of a phosphomolybdenum complex: Specific application to the determination of vitamin E. Anal. Biochem. 1999, 269, 337–341. [Google Scholar] [CrossRef]
  26. Burits, M.; Bucar, F.J. Antioxidant activity of Nigella sativa essential oil. Phytother. Res. 2000, 14, 323–328. [Google Scholar] [CrossRef]
  27. Cuendet, M.; Hostettmann, K.; Potterat, O.; Dyatmiko, W.J. Iridoid glucosides with free radical scavenging properties from Fagraea blumei. Helv. Chim. Acta 1997, 80, 1144–1152. [Google Scholar] [CrossRef]
  28. Oyaizu, M. Antioxidant activity of brewing products of glucosamine fractionated by organic solvents and their layer chromatography. Nippon. Skokulin Kogyo Gakkaishi 1988, 35, 771–775. [Google Scholar] [CrossRef]
  29. Shortridge, D.; Streit, J.M.; Mendes, R.; Castanheira, M.J. In Vitro Activity of Cefiderocol against US and European Gram-Negative Clinical Isolates Collected in 2020 as Part of the SENTRY Antimicrobial Surveillance Program. Microbiol. Spectr. 2022, 10, e02712-21. [Google Scholar] [CrossRef]
  30. Cosentino SC, I.G.; Tuberoso CI, G.; Pisano, B.; Satta, M.L.; Mascia, V.; Arzedi, E.; Palmas, F. In vitro antimicrobial activity and chemical composition of Sardinian thymus essential oils. Lett. Appl. Microbiol. 1999, 29, 130–135. [Google Scholar] [CrossRef]
  31. Carson, C.F.; Mee, B.J.; Riley, T.V. Mechanism of action of Melaleuca alternifolia (tea tree) oil on Staphylococcus aureus determined by time-kill, lysis, leakage, and salt tolerance assays and electron microscopy. Antimicrob. Agents 2002, 46, 1914–1920. [Google Scholar] [CrossRef] [PubMed] [Green Version]
  32. Escarpa, A.; González, M. Approach to the content of total extractable phenolic compounds from different food samples by comparison of chromatographic and spectrophotometric methods. Anal. Chim. Acta 2001, 427, 119–127. [Google Scholar]
  33. Turan, M.; Mammadov, R. Antioxidant, Cytotoxic, Larvicidal, and Anthelmintic Activity and Phytochemical Screening by HPLC of Calicotome villosa from Turkey. Pharm. Chem. J. 2020, 54, 478–483. [Google Scholar] [CrossRef]
  34. Cheung, S.; Tai, J. Anti-proliferative and antioxidant properties of rosemary Rosmarinus officinalis. Oncol. Rep. 2007, 17, 1525–1531. [Google Scholar] [CrossRef] [Green Version]
  35. Gu, C.; Howell, K.; Dunshea, F.R.; Suleria, H.A.J. Lc-esi-qtof/ms characterisation of phenolic acids and flavonoids in polyphenol-rich fruits and vegetables and their potential antioxidant activities. Antioxidants 2019, 8, 405. [Google Scholar] [CrossRef] [Green Version]
  36. Van Loy, M.D.; Riley, W.J.; Daisey, J.M.; Nazaroff, W.W.J.E.S. Dynamic behavior of semivolatile organic compounds in indoor air. 2. Nicotine and phenanthrene with carpet and wallboard. Environ. Sci. Technol. 2001, 35, 560–567. [Google Scholar] [CrossRef]
  37. Benhammou, N.; Bekkara, F.A.; Panovska, T.K.J. Antiradical capacity of the phenolic compounds of Pistacia lentiscus L. And Pistacia atlantica desf. Adv. Food Sci. 2007, 29, 155–161. [Google Scholar]
  38. Boughalleb, F.; Mahmoudi, M.; Abdellaoui, R.; Yahia, B.; Zaidi, S.; Nasri, N.J. Effect of long—Term storage on phenolic composition, antioxidant capacity, and protein profiles of Calicotome villosa subsp. intermedia seeds. J. Food Biochem. 2020, 44, e13093. [Google Scholar] [CrossRef]
  39. Mathew, S.; Abraham, T.E.; Zakaria, Z.A.J. Reactivity of phenolic compounds towards free radicals under in vitro conditions. J. Food Sci. Technol. 2015, 52, 5790–5798. [Google Scholar] [CrossRef] [Green Version]
  40. Fathollahi, M.; Aminzare, M.; Mohseni, M.; Hassanzadazar, H. Antioxidant capacity, antimicrobial activities and chemical composition of Pistacia atlantica subsp. kurdica essential oil. Vet. Res. Forum 2019, 10, 299–305. [Google Scholar]
  41. Pyo, Y.H.; Lee, T.C.; Logendra, L.; Rosen, R.T. Antioxidant activity and phenolic compounds of Swiss chard (Beta vulgaris subspecies cycla) extracts. Food Chem. 2004, 85, 19–26. [Google Scholar] [CrossRef]
  42. Mahmoudi, H.; Aouadhi, C.; Kaddour, R.; Gruber, M.; Zargouni, H.; Zaouali, W.; Ben Hamida, N.; Ben Nasri, M.; Ouerghi, Z.; Hosni, K. Comparison of antioxidant and antimicrobial activities of two cultivated Cistus species from Tunisia. Biosci. J. 2016, 32, 226–237. [Google Scholar] [CrossRef] [Green Version]
  43. Aryal, S.; Baniya, M.K.; Danekhu, K.; Kunwar, P.; Gurung, R.; Koirala, N. Total phenolic content, flavonoid content and antioxidant potential of wild vegetables from Western Nepal. Plants 2019, 8, 96. [Google Scholar] [CrossRef] [Green Version]
  44. Muflihah, Y.M.; Gollavelli, G.; Ling, Y.-C.J.A. Correlation Study of Antioxidant Activity with Phenolic and Flavonoid Compounds in 12 Indonesian Indigenous Herbs. Antioxidants 2021, 10, 1530. [Google Scholar] [CrossRef]
  45. Olajuyigbe, O.O.; Afolayan, A.J. In vitro antibacterial and time-kill assessment of crude methanolic stem bark extract of Acacia mearnsii De Wild against bacteria in shigellosis. Molecules 2012, 17, 2103–2118. [Google Scholar] [CrossRef]
  46. Burt, S. Essential oils: Their antibacterial properties and potential applications in foods—A review. Int. J. Food Microbiol. 2004, 94, 223–253. [Google Scholar] [CrossRef]
  47. Oonmetta-aree, J.; Suzuki, T.; Gasaluck, P.; Eumkeb, G. Antimicrobial properties and action of galangal (Alpinia galanga Linn.) on Staphylococcus aureus. LWT-Food Sci. 2006, 39, 1214–1220. [Google Scholar] [CrossRef]
  48. Kollef, M.H.; Golan, Y.; Micek, S.T.; Shorr, A.F.; Restrepo, M.I.J.C.i.d. Appraising contemporary strategies to combat multidrug resistant gram-negative bacterial infections–proceedings and data from the Gram-Negative Resistance Summit. Clin. Infect. Dis. 2011, 53, S33–S55. [Google Scholar] [CrossRef] [Green Version]
  49. Beveridge, T.J. Structures of gram-negative cell walls and their derived membrane vesicles. J. Bacteriol. 1999, 181, 4725–4733. [Google Scholar] [CrossRef] [Green Version]
  50. Mastino, P.M.; Marchetti, M.; Costa, J.; Juliano, C.; Usai, M. Analytical Profiling of Phenolic Compounds in Extracts of Three Cistus Species from Sardinia and Their Potential Antimicrobial and Antioxidant Activity. Chem. Biodivers. 2021, 18, e2100053. [Google Scholar] [CrossRef]
  51. Shimoda, M.; Ohki, K.; Shimamoto, Y.; Kohashi, O. Morphology of defensin-treated Staphylococcus aureus. Infect. Immun. 1995, 63, 2886–2891. [Google Scholar] [CrossRef] [Green Version]
  52. Riahi, L.; Elferchichi, M.; Ghazghazi, H.; Jebali, J.; Ziadi, S.; Aouadhi, C.; Chograni, H.; Zaouali, Y.; Zoghlami, N.; Mliki, A. Phytochemistry, antioxidant and antimicrobial activities of the essential oils of Mentha rotundifolia L. in Tunisia. Ind. Crops Prod. 2013, 49, 883–889. [Google Scholar] [CrossRef]
  53. Gilbert, P.; Collier, P.J.; Brown, M. Influence of growth rate on susceptibility to antimicrobial agents: Biofilms, cell cycle, dormancy, and stringent response. Antimicrob. Agents 1990, 34, 1865–1868. [Google Scholar] [CrossRef] [Green Version]
  54. Horne, D.; Holm, M.; Oberg, C.; Chao, S.; Young, D.G. Antimicrobial effects of essential oils on Streptococcus pneumoniae. J. Essent. Oil Res. 2001, 13, 387–392. [Google Scholar] [CrossRef]
  55. Jenie, B.S.L.; Priosoeryanto, B.P.; Syarief, R.; Rekso, G.T. Mode of action Temu kunci (Kaempferia pandurata) essential oil on E. coli K1. 1 cell determined by leakage of material cell and salt tolerance assays. HAYATI J. Biosci. 2008, 15, 56–60. [Google Scholar]
  56. Cushnie, T.T.; Lamb, A.J. Antimicrobial activity of flavonoids. Int. J. Antimicrob. Agents 2005, 26, 343–356. [Google Scholar] [CrossRef]
  57. Hamburger, M.; Hostettmann, K. 7. Bioactivity in plants: The link between phytochemistry and medicine. Phytochemistry 1991, 30, 3864–3874. [Google Scholar] [CrossRef]
  58. Wagner, H.; Ulrich-Merzenich, G. Synergy research: Approaching a new generation of phytopharmaceuticals. Phytomedicine 2009, 16, 97–110. [Google Scholar] [CrossRef]
  59. Ikeuchi, T.; Sisodia, S.S. The Notch ligands, Delta1 and Jagged2, are substrates for presenilin-dependent “γ-secretase” cleavage. J. Biol. Chem. 2003, 278, 7751–7754. [Google Scholar] [CrossRef] [Green Version]
  60. Brown, A.; Turner, H. Membrane stability and salt tolerance in gram-negative bacteria. Nature 1963, 199, 301–302. [Google Scholar] [CrossRef]
  61. Zhu, X.; Dong, N.; Wang, Z.; Ma, Z.; Zhang, L.; Ma, Q.; Shan, A. Design of imperfectly amphipathic α-helical antimicrobial peptides with enhanced cell selectivity. Acta Biomater. 2014, 10, 244–257. [Google Scholar] [CrossRef] [PubMed]
  62. Tariq, S.; Wani, S.; Rasool, W.; Shafi, K.; Bhat, M.A.; Prabhakar, A.; Shalla, A.H.; Rather, M.A. A comprehensive review of the antibacterial, antifungal and antiviral potential of essential oils and their chemical constituents against drug-resistant microbial pathogens. Microb. Pathog. 2019, 134, 103580. [Google Scholar] [CrossRef] [PubMed]
  63. Iandolo, J.J.; Ordal, Z.J. Repair of thermal injury of Staphylococcus aureus. J. Bacteriol. 1966, 91, 134–142. [Google Scholar] [CrossRef] [PubMed] [Green Version]
Figure 1. Total phenols (mg GAE/gDW; (A)), flavonoids (mg CE/gDW; (B)) and tannins (mg CE/gDW; (C)) content in P1 (Pistacia lentiscus), P2 (Rosmarinus officinalis), P3 (Erica multiflora), P4 (Calicotome villosa) and P5 (Phillyrea latifolia) ethanolic extracts. Means of three replicates are reported (±SD). Significant differences are detected in the bars (p < 0.05), Duncan’s test. The letters (a–e) denote significant (p < 0.05) difference between means.
Applsci 12 05038 g001
Figure 2. Time-kill curves of Gram-negative in the left (Escherichia coli (S2) and Salmonella typhimurium (S4)) and Gram-positive in the right (Listeria monocytogenes (S2) and Staphylococcus aureus (S1)) in control suspensions and the MICs of P1 (Pistacia lentiscus), P2 (Rosmarinus officinalis), P3 (Erica multiflora), P4 (Calicotome villosa) and P5 (Phillyrea latifolia) ethanolic extracts. The mean of the standard deviations for three replicates is indicated by symbols. The lower detection threshold was 0 CFU/mL.
Applsci 12 05038 g002
Table 1. Antioxidant activities of Pistacia lentiscus, Rosmarinus officinalis, Erica multiflora, Calicotome villosa, and Phillyrea latifolia ethanolic extracts.
TAC (GAE/gDW)DPPH (IC50 mg/mL)FRAP (EC50 mg/mL)
Pistacia lentiscus13.50 c ± 1.505.38 e ± 0.4413.39 e ± 1.29
Rosmarinus officinalis12.10 d ± 0.5312.25 c ± 0.2420.82 b ± 0.52
Erica multiflora13.45 c ± 2.4810.85 d ± 0.9917.89 d ± 0.66
Calicotome villosa15.33 b ± 0.3919.60 a ± 0.3924.2 a ± 0.11
Phillyrea latifolia20.16 a ± 0.3215.59 b ± 0.6619.35 c ± 0.26
TAC, DPPH, and FRAP values showed in this table were the mean of three replicates ± SD (n = 3). The values with different exponents in the same column (a–e) showed significant differences at p < 0.05.
Table 2. Qualitative and quantitative results (MIC and BMC) of the antibacterial effects of the EEs of Pistacia lentiscus, Rosmarinus officinalis, Erica multiflora, Calicotome villosa, and Phillyrea latifolia on the reference strains were assayed.
Inhibition Zone Diameter (mm)MIC (mg/mL)BMC (mg/mL)
EEGentamicin (10 mg/disc)
Staphylococcus aureus
Pistacia lentiscus15 c ± 0.824 a ± 0.11225
Rosmarinus officinalis14.5 ± 0.2 cd3.8412
Erica multiflora16 b ± 0.10.043.84
Calicotome villosa13 d ± 0.32525
Phillyrea latifolia16 b ± 0.53.8412
Escherichia coli
Pistacia lentiscus15 c ± 0.725 a ± 0.081225
Rosmarinus officinalis14 d ± 0.003.8412
Erica multiflora16 b ± 0.30.043.84
Calicotome villosa15 c ± 0.52525
Phillyrea latifolia13 e ± 0.53.8412
Listeria monocytogenes
Pistacia lentiscus13 d ± 0.425 a ± 0.10.043.84
Rosmarinus officinalis14 c ± 0.53.843.84
Erica multiflora15 b ± 0.13.843.84
Calicotome villosa14 c ± 0.33.8412
Phillyrea latifolia15 b ± 0.53.8412
Salmonella typhimurium
Pistacia lentiscus15 b ± 0.225 a ± 0.13.8412
Rosmarinus officinalis13 c ± 0.41225
Erica multiflora14 c ± 0.73.8412
Calicotome villosa14 c ± 0.23.8412
Phillyrea latifolia14 c ± 0.53.8412
The values of EE, Gentamicin, MIC, and BMC showed in this table were the mean of three replicates ± SD (n = 3). The values with different exponents in the same row (a–e) showed significant differences at p < 0.05.
Table 3. The proportion of initial OD620 of suspensions of Escherichia coli, Salmonella typhimurium, Listeria monocytogenes, and Staphylococcus aureus remaining after treatment with MICs of Pistacia lentiscus, Rosmarinus officinalis, Erica multiflora, Calicotome villosa, and Phillyrea latifolia ethanolic extracts for 60 min, 120 min, and 24 h.
Treatment Agents (MICs) and StrainsOD 620 at (T) min/OD 620 at 0 min (%)
ImmediatelyAfter 60 minAfter 120 minAfter 24 h
Control: S. aureus103.1 a ± 6.1794.7 a ± 4.2891.7 a ± 1.31102.5 a ± 4.23
Control: E. coli98.2 a ± 0.6699.1 a ± 0.0495.6 a ± 1.7098.4 a ± 0.78
Control: L. monocytogenes98.22 a ± 0.6699.21 a ± 0.898.35 a ± 0.9099.40 a ± 0.41
Control: S. typhimurium100.02 a ± 3.0199.01 a ± 1.0098.76 a ± 0.55101.02 a ± 3.46
P. lentiscus + S. aureus96.56 a ± 01.1383.49 b ± 0.9059.48 c ± 0.8225.21 d ± 1.75
P. lentiscus + E. coli98.43 a ± 0.5167.61 b ± 0.9051.03 c ± 1.0527.61 d ± 1.78
P. lentiscus + L. monocytogenes98.36 a ± 0.3966.59 b ± 0.9047.54 c ± 1.8822.87 d ± 2.13
P. lentiscus + S. typhimurium97.58 a ± 0.6470.21b ± 0.3356.31 c ± 1.0422.22 d ± 1.57
R. offinalis + S. aureus98.21 a ± 1.0167.10 b ± 0.0159.42 bc ± 0.7431.14 c ± 1.22
R. offinalis + E. coli98.77 a ± 0.6880.37 b ± 0.8549.17 c ± 1.5035.4 d ± 0.75
R. offinalis + L. monocytogenes98.43 a ± 0.7480.74 b ± 0.7050.52 c ± 0.0825.6 d ± 1.37
R. offinalis + S. typhimurium98.43 a ± 1.0573.25 b ± 2.2957.73 c ± 0.6335.10 d ± 0.78
E. multiflora + S. aureus97.49 a ± 0.1466.77 b ± 1.6757.98 c ± 2.2231.53 d ± 2.33
E. multiflora + E. coli97.96 a ± 0.5067.48 b ± 0.2253.54 c ± 2.8725.48 d ± 3.56
E. multiflora + L. monocytogenes97.63 a ± 0.3156.22 b ± 1.4955.55 b ± 1.0323.81 c ± 0.54
E. multiflora + S. typhimurium97.67 a ± 0.1863.99 b ± 0.6158.51 b ± 2.526.45 c ± 0.99
C. villosa + S. aureus97.55 a ± 0.4477.19 b ± 3.3454.04 c ± 1.1731.27 d ± 0.31
C. villosa + E. coli98.82 a ± 0.9167.32 b ± 1.8952.46 c ± 4.3430.26 d ± 0.94
C. villosa + L. monocytogenes98.43 a ± 0.5172.55 b ± 4.6151.49 c ± 0.9028.05 d ± 1.01
C. villosa + S. typhimurium97.55 a ± 1.5183.27 b ± 1.0758.89 c ± 0.6641.27 d ± 0.85
P. latifolia + S. aureus96.41 a ± 0.7282.70 b ± 5.1758.67 c ± 0.4826.00 d ± 2.16
P. latifolia + E. coli98.00 a ± 0.3961.00 b ± 6.2754.20 c ± 2.5024.92 d ± 5.73
P. latifolia + L. monocytogenes97.63 a ± 0.3165.09 b ± 0.3156.69 c ± 5.6327.75 d ± 0.48
P. latifolia + S. typhimurium97.26 a ± 0.8264.97 b ± 0.4255.88 c ± 1.1125.01 d ± 0.51
The values of OD620 at different times shown in this table were the mean of three replicates with mean standard ± SD (n = 3). Significant differences (p < 0.05) were indicated by the values with different exponents in the same line (a–d).
Table 4. Percentage of Escherichia coli, Salmonella typhimurium, Listeria monocytogenes, and Staphylococcus aureus cells that can develop colonies on NA, NA supplemented with 2.5% and 5% of NaCl after 30 min of treatment with MICs of Pistacia lentiscus, Rosmarinus officinalis, Erica multiflora, Calicotome villosa, and Phillyrea latifolia EEs.
Growth of Strains (%)
ControlP. lentiscusR. offinalisE. mutifloraC. villosaP. latifolia
Strains2.552.552.552.552.552.55
S. aureus100 a100 a0.24 b0.06 d0.22 b00.23 b00.25 b0.14 c0.23 b0.18 b
E. coli100 a100 a0.11 c00.23 b00.23 b00.25 b0.1 b0.23 b0
L. monocytogenes100 a100 a0.13 c0.03 cd0.17 bc00.14 c0.06 b0.13 c0.04 c0.22 b0.04 c
S. typhimurium100 a100 a0.22 b0.06 d0.10 d0.08 d0.13 c0.08 d0.25 b0.19 b0.19 b0.10 c
The values of percentage growth of strains shown in this table were the mean of three replicates and were given as the mean ± SD (n = 3). Significant differences (p < 0.05) were indicated by the values with different exponents in the same line (a–d).
Table 5. Phenolics composition of ethanolic extract of studied species. Results are reported as the mean ± standard deviations (SD) of three measurements.
SpeciesMajor CompoundConcentrations (mg/g)References
Pistacia lentiscusChlorogenic acid17.4 ± 1.9[10,11]
3,4,5 Tri-O-galloyquinic acid15.9 ± 0.2
Rutin13.6 ± 1.5
Phillyrea latifoliaTyrosol78.2 ± 18.4[11]
Quercetin-7-O-rutinoside42.5 ± 5.1
Oleuropein167.0 ± 7.7
Erica multifloraQuercetin43.57 ± 0.18[9]
Rutin42.05 ± 2.67
Catechin27.29 ± 2.73
Rosmarinus officinalisRosmarinic acid 38.5 ± 0.04[12,34]
Carnosic acid 26.4 ± 0.15
Chlorogenic acid 11.2 ± 0.17
Calicotome villosavanillic acid1.4[33]
4-hydroxybenzoic acid0.39
chlorogenic acid0.39
Publisher’s Note: MDPI stays neutral with regard to jurisdictional claims in published maps and institutional affiliations.

