Article

Spectroscopic Approach for the On-Line Monitoring of Welding of Tanker Trucks

by
Jose J. Valdiande
1,*,
Luis Rodriguez-Cobo
2,
Adolfo Cobo
1,2,3,
José Miguel Lopez-Higuera
1,2,3 and
Jesús Mirapeix
1,2,3
1
Grupo de Ingeniería Fotónica, Universidad de Cantabria, Avda. Los Castros, s/n, 39005 Santander, Spain
2
Centro de Investigación Biomédica en Red-Bioingeniería, Biomateriales y Nanomedicina (CIBER-BBN), Instituto de Salud Carlos III, 28029 Madrid, Spain
3
Instituto de Investigación Sanitaria Valdecilla (IDIVAL), 39011 Santander, Spain
*
Author to whom correspondence should be addressed.
Appl. Sci. 2022, 12(10), 5022; https://doi.org/10.3390/app12105022
Submission received: 12 April 2022 / Revised: 4 May 2022 / Accepted: 13 May 2022 / Published: 16 May 2022

Abstract

:
The appearance of defects during the manufacture of tanker trucks via arc-welding is a significant problem in the industry. A reliable low-cost and non-destructive on-line method could aid the discovery of solutions to overcome productivity problems. Plasma optical spectroscopy was employed in this study to correlate the presence of several elemental emission lines with certain quality-related events, such as the appearance of porosities. Results obtained through field trials and also during in-line production show that the convenient processing of acquired process signals facilitates not only the detection of defects, but also the identification of their causes. Output monitoring signals have been compared with X-ray inspections of the seam welds performed. It has been demonstrated that the spectroscopic monitoring variables obtained are good indicators for evaluating contamination in the process and therefore the occurrence of welding defects.

1. Introduction

Although welding processes play a major role in several different industrial settings, from aeronautics to the automotive industries and in nuclear and energy sectors, the assurance of welding quality is still a problem to be solved in many cases where quality standards are especially demanding. In such settings, the appearance of defects due to the inherent complexity of the physics involved or subtle variations in the various input parameters or even in the ambient conditions (temperature, humidity) may affect the whole process. Traditionally, non-destructive techniques, such as ultrasound, magnetic particles or X-rays, have been employed to analyse the quality of welding seams, but it is obvious that the use of such techniques implies serious costs in terms of time expenditures and effects on productivity. It should be noted that these techniques are employed off-line, once the seams have been performed and, consequently, this limits the possible corrective actions that can be taken.
Within this context, a reliable on-line welding monitoring system able to provide information in real-time would be extremely valuable: such a system would not only allow the acquisition of information about the relevant process in situ, it could also be used to design strategies to reduce the appearance of defects or at least enable on-line repair or the discarding of defective seams.
In recent years, different techniques have been explored to find reliable on-line welding monitoring systems for specific welding processes, such as arc, laser, plasma and even electron-beam welding. Machine vision solutions have been proposed [1], for example, with illumination via lasers and subsequent filtering [2] or by applying fractal theory and the wavelet transform method to images acquired in friction stir welding [3], as well as infrared thermography for surface temperature monitoring in laser welding [4] and the estimation of heat inputs [5] or molten pool temperatures in arc welding processes [6]. Acoustic-based monitoring [7] or even monitoring via FBGs (fiber Bragg grating sensors) glued to welding plates or in a non-contact configuration [8] have also been studied. Different sensor fusion approaches can also be found in the literature, for example, using IR, UV and acoustic sensors [9] or by analysing spectral, acoustic and electric signals in the process [10]. Plasma optical spectroscopy has also attracted attention in this field, as this technique allows powerful study of a process via analysis of the different atomic species participating in the plasma. It has been demonstrated that the processing of some spectral information, mainly provided by certain specific emission lines, is able to generate spectroscopic monitoring parameters that exhibit significant correlations with quality-related events in the seams [11,12].
In particular, argon emission lines have been typically employed in the literature, as they are commonly found in spectra associated with those processes that require a shielding/protection gas. In terms of studying the performance of different species in monitoring, Ancona et al. [11] studied plasma electronic temperature (Te) results calculated for species such as Mn I, Cr I and Fe I, although no clear differences were observed between them. Sibillano et al. [12] used the covariance mapping technique (CMT) to obtain a covariance map to discriminate between optimal and defective conditions using species such as Al II, Mg II and O II. Studies have also been performed using algorithms to automatically select the most discriminant spectral bands in terms of defect detection [13], and LIBS (laser-induced breakdown spectroscopy) has been suggested as a suitable technique for on- and off-line monitoring of welding [14,15] and additive manufacturing [16]. Recently, the analysis of hydrogen lines in the welding of aluminium alloys has been proposed in an attempt to establish a correlation with the appearance of porosities [17].
The process under analysis in this paper also involves arc-welding of aluminium/magnesium alloys, in the manufacture of tanker trucks. Contamination via hydrogen plays a major role in this process [18] and a spectroscopic approach is proposed in this work to detect and avoid this issue and other possible defects, along with the acquisition of information about process parameters in addition to welding plasma spectra, such as welding voltage and current, protection gas flow rate, process speed (and position), wire feed speed, ambient temperature and humidity.
The novelty of this proposal has various aspects. On the one hand, it will be shown that not only hydrogen but also other elements such as sodium seem to be well correlated with the appearance of porosities. In fact, some results suggest the necessity of distinguishing between continuous porosities over a significative length of a seam and punctual porosities, probably generated by different mechanisms. On the other hand, not only welding trials but results obtained during production are presented in this paper. Welding experiments in which artificial defects are provoked are commonly used to verify the proposed solutions, such as variations in the welding current or gas flow rate [19] or pre-processing of the weld plates to simulate porosities [17]. However, these perturbations are commonly quite unlike those produced in real production scenarios, and the conclusions derived from them cannot always be extrapolated to the relevant target processes. Finally, it will be discussed how the implemented monitoring system might prove useful not only in the detection of possible defects but also in indicating their causes.

2. Materials and Methods

Taking into account the specific requirements of the process under analysis, a customised monitoring system was designed and developed to perform a suitable on-line monitoring of welding quality in the production line operating in the facilities of Talleres Cobo. All the data obtained by the sensors were captured by a computer running custom-developed software that stores data in a binary format with associated timestamps for each capture.
The main sensor of the system is based on plasma optical spectroscopy and is complemented with traditional sensors to monitor the electrical, mechanical or environmental parameters of the process. Figure 1 is a scheme of the monitoring system, including the plasma optical spectroscopy-based system, as well as the welding voltage and current (closed loop Hall effect), wire feed speed (encoder-based, 800 pulses per revolution), protection gas flow rate (with temperature compensation), welding speed and position (encoder-based, 800 pulses per revolution) and ambient temperature and humidity sensors. The welding process has been illustrated in Figure 2.
The MIG (Metal Inert Gas) process has been designed to join sheets of aluminium alloys, in particular, AA5186 (H111), which contains a high level of magnesium. Table 1 shows the chemical composition of this material. This composition has been directly obtained from a certificate provided by the manufacturer of the alloys (Hydro).
The main information for the on-line monitoring system was obtained via welding plasma optical radiation, which is captured by means of an optical fiber (Ocean Optics silica, 400 µm core diameter) like the one depicted in Figure 2a. It is worth mentioning that in this case there were no input optics attached at the end of the fiber, i.e., the plasma radiation was directly acquired by the optical fiber and delivered to a CCD spectrometer located within the monitoring system’s control unit. Although the numerical aperture of the chosen optical fiber limits the field of view, the plasma radiation captured by the spectrometer is sufficient for the performance of a suitable spectroscopic analysis. The spectroscopic studies were carried out with a low-cost spectrometer (Ocean Optics STS-VIS) with an optical resolution of 1.5 nm and a spectral range of 340 to 820 nm. An initial characterization of the optical response of the setup was performed, allowing an equalization of the spectra, thus avoiding the effects of the different attenuations of the optical fiber at different wavelengths, for example. The spectrometer was configured with an integration time of 42 ms. Given a welding speed of 400 mm/min, we obtained a spatial resolution of 0.28 mm for the analysis.
The use of plasma optical spectroscopy for welding diagnostics is based on the correlation that exists between certain spectroscopic parameters and the quality of the associated seams. The profiles associated with these parameters tend to exhibit clear perturbations associated with specific defects, such as crater formation [11], lack of penetration [19], metallic inclusions [20] or porosities [21]. They may also be used to detect the operational mode (conduction/keyhole) of a laser welding process [22].
Plasma electronic temperature (Te) has been used in this way by several authors, such as Ferrara et al. [23] and Sforza et al. [24]. Apart from this spectroscopic parameter, other approaches based on plasma RMS signals [25] or color temperature [26], which avoids the necessity of identifying emission lines, have also been proposed.
The plasma RMS signal of a given spectrum is given by the following equation:
S R M S = 1 n i = 0 n 1 x i 2
where n is the number of pixels of the spectrometer CCD and xi is the intensity associated with the ith pixel. It is worth mentioning that the value derived from Equation (1) is directly related to the total arc power and, consequently, to the process heat input.
The color temperature of a light source can be defined as the temperature associated with a blackbody (Planckian radiator) that emits radiation of the same chromaticity. The estimation of this parameter can be performed using the Robertson’s method [27]. Yu et al. also studied the use of the ratio between the intensities of lines belonging to different elements [17].
In this study, we analysed the performance of different parameters in terms of their correlation with the quality of the seams under analysis. On the one hand, field trials were designed in an attempt to simulate several defects by introducing perturbations during the process, such as modifying the welding current, the process or wire feed speed or the gas flow rate, or by adding water or oil to the joint (top and bottom). On the other hand, the monitoring system has also been used during production in an attempt to evaluate a real production scenario. The results derived from the designed monitoring system and their evaluation against X-ray inspection of the seams will be discussed in the following section. It should be mentioned that the X-ray inspection was independently carried out by the company responsible for the quality assurance of the parts manufactured in the factory, END RECOORD. The procedure used is as follows: after an initial visual inspection, the radiographic inspection (X-ray radiography) takes place in a bunker within the factory, thus enabling a continuous workflow, and the quality of the welded joints is evaluated so as to detect internal defects that are transcribed to an inspection sheet. These inspection sheets enabled the evaluation of the monitoring system, as is discussed in the following sections.

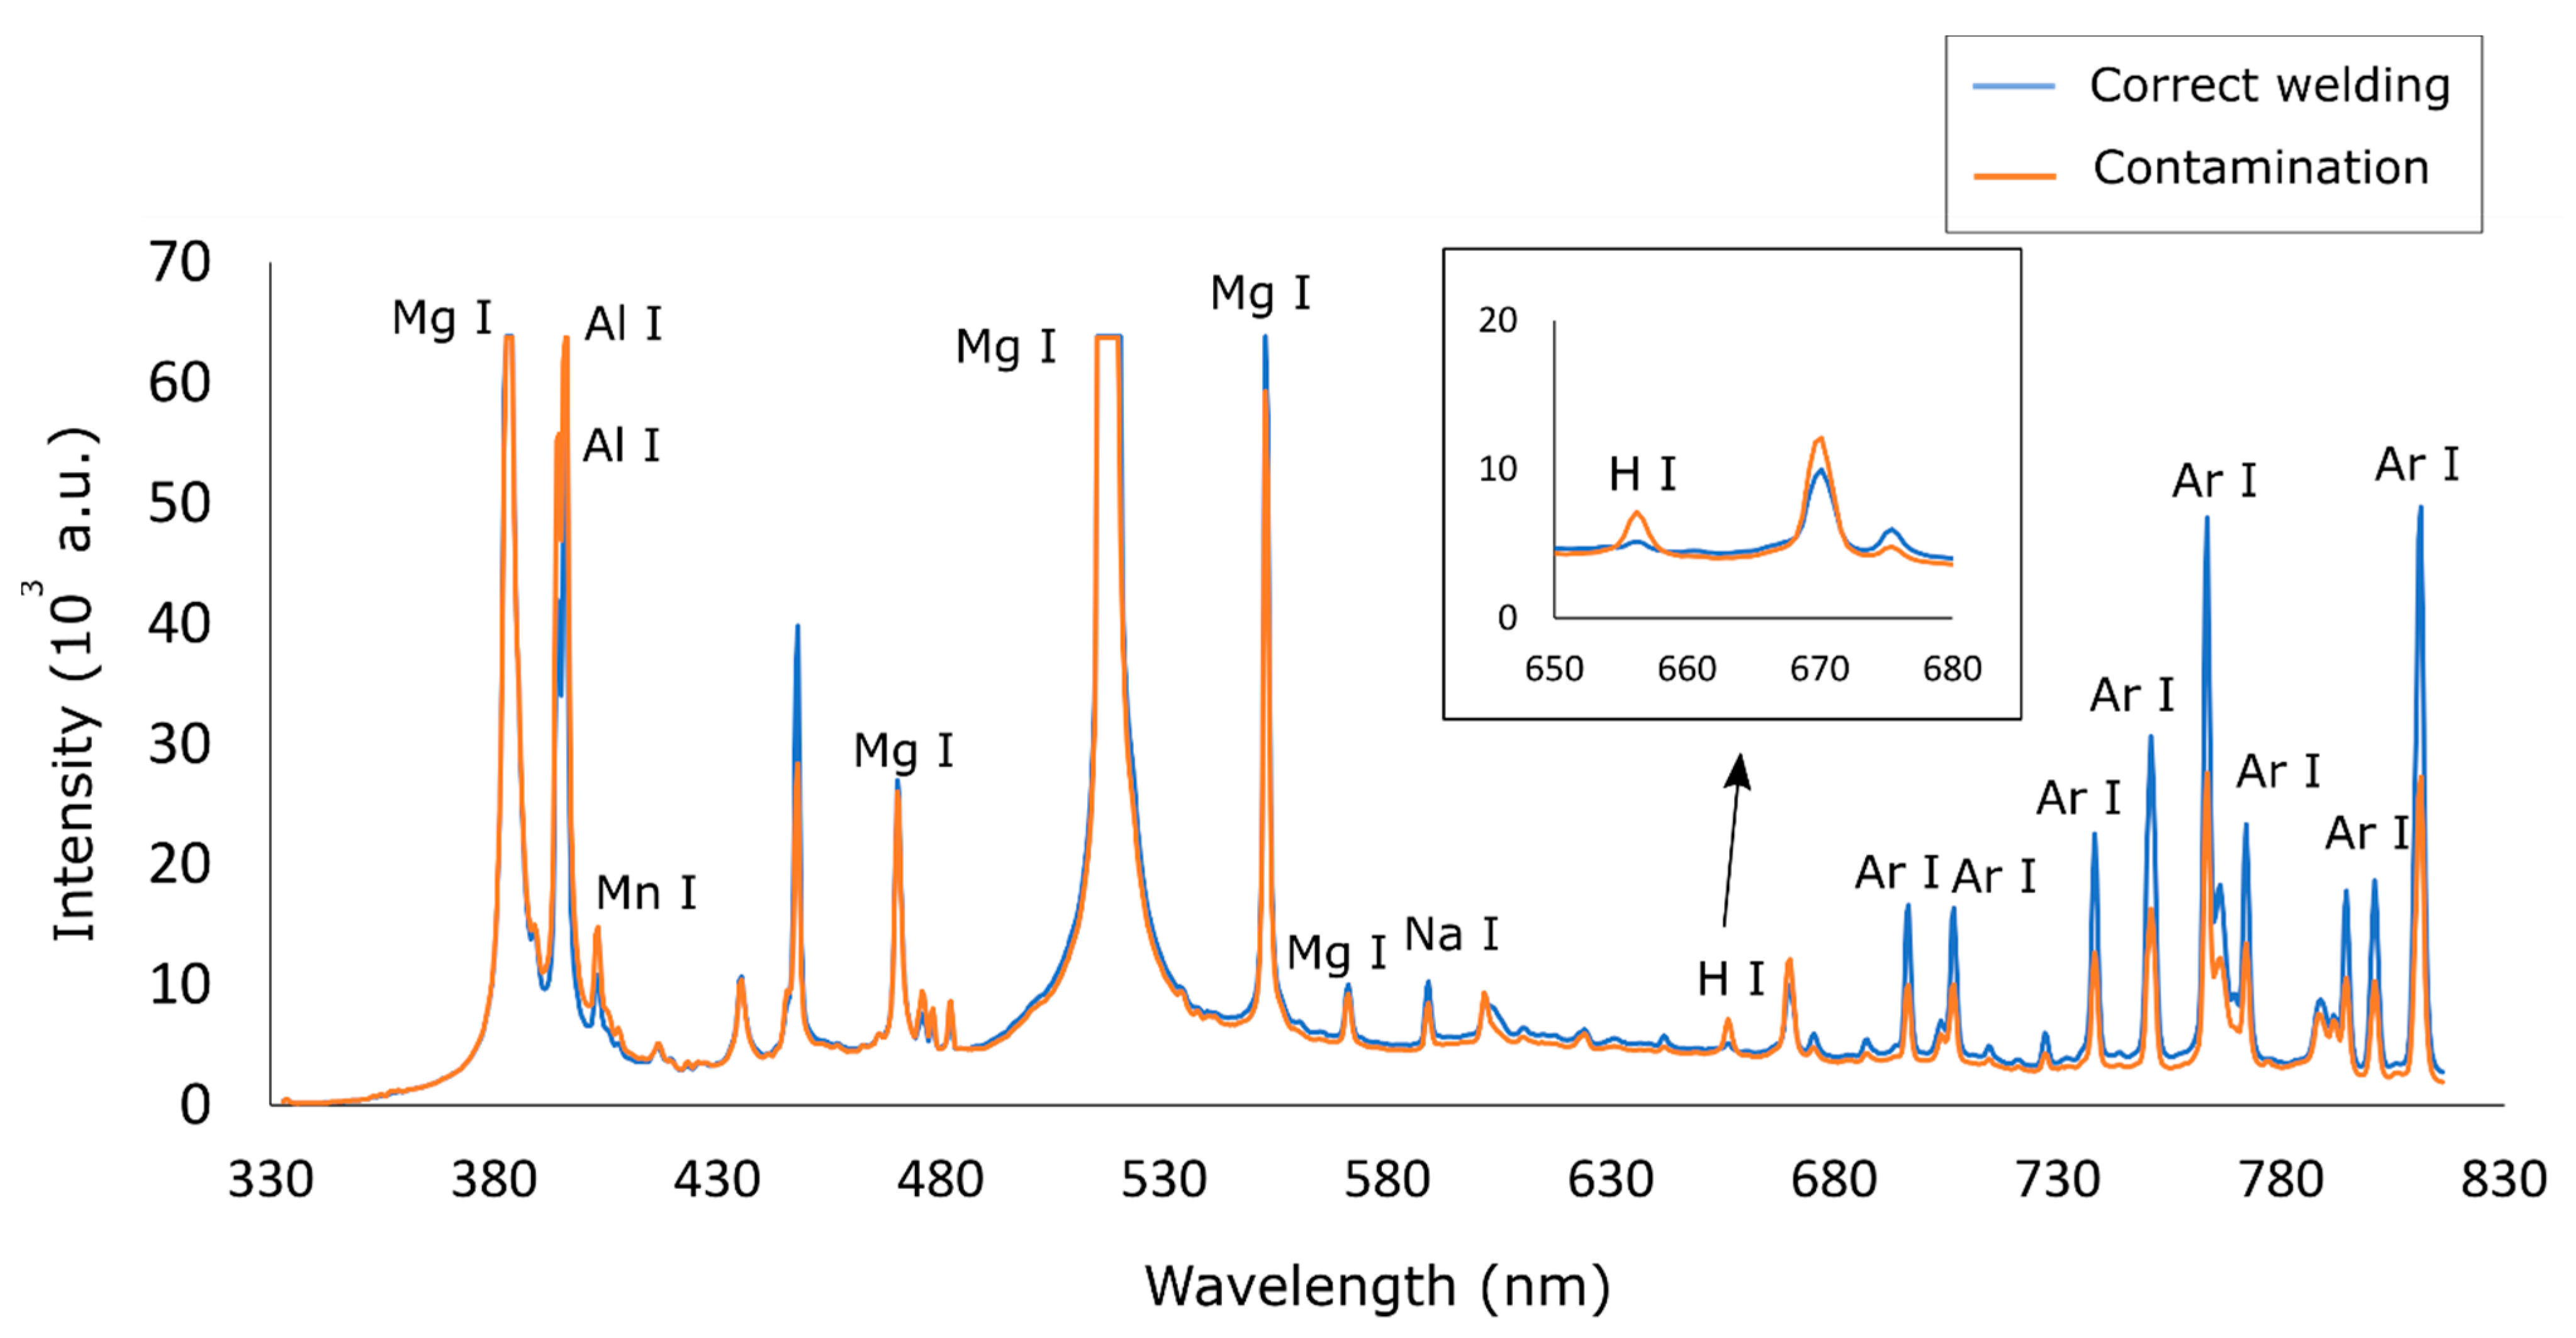
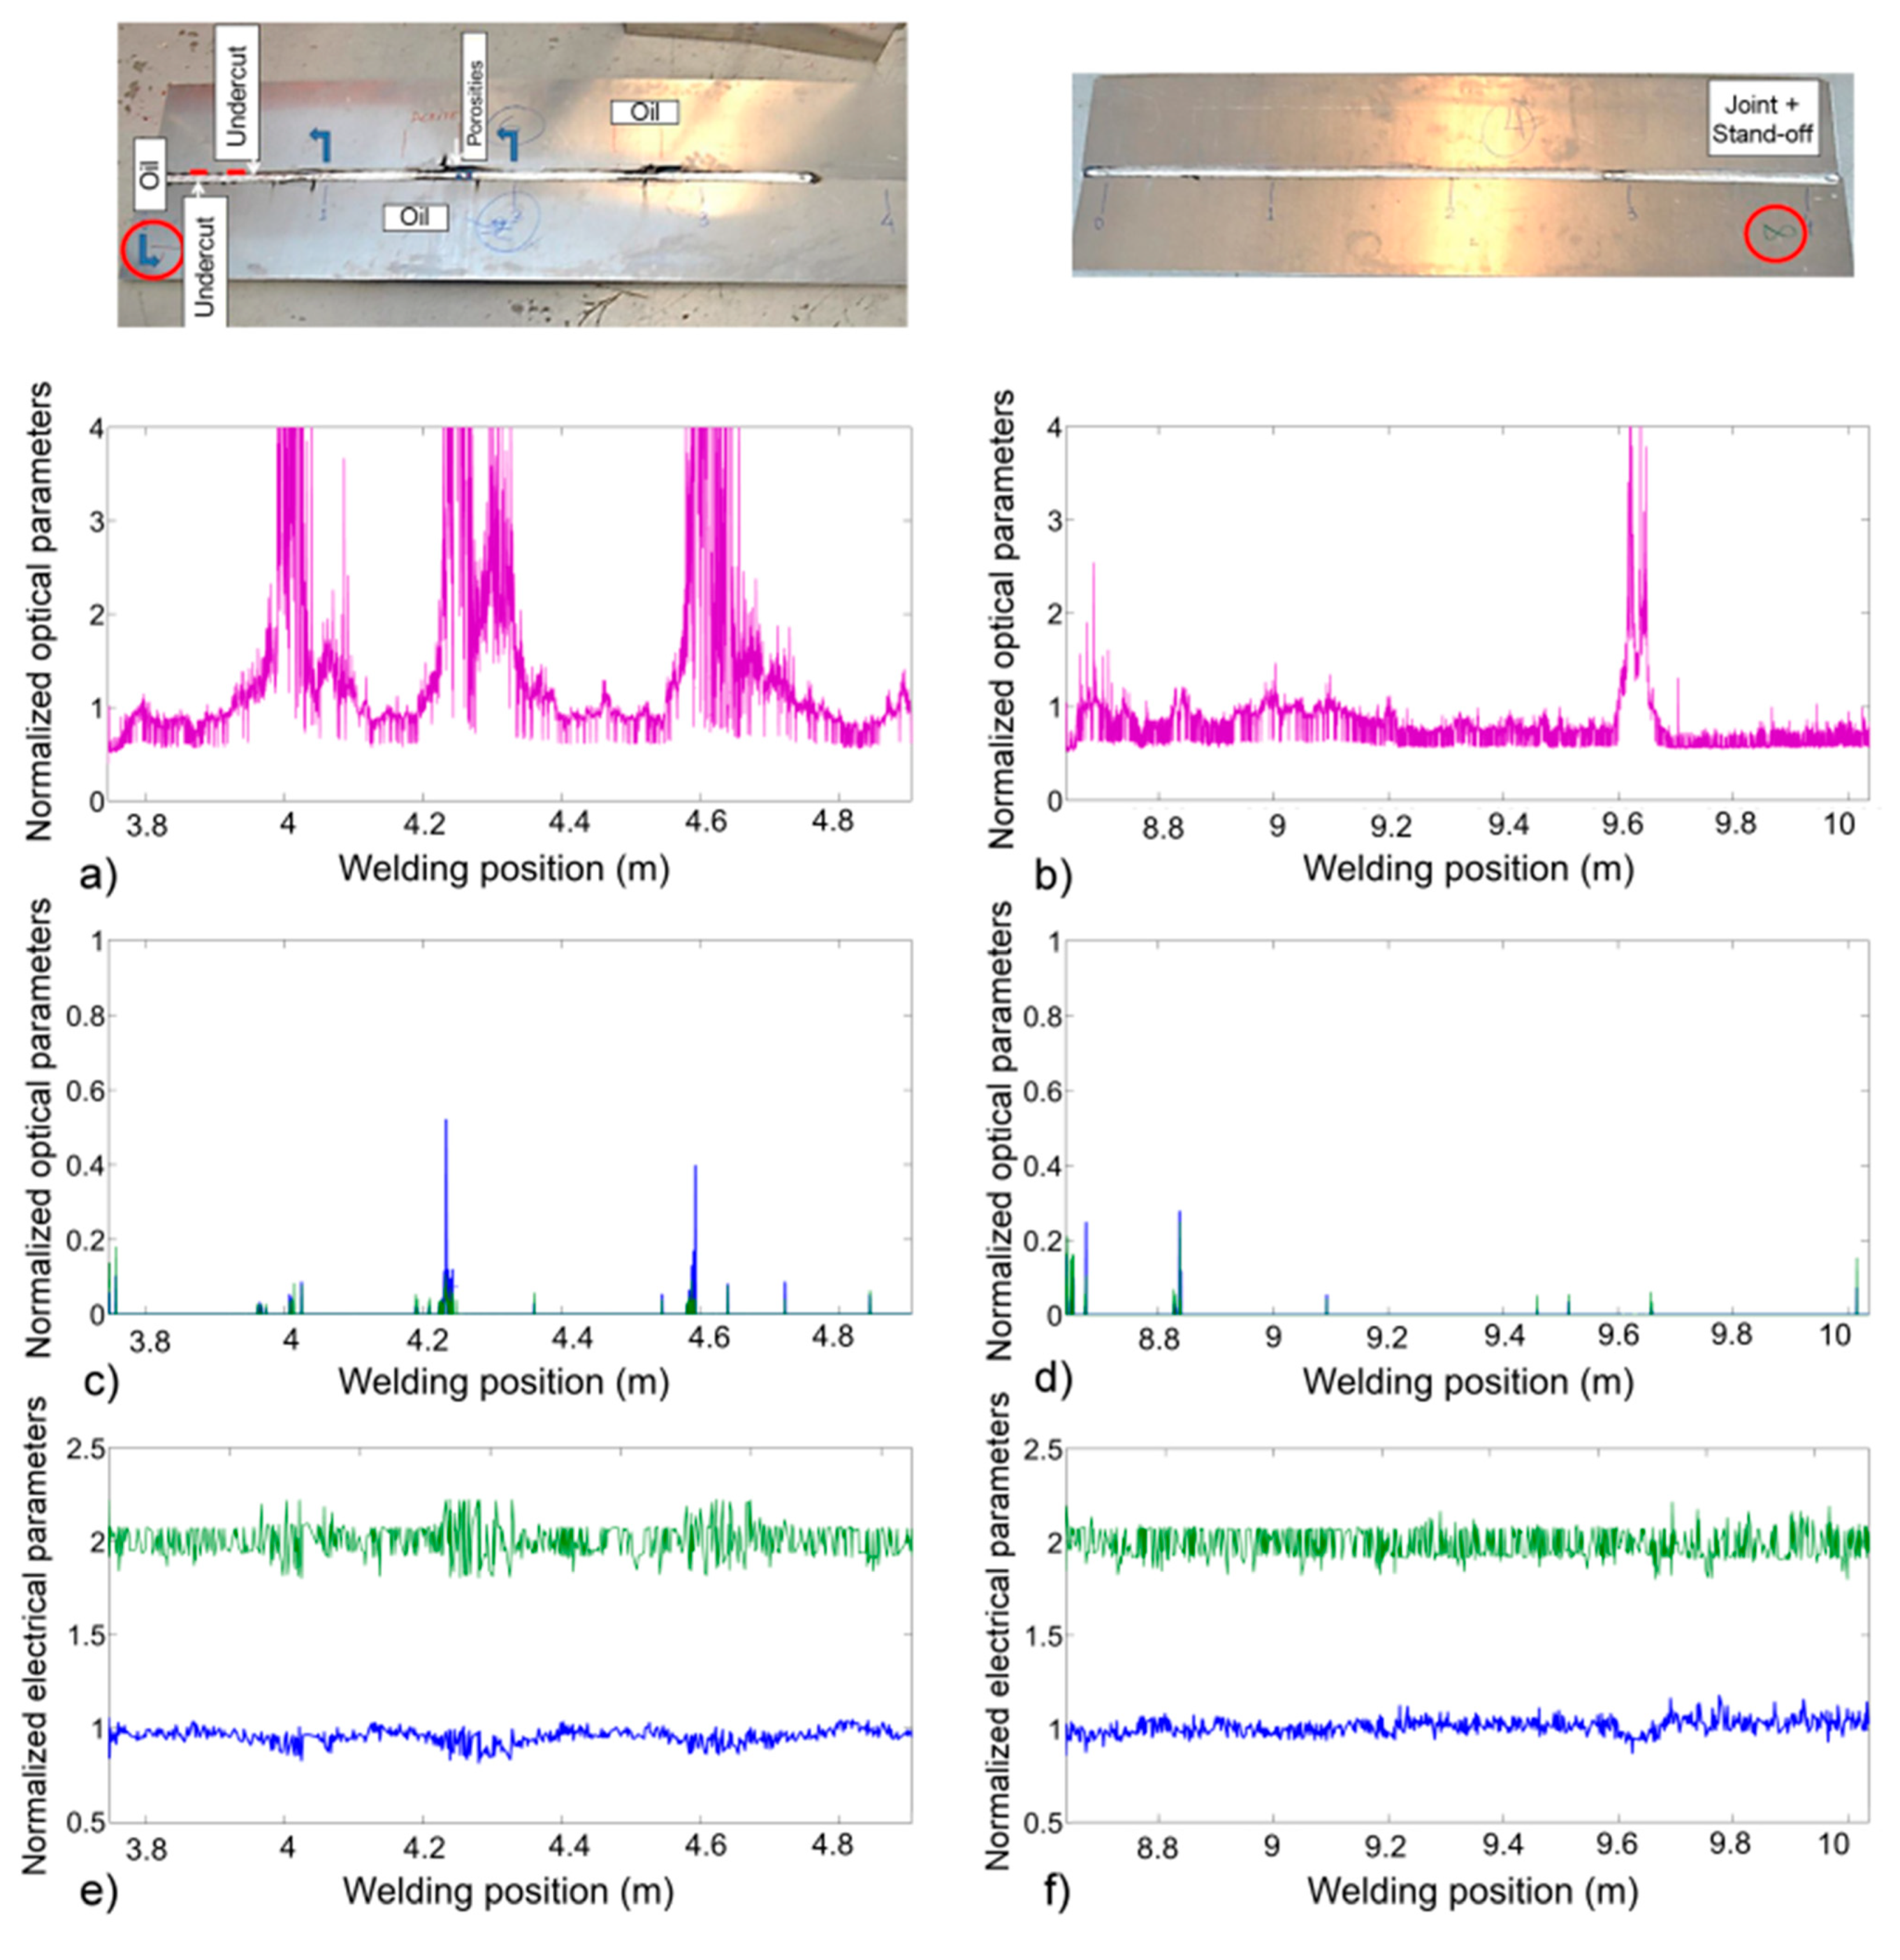
3. Experimental Results and Discussion
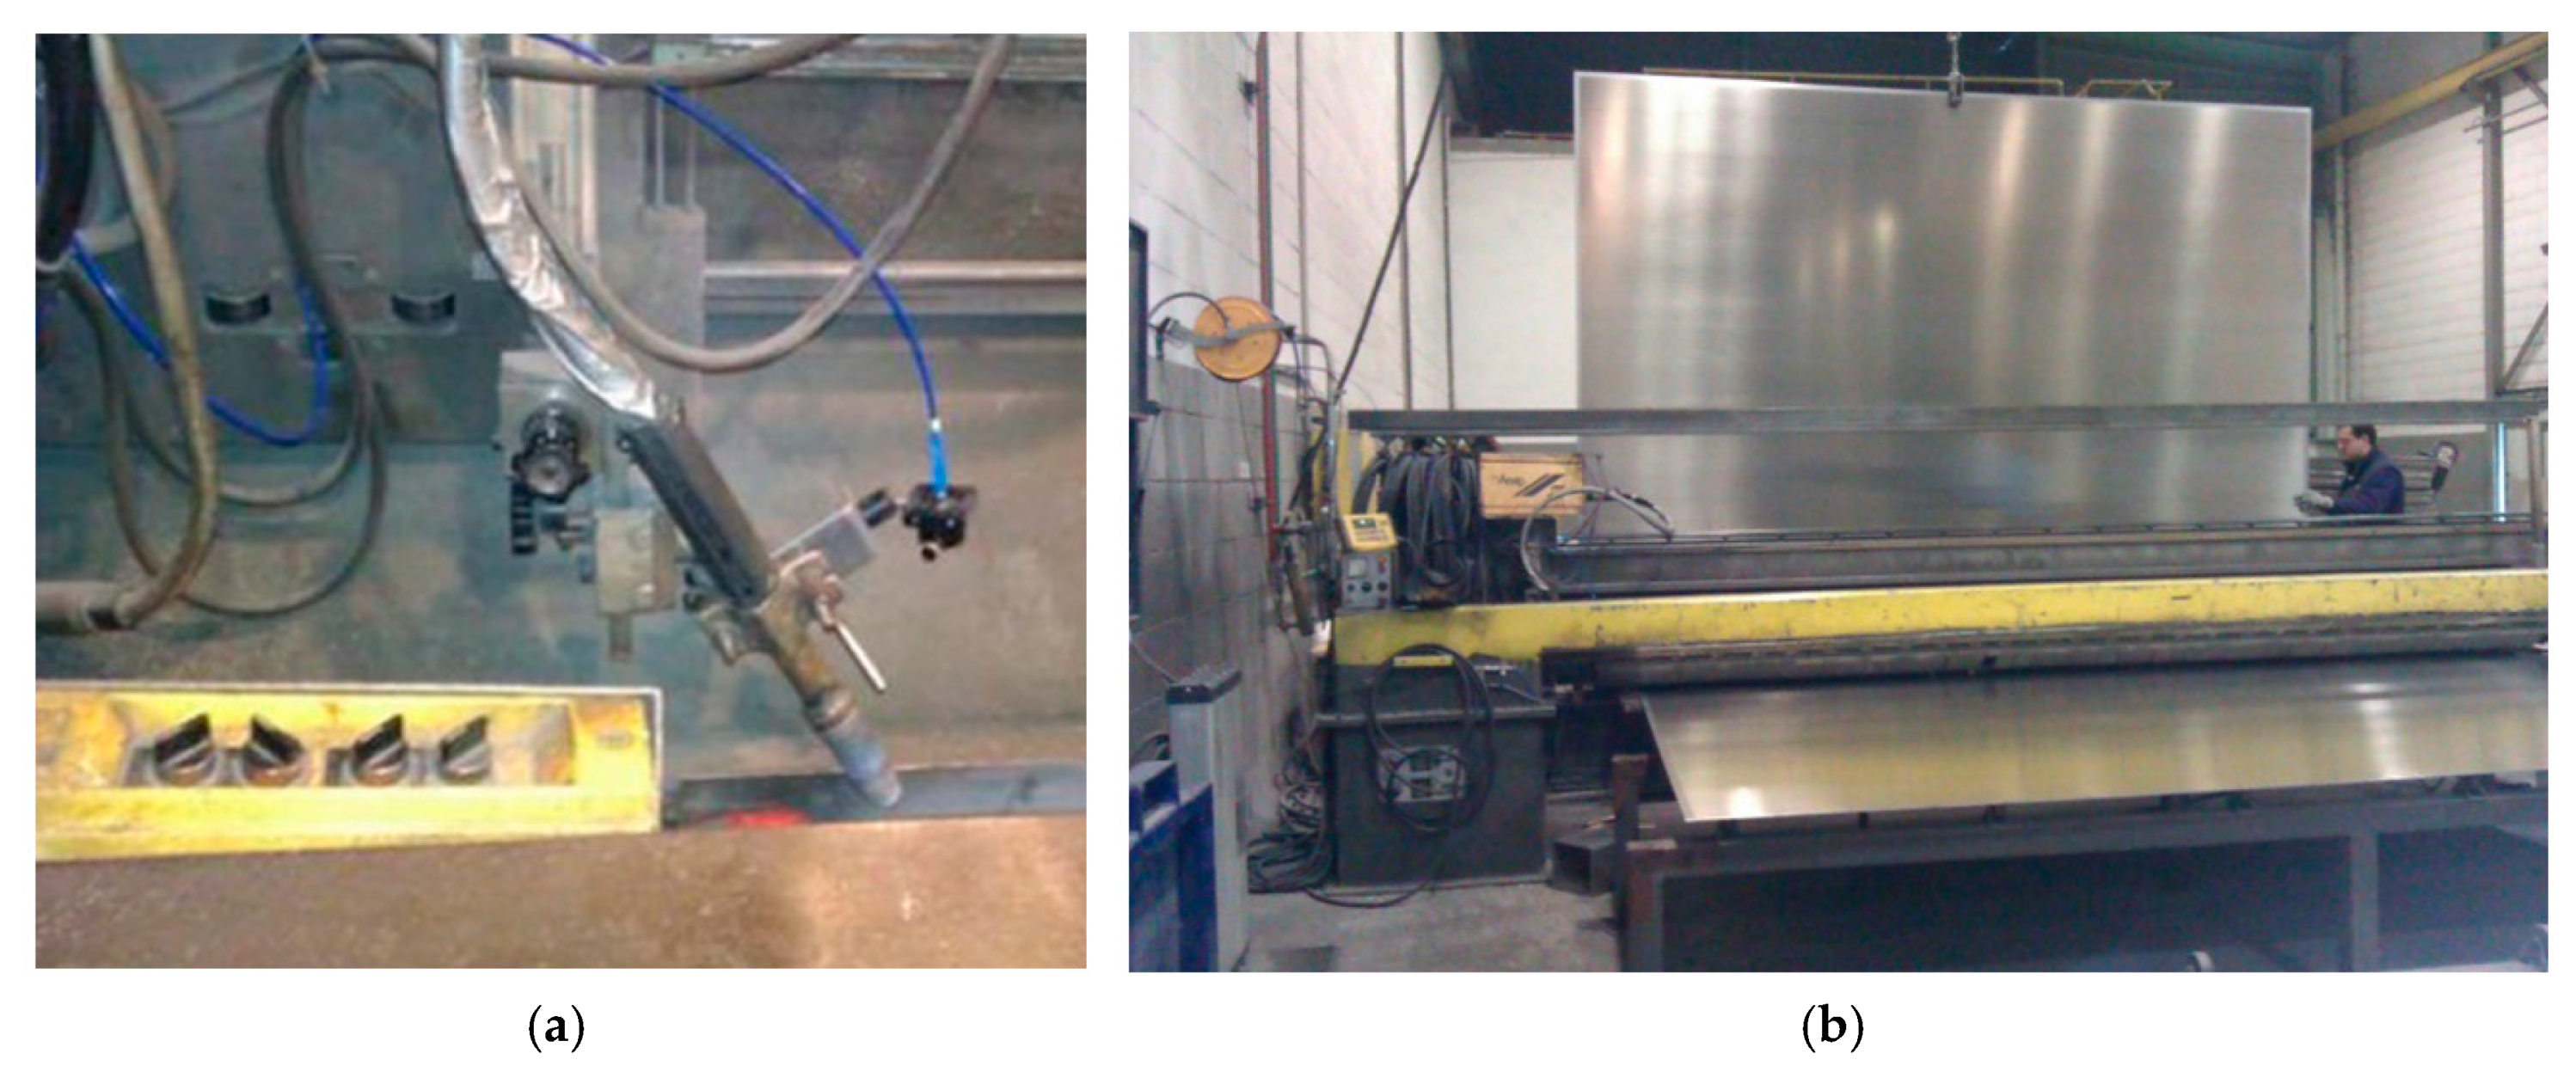
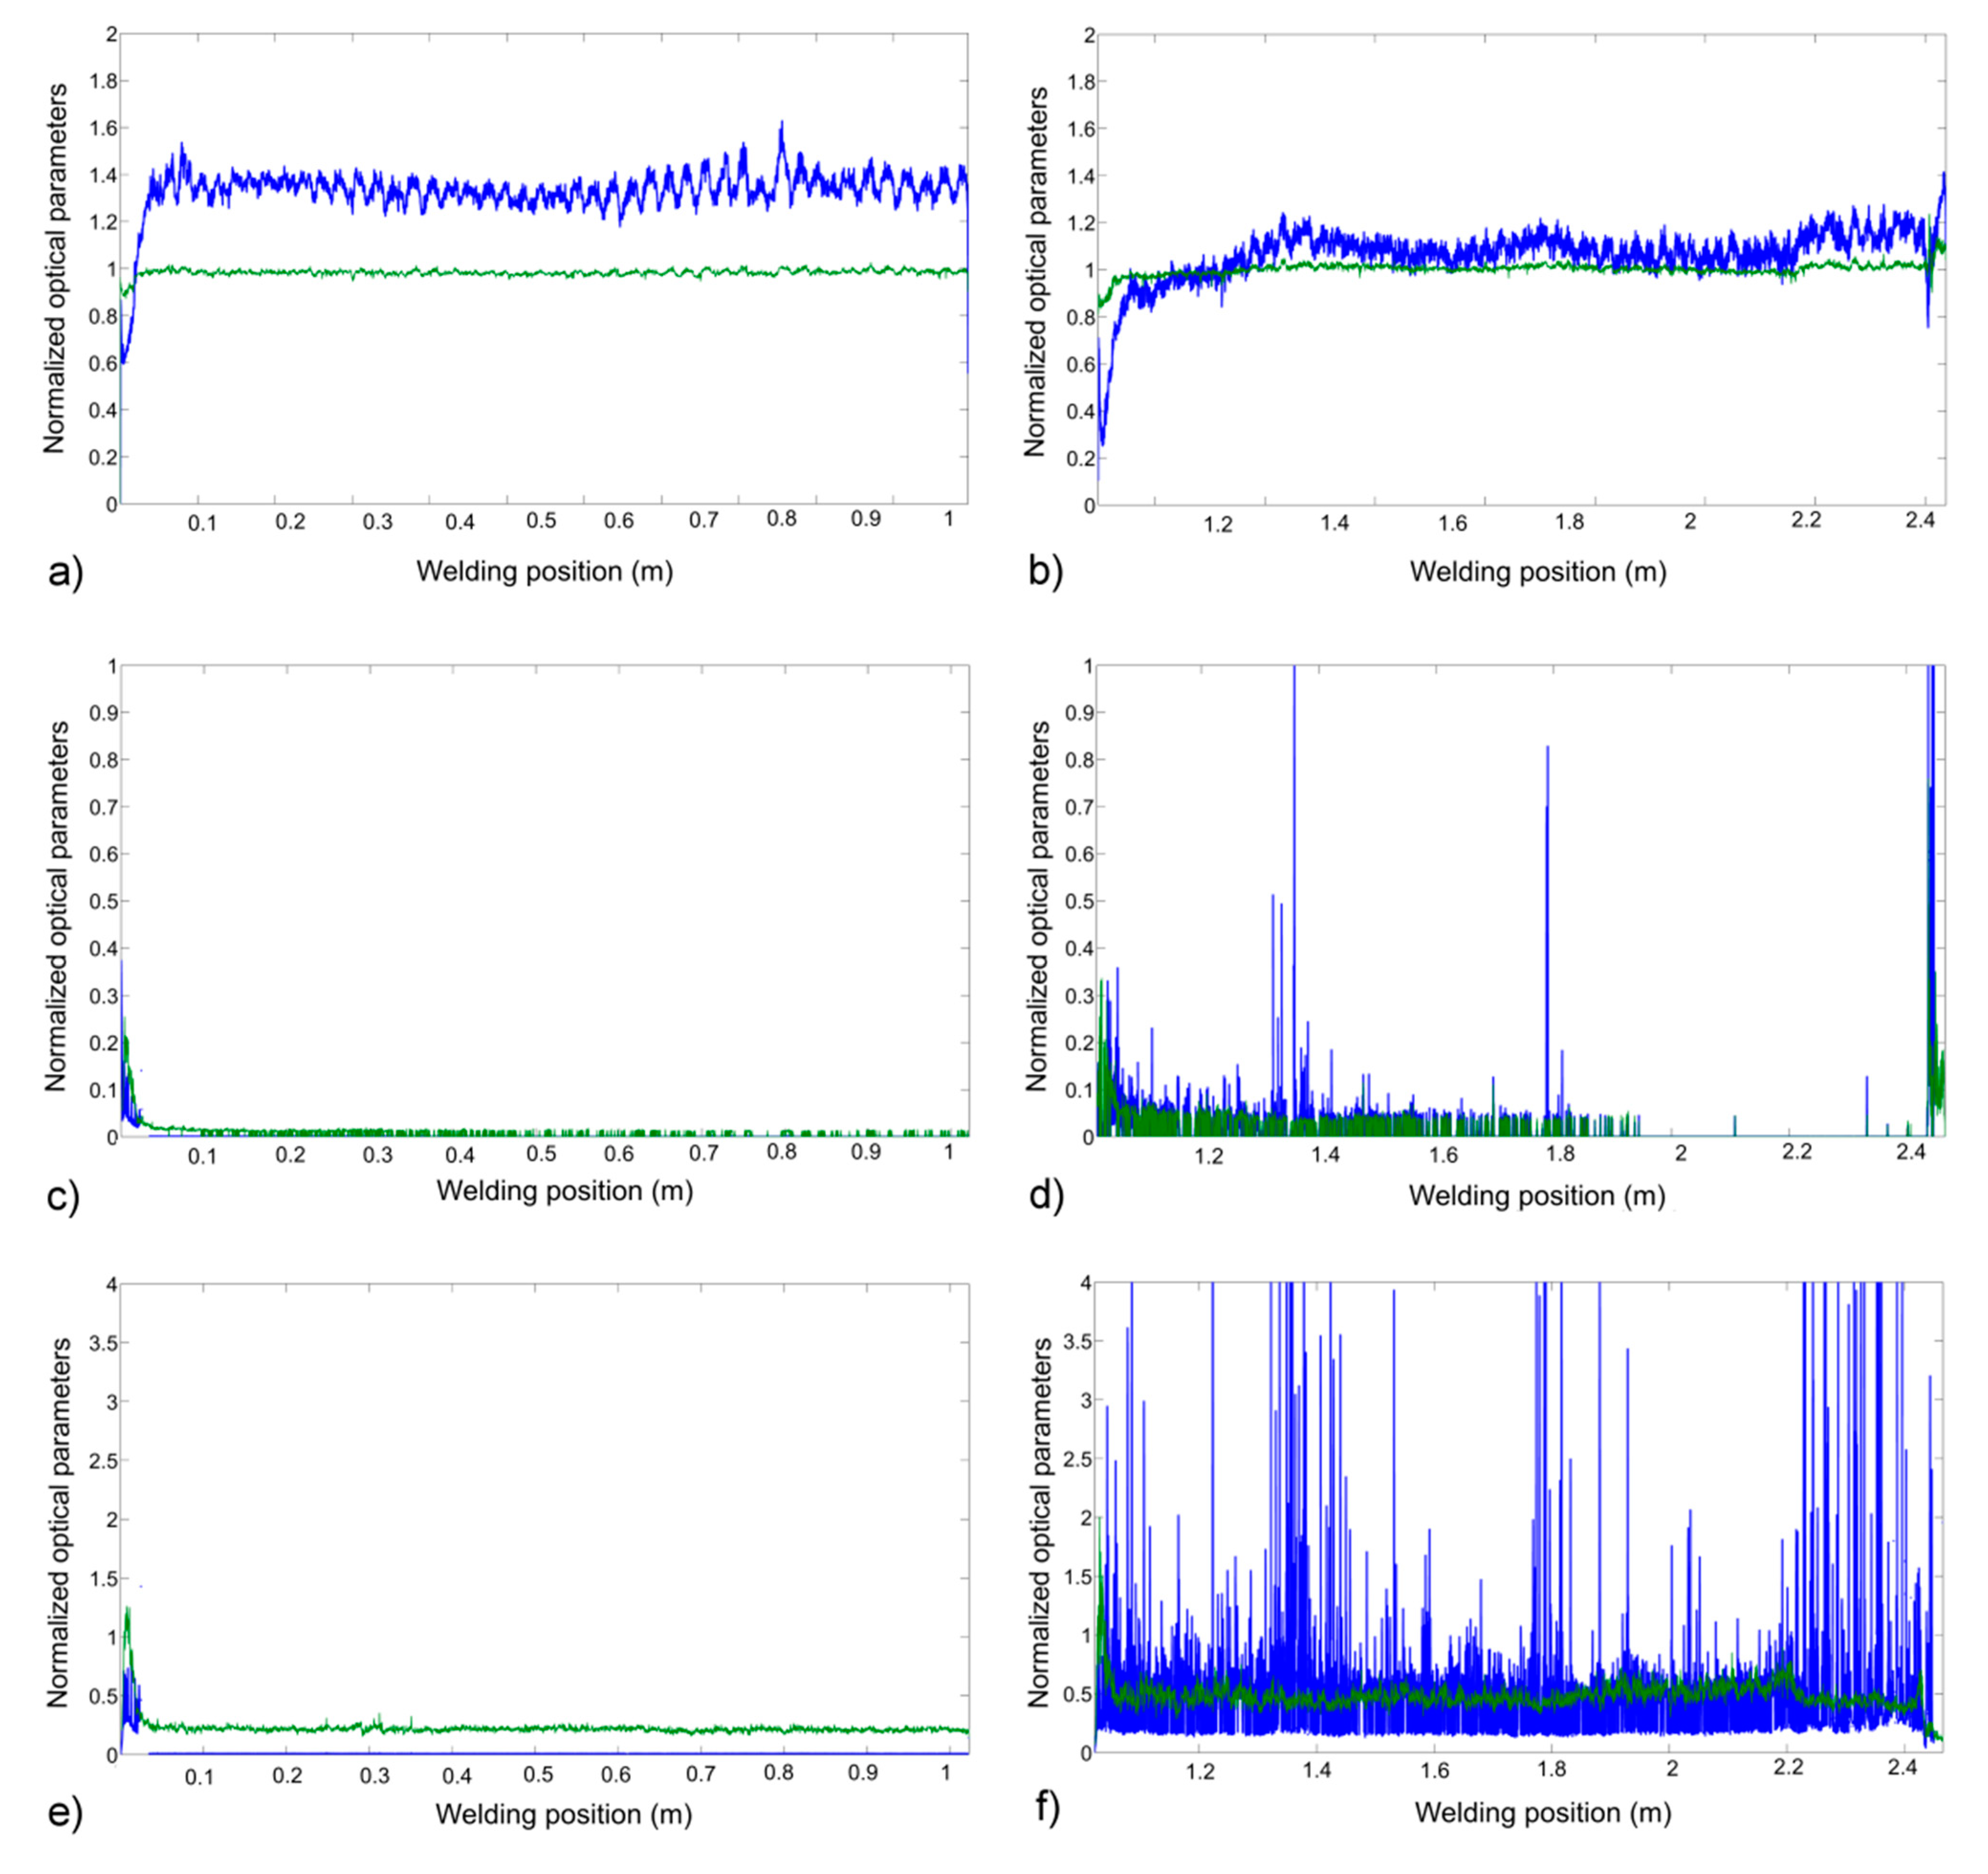
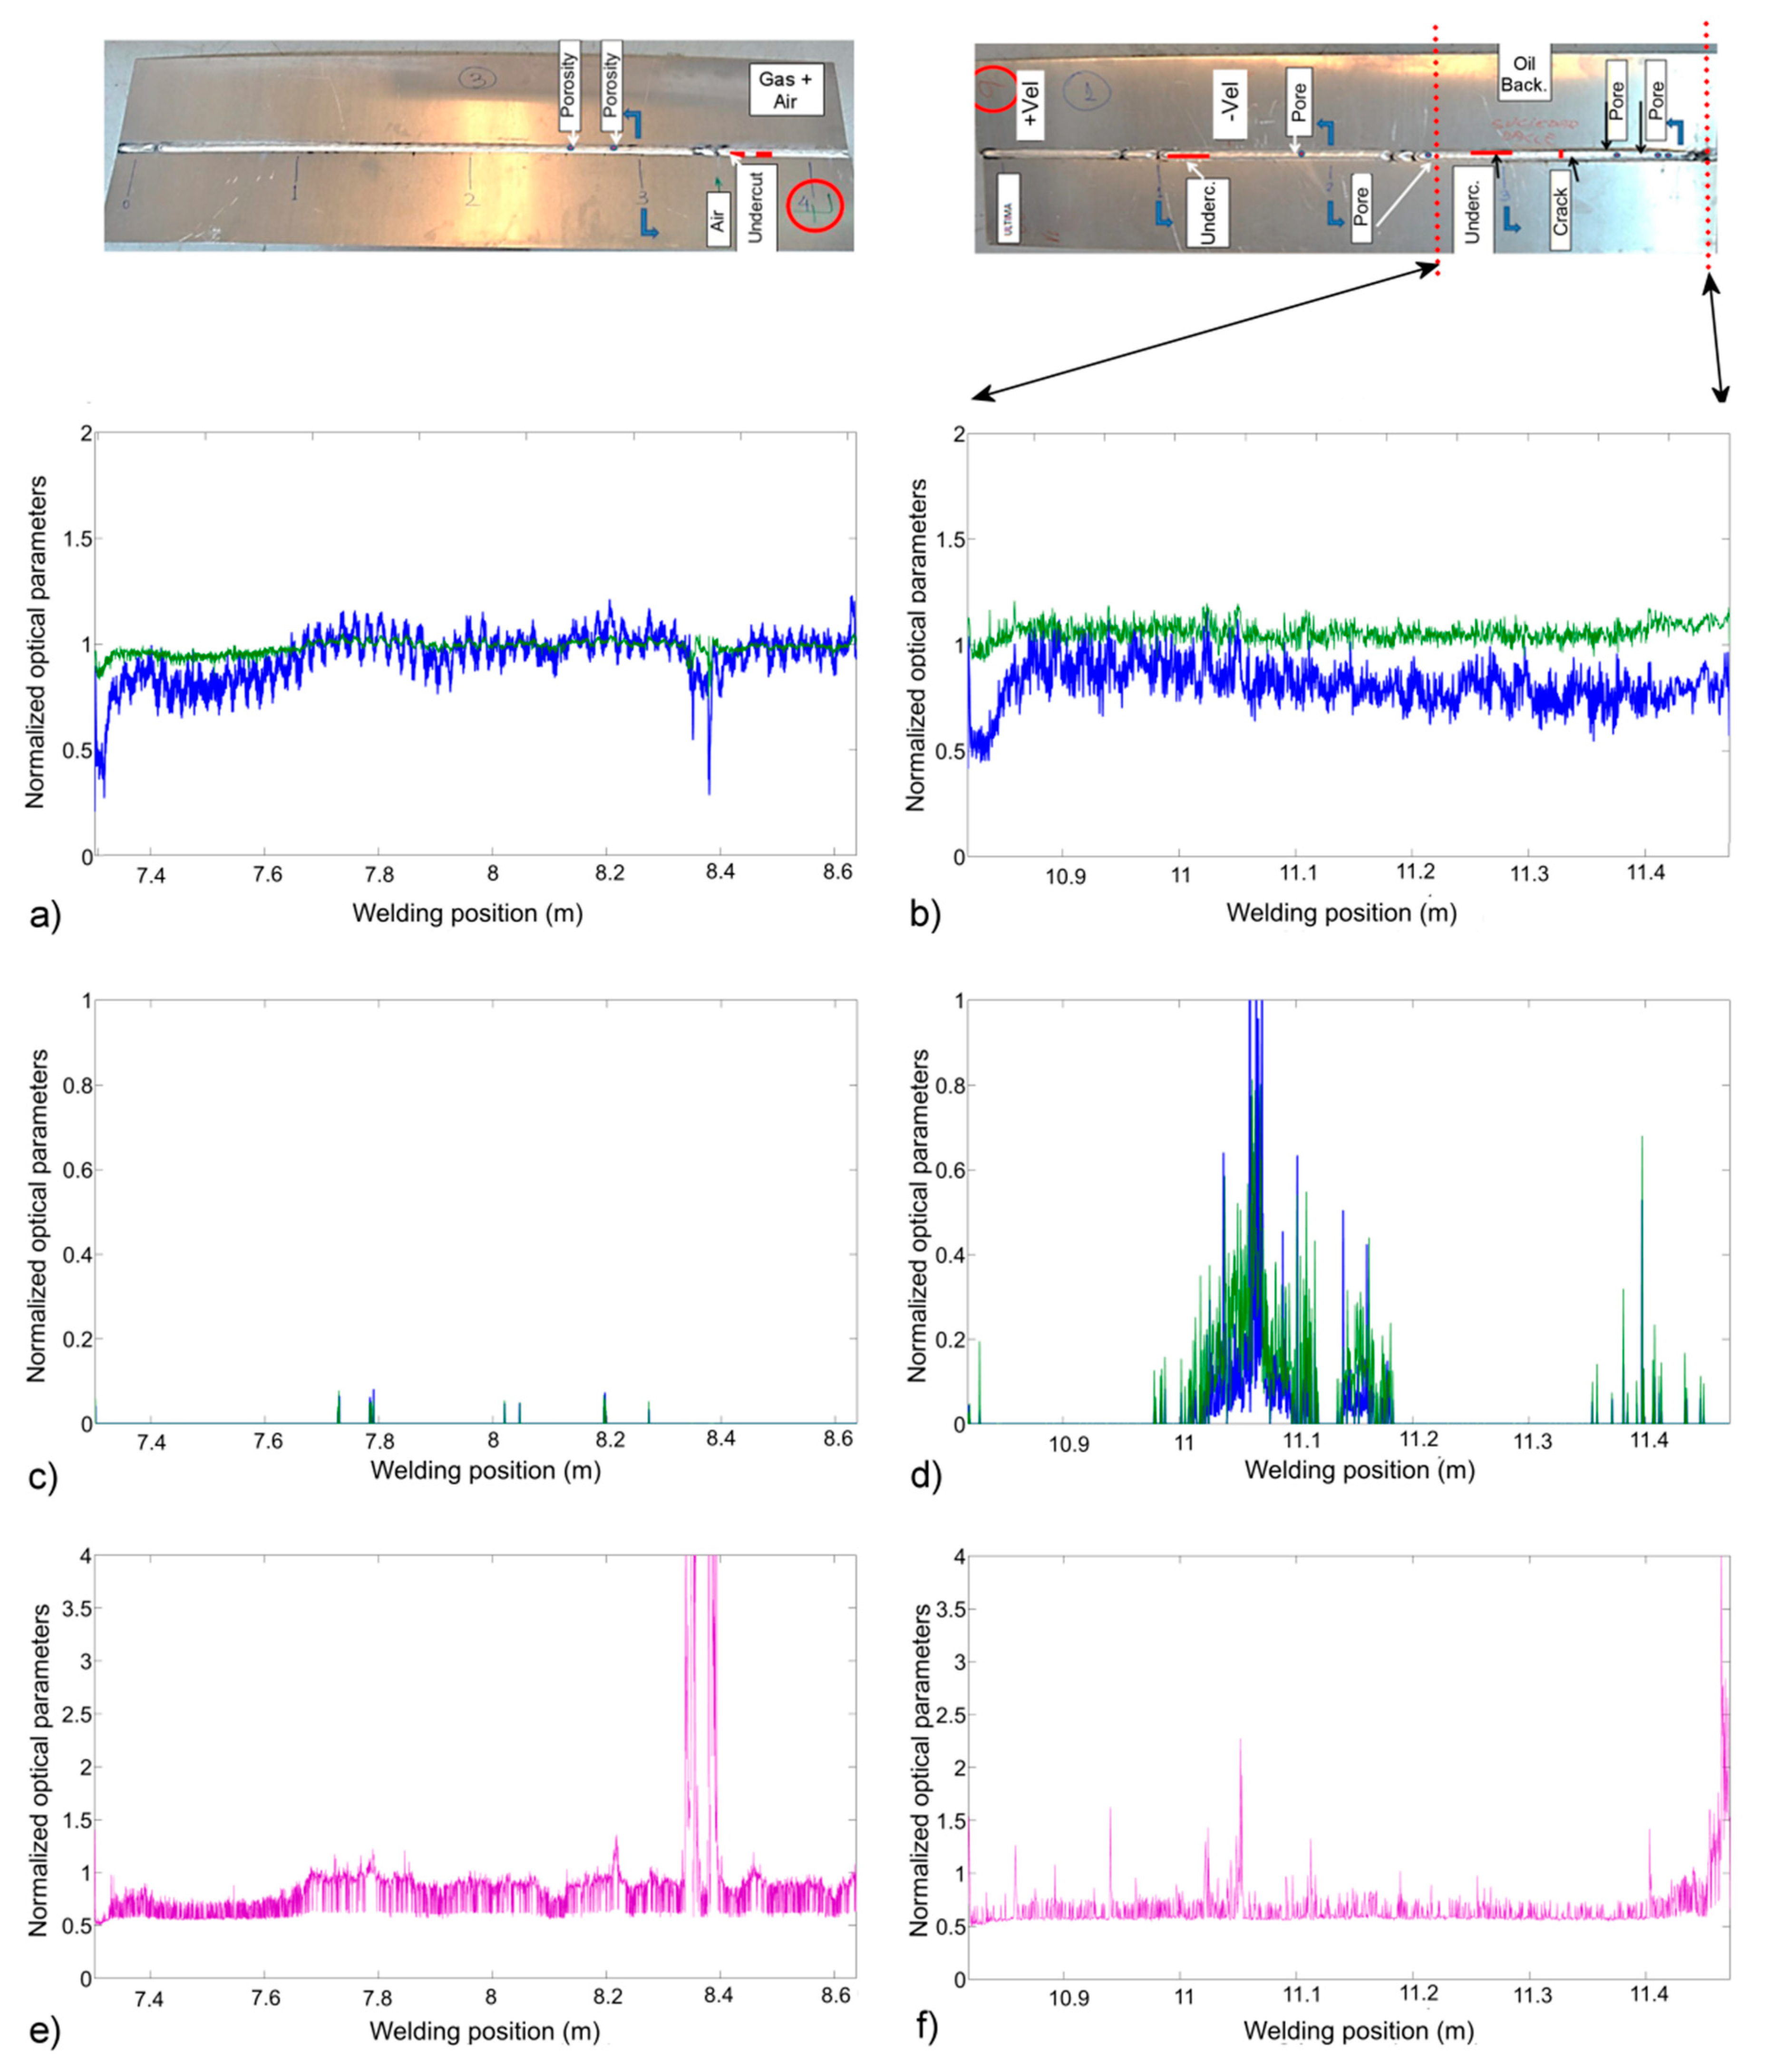
3.1. Field Trials

An initial analysis was performed via welding trials in the production line under analysis to study the performance of the monitoring system. Nine different trials were designed by trying to perform correct seams as well as modifying different process parameters. Detailed information about these tests is presented in Table 2.
As can be observed, the first two seams were performed with standard parameters and without perturbations intentionally applied to the process. However, some defects appeared during the X-ray off-line analysis. It is worth mentioning that all these defects were considered to be acceptable in terms of the associated standard for the tanker trucks. It is especially relevant that some porosities appeared in Weld Trial #2. Figure 3 shows the results of the studies performed with the captured plasma spectra.
Figure 3a depicts the plasma RMS and color temperature profiles associated with both seams. It can be observed that, although there are some subtle variations, especially in Trial #2, the presence of defects is not clearly indicated by perturbations in these signals. This situation changes when H lines are employed to generate the output profiles. In Figure 3c,d, the ratio of the H I (hydrogen neutral atom) (656 nm) line to the Al I line at 396 nm is used. It is worth noting that, in this case, a clear difference appears between the results derived from weld Trials #1 and #2. The higher contribution of the H I line in Trial #2 seems to be correlated with the appearance of porosities in the seam detected by the X-ray inspection. Finally, Figure 3e,f show similar analyses, though using the ratio of Na I (589 nm) to Al I (670 nm). Again, the higher Na I contribution can be correlated with the detected porosities.
In terms of the study derived from Figure 3, an interesting analysis can be performed with Trials #7 and #9 and the results shown in Figure 4. The former trial was performed with a lower protection gas flow rate (reduced from 22 to 20 L/min), and a dry compressed air torch was employed at the end of the seam to simulate a greater perturbation in the process. Trial #9 was designed to study the influence of process speed in the process dynamics: a higher speed was applied at the beginning, then it was reduced, and in the last half of the seam both water and oil were applied in the seam backing. Figure 4 presents the results derived from the analysis of Trial #7 and the final section of Trial #9, associated with contaminants in the weld backing. Regarding Trial #7, it might be expected that the H I contribution should be significant, considering the gas flow rate reduction. However, it seems that 20 L/min, although 2 L/min under the standard gas flow rate, is a sufficient level to ensure the protection of the pool, and the H I participation depicted in Figure 4c is significantly lower than the one discussed in Figure 3d. However, the H I profile does not indicate the occurrence of the defect provoked by the use of the dry compressed air at the end of Seam #7. On the contrary, the plasma RMS and color temperature (Figure 4a) and the ratio of the Ar I line (738 nm) to the Ar I line (763 nm) profiles give rise to the identification of a clear event at x ≈ 8400 mm. (It is worth mentioning that the x-axis has been sequentially generated for all the weld trials, i.e., Trial #1 goes from 0 to 1000 mm, #2 from 1000 to 2400 mm, and so on.)
This result is backed by the X-ray inspection (Figure 4, top-right), where the undercut close to the end of the seam is associated with the use of compressed air. Note that defects indicated by the radiographic analysis and their locations have been indicated over the seam under analysis. There are also two isolated porosities around x ≈ 8200 mm whose identification is not so clear (although there is a peak in Figure 4e), but in this case the H I profile does not indicate contamination of the process. Figure 4d, however, shows high levels of H participation in the process, thus supporting the X-ray detection of several defects in the associated seam, leading to the conclusion that the employment of oil and water in the process backing gave rise to clear contamination and, consequently, a defective seam. In this case, the Ar profile (Figure 4f) also exhibits some peaks that can be correlated with the quality-related events presented in Figure 4d.
Please note that the images of the seams at the top of Figure 4 (and also Figure 6) are presented at a scale that does not correspond to the associated graphs. These images, with the indications of the welding quality-related events, are intended to provide a better understanding of the trials and the associated results.
Spectra captured during Weld Trial #9 are shown in Figure 5. In particular, a comparison is shown between a spectrum associated with a section of correct welding and a spectrum from a section where contamination occurred. It can be observed that the contamination gave rise to an increase in the H I line at 656.2 nm (see detail in the inlay), while clear decreases are shown in the intensities of the Ar I lines located between 695 and 811 nm. This behavior agrees with the results provided in Figure 4. It can be observed how some of the emission lines overlapped due to the limited resolution of the low-cost spectrometer chosen. However, this resolution does not compromise a suitable spectroscopic analysis for the required monitoring purposes.
It is also interesting to analyse the performance of the electric sensors involved, i.e., those that acquire welding voltage and current information. In general terms, it might be concluded that, at least with respect to the studies performed in this work, these sensors exhibit a poorer performance than the optical plasma spectroscopy approach. Figure 6 shows the results of two weld trials in which the electrical signals showed some correlation with quality-related events. For example, Figure 6e presents the welding voltage and current profiles for Weld Trial #4, where oil was used at the top of the joint to simulate a lack of cleanliness. A visual inspection of the seam (Figure 6, top-left) clearly revealed the effects of the oil during the process. Specifically, the Ar I profile depicted in Figure 6a exhibited a trend with a good correlation with the visual defects to be found in the seam. Both the welding voltage and current also exhibited some perturbations matching these events (Figure 6e).
A less clear situation can be studied in Figure 6b,d,f. In this case, the trial was designed to analyse the effects of joint preparation and variations in the stand-off distance employed in the process. Curiously, the X-ray inspection did not detect any defect, but a “burnt” is clearly visible at x ≈ 9600 mm. Both the Ar I (Figure 6b) and the voltage (Figure 6d) profiles show perturbations at this location—more evident in the optical analysis. It is worth mentioning that, in this case, the HI profile did not exhibit any correlation with this event.

3.2. In-Line Production Analysis

The previously discussed weld trials were necessary in order to perform an initial calibration of the system, especially with respect to the viability of detecting different perturbations and/or defects. However, such trials are typically far from the real production conditions, even if the same production line is employed. In the literature, it is quite common to find validations of different monitoring approaches by means of experimental tests or weld trials, for example, by simulating porosities [11], perturbations in the gas flow rate [28] and oxidation, slag or metal inclusions [29]. However, it is more difficult to find works in which the proposed solutions have been tested in real field tests in real production scenarios.
The monitoring system, designed by SADIQ Engineering S.L. and the Photonics Engineering Group (University of Cantabria), described at the beginning of Section 2 has been used for months in the manufacture of tanks for tanker trucks in the facilities of Talleres Cobo Hnos S.L. in Guarnizo, Spain, and is presented in Figure 6 as it was installed in the production line under analysis. During this time, the system has stored all the performed seams and the results have been validated with X-ray inspection, especially when some specific problems have been detected. One problem in this regard lies in the requirement imposed by the associated standard of only using the X-ray inspection for a reduced length of the performed seams. However, as will be discussed below, the occurrence of specific defects is rather limited, and defective events are typically associated with contamination that implies porosities distributed along the seam.
Figure 7 depicts the results derived from the analysis of the seams associated with three different tankers developed on different days. Each tanker is formed by up to 14 different seams, with a total welding length of more than 45 m. The vertical dotted lines in the graphs indicate the separations between different seams, depicted sequentially. Figure 7b,d,f show the corresponding H I profiles which serve as indications of the occurrence of atmospheric contamination or porosities derived therefrom. It can be appreciated that the level of H I participation, calculated as the ratio of the integration of the H I line at 656 nm to an average of the Al lines identified in the spectra, increases from Tanker #2 to #1, and becomes quite significant for Tanker #3. Analysis of the X-ray inspections of these seams revealed a very good correlation, detecting several porosities for Tankers #2 and #3. In fact, an analysis performed a posteriori on the data acquired for the system indicated that the welding for Tanker #3 had been performed with a protection gas flow rate of 16 L/min, inferior to the standard value of around 20 L/min, which explains the high contamination that can be seen in Figure 7f. It is also interesting to point out how in this case (Figure 7e) the electrical parameters, both the welding current and voltage, exhibit a noisier profile in comparison to the rest of the seams. Figure 7a,c,d present the welding voltage (y ≈ 1), current (y ≈ 2), gas flow rate (y ≈ 3) and wire feed speed (y ≈ 4) for these three tankers, with their corresponding values normalised to allow a suitable representation.
It is also remarkable how, in spite of the low contamination detected, the voltage and current profiles are quite unstable in Figure 7c for Tanker #2. This might be explained by reference to other defects, such as lack of penetration, that were detected in this case by the X-ray inspection.
Although the occurrence of defects apart from porosities is low, Figure 8 presents an example of a crack detected via X-ray in Seam #222940 (Tanker #2). As already discussed, while H profiles are suitable to detect the appearance of porosities, other defects might not be reflected in them. In this example, the level of H participation is quite similar in these seams, but there is no clear indication of the mentioned crack. The Mg profile, calculated as the ratio of the integrated value of the Mg I line at 553 nm to an average of the detected Mg lines, shows a clear dip associated with the location of the crack detected by means of the X-ray inspection.

4. Conclusions

In this paper, we have presented an analysis associated with an on-line monitoring system designed and implemented for an arc-welding process employed in the manufacturing of tanker trucks. The system is based on plasma optical spectroscopy, although it also allows the acquisition of welding current, voltage, process and wire feed speed and protection gas flow rate information. The information provided by the plasma spectra of the welding process supports good performance in terms of its ability to detect different defective situations that may appear during the welding of Al-Mg alloys. Weld trials were designed and carried out to test the performance of the system by provoking different perturbations to the process. In addition, extensive in-line production validation has also been performed, verifying the obtained results with the X-ray inspection required by the associated standard. This point is highly relevant, as it allows a realistic test and validation of the monitoring system within a completely real production scenario, avoiding the uncertainties associated with the use of simulated defects.
It has been demonstrated in production that the H I profile is a good parameter to evaluate atmospheric contamination in the process or contamination due to a lack of cleanliness and, therefore, the occurrence of porosities. In fact, the generation of these H I profiles against different H I lines or other averaged groups of lines (e.g., Al I) may give rise to profiles with improved features in terms of sensitivity or noise. The ability of other species, such as Ar I, Mg I or Na I, to detect other defects such as cracks that do not appear in H profiles has also been discussed. In this regard, it is also worth mentioning that our studies suggest that there are other porosities that appear in isolation whose causes are probably different from those of porosities that appear in groups, as they are not reflected in the H profiles.
The results derived from the employment of Na lines should be carefully studied, although the correlation of the perturbations in these profiles with the appearance of porosities is quite evident. We have performed different studies, for example, analyses via LIBS (laser-induced breakdown spectroscopy) of the composition of all the elements involved in the welding process: plates, wire feed, tools used to prepare the joint, and so on. We have detected the participation of Na both in the wire feed and in the plates and it is known that during the manufacturing of some Al-Mg alloys the plates are cleaned with compounds containing Na. Deposition of environmental pollutants in stored raw materials can be another source of contamination [30]. In fact, recent preliminary studies performed by our group suggest that some elements not typically employed in spectroscopic analysis (Li, Na, K) may indicate contamination and can therefore be used to detect some specific weld defects. More studies will be needed to correlate Na profiles and the mentioned elements with seam contamination and final welding quality.
The ultimate goal of this kind of monitoring system should be not only to offer real-time information about the process but also to help in discovering the causes underlying the appearance of defects. The proposed solution might prove useful in this regard, for example, by controlling ambient temperature and humidity or protecting the gas flow rate and establishing a correlation with the H profiles and the porosities detected in the X-ray inspection.
Apart from extending the study to further tanker production processes, future works might be focused on adding more relevant sensors to the system. For instance, a welding torch inclinometer will be considered, given that variation in torch-plate angle will affect the performance of protection gas during the process and therefore might also cause porosities. An atmospheric pressure sensor might also prove useful in addition to the ambient temperature and humidity sensors already installed. In this regard, a further long-term study looking for correlations between these parameters and the appearance of porosities could also be developed.

Author Contributions

Conceptualization, J.J.V., A.C., J.M.L.-H. and J.M.; methodology, J.J.V., A.C., L.R.-C. and J.M.; software, J.J.V. and L.R.-C.; validation, J.J.V. and J.M.; formal analysis, J.J.V. and J.M.; investigation, J.J.V., A.C. and J.M.; resources, J.J.V., A.C., J.M.L.-H. and J.M.; data curation, J.J.V. and J.M.; writing—original draft preparation, J.J.V. and J.M.; writing—review and editing, J.J.V. and J.M; project administration, J.J.V. and J.M.; funding acquisition, J.J.V. and J.M. All authors have read and agreed to the published version of the manuscript.

Funding

This work has been co-supported by the project PID2019-107270RB-C21 funded by MCIN/AEI/10.13039/501100011033. Ministerio de Ciencia e Innovación (Spanish Government).

Institutional Review Board Statement

Not applicable.

Informed Consent Statement

Not applicable.

Data Availability Statement

Not applicable.

Acknowledgments

The authors would like to thank the staff of Cisternas Cobo S.L. for their valuable support during the welding trials and in-line production of tanker trucks in its facilities in Guarnizo, Cantabria.

Conflicts of Interest

The authors declare no conflict of interest.

References

  1. Kovacevic, R.; Zhang, Y.; Li, L. Monitoring of Weld Joint Penetrations Based on Weld Pool Geometrical Appearance. Weld. J. Res. Suppl. 1996, 75, 317–329. [Google Scholar]
  2. Abdullah, B.; Smith, J.S.; Lucas, W.; Lucas, J.; Abdul Malek, M. Monitoring of TIG welding using laser and diode illumination sources: A comparison study. In Proceedings of the 2008 International Conference on Electronic Design, Penang, Malaysia, 1–3 December 2008; pp. 1–4. [Google Scholar]
  3. Das, B.; Pal, S.; Bag, S. Monitoring of friction stir welding process using weld image information. Sci. Technol. Weld. Jt. 2016, 21, 317–324. [Google Scholar] [CrossRef]
  4. Speka, M.; Matteï, S.; Pilloz, M.; Ilie, M. The infrared thermography control of the laser welding of amorphous polymers. NDT E Int. 2008, 41, 178–183. [Google Scholar] [CrossRef]
  5. Makwana, P.; Goecke, S.F.; De, A. Real-time heat input monitoring towards robust GMA brazing. Sci. Technol. Weld. Jt. 2019, 24, 16–26. [Google Scholar] [CrossRef]
  6. Yang, M.; Bai, R.; Zheng, H.; Qi, B. Temperature monitoring and calibration in Ti–6Al–4V molten pool with pulsed arc welding. Sci. Technol. Weld. Jt. 2020, 25, 369–376. [Google Scholar] [CrossRef]
  7. Gu, H.; Duley, W. A statistical approach to acoustic monitoring of laser welding. J. Phys. D 1996, 29, 556. [Google Scholar] [CrossRef]
  8. Rodriguez-Cobo, L.; Mirapeix, J.; Ruiz-Lombera, R.; Cobo, A.; López-Higuera, J.M. Fiber Bragg grating sensors for on-line welding diagnostics. J. Mater. Process. Technol. 2014, 214, 839–843. [Google Scholar] [CrossRef]
  9. Sun, A.; Kannatey-Asibu, E.; Gartner, M. Monitoring of laser weld penetration using sensor fusion. J. Laser Appl. 2002, 14, 114–121. [Google Scholar] [CrossRef]
  10. Zhang, Z.; Chen, H.; Xu, Y.; Zhong, J.; Lv, N.; Chen, S. Multisensor-based real-time quality monitoring by means of feature extraction, selection and modeling for Al alloy in arc welding. Mech. Syst. Signal Process. 2015, 60, 151–165. [Google Scholar] [CrossRef]
  11. Ancona, A.; Spagnolo, V.; Lugara, P.M.; Ferrara, M. Optical Sensor for real-time Monitoring of CO2 Laser Welding Process. Appl. Opt. 2001, 40, 6019–6025. [Google Scholar] [CrossRef]
  12. Sibillano, T.; Ancona, A.; Berardi, V.; Lugarà, P.M. Real-time monitoring of laser welding by correlation analysis: The case of AA5083. Lasers Eng. 2007, 45, 1005–1009. [Google Scholar] [CrossRef]
  13. Garcia-Allende, P.B.; Mirapeix, J.; Conde, O.M.; Cobo, A.; Lopez-Higuera, J.M. Defect detection in arc-welding processes by means of the line-to-continuum method and feature selection. Sensors 2009, 9, 7753–7770. [Google Scholar] [CrossRef] [PubMed]
  14. Taparli, U.A.; Jacobsen, L.; Griesche, A.; Michalik, K.; Mory, D.; Kannengiesser, T. In situ laser-induced breakdown spectroscopy measurements of chemical compositions in stainless steels during tungsten inert gas welding. Spectrochim. Acta B At. Spectrosc. 2018, 139, 50–56. [Google Scholar] [CrossRef]
  15. Taparli, U.A.; Kannengiesser, T.; Cieslik, K.; Mory, D.; Griesche, A. In situ chemical composition analysis of a tungsten-inert-gas austenitic stainless steel weld measured by laser-induced breakdown spectroscopy. Spectrochim. Acta B At. Spectrosc. 2020, 167, 105826. [Google Scholar] [CrossRef]
  16. Lin, J.; Yang, J.; Huang, Y.; Lin, X. Defect identification of metal additive manufacturing parts based on laser-induced breakdown spectroscopy and machine learning. Appl. Phys. B 2021, 127, 173. [Google Scholar] [CrossRef]
  17. Yu, H.; Xu, Y.; Song, J.; Pu, J.; Zhao, X.; Yao, G. On-line monitor of hydrogen porosity based on arc spectral information in Al–Mg alloy pulsed gas tungsten arc welding. Opt. Laser Technol. 2015, 70, 30–38. [Google Scholar] [CrossRef]
  18. Devletian, J.H.; Wood, W. Factors Affecting Porosity in Aluminum Welds—A Review; Bulletin (Welding Research Council (U.S.)) Series; Welding Research Council, United Engineering Center: New York, NY, USA, 1983; pp. 1–18. [Google Scholar]
  19. Mirapeix, J.; Ruiz-Lombera, R.; Valdiande, J.J.; Rodriguez-Cobo, L.; Anabitarte, F.; Cobo, A. Defect detection with CCD-spectrometer and photodiode-based arc-welding monitoring systems. J. Mater. Process. Technol. 2001, 211, 2132–2139. [Google Scholar] [CrossRef]
  20. Bebiano, D.; Alfaro, S.C. A weld defects detection system based on a spectrometer. Sensors 2009, 9, 2851–2861. [Google Scholar] [CrossRef] [Green Version]
  21. Cobo, A.; Mirapeix, J.; Linares, F.; Piney, J.A.; Solana, D.; Lopez-Higuera, J.M. Spectroscopic sensor system for quality assurance of the tube-to-tubesheet welding process in nuclear steam generators. IEEE Sens. J. 2007, 7, 1219–1224. [Google Scholar] [CrossRef]
  22. Sibillano, T.; Ancona, A.; Berardi, V.; Schingaro, E.; Basile, G.; Lugara, P. Optical detection of conduction/keyhole mode transition in laser welding. J. Mater. Process. Technol. 2007, 191, 364–367. [Google Scholar] [CrossRef]
  23. Ferrara, M.; Ancona, A.; Lugara, P.M.; Sibilano, M. Online quality monitoring of welding processes by means of plasma optical spectroscopy. In Advanced High-Power Lasers and Applications, International Society for Optics and Photonics; SPIE: Bellingham, WA, USA, 2000; Volume 3888, pp. 750–758. [Google Scholar]
  24. Sforza, P.; de Blasiis, D. On-line optical monitoring system for arc welding. NDT E Int. 2002, 35, 37–43. [Google Scholar] [CrossRef]
  25. Mirapeix, J.; Cobo, A.; Fuentes, J.; Davila, M.; Etayo, J.M.; Lopez-Higuera, J.M. Use of the plasma spectrum rms signal for arc-welding diagnostics. Sensors 2009, 9, 5263–5276. [Google Scholar] [CrossRef] [PubMed] [Green Version]
  26. Mirapeix, J.; Ruiz-Lombera, R.; Valdiande, J.J.; Lopez-Higuera, J.M. Colorimetric analysis for on-line arc-welding diagnostics by means of plasma optical spectroscopy. IEEE Sens. J. 2015, 16, 3465–3471. [Google Scholar] [CrossRef] [Green Version]
  27. Robertson, A.R. Computation of correlated color temperature and distribution temperature. J. Opt. Soc. Am. 1968, 58, 1528–1535. [Google Scholar] [CrossRef]
  28. Rodriguez-Cobo, L.; Ruiz-Lombera, R.; Conde, O.M.; López-Higuera, J.M.; Cobo, A.; Mirapeix, J. Feasibility study of Hierarchical Temporal Memories applied to welding diagnostics. Sens. Actuator A Phys. 2013, 204, 58–66. [Google Scholar] [CrossRef]
  29. Alfaro, S.C.; Mendonça, D.d.S.; Matos, M.S. Emission spectrometry evaluation in arc welding monitoring system. J. Mater. Process. Technol. 2006, 179, 219–224. [Google Scholar] [CrossRef]
  30. Yilbas, B.; Hassan, G.; Ali, H.; Al-Aqeeli, N. Environmental dust effects on aluminum surfaces in humid air ambient. Sci. Rep. 2017, 7, 45999. [Google Scholar] [CrossRef] [Green Version]
Figure 1. Schematic representation of the designed welding monitoring system incorporating the following sensors: (1) welding voltage, (2) welding current, (3) plasma optical spectroscopy-based, (4) protection gas flow rate, (5) wire feed speed, (6) welding speed and position and (7) temperature and humidity sensors.
Applsci 12 05022 g001
Figure 2. Images of the MIG welding process of Al-Mg alloy sheets. (a) Detail of the welding torch and the optical fiber used during the trials. (b) Preparation of the sheets before the welding process.
Applsci 12 05022 g002
Figure 3. Output monitoring profiles for Weld Trials #1 and #2 using different spectroscopic parameters. Plasma RMS signal (thick blue line) and color temperature (thin green line) associated with (a) Trial #1 and (b) Trial #2. Ratio of H I line (656 nm) to Al I line (396 nm) (thick blue line) and 670 nm (thin green line) associated with (c) Trial #1 and (d) Trial #2. Ratio of Na I line (589 nm) to Al I line (396 nm) (thick blue line) and 670 nm (thin green line) associated with (e) Trial #1 and (f) Trial #2.
Applsci 12 05022 g003
Figure 4. Output monitoring profiles for Weld Trials #7 and #9 (final part) using different spectroscopic parameters. Plasma RMS signal (thick blue line) and color temperature (thin green line) associated with (a) Trial #7 and (b) Trial #9. Ratio of H I line (656 nm) to Al I lines at 396 nm (thick blue line) and 670 nm (thin green line) associated with (c) Trial #7 and (d) Trial #9. Ratio of Ar I line (738 nm) to Ar I (763 nm) lines associated with (e) Trial #7 and (f) Trial #9.
Applsci 12 05022 g004
Figure 5. Welding spectra captured during Weld Trial #9: spectra associated with correct welding (blue line) and process contamination (orange line). Inlay: detail of the variation in the intensity of the H I line at 656.2 nm.
Applsci 12 05022 g005
Figure 6. Output monitoring profiles for Weld Trials #4 and #8 using different spectroscopic and electrical parameters. Ratio of Ar I line (738 nm) to Ar I (763 nm) line associated with (a) Trial #4 and (b) Trial #8. Ratio of H I line (656 nm) to Al I lines at 396 nm (thick blue line) and 670 nm (thin green line) associated with (c) Trial #4 and (d) Trial #8. Welding voltage (thick blue line) and current (thin green line) associated with (e) Trial #4 and (f) Trial #8.
Applsci 12 05022 g006
Figure 7. Output monitoring profiles for Tankers #1, #2 and #3. (a) Welding voltage (blue), current (green), gas flow rate (red) and wire feed speed (light blue) for Tanker #1. (b) Ratio of H I line (656 nm) to an average of the Al I lines profile for Tanker #1. (c) Welding voltage (blue), current (green), gas flow rate (red) and wire feed speed (light blue) for Tanker #2. (d) Ratio of H I line (656 nm) to an average of the Al I lines profile for Tanker #2. (e) Welding voltage (blue), current (green), gas flow rate (red) and wire feed speed (light blue) for Tanker #3. (f) Ratio of H I line (656 nm) to an average of the Al I lines profile for Tanker #3.
Applsci 12 05022 g007
Figure 8. Output monitoring profiles for Tanker #2, seams 215712, 221219 and 222940. (a) Ratio of Mg I (553 nm) to an average of the Mg lines profile for the three seams. (b) Ratio of H I (656 nm) to an average of the Al I lines profile for the three seams.
Applsci 12 05022 g008
Table 1. Chemical composition (weight %) of AA5186 (H111).
SiFeCuMnMgCrZnTiAl
0.14000.18800.04800.34904.67300.00200.00200.0180--
Table 2. Welding trials. The experimental conditions for correct welding were: welding current, 220 A; process speed, 400 mm/min; protection gas flow rate, 22 L/min.
Weld Trial NºStudy ParameterDefects (X-ray)
1Correct weldingUndercuts/Ex. penetration
2Correct weldingUndercuts/Porosities
3Water inclusionUndercuts/Porosities
4Oil inclusionUndercuts/Porosities
5Solvent inclusionPorosities/Ex. penetration
6Welding current/Feed Wire SpeedPorosities
7Gas flow rate/Dry compressed airUndercuts/Porosities
8Joint preparation/Stand-off distance--
9Process speed/Water and oil inclusions (backing)Undercuts/PorositiesEx. Penetration/Cracks
Publisher’s Note: MDPI stays neutral with regard to jurisdictional claims in published maps and institutional affiliations.

