Article

Damage Detection of Insulators in Catenary Based on Deep Learning and Zernike Moment Algorithms

School of Electrical Engineering, Beijing Jiaotong University, Beijing 100044, China
*
Authors to whom correspondence should be addressed.
Appl. Sci. 2022, 12(10), 5004; https://doi.org/10.3390/app12105004
Submission received: 22 April 2022 / Revised: 11 May 2022 / Accepted: 13 May 2022 / Published: 16 May 2022

Abstract

:
The intelligent damage detection of catenary insulators is one of the key steps in maintaining the safe and stable operation of railway traction power supply systems. However, traditional deep learning algorithms need to train a large number of images with damage features, which are hard to obtain; and feature-matching algorithms have limitations in anti-complex background interference, affecting the accuracy of damage detection. The current work proposes a method that combines deep learning and Zernike moment algorithms. The Mask R-CNN algorithm is firstly used to identify the catenary insulators to realize the region proposal of the insulators. After image preprocessing, the Zernike moment algorithm is used to replace the existing Hu moment algorithm to extract more detailed insulator contour features, then the similarity value and its standard deviation are further calculated, so as to complete the damage detection of the catenary insulator. The experimental results show that the mean average precision of insulator identification can reach 96.4%, and the Zernike moment algorithm has an accuracy of 93.36% in judging the damage of insulators. Compared with the existing Hu moment algorithm, the accuracy is increased by 10.94%, which provides a new method for the automatic detection of damaged insulators in catenary and even other scenarios.

1. Introduction

The insulator is an important piece of equipment that provides mechanical support and electrical insulation in the catenary [1,2], and its status directly affects whether the railway power supply system can work normally. Typical defects of catenary insulators include surface contamination caused by the natural environment, aging caused by long-term electromechanical loads, flashover caused by increased humidity and icing, cracks caused by temperature changes, and damage caused by external forces such as hail and debris impacts [3]. Among them, contamination, flashover, and natural aging of catenary insulators can be avoided by regular cleaning and replacement, while the cracking and damage of insulators will not only affect the insulation characteristics of the power line, but also affect the service life of the entire traction network, undermine the safety and stability of the railway power supply system, and even interrupt the operation of the railway [4].
The traditional insulator damage-detection method mainly relies on manual inspection with large workloads and low detection efficiency [5]; this method cannot find and deal with the insulator fault in time, affecting the safety of the whole traction power supply system [6]. With the rapid development of high-speed railway monitoring and fault detection technology, such as the monitoring and detection of the insulation components of the catenary in 6C systems applied in China railway since 2012, intelligent detection methods of railway catenary insulator damage have been used [7].
In the past, various intelligent detection methods based on images have been studied. The proposed detection methods can be divided into feature extraction methods [8,9,10], deep learning methods [6,11,12,13], and deep learning and feature extraction combined methods [14,15,16]. For example, a Harris corner matching and spectral clustering method is proposed to achieve fault detection of catenary insulators [9], but this method is easily affected by image brightness and complex environmental background. A catenary insulator fault detection algorithm is proposed based on YOLOv5 [12], but a large number of damaged insulator samples are needed to improve the accuracy of the algorithm. Moreover, as a small target in the image, it is difficult to judge whether the insulator is damaged with high accuracy [15] proposed to use the EAST model to locate the insulator firstly, then extract the contour of the insulator piece, and use the Hu invariant moment to compare the similarity between the insulator pieces to judge whether it is damaged or not. It is less affected by complex environmental backgrounds and does not need a large number of damaged insulator image samples, but for insulator photos taken from the front, the extracted contours of insulator pieces are thin, and the Hu moment algorithm will produce deviation and misjudgment when calculating the contour features of such cases. Therefore, it still needs to be improved in the description of contour details.
To sum up, there are three main problems to be improved and solved in the intelligent detection method of damaged catenary insulators:
  • The traditional non-deep learning feature-extraction algorithm is prone to misjudge under the influence of complex environment and image brightness differences, and its reliability is not strong;
  • The insulator damage-detection method completely based on deep learning needs to rely on a large number of damaged insulator samples, which has high requirements for the scope and workload of image acquisition;
  • The features extracted by some characteristic moment algorithms based on insulator contours are not detailed enough, and there is still room for improvement in accuracy.
Aiming at the above problems, this paper proposes a catenary insulator damage-detection method based on deep learning and Zernike moment algorithms. Firstly, the catenary insulators are identified and positioned by the Mask R-CNN algorithm, and the insulator image is further cropped. Secondly, the insulator image is binarized and the contour is extracted. Thirdly, Zernike moments are calculated according to the obtained contours of the insulator pieces, which are described in detail. Finally, the damage judgment of catenary insulators is completed by calculating the similarity value and similarity standard deviation between insulator pieces. This method combines the advantage of the Mask R-CNN algorithm in small target identification, which is less affected by the complex background of the image, and the advantage of the Zernike moment algorithm in feature detail extraction, which has low requirements for the number of samples and strong ability to describe the contour details, so as to achieve the effect of high accuracy of catenary insulator damage detection.

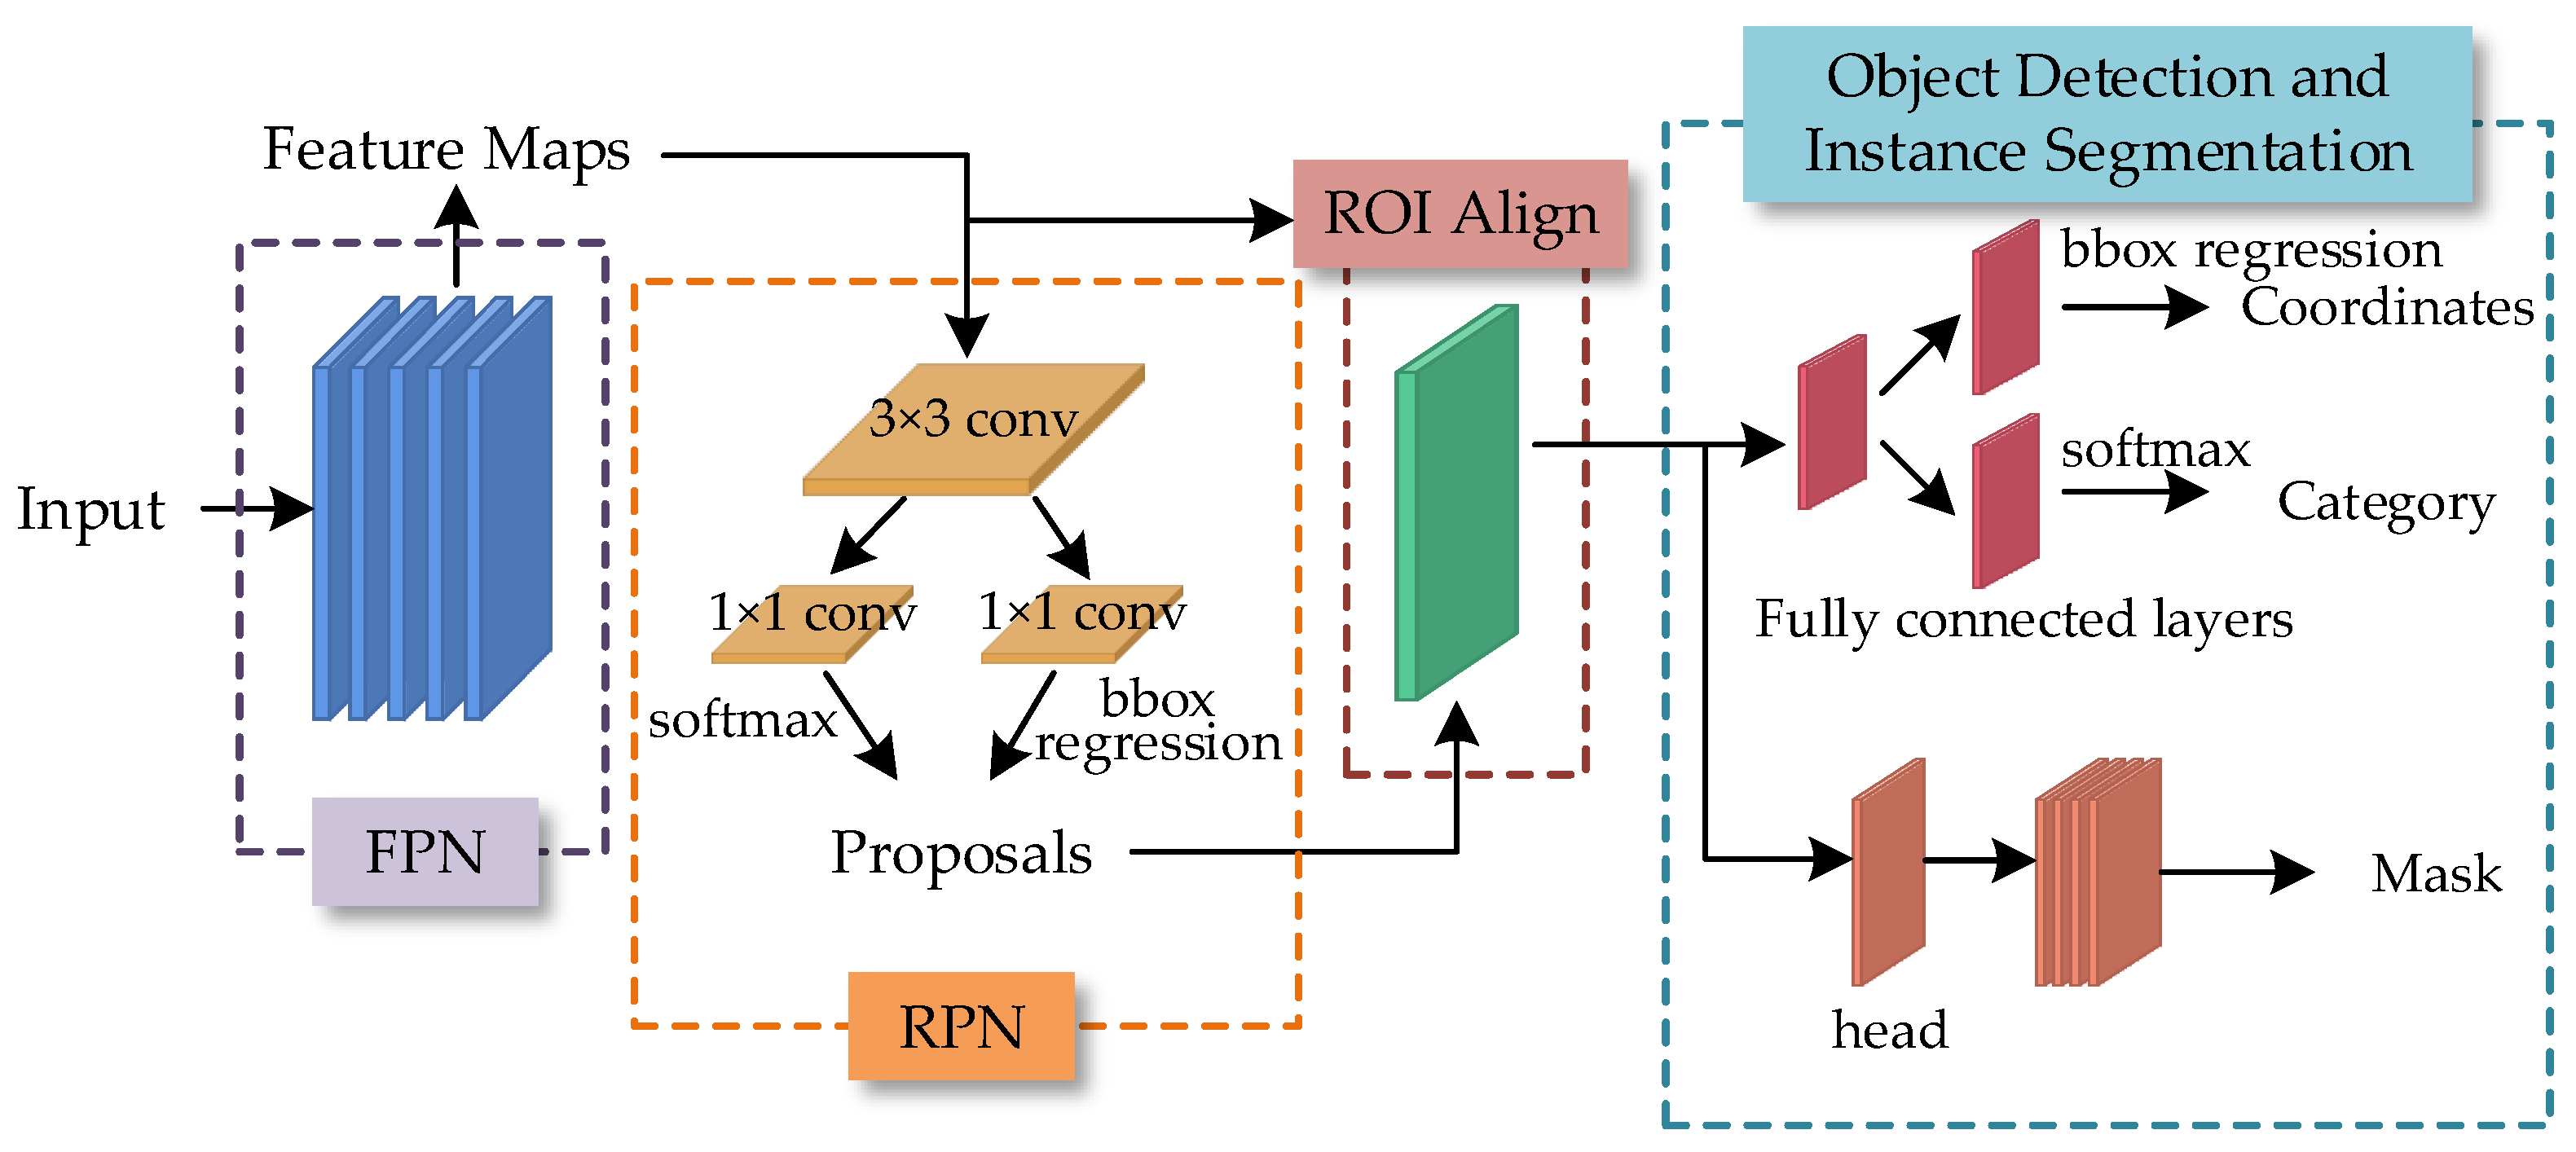
2. Insulator Identification and Location Based on Mask R-CNN

In general, catenary insulators occupy a small area in the image, which puts forward high requirements for the accuracy of deep learning algorithms. Table 1 compares and analyzes the existing state-of-the-art deep learning algorithms, including the single-stage object detection algorithms SSD (Single Shot MultiBox Detector) and YOLO (You Only Look Once) [17], and the two-stage object detection algorithms Faster R-CNN and Mask R-CNN.
The SSD algorithm and YOLO algorithm have relatively low accuracy in small target detection [18], while the Faster R-CNN algorithm adopts the quantitative rounding method in an ROI Pooling layer, which will produce feature dislocation and errors in small-target detection that needs to be accurate to pixel level. Therefore, considering these aspects, the Mask R-CNN algorithm is selected in this paper.
The Mask R-CNN algorithm was first proposed in 2017 [19] and is mainly used in the fields of object detection and instance segmentation. It is improved from the previously proposed Faster R-CNN algorithm. On the one hand, bilinear interpolation is used in the ROI Align layer to solve the problem of misalignment. On the other hand, a pixel-level instance segmentation mask branch is added to achieve pixel-level object detection. Finally, the network loss is unified in target detection, thereby improving the accuracy, so it has certain advantages in small target detection [20]. The Mask R-CNN algorithm is used to propose the region of the insulator in the image, which can narrow the target range with high precision before detecting the damaged state of the insulator, and removes the interference caused by other catenary structures to the subsequent Zernike moment feature calculation.

2.1. Network Structure

The network structure of Mask R-CNN algorithm mainly includes four parts: the feature pyramid network (FPN), region proposal network (RPN), ROI Align (Region of Interest Align), and target detection and instance segmentation [21,22,23]. The specific network structure for catenary insulator identification is shown in Figure 1.
The main function of the Feature Pyramid Network (FPN) is to distinguish targets with different sizes in the image and different features of targets [19]. As shown in Figure 2, the pyramid network structure is used to convolute and pool the image, extract feature maps with different sizes, and then use 1 × 1 Size convolution kernel to reduce the dimension of the features, so that the number of feature maps in each stage is the same. Then, the up-sampling operation is used to make the size of the feature maps the same, so as to realize the fusion of different size feature maps in each stage. The original Mask R-CNN algorithm used ResNet101 as the backbone of the feature pyramid network, which has about 44.5 × 10⁶ parameters and 8 × 10⁹ FLOPs, while the relatively simple ResNet50 has only about 25.5 × 10⁶ parameters and 4 × 10⁹ FLOPs. Considering the real-time and robustness of the algorithm, ResNet101 is replaced by ResNet50 in this paper [24].
The main role of the Region Proposal Network (RPN) is to calculate the candidate box to represent the position of the object in the image. The feature map output by the FPN layer is used as the input of the RPN layer. First, a 3 × 3 shared convolution operation is performed for each feature map, and then two different sliding windows are processed, one of which uses softmax to distinguish the foreground and background, and the other is used to calculate the offset of bounding box regression in order to get accurate proposals. The final proposal layer integrates the foreground anchors and the offsets of the bounding box regression to obtain proposals, and at the same time removes proposals that are too small and beyond the boundary. At this point, the function of target positioning is completed.
Since the regions of interest output by the RPN layer are of different sizes, that is, the corresponding feature map regions are of different sizes, and the final classifier can only process the feature map regions of the same size, the ROI Align layer is added to solve this problem. The ROI Pooling layer has the same function in the previously proposed Faster R-CNN algorithm, which unifies the size of the feature map to a × a by pooling. When the size of the RPN output box cannot be divisible by a, the quantitative rounding operation is carried out so that the input and output pixels cannot be guaranteed to correspond one-to-one, which will further cause the misalignment problem of regions of interest. However, the ROI Align layer in the Mask R-CNN algorithm adopted in this paper uses bilinear interpolation to replace quantitative rounding, and turns the discrete pooling into continuous [25], which solves this problem and enables the target detection to be accurate to the pixel level.
Finally, in the target detection and instance segmentation step, the target coordinates are determined by bounding box regression, and the category is determined by softmax. In addition, a mask branch is added to improve the resolution and reduce the number of channels through deconvolution and finally output a larger size mask, so as to complete the accurate segmentation of the instance.

2.2. Model Output

The loss function is an important function to judge whether the algorithm converges. By reducing the value of the loss function, the accuracy of the algorithm’s classification prediction can be improved. As shown in Equation (1), the loss function of the Mask R-CNN algorithm mainly consists of five items: one part is the foreground/background classification loss Lrpn_cls and the target frame regression loss Lrpn_bbox generated by the region proposal network (RPN), the other part is the classification loss Lcls, regression loss Lbbox and instance segmentation loss Lmask caused by ROI classification branch network.
L = L rpn _ cls + L rpn _ bbox + L cls + L bbox + L mask
After the insulator identification model based on the Mask R-CNN algorithm converges, the minimum circumscribed rectangle is designed and cut according to the mask predicted by the algorithm, and the inclined insulator is automatically rotated to the horizontal position for later judgment of insulator damage.

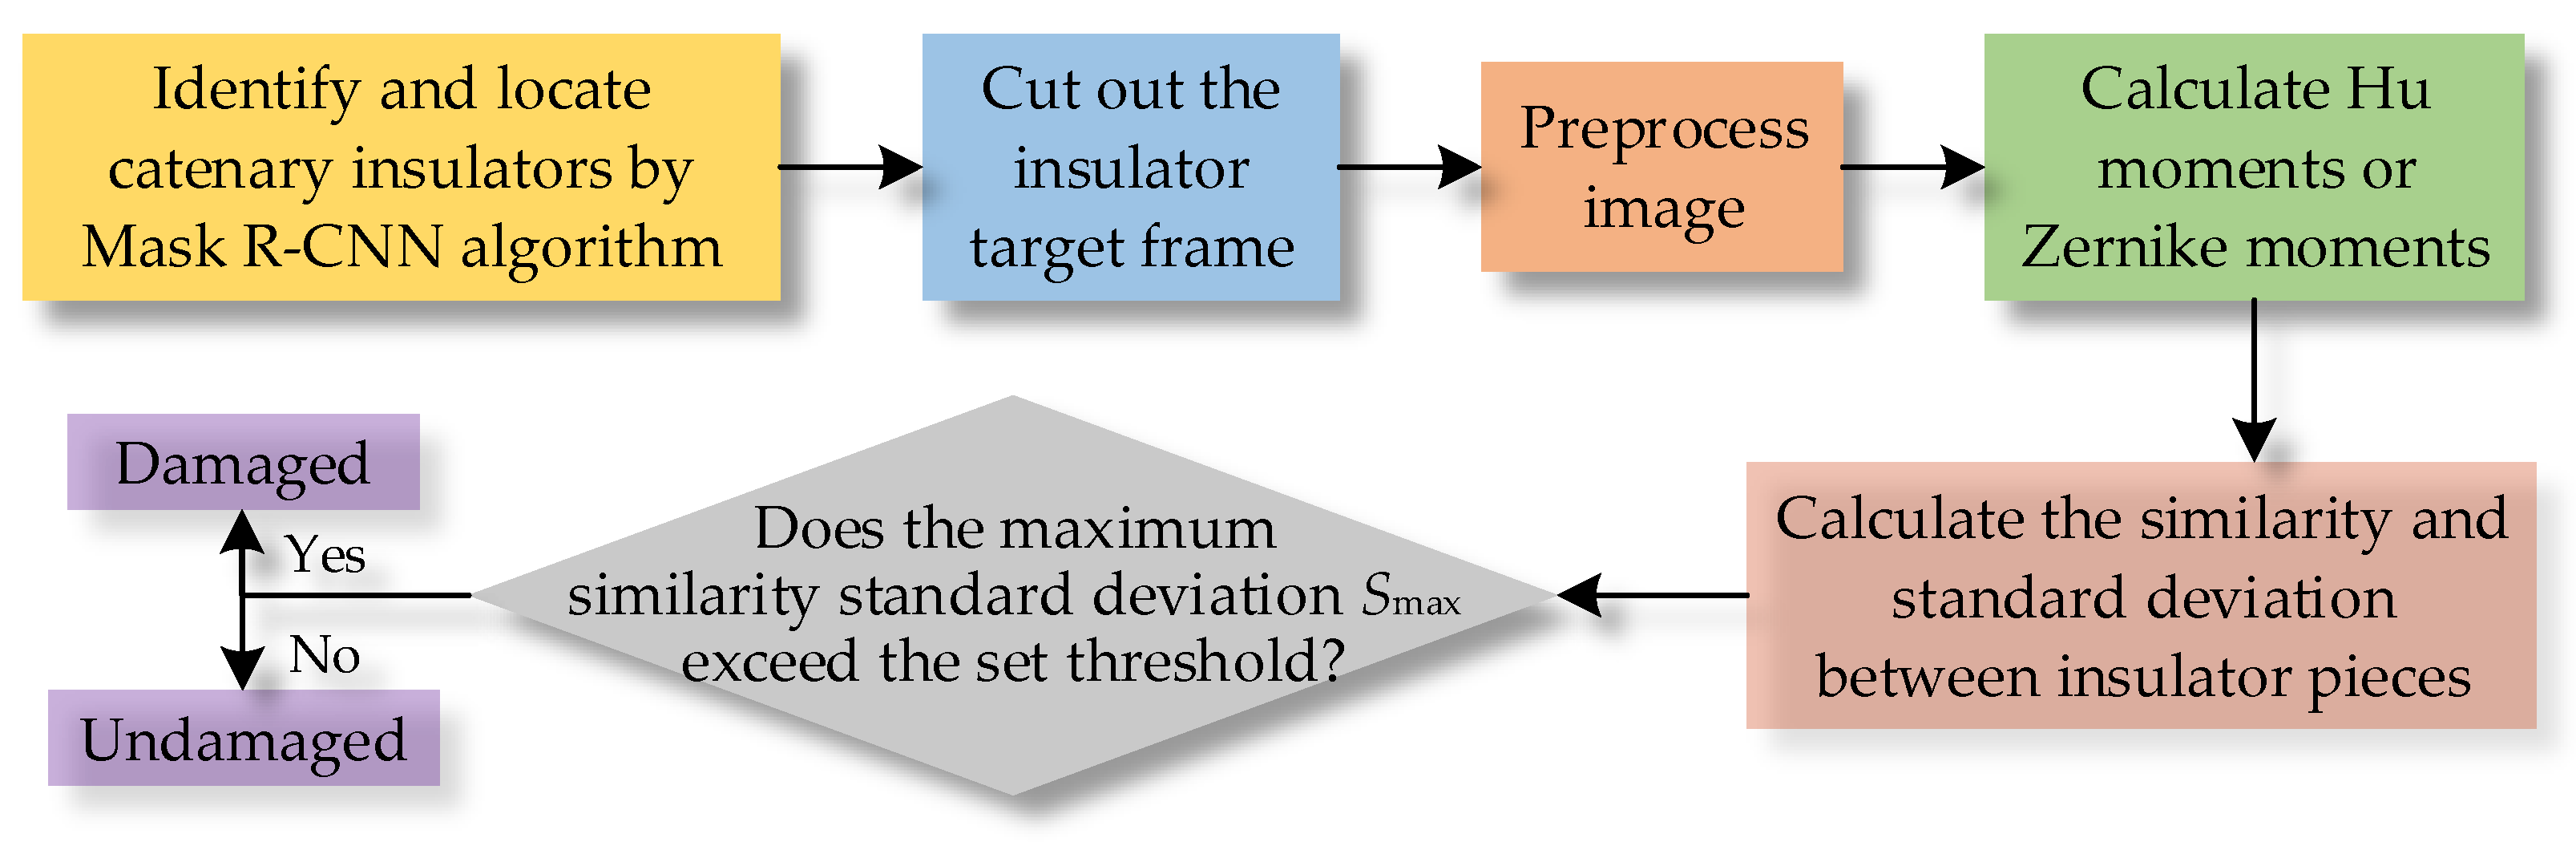
3. Insulator Damage Detection Based on Zernike Moment

After the insulator is identified by the deep learning algorithm, the target range can be narrowed. However, since it is difficult to capture a large number of images of damaged insulators in catenary, and insulators usually account for a small area in the captured images, the accuracy of deep learning in judging insulator damage is limited. Therefore, theuse of non-deep learning methods is considered to complete insulator damage detection after insulators are identified.

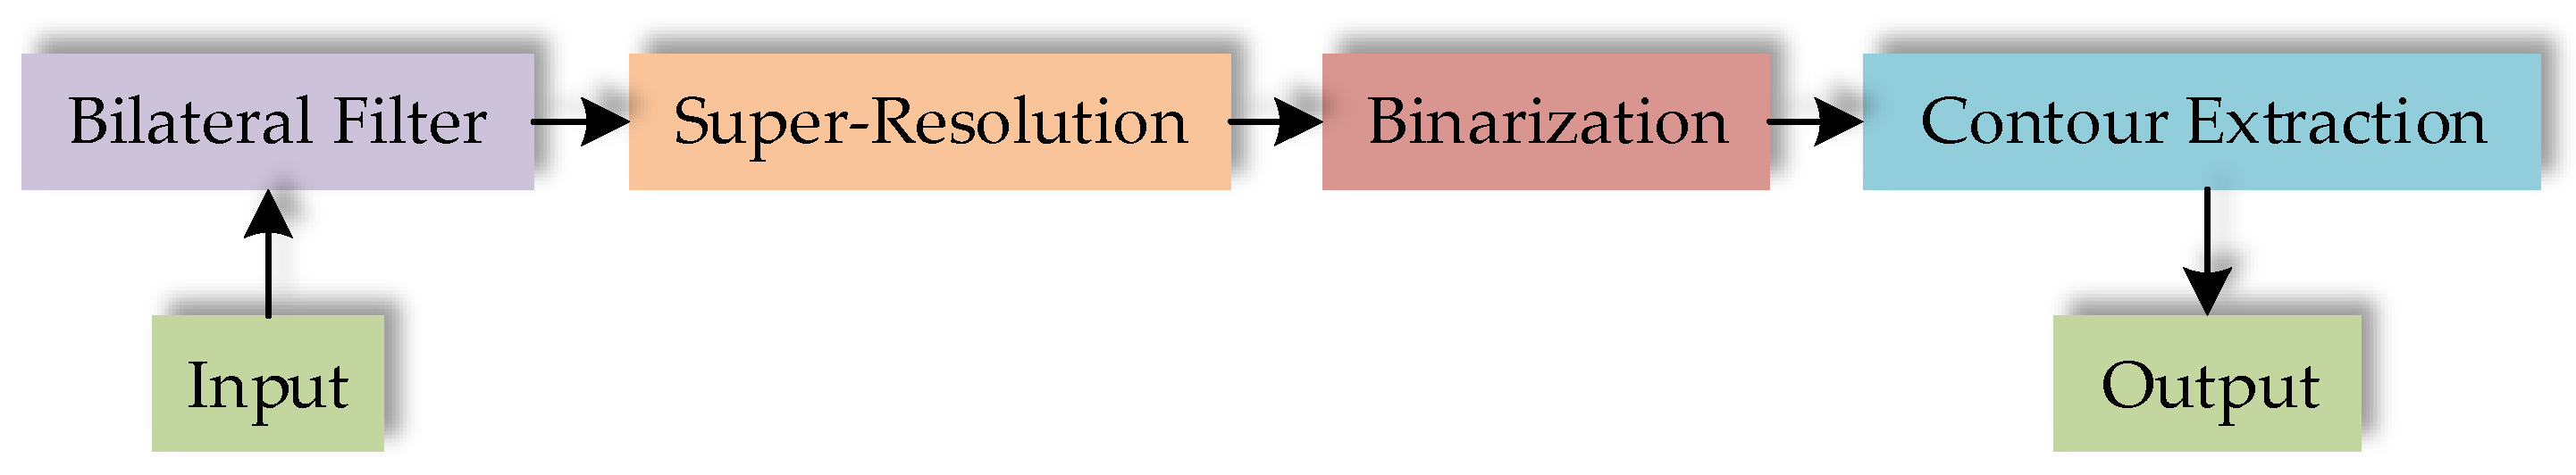
3.1. Image Preprocessing

In order to improve the accuracy of insulator damage detection and reduce the amount of calculation during detection, the image preprocessing protocol is designed in this paper, as shown in Figure 3, which mainly includes four steps: filtering, super-resolution, binarization, and contour extraction.
The filtering step adopts a bilateral filter, which is a nonlinear filter [26]. Two Gaussian basis functions are used to describe the spatial proximity and grayscale similarity of the image, respectively, so that the proximity relationship between the central pixel and the surrounding pixel in geometric space and the difference between pixel gray values can be considered at the same time. Therefore, the bilateral filter can preserve the edge characteristics on the premise of smooth denoising.
After insulator recognition and positioning, the cutout image is usually blurry due to its low resolution, which is not conducive to further judging about whether they are damaged. Therefore, it is necessary to improve the clarity of small image. In this paper, the RAISR (Rapid and Accurate Image Super-Resolution) algorithm is adopted. Figure 4 shows the process of the RAISR algorithm. The core idea behind RAISR is to enhance the quality of the bilinear interpolation method by applying a set of pre-learned filters on the image patches, which is chosen by an efficient hashing mechanism. The filters are learned based on pairs of low-resolution and high-resolution training image patches, and the hashing is done by estimating the local gradients’ statistics. Finally, in order to avoid artifacts, the initial upscaled image and its filtered version are locally blended by applying a weighted average, where the weights are a function of a structure descriptor [27,28].
In order to further extract the contour of the insulator, it is necessary to binarize the insulator image after filtering and super-resolution processing. Equation (2) describes the main principle of image binarization. When the gray value of the image pixel is less than the threshold T, it is set to 0, and when it is greater than or equal to the threshold T, it is set to 255.
g ( x , y ) = { 255 , f ( x , y ) T 0 , f ( x , y ) < T
Due to the difference in the pixel gray value of each insulator image, it is difficult to determine the threshold T during image binarization. Therefore, it is considered to use the method of dynamically adjusting the threshold T to complete the binarization of each image.
As shown in Figure 5, firstly, the initial value T0 is set to 70, and the number of insulator pieces k0 should be 11. Secondly, the image binarization and the extraction of the contours of the insulator pieces are carried out respectively, and then the number k of contours is recorded as the number of insulator pieces. In order to avoid inaccurate recording of the number k of contours due to the influence of strong light on the connecting parts between insulator pieces, the contour with height less than a certain range is ignored when it is extracted.
Finally, a judgment is made whether the number k of insulator pieces extracted is equal to the set value k0; if not, 1 is added to the threshold T, and then binarization and contour extraction until the number of insulator pieces is equal to k0; if the condition of k = k0 is not met when the threshold T is increased to 255, k0 is reduced by 1, T is restored to the initial value of 70, and then binarization and contour extraction are performed until the requirements are met.
According to the binarized image, all the contours of the insulator image can be extracted by saving the outer arc contour of the insulator piece and connecting the head and tail of the arc with a straight line [15]. Figure 6 shows the original image, binarized image, the whole contour image, and the contour extraction image of the insulator pieces. By calculating the characteristic moments of the insulator pieces’ contours shown in Figure 6d and comparing the similarity value between different pieces on the same insulator, it is possible to distinguish whether the insulators are damaged.

3.2. Hu Moment and Zernike Moment

In the process of image acquisition, it is difficult to collect a large number of damaged insulator samples, which is not conducive to the judgment of damage through deep learning and other methods. If the detailed features of the insulator pieces can be directly described in some way, it will directly reduce the need for the number of samples.
At present, the methods used to directly describe the invariant features of images mainly include Harris corner detection, Speed-Up Robust Features algorithm (SURF) [29], Scale-Invariant Feature Transform algorithm (SIFT) [30], and invariant moment. The invariant moment can better describe the geometric features of the object, and has translation, scale, rotation invariance, and uniqueness [31], which can well distinguish the damage forms of catenary insulators. The characteristic moments include complex moments, rotational moments, orthogonal moments, and geometric moments. The Hu moment and Zernike moment commonly used in pattern recognition belong to geometric moments and orthogonal moments, respectively.

3.2.1. Hu Moment

For a single-channel digital image f(x,y), its (p + q) order moment mpq and central moment μpq are expressed as:
m p q = x y x p y q f ( x , y )
μ p q = x y ( x x ¯ ) p ( y y ¯ ) q f ( x , y )
where x ¯ = m 10 / m 00 , y ¯ = m 01 / m 00 , and they represent the abscissa and ordinate of the image centroid, respectively. In addition, p, q = 0, 1, 2, …
The normalized central moment ηpq is expressed as:
η p q = μ p q μ 00 r
where r = (p + q + 2)/2 and p + q = 2, 3,…
According to the above equations and combined with the invariant moment theory, seven Hu invariant moments with rotation, scaling, and translation invariance [32,33] can be derived as:
H 1 = η 20 + η 02
H 2 = ( η 20 η 02 ) 2 + 4 η 11 2
H 3 = ( η 30 3 η 12 ) 2 + ( 3 η 21 η 03 ) 2
H 4 = ( η 30 + η 12 ) 2 + ( η 21 + η 03 ) 2
H 5 = ( η 30 3 η 12 ) ( η 30 + η 12 ) [ ( η 30 + η 12 ) 2 3 ( η 21 + η 03 ) 2 ] + ( 3 η 21 η 03 ) ( η 21 + η 03 ) [ 3 ( η 30 + η 12 ) 2 ( η 21 + η 03 ) 2 ]
H 6 = ( η 20 η 02 ) [ ( η 30 + η 12 ) 2 ( η 21 + η 03 ) 2 ] + 4 η 11 ( η 30 + η 12 ) ( η 21 + η 03 )
H 7 = ( 3 η 21 η 03 ) ( η 30 + η 21 ) [ ( η 30 + η 12 ) 2 3 ( η 21 + η 03 ) 2 ] + ( 3 η 12 η 30 ) ( η 21 + η 03 ) [ 3 ( η 30 + η 12 ) 2 ( η 21 + η 03 ) 2 ]
This has the advantage of fast calculation for the object recognition method by using feature quantities composed of Hu moments. However, the detailed description of the image is not complete due to the low order number of 7, which will lead to a low accuracy rate of insulator damage detection.

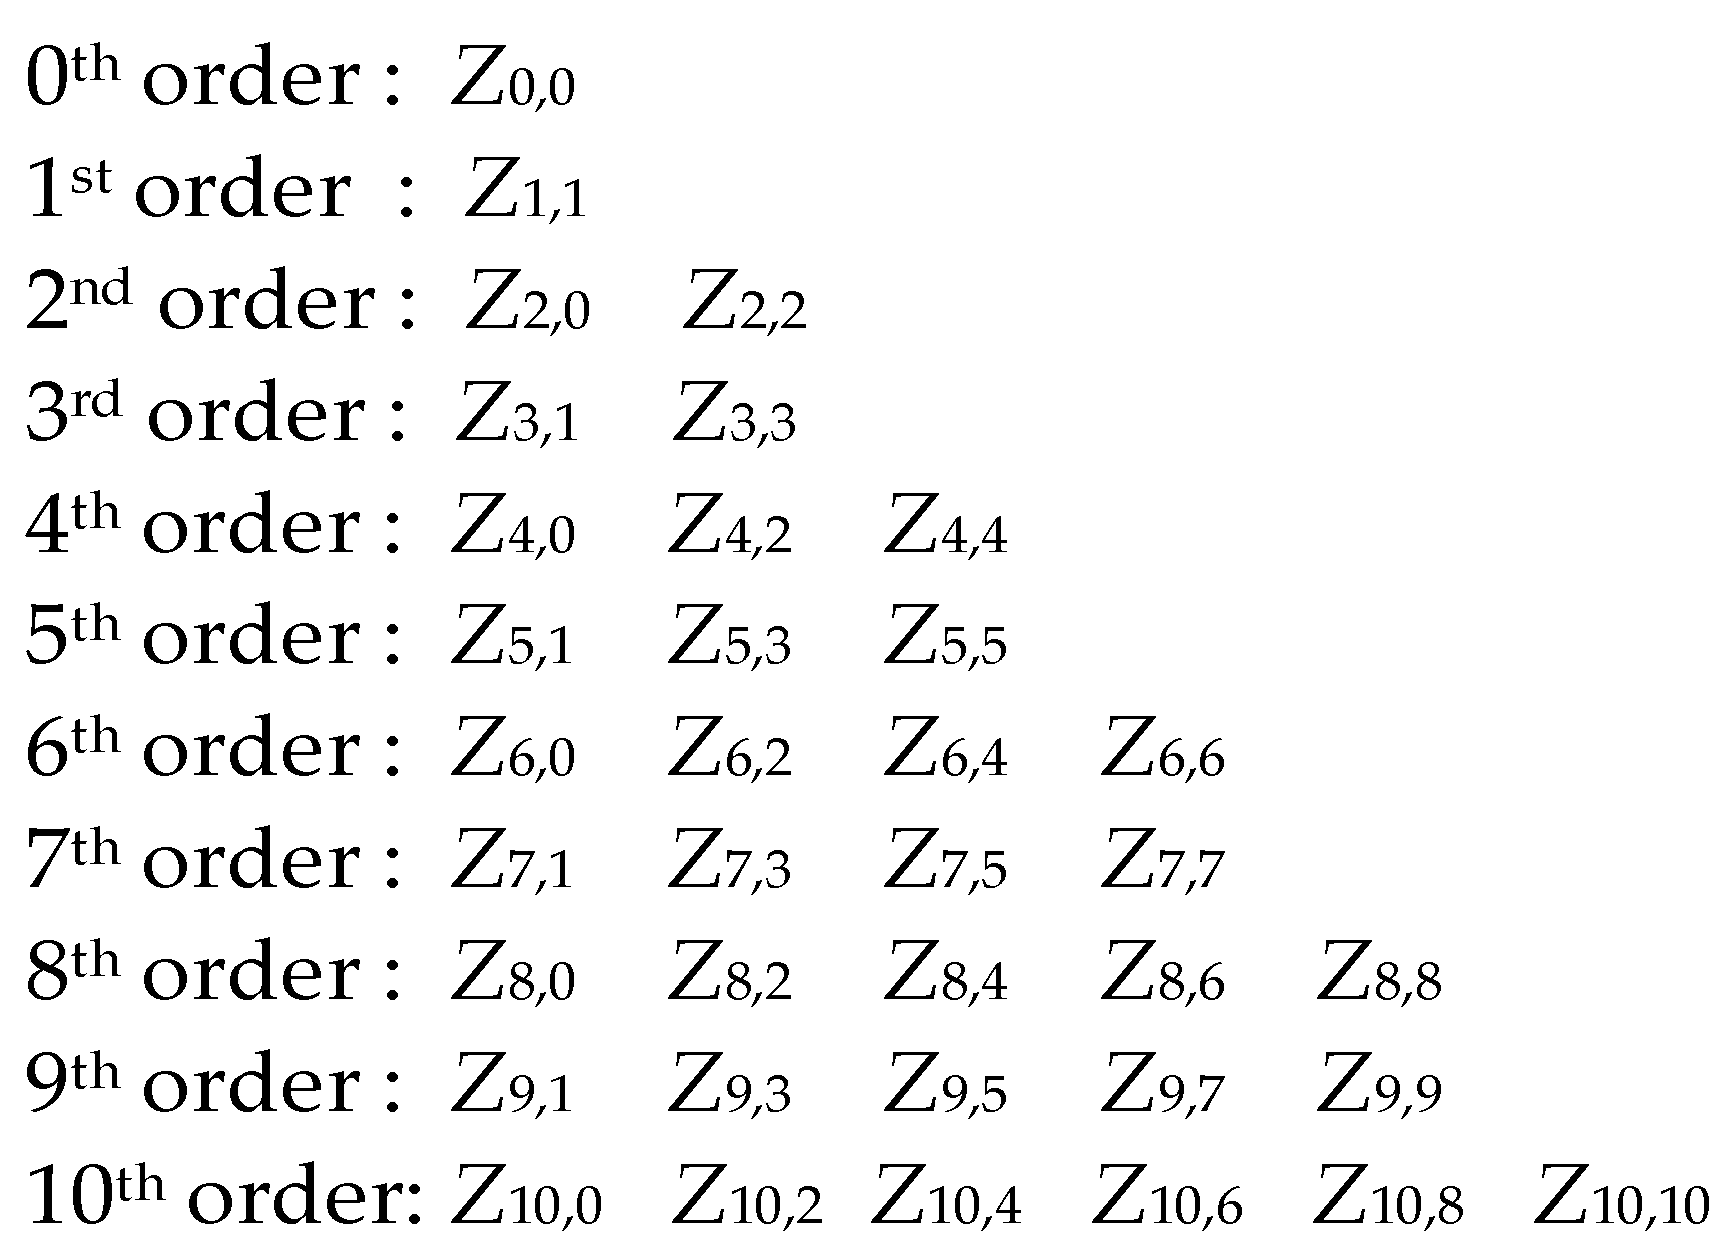
3.2.2. Zernike Moment

The Zernike moment is the projection of the image function f(x,y) on the orthogonal polynomial {Vn,m(ρ,θ)} [34]. For a single-channel digital image f(x,y), its n-order and m-degree Zernike moment is defined as [34,35,36]:
Z n , m = n + 1 λ x y f ( x , y ) V n , m * ( ρ , θ )
where n − |m| is an even number and satisfies |m| ≤ n. λ is a normalization factor, which means the number of pixels in the unit circle that the image is mapped to. * means conjugation. And the orthogonal polynomial Vn,m has orthogonality in the unit circle, which is defined as:
V n , m ( ρ , θ ) = R n , m ( ρ ) exp ( j m θ )
where Rn,m(ρ) is an orthogonal radial polynomial, which can be expressed as:
R n , m ( ρ ) = s = 0 ( n | m | ) / 2 ( 1 ) s ( n s ) ! ρ n 2 s s ! ( n + | m | 2 s ) ! ( n | m | 2 s ) !
In order to ensure the scale and translation invariance of the algorithm, the calculation origin of the image boundary points is moved to the centroid of the image and normalized at the same time, that is:
ρ = ( x x ¯ ) 2 + ( y y ¯ ) 2 max ( ( x x ¯ ) 2 + ( y y ¯ ) 2 )
θ = tan 1 ( x x ¯ y y ¯ )
Combining Equations (13)–(16), the Zernike moments of any order of single-channel digital images can be calculated. Generally speaking, low-order moments can be used to describe the basic features of the object shape, and high-order moments can be used to describe the detailed information on the object shape. Compared with the Hu moment, which can only calculate the seventh-order characteristic moments, Zernike can construct any higher order as an orthogonal moment, so it can more accurately distinguish the shape of normal insulators and damaged insulators.

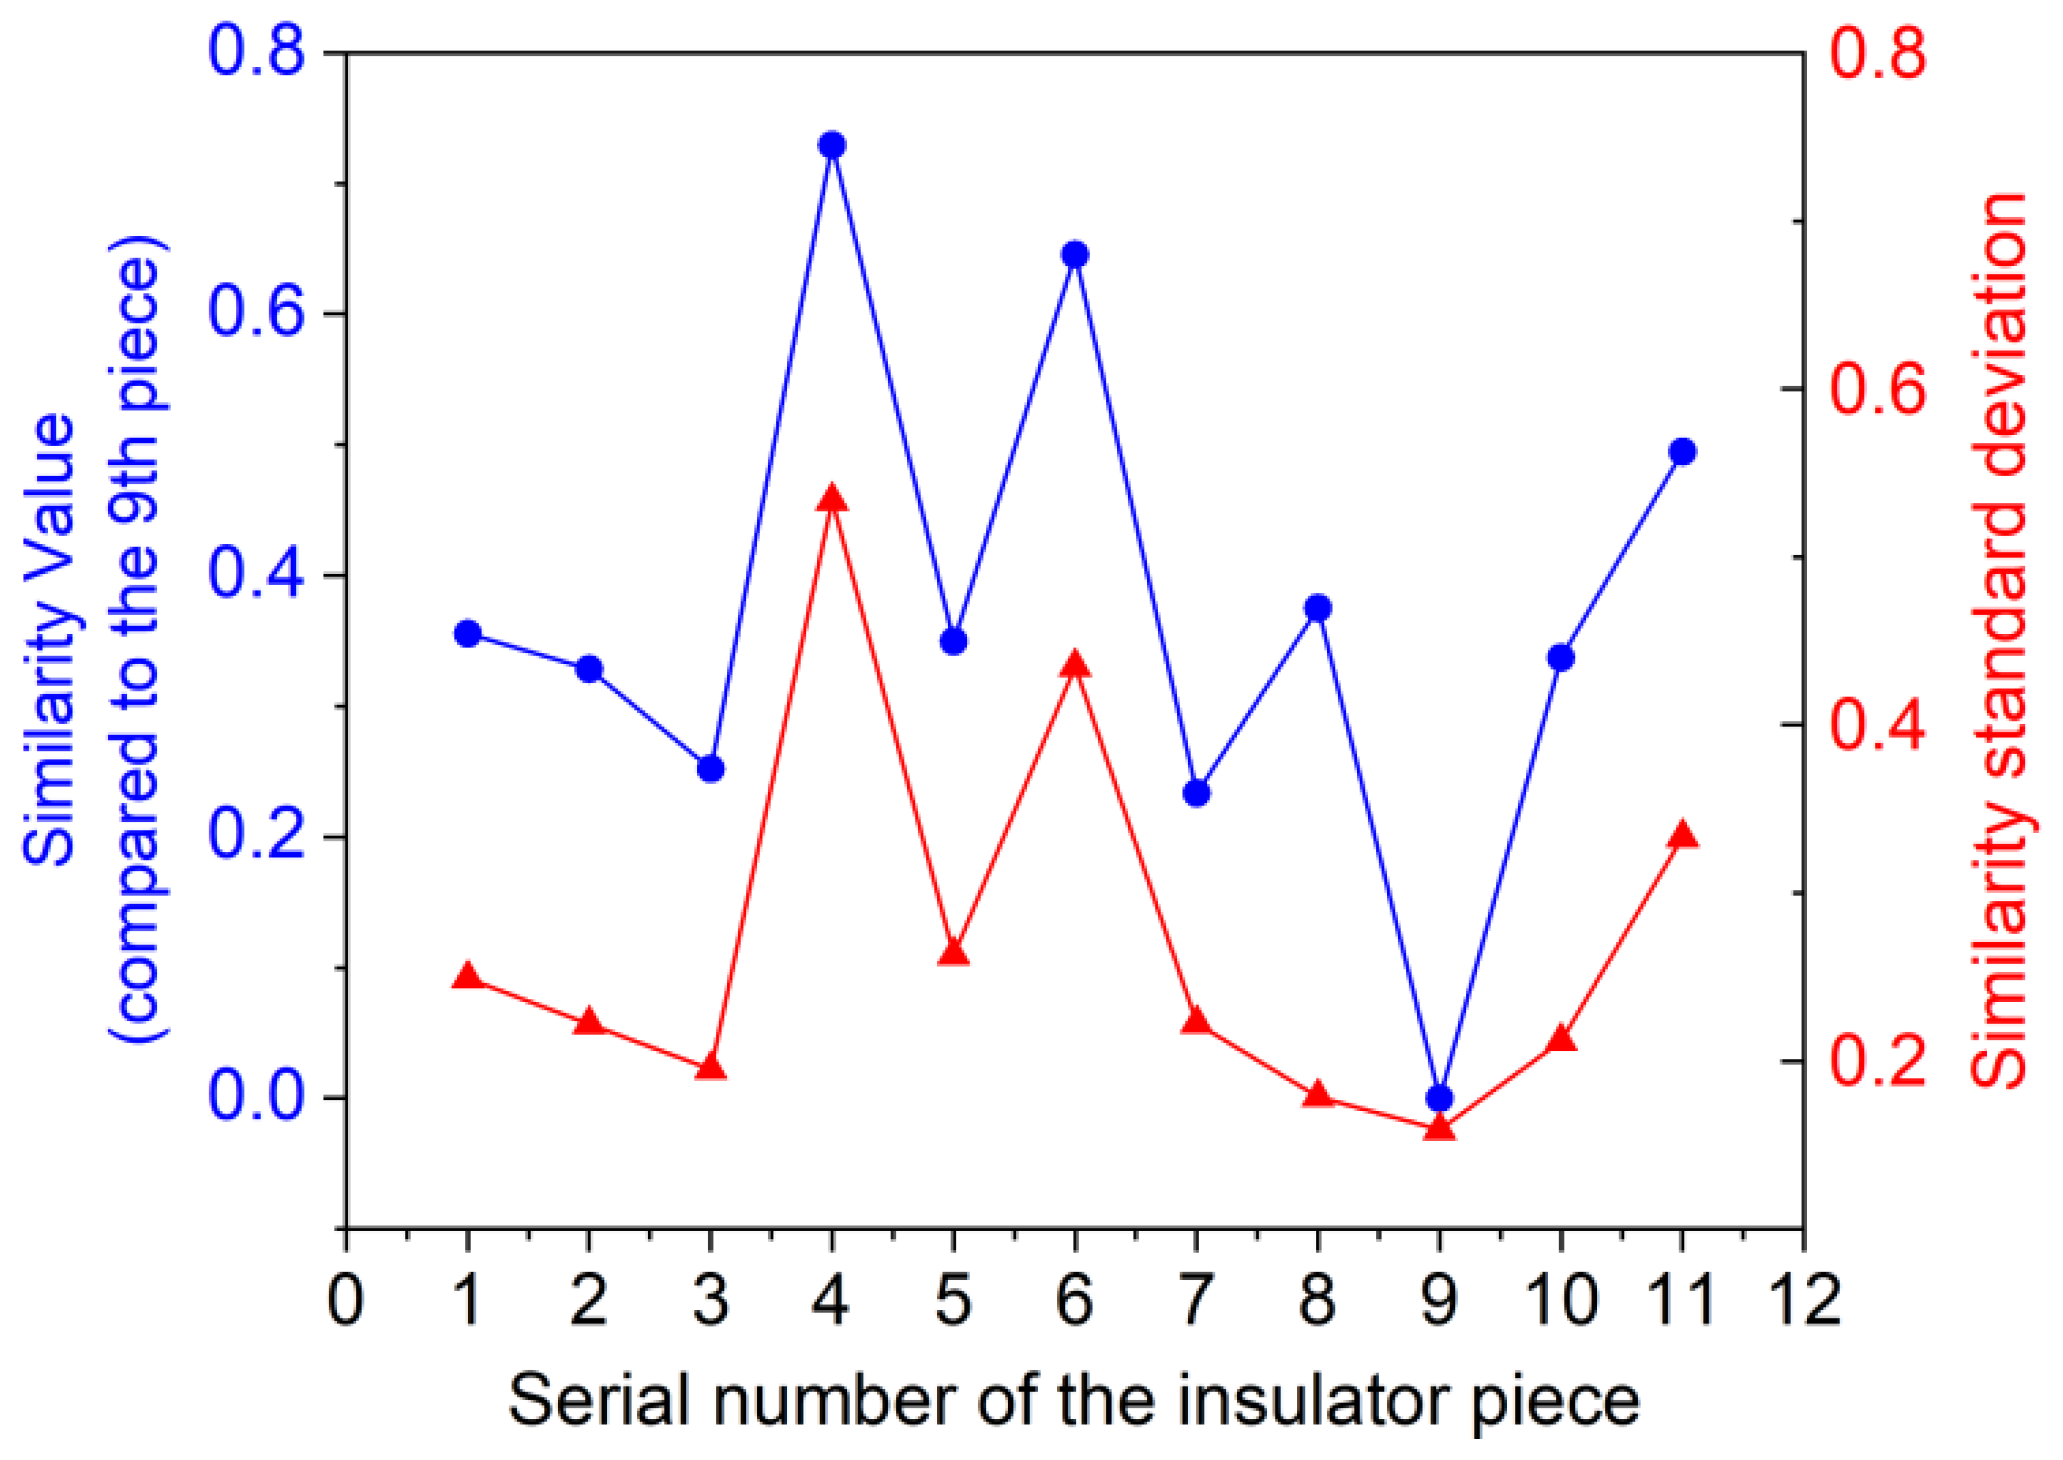
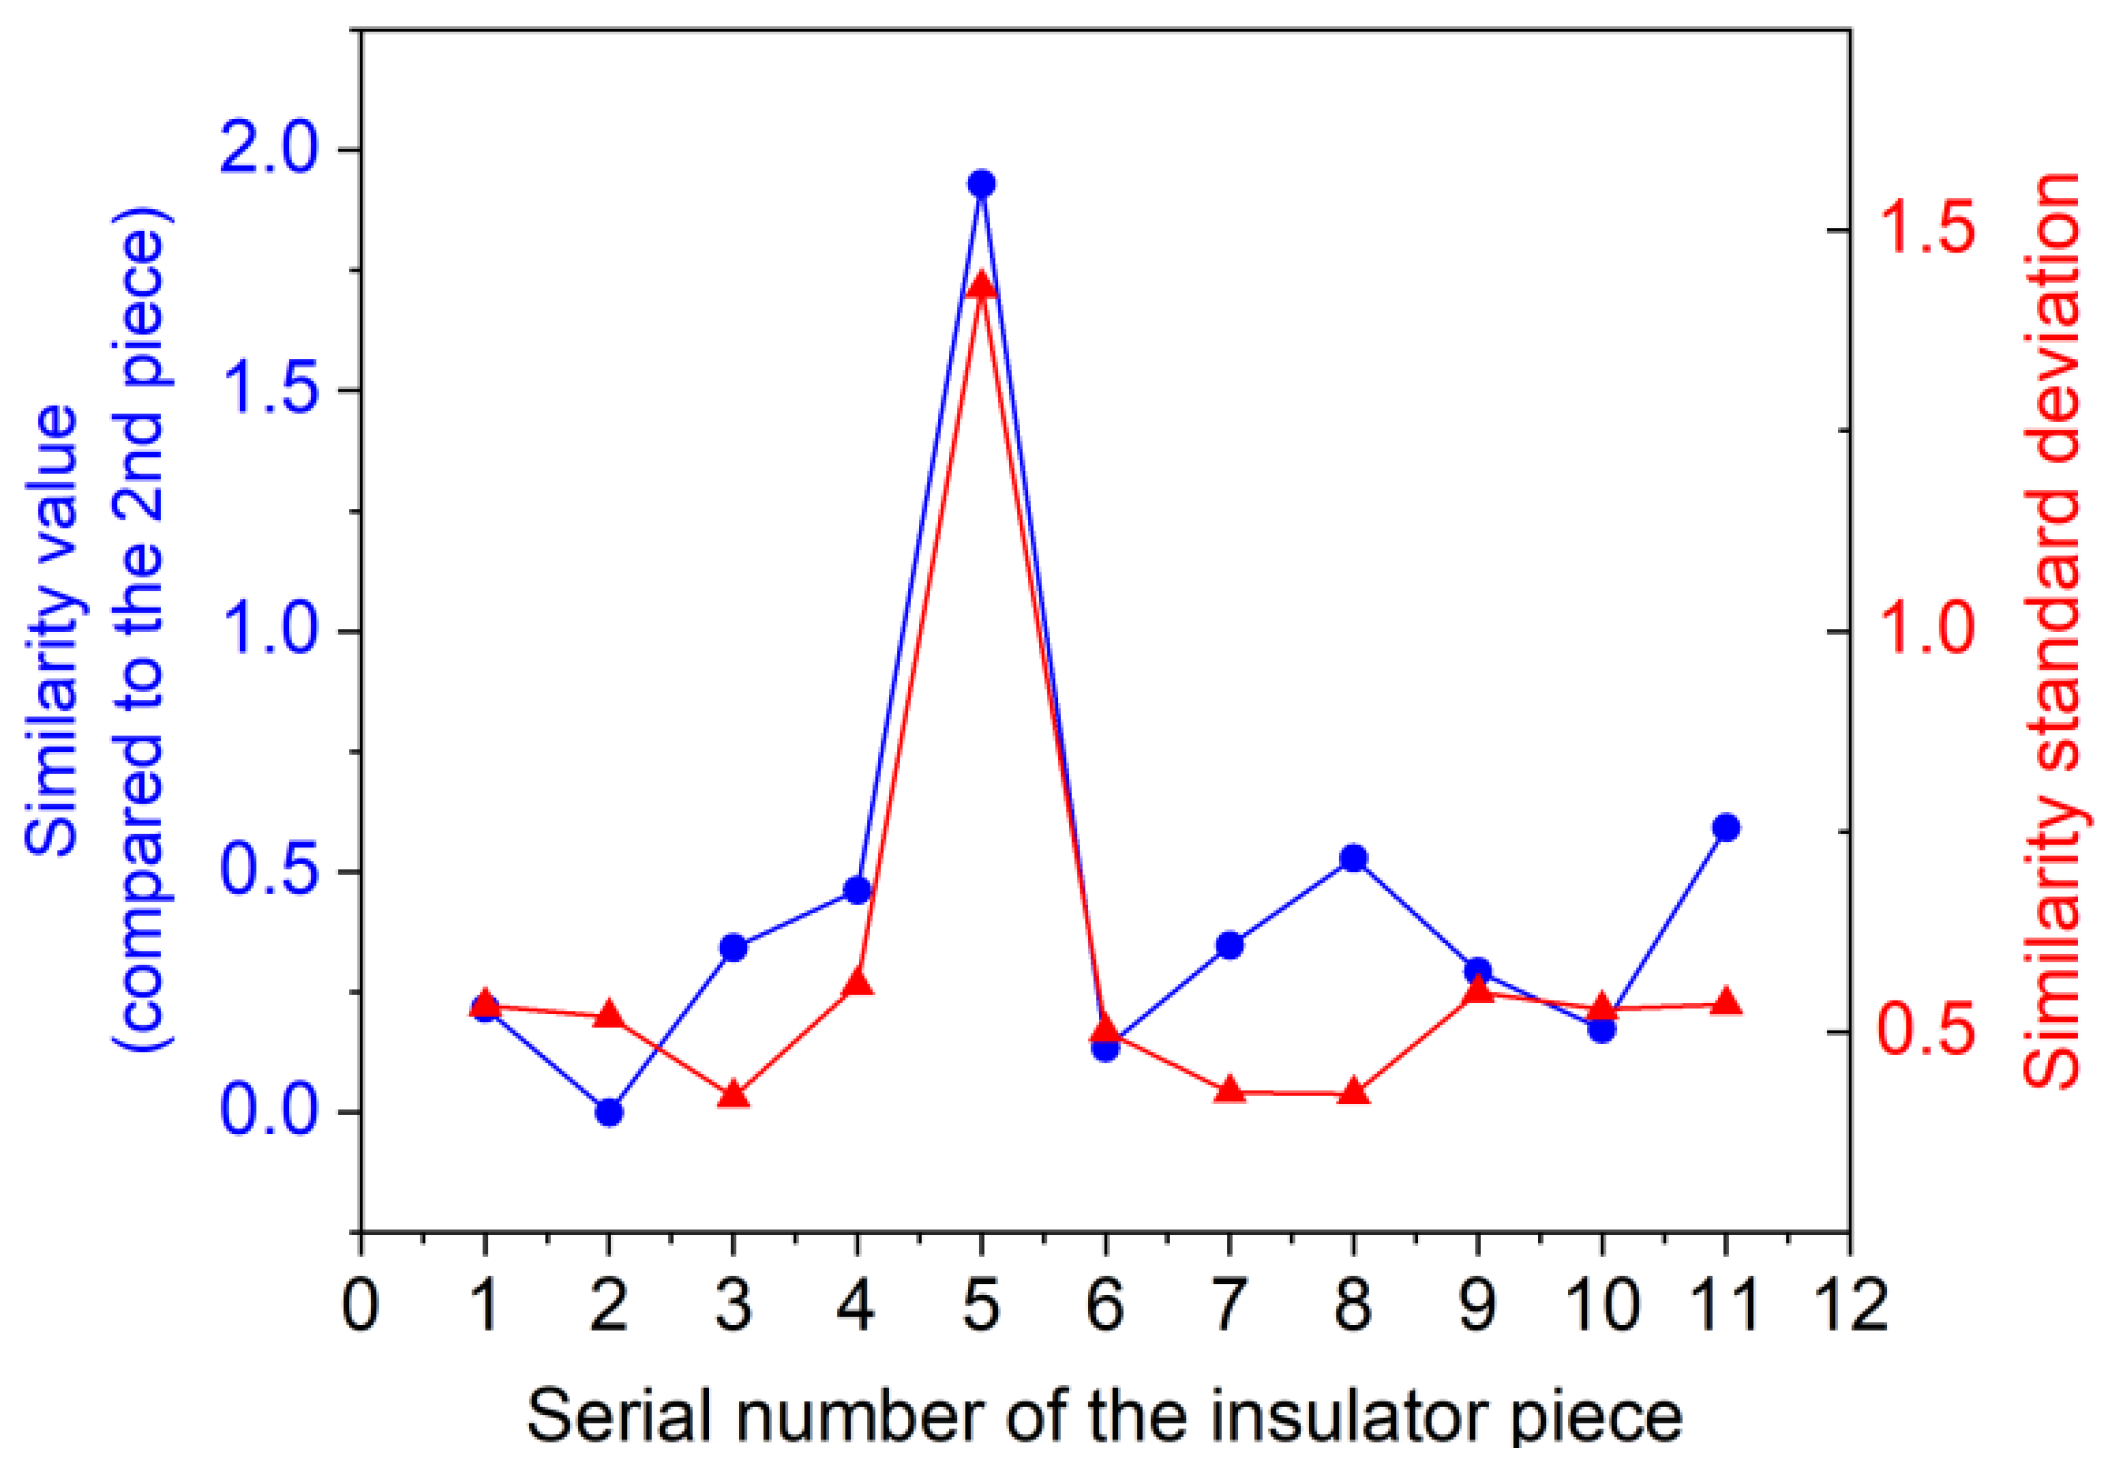
3.3. Calculation of Similarity Value and Similarity Standard Deviation

For Hu moments, the seventh-order characteristic moments calculated according to Equations (6)–(12) can further calculate the similarity value between insulator pieces A and B according to Equation (18). The larger I, the more dissimilar the two insulator pieces are.
I A , B = i = 1 7 | H i A H i B |
where H i A represents the i-th order Hu moment of insulator piece A and H i B represents the i-th order Hu moment of insulator piece B.
For Zernike moments, the characteristic moment of any higher order can be calculated according to Equation (13). Assuming that the calculation reaches the 10th order, a total of 36 Zernike moment eigenvalues, such as the eigenvalues of the zeroth order zeroth degree, the first order first degree, the second order zeroth degree, the second order second degree, and so on, can be obtained (as shown in Figure 7). The similarity value between insulator pieces A and B can be calculated by Equation (19). The larger I, the more dissimilar the two insulator pieces are.
I A , B = i = 1 36 | Z i A Z i B |
Assuming a catenary insulator has n pieces, the similarity value Ii,N−1 between the i-th insulator piece and other (N − 1) insulator pieces can be calculated according to Equation (18) or Equation (19). According to the calculation method of standard deviation, the similarity standard deviation of the i-th insulator piece can be derived:
S i = j = 1 , j i N ( I i , j I ¯ i ) N 2
where I ¯ i represents the average value of the similarity between the i-th insulator piece and the other (N − 1) insulator pieces. When Si exceeds the set threshold, it is judged that the i-th insulator piece is damaged.

4. Experimental Testing and Analysis

The experimental process is shown in Figure 8. Firstly, the Mask R-CNN algorithm is used to complete the identification of the catenary insulators. Secondly, the target frame is cropped. Thirdly, the insulator image is preprocessed. Finally, whether the insulator is damaged is detected through Zernike moments correlation calculation.

4.1. Identification and Location of Insulators

In order to verify the reliability of identifying catenary insulators based on the Mask R-CNN algorithm, 545 catenary images were selected as the sample set, of which 484 images were randomly selected as the training set, and the remaining 61 images were used as the test set. Images are annotated with LabelMe.
Due to the limited number of images collected in the experiment, direct training is prone to over-fitting, which will reduce the accuracy of the actual test. Therefore, in order to avoid the problem of over-fitting in the training process of deep learning, data enhancement methods are adopted before training, including image compression; image blurring; affine transformation (random rotation, translation and scaling); and random adjustment of brightness, saturation, and contrast.
The GPU of the experimental platform is an RTX 3090, the Pytorch framework is used for model training, and Table 2 shows the setting of hyperparameters in the training process. In addition, ResNet50 is adopted as the feature extraction network, which includes 49 convolutional layers and one fully connected layer. In terms of the complexity of the model, the number of floating-point operations (FLOPs) is about 4 × 10⁹, and the number of parameters is about 25.5 × 10⁶, which means that the model has a certain degree of real-time performance.
The curve change of the loss function is shown in Figure 9. After 1000 iterations, the value of the loss function shows a downward trend and the function curve tends to be stable, indicating that the trained Mask R-CNN model converges. After 1000 iterations, the loss function values are shown in Table 3. Using the training results for testing, setting the Intersection over Union (IoU) to 0.5, the mean Average Precision (mAP) of the model reaches 96.4%. The test results of a single image are shown in Figure 10.
It can be seen from the training and test results that the insulator identification and positioning method based on Mask R-CNN has a high accuracy rate, and the identification effect is stable in different environments, which provides a good condition for the catenary insulator damage detection or diagnosis.

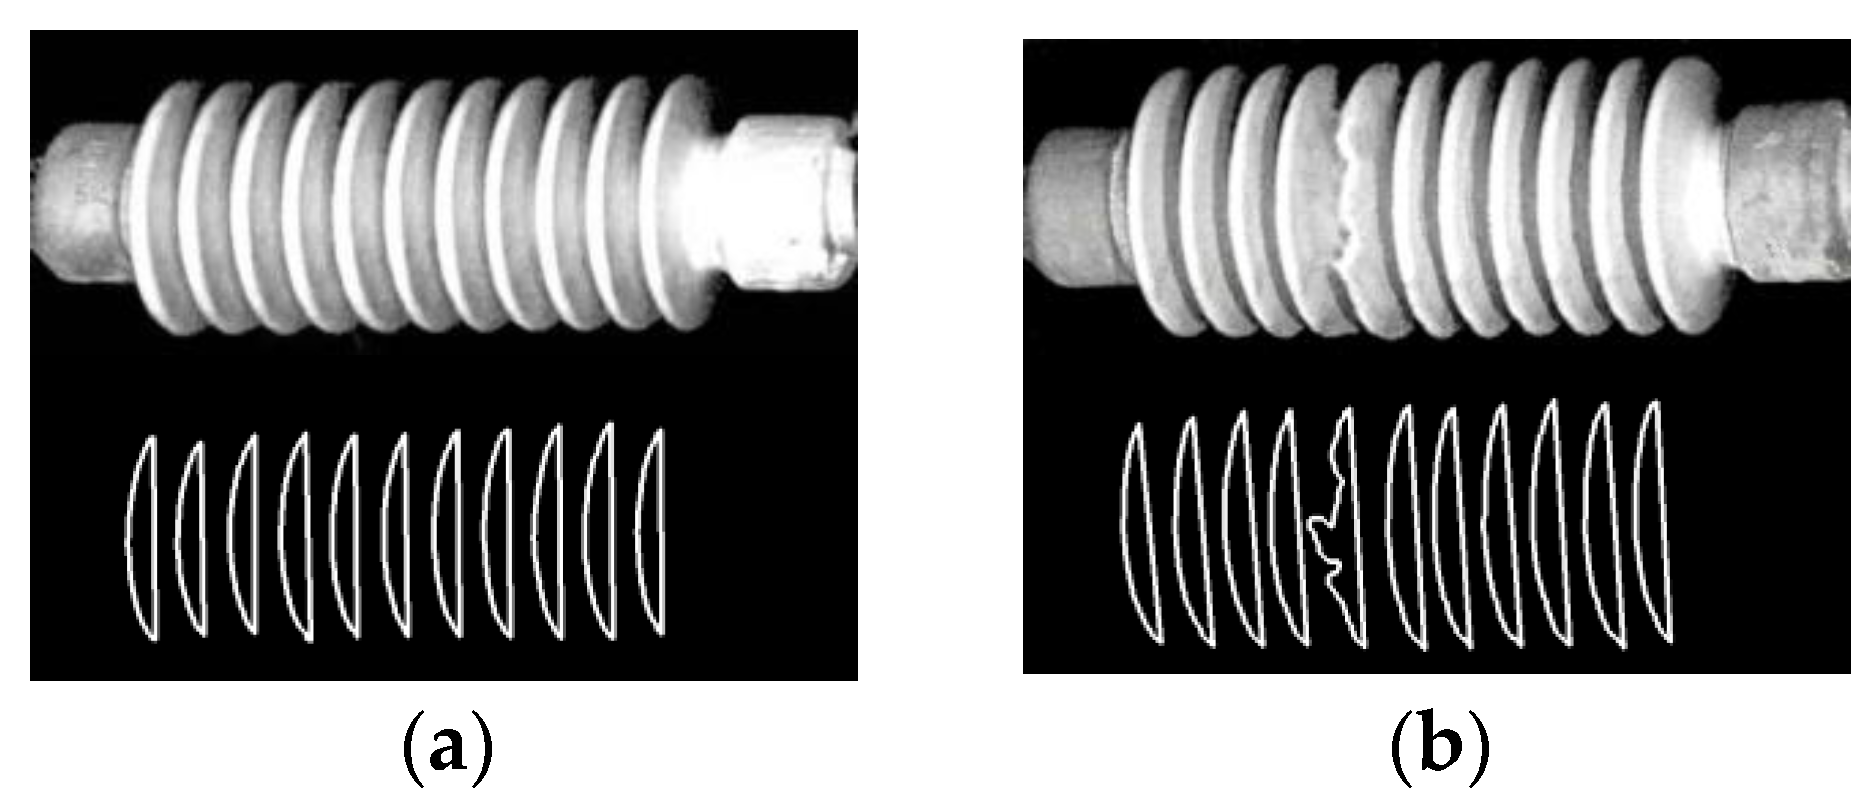
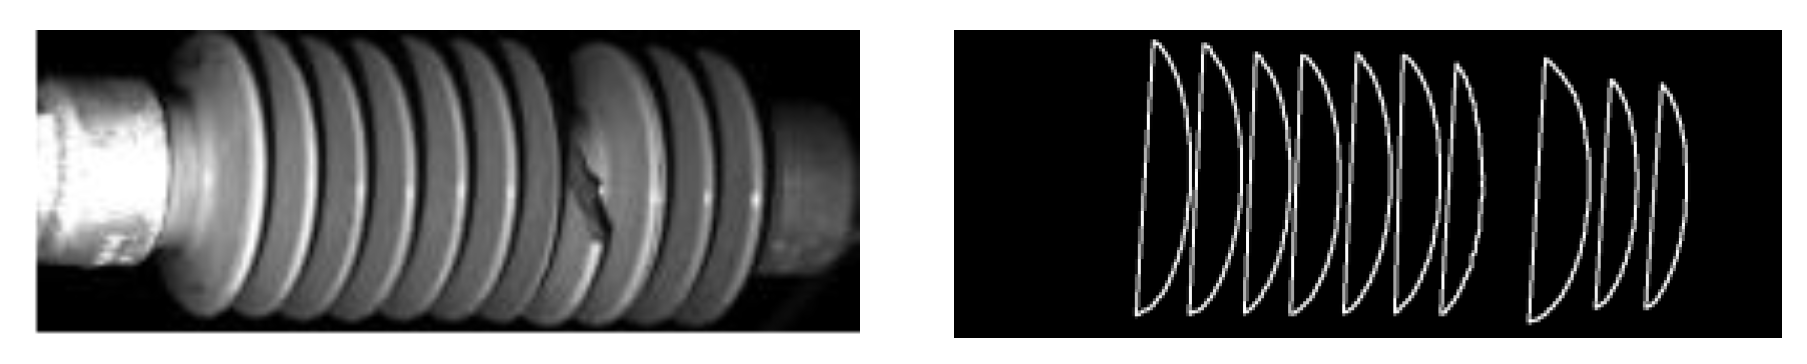
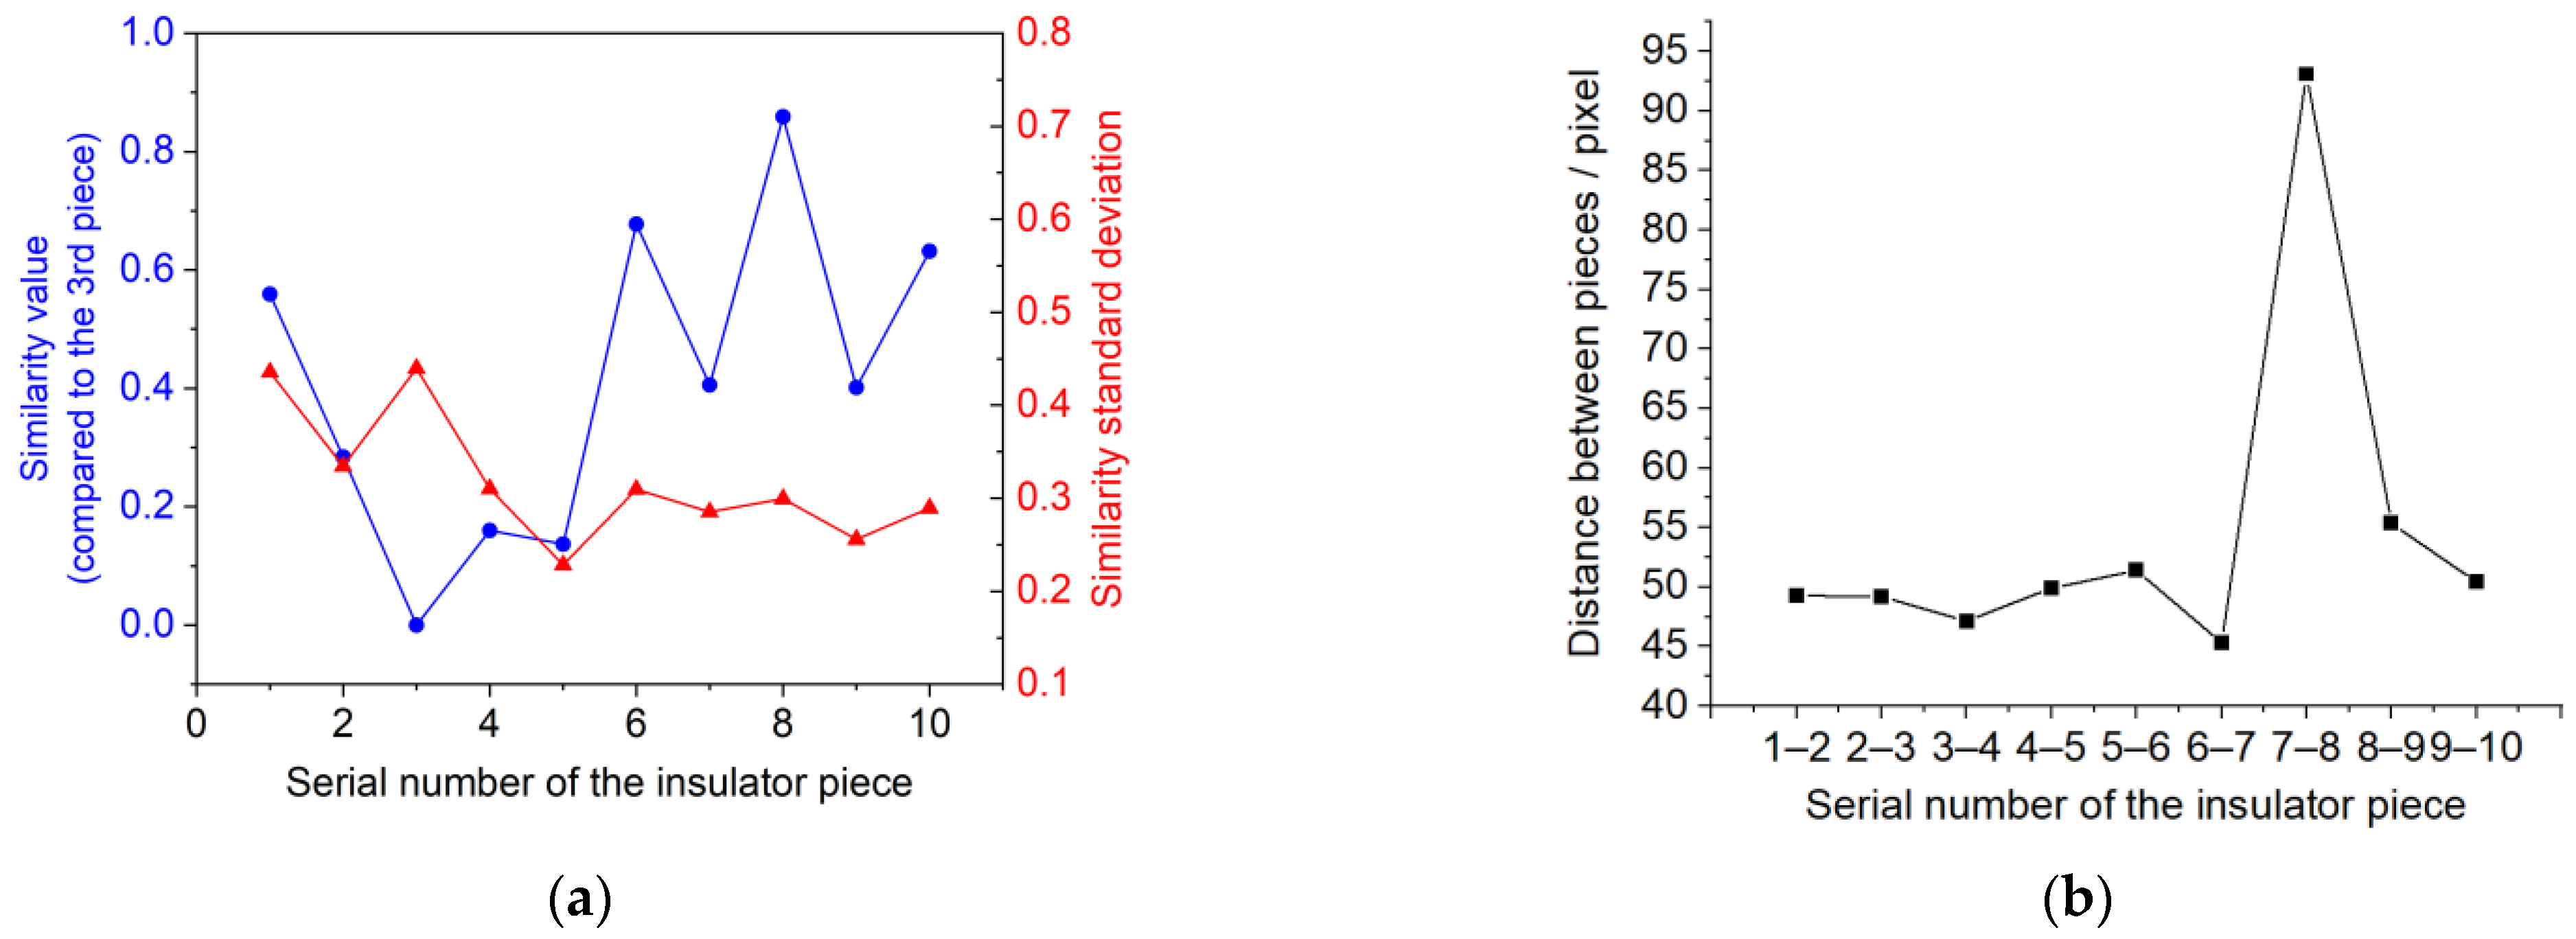
4.2. Damage Detection of Insulators

After the identification and positioning of the catenary insulators is completed, the insulator area is automatically cropped according to the above-mentioned process, and the preprocessing steps of the insulator small image are completed successively, including bilateral filter filtering, RAISR algorithm to improve resolution, adaptive threshold binarization and insulator single-piece contour extraction, and then calculation of the seventh order Hu moments or 10th-order Zernike moments of the insulator single-piece contour. The similarity value between different insulator pieces of the same insulator is further calculated according to the characteristic moment, and the similarity standard deviation of each insulator piece is calculated through the similarity value. When the maximum standard deviation exceeds the set threshold of 1.18, the insulator is judged to be damaged.
According to above method, 512 insulator images are used for the experimental test, including 29 damaged insulator images and 483 undamaged insulator images.
The normal insulator and its contour extraction results are shown in Figure 11a. Considering the amount of calculation and the real-time performance of the algorithm, the 10th-order Zernike moments are used to calculate the contour similarity value between insulator pieces and the similarity standard deviation of each insulator piece. As is shown in the red part of Figure 12, the maximum similarity standard deviation obtained is 0.5335, which is less than the set threshold of 1.18. Taking the ninth insulator piece from left to right as a reference, the similarity value between its contour and that of other insulator pieces is shown in the blue part of Figure 12.
Therefore, it can be seen that the contour similarity value between the insulator pieces is small, and the maximum similarity standard deviation is also small, so it can be judged that the insulator is not damaged.
The damaged insulator [15] and its contour extraction results are shown in Figure 11b. The 10th-order Zernike moments are used to calculate the contour similarity value between the insulator pieces and the similarity standard deviation of each insulator piece. As is shown in the red part of Figure 13, the maximum similarity standard deviation is 1.4285, which exceeds the set threshold of 1.18. Taking the second insulator piece from left to right as a reference, the similarity value between its contour and that of other insulator pieces is shown in the blue part of Figure 13. It can be seen that the contour of the second insulator piece and the fifth insulator piece have the highest similarity value (i.e., the least similarity), reaching 1.9299, and the maximum similarity standard deviation is also larger, so it can be judged that the insulator in Figure 11b is damaged.
For the insulator with large damage range [15] shown in Figure 14, only 10 insulator pieces can be extracted. The maximum standard deviation of contour similarity value is 0.4397, which is shown in the red part of Figure 15a. Taking the third contour from the left as a reference, the similarity value between its contour and that of other insulator pieces is shown in the blue part of Figure 15a. It can be seen that the similarity standard deviation and the similarity value between the insulator pieces are both small, so it is difficult to judge that the insulator is damaged. At this time, it can be further judged by calculating the distance between the centroids of each insulator piece contour (distance between pieces). Figure 15b shows the distance between pieces of adjacent insulator pieces. It can be seen that the distance between the seventh contour and the eighth contour is more than 90, which is much larger than the distance between other pieces, so it also can be judged that the insulator is damaged.
The test results of insulator damage-detection method based on Zernike moment on the dataset covering 512 images are shown in Table 4, including 30 false positives and four false negatives, and the accuracy of damage detection based on Zernike moment is 93.36%. While the test results of insulator damage-detection method based on Hu moment on the dataset covering 512 images are shown in Table 5, including 86 false positives and four false negatives. The accuracy of damaged detection base on Hu moment is 82.42%.
It can be seen that, compared with the two characteristic moments, Zernike moment has higher accuracy in detecting damaged insulators of the catenary. It is analyzed that the main reason for the misjudgment is that the captured insulator image is blurry and the extracted contour is inaccurate.

5. Conclusions

Damage detection of catenary insulators is of great significance for the daily maintenance of electrified railway power supply systems. In this paper, the complexity and accuracy of the model are comprehensively considered, and deep learning and Zernike moment are combined to improve the performance of catenary insulator damage detection. According to the analysis and experiments of this paper, the following conclusions can be drawn:
  • The insulator identification and positioning algorithm based on Mask R-CNN has an accuracy of 96.4% in application, which can meet the accuracy requirements of catenary insulator identification.
  • Compared with the Hu moment, the catenary insulator damage detection method based on Zernike moment has better detailed description performance, and the accuracy of insulator damage judgment is increased by 10.94%.
  • Compared with the insulator damage detection method completely based on deep learning, the method based on Zernike moment reduces the dependence on the number of damaged insulator samples; compared with the method completely based on feature matching, the influence of background interference on accuracy can be reduced to a certain extent by using deep learning to locate insulator region.
  • The blurring of the obtained image due to the shaking of the track detection vehicle will affect the accuracy of the method proposed in this paper. In future research, anti-shake algorithms can be considered.

Author Contributions

Writing—review & editing, T.L.; Writing—Original draft, T.H. All authors have read and agreed to the published version of the manuscript.

Funding

The work is fund by the Fundamental Research Funds for the Central Universities of China (2021YJS160).

Acknowledgments

Thanks to Zhiyang Innovation Technology Co., Ltd. for providing the experimental platform.

Conflicts of Interest

The authors declare no conflict of interest. The funders had no role in the design of the study; in the collection, analyses, or interpretation of data; in the writing of the manuscript; or in the decision to publish the results.

References

  1. Chen, J.W.; Liu, Z.G.; Wang, H.R.; Liu, K. High-speed railway catenary components detection using the cascaded convolutional netural networks. In Proceedings of the 2017 IEEE International Conference on Image Systems and Techniques (IST), Beijing, China, 18–20 October 2017. [Google Scholar] [CrossRef]
  2. Gu, Z.C.; Wang, Y.G.; Xue, X.T.; Wang, S.C.; Cheng, Y.; Du, X.Y.; Dai, P. Railway insulator defection with deep convolutional neural networks. In Proceedings of the 12th International Conference on Digital Image Processing (ICDIP), Osaka, Japan, 19–22 May 2020. [Google Scholar] [CrossRef]
  3. Yang, B.H.; Li, Y.L.; Wang, B. An improved CenterNet model for insulator defect detection using aerial imagery. Sensors 2022, 22, 2850. [Google Scholar] [CrossRef]
  4. Han, Y.; Liu, Z.G.; Lee, D.J.; Liu, W.Q.; Chen, J.W.; Han, Z.W. Computer vision-based automatic rod-insulator defect detection in high-speed railway catenary system. Int. J. Adv. Robot. Syst. 2018, 15, 1–15. [Google Scholar] [CrossRef] [Green Version]
  5. Kang, G.Q.; Gao, S.B.; Yu, L.; Zhang, D.K. Deep architecture for high-speed railway insulator surface defect detection: Denoising autoencoder with multitask learning. IEEE Trans. Instru. Meas. 2019, 68, 2679–2690. [Google Scholar] [CrossRef]
  6. Gong, Y.S.; Jing, W.F. Anomaly detection of high-speed railway catenary damage. IETE J. Res. 2022, 1–9. [Google Scholar] [CrossRef]
  7. Gao, S.B. Automatic detection and monitoring system of pantograph-catenary in China’s high-speed railways. IEEE Trans. Instru. Meas. 2021, 70, 1–12. [Google Scholar] [CrossRef]
  8. Han, Z.W.; Liu, Z.G.; Yang, H.M.; Han, Y. Insulator fault detection based on curvelet coefficients morphology and zonal energy method. J. China Railw. Soc. 2013, 35, 36–40. [Google Scholar] [CrossRef]
  9. Zhang, G.N.; Liu, Z.G. Fault detection of catenary insulator damage/foreign material based on corner matching and spectral clustering. Chin. J. Sci. Instrum. 2014, 35, 1370–1377. [Google Scholar]
  10. Tan, P.; Li, X.F.; Xu, J.M.; Ma, J.E.; Wang, F.J.; Ding, J.; Fang, Y.T.; Ning, Y. Catenary insulator defect detection based on contour features and gray similarity matching. J. Zhejiang Univ. Sci. A 2020, 21, 64–73. [Google Scholar] [CrossRef]
  11. Huang, X.L.; Shang, E.B.; Xue, J.D.; Ding, H.W.; Li, P.P. A multi-feature fusion-based deep learning for insulator image identification and fault detection. In Proceedings of the 2020 IEEE 4th Information Technology, Networking, Electronic and Automation Control Conference (ITNEC), Chongqing, China, 12–14 June 2020. [Google Scholar] [CrossRef]
  12. Li, Q.; Zhao, F.; Xu, Z.P.; Wang, J.; Liu, K.P.; Qin, L. Insulator and damage detection and location based on YOLOv5. In Proceedings of the 2022 International Conference on Power Energy Systems and Applications (ICoPESA), Singapore, 25–27 February 2022. [Google Scholar] [CrossRef]
  13. Bao, Y.Y.; Chen, T. Automatic identification and defect diagnosis of transmission line insulators based on YOLOv3 network. In Proceedings of the 2020 International Conference on Communications, Information System and Computer Engineering (CISCE), Kuala Lumpur, Malaysia, 3–5 July 2020. [Google Scholar] [CrossRef]
  14. Tudevdagva, U.; Battseren, B.; Hardt, W.; Troshina, G.V. Image processing based insulator fault detection method. In Proceedings of the 2018 XIV International Scientific-Technical Conference on Actual Problems of Electronics Instrument Engineering (APEIE), Novosibirsk, Russia, 2–6 October 2018. [Google Scholar] [CrossRef]
  15. Zhang, Z.J.; Ma, J.E.; Li, X.F.; Fang, Y.T. Insulator fault detection based on deep learning and Hu invariant moments. J. China Railw. Soc. 2021, 43, 71–77. [Google Scholar] [CrossRef]
  16. Zhang, Z.Y.; Huang, S.H.; Li, Y.X.; Li, H.; Hao, H.T. Image detection of insulator defects based on morphological processing and deep learning. Energies 2022, 15, 2465. [Google Scholar] [CrossRef]
  17. Arunabha, M.R.; Jayabrata, B. Real-time growth stage detection model for high degree of occultation using DenseNet-fused YOLOv4. Comput. Electron. Agr. 2022, 193, 106694. [Google Scholar] [CrossRef]
  18. Liu, Y.; Sun, P.; Wergeles, N.; Shang, Y. A survey and performance evaluation of deep learning methods for small object detection. Expert. Syst. Appl. 2021, 172, 114602. [Google Scholar] [CrossRef]
  19. He, K.M.; Gkioxari, G.; Dollar, P.; Girshick, R. Mask R-CNN. In Proceedings of the 2017 IEEE International Conference on Computer Vision (ICCV), Venice, Italy, 22–29 October 2017; pp. 2961–2969. [Google Scholar] [CrossRef]
  20. Yu, Y.; Zhang, K.L.; Yang, L.; Zhang, D.X. Fruit detection for strawberry harvesting robot in non-structural environment based on Mask-RCNN. Comput. Electron. Agr. 2019, 163, 104846. [Google Scholar] [CrossRef]
  21. Amo-Boateng, M.; NanaEkow, N.S.; AmprofiAmpah, A.; MartinKyereh, D. Instance segmentation scheme for roofs in rural areas based on Mask R-CNN. Egypt. J. Remote Sens. Space Sci. 2022. [Google Scholar] [CrossRef]
  22. Zhang, H.; Zhang, R.; Sun, D.Q.; Yu, F.; Gao, Z.; Sun, S.F.; Zheng, Z.C. Analyzing the pore structure of pervious concrete based on the deep learning framework of Mask R-CNN. Constr. Build. Mater. 2022, 318, 125987. [Google Scholar] [CrossRef]
  23. De, R.L.; Wen, X.Y.; Jullian, Y.; Karupppasamy, S.; Rajesh, C. A deep learning approach to the screening of malaria infection: Automated and rapid cell counting, object detection and instance segmentation using Mask R-CNN. Comput. Med. Imag. Grap. 2021, 88, 101845. [Google Scholar] [CrossRef]
  24. Shilpa, S.; Mamta, K.; Trilok, K. Face mask detection using deep learning: An approach to reduce risk of Coronavirus spread. J. Biomed. Inform. 2021, 120, 103848. [Google Scholar] [CrossRef]
  25. Yang, X.; Sun, H.; Fu, K.; Yang, J.R.; Sun, X.; Yan, M.L.; Guo, Z. Automatic ship detection in remote sensing images from Google Earth of complex scenes based on multiscale rotation dense feature pyramid networks. Remote Sens. 2018, 10, 132. [Google Scholar] [CrossRef] [Green Version]
  26. Tomasi, C.; Manduchi, R. Bilateral filtering for gray and color images. In Proceedings of the Sixth International Conference on Computer Vision, Bombay, India, 7 January 1998. [Google Scholar] [CrossRef]
  27. Yaniv, R.; John, I.; Peyman, M. RAISR: Rapid and accurate image super resolution. IEEE Trans. Comput. Imaging. 2017, 3, 110–125. [Google Scholar] [CrossRef] [Green Version]
  28. Zin, T.; Seta, S.; Nakahara, Y.; Yamaguchi, T.; Ikehara, M. Local image denoising using RAISR. IEEE Access 2022, 10, 22420–22428. [Google Scholar] [CrossRef]
  29. Hao, J.X.; Sen, Y.; Huang, X.X. Based on Surf feature extraction and insulator damage identification for capsule networks. In Proceedings of the 2019 International Conference on Computer Network, Electronic and Automation (ICCNEA), Xi’an, China, 27–29 September 2019. [Google Scholar] [CrossRef]
  30. Zhong, B.; Li, Y.B. Image feature point matching based on improved SIFT algorithm. In Proceedings of the 2019 IEEE 4th International Conference on Image, Vision and Computing (ICIVC), Xiamen, China, 5–7 July 2019. [Google Scholar] [CrossRef]
  31. Wang, C.P.; Wang, X.Y.; Xia, Z.Q.; Ma, B.; Shi, Y.Q. Image description with Polar Harmonic Fourier moments. IEEE Trans. Circ. Syst. Vid. 2020, 30, 4440–4452. [Google Scholar] [CrossRef]
  32. Xie, G.Y.; Guo, B.L.; Huang, Z.; Zheng, Y.; Yan, Y.Y. Combination of dominant color descriptor and Hu moments in consistent zone for content based image retrieval. IEEE Access 2020, 8, 146284–146299. [Google Scholar] [CrossRef]
  33. Lv, C.; Zhang, P.L.; Wu, D.H. Gear Fault Feature Extraction Based on Fuzzy Function and Improved Hu Invariant Moments. IEEE Access 2020, 8, 47490–47499. [Google Scholar] [CrossRef]
  34. Papakostas, G.A.; Boutalis, Y.S.; Karras, D.A.; Mertzios, B.G. Modified factorial-free direct methods for Zernike and Pseudo-Zernike moment computation. IEEE Trans. Instrum. Meas. 2009, 58, 2121–2131. [Google Scholar] [CrossRef]
  35. Liao, S.X.; Pawlak, M. On the accuracy of Zernike moments for image analysis. IEEE Trans. Pattern. Anal. 1998, 20, 1358–1364. [Google Scholar] [CrossRef] [Green Version]
  36. Li, H.Z.; Huang, H.; Ye, Z.J.; Li, H.F. Hyperspectral image classification using adaptive weighted quaternion Zernike moments. IEEE Trans. Signal. Proces. 2022, 70, 701–713. [Google Scholar] [CrossRef]
Figure 1. Network structure of catenary insulator identification based on Mask R-CNN.
Applsci 12 05004 g001
Figure 2. Structure of feature pyramid network (FPN).
Applsci 12 05004 g002
Figure 3. The process of image preprocessing.
Applsci 12 05004 g003
Figure 4. The process of the RAISR algorithm.
Applsci 12 05004 g004
Figure 5. Dynamic adjustment of threshold value of image binarization.
Applsci 12 05004 g005
Figure 6. Results of image preprocessing. (a) original image; (b) binarized image; (c) the whole contour; (d) the contour of the insulator pieces.
Applsci 12 05004 g006
Figure 7. The ten order Zernike moments.
Applsci 12 05004 g007
Figure 8. The process of catenary insulator damage detection.
Applsci 12 05004 g008
Figure 9. Loss function curve.
Applsci 12 05004 g009
Figure 10. Results of insulator identification.
Applsci 12 05004 g010
Figure 11. Some test images and contour extraction results. (a) Normal insulator and its contour extraction results; (b) Damaged insulator and its contour extraction results.
Applsci 12 05004 g011
Figure 12. Similarity standard deviation and similarity value between pieces of normal insulator shown in Figure 11a.
Applsci 12 05004 g012
Figure 13. Similarity standard deviation and similarity value between pieces of damaged insulator shown in Figure 11b.
Applsci 12 05004 g013
Figure 14. Insulator with large damage range and its contour extraction results.
Applsci 12 05004 g014
Figure 15. Some test images and contour extraction results. (a) Similarity standard deviation and similarity value between pieces of damaged insulator shown in Figure 14; (b) Distance between pieces of damaged insulator shown in Figure 14.
Applsci 12 05004 g015
Table 1. Comparison of different target recognition algorithms.
AlgorithmImplementation MethodCharacteristic
SSDMultiple layers are used for object detection, lower layers have smaller scales and higher layers have larger scales;
Fully convolutional layers are used to predict confidence scores and localization offset.
Poor performance on small objects due to lower layers lacking deep semantic information.
YOLOInput image is divided into k × k grids and object detection is performed on each grid.Low localization accuracy due to poor discrimination when object is partially located in one grid.
Faster R-CNNA regional proposal network (RPN) is adopted in the first stage, and the proposals are further classified and localized through the ROI (Region of Interest) Pooling layer in the second stage.The ROI Pooling layer adopts a quantitative rounding method, which will produce characteristic dislocation.
Mask R-CNNFPN (Feature Pyramid Network) is used to extract features and RPN (Regional Proposal Network) is used to generate proposals in the first stage.
ROI Align is used for location and classification, and mask branch is used for instance segmentation in the second stage.
The ROI Align adopts a bilinear interpolation method, which can avoid feature dislocation;
the mask branch is added, and the accuracy of small target detection can reach pixel level.
Table 2. The setting of hyperparameters.
HyperparameterSetting
Learning rate0.0025
Iterations1000
Batch size50
Number of epochs200
OptimizerSGD
Table 3. Loss function value.
Loss Function NameLLrpn_clsLrpn_bboxLclsLbboxLmask
value0.23680.00380.01400.04350.10230.0733
Table 4. Damage detection results based on Zernike moment.
CategoryTotalNumber of Correct JudgmentsNumber of Misjudgments
Undamaged insulator48345330
Damaged insulator29254
Table 5. Damage detection results based on Hu moment.
CategoryTotalNumber of Correct JudgmentsNumber of Misjudgments
Undamaged insulator48339786
Damaged insulator29254
Publisher’s Note: MDPI stays neutral with regard to jurisdictional claims in published maps and institutional affiliations.

