Abstract
This work reports the fabrication of ZnO@MoS2 core–shell micro/nanomaterials and their photocatalytic performances. First, the ZnO@MoS2 core–shell micro/nanorods heterostructures were grown by a two-step, hydrothermal method. Second, X-ray diffraction, scanning-electron microscopy, Raman spectra, and UV-visible spectra were applied to confirm and characterize the ZnO@MoS2 core–shell micro/nanorods. Third, methylene blue was employed to investigate the photocatalytic performance of the ZnO@MoS2 core–shell micro/nanorods heterostructures. It was found that the shape of the MoS2 shell layer depended on the growth time. The shell layer was composed of MoS2 nanoparticles before the growth time of 6 h and then turned into MoS2 nanosheets. It was also found that the photocatalytic performance was significantly affected by the growth time of the MoS2 nanosheets. When the growth time of the MoS2 nanosheets was between 6 and 10 h, ZnO@MoS2 core–shell heterostructures grown for 6 h exhibited a best photocatalytic efficiency value of 69.24% after 3 h catalysis.
1. Introduction
Nowadays, widely applied, organic reagents cause a large amount of organic pollutants [1], which are considered a major threat to human health and survival. Therefore, the harmless treatment of organic pollutants has become a hot topic in past decades [2,3]. One of the green approaches is employing semiconductor materials to degrade the organic pollutants into non-toxic compounds under sunlight [4,5]. A great work has been carried out to pursue highly efficient, semiconductor photocatalysts, such as a single crystal TiO2, zinc oxide (ZnO) CdS, etc. [6,7,8]. Among the highlighted, semiconductor photocatalysts, ZnO has attracted particular attention and has been studied numerous times due to its outstanding properties [3]. First, ZnO has versatility, availability, and low toxicity [9], which means low cost and environmental protection. Significantly, ZnO has a 3.37 eV band gap and high photo-responsivity (60 meV), which make it suitable for oxidation and reduction reactions by absorbing visible light for significant solar energy harvesting [10]. However, ZnO still suffers from some deficiency in photocatalysis. On the one hand, the photocatalytic reaction of ZnO is limited by the low, solar-energy conversion efficiency caused by the intrinsic, wide-band gap; high recombination rate of photo-generated, charge carriers; and possible photo-corrosion. On the other hand, the chemical stability of ZnO should not be ignored. In our previous study, we demonstrated that ZnO thin film can be easily etched by a 0.001 mol/L hydrochloric acid solution. In practice, organic-dye sewage is most likely to be acidic, which might allow it to cut down on ZnO materials.
One way to solve the first issue is by fabricating ZnO micro/nanomaterials. ZnO micro/nanomaterials possess large specific surface areas, quantum effects, and piezoelectric photoelectron effects. These perfect effects can greatly improve the solar-energy conversion efficiency. Another effective method is to bring in co-catalysts, such as metal nanoparticles (Pt, Ag, Co, etc.) with graphene, graphene oxide, and transition metal dichalcogenides (i.e., MoS2, WS2, etc.) [6,9,11]. Among the above co-catalysts, MoS2 exhibits nice chemical stability [10], indicating that the ZnO@MoS2 core–shell nano-structure should be an outstanding photocatalyst. In this regard, MoS2 nanosheets have been widely studied [9,10]. In numerous previous successful studies, the growth time of the MoS2 nanomaterials with a hydrothermal method was over 10 h [12,13,14,15]. On the premise of ensuring efficient catalysis, shortening the growth time of the MoS2 nanosheets can bring in two benefits. One is that saving time means saving source materials and cost. The other is that saving time results in improving production efficiency. As the famous quote says, “time is money; time is efficiency”. Therefore, cutting down on growth time is meaningful for the ZnO@MoS2 core–shell nano-structure photocatalyst on the premise of ensuring efficient catalysis.
In this work, we explored ZnO@MoS2 core–shell heterostructures that benefited from the excellent chemical stability and synergetic photocatalytic performance of the MoS2 nanosheets. The MoS2 nanosheets’ growth time was also investigated for effectively saving growth time on the premise of ensuring efficient catalysis.
2. Experimental Section
2.1. Growth of ZnO Micro/Nanorods
A total of 1.616 g of zinc acetate (Zn(CH3COO)2, purity of 99.5%) and 0.8 g of hexamethylenetetramine (C6H12N4, purity of 99.5%) were added into the mixed solution of 15 mL of ethylene glycol (CH2OH)2, purity of 99.5%) and 20 mL of deionized water and then stirred at 60 °C for 1 h to obtain a uniform, precursor solution. Afterward, the precursor solution and clean indium tin oxide (ITO) substrates were transferred into an autoclave. The closed autoclave was put into a precision oven, and a growth process was carried out at 85 °C for 5 min. After the growth process, ZnO micro/nanorods were achieved on the ITO substrates. The as-received ZnO micro/nanorods on ITO substrates were washed by deionized water to remove the residual precursor solution and dried at 80 °C for 30 min.
2.2. Fabrication of ZnO@MoS2 Core–Shell Heterostructures
High purity sulfur (S, 99.9%) powder and molybdenum oxide (MoO3, 99.5%) were added to 20 mL of octane (C8H18, 99.5%) and then stirred at 60 °C for 1 h to achieve the precursor solution for growing the MoS2 shell layer on the as-received ZnO micro/nanorods (the core). Similarly, the precursor solution for growing MoS2 and the as-received ZnO micro/nanorods on ITO substrates were put into another autoclave. The growth process was performed in the precision oven at 180 °C for 1, 6, 8, and 10 h to synthesize the ZnO@MoS2 core–shell heterostructures with different thicknesses of the MoS2 nanosheets shell layer.
2.3. Characterization of the ZnO Micro/Nanorods and ZnO@MoS2 Core–Shell Heterostructures
X-ray diffraction (XRD, X’Pert Pro MFD, PANalytical, Almelo, Netherlands) determined the structure of the as-received ZnO micro/nanorods and ZnO@MoS2 core–shell heterostructures samples. Scanning electron microscopy (SEM, ZEISS Sigma 500, Jena, Germany, working voltage of 15 kV) was used to characterize the morphology of the as-received samples. An energy dispersive spectrometer (EDS) was employed to confirm the elements of the samples. Raman spectra (LabRAM HR UV-NIR, Paris, France) laser wavelength of 488 nm) and ultraviolet-visible spectra (Shimadzu, UV3600Plus, Kyoto, Japan) were conducted to detect the optical properties of the samples. A photochemical reactor (OCRS-K, mercury lamp as the light source, working power of 500 W) was utilized to investigate the photocatalytic properties of the as-received nano-structures.
3. Results and Discussion
XRD was applied to determine the crystalline structure of the three samples, and the results are shown in Figure 1. The XRD pattern of a blank ITO substrate was also taken for comparison. From Figure 1, one can see clearly that, apart from the ITO peaks, the patterns for the ZnO@MoS2 core–shell heterostructures samples have some peaks that can be well-indexed to ZnO (JCPDS:36-1451). Strangely, no independent peaks are assigned to MoS2. However, when Mo2S3 (JCPDS:40-0972) or Mo15S19 (JCPDS:40-0936) are taken as a reference, three or four peaks appear in the same positions as those of ZnO or ITO. This result indicates that MoS2 with rich sulfur vacancies is possibly fabricated on ZnO. Further analysis should be carried out to confirm the fabrication of MoS2.
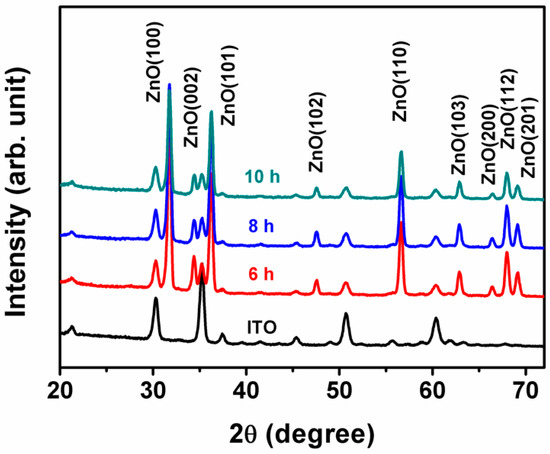
Figure 1.
XRD patterns of the ITO substrate and the as-received ZnO@MoS2 core–shell heterostructures under the MoS2 growth time of 6, 8, and 10 h.
Furthermore, the element mapping images from SEM were deployed to confirm the fabrication of MoS2 directly. Figure 2a is an SEM image of the ZnO@MoS2 core–shell heterostructure with the MoS2 shell grown for 1 h, and Figure 2b–e are the element mapping images corresponding to O, S, Zn, and Mo elements, respectively. The O signal is from the ZnO microrod and ITO substrates, while the Zn signal comes from the ZnO microrod due to the high working voltage of 15 kV. Accordingly, as can be seen, the shapes of S, Zn, and Mo are in the same position as the ZnO microrod of Figure 2a, indicating that MoS2 has been achieved after hydrothermal growth, and ZnO micro/nanorods have been almost decorated with the MoS2 shell layer. At the same time, in Figure 2f, the corresponding energy dispersive X-ray spectrometry (EDX) pattern of Figure 2a also verifies the existences of S and Mo. Therefore, the ZnO@MoS2 core–shell heterostructures have been fabricated by the two-step hydrothermal method.
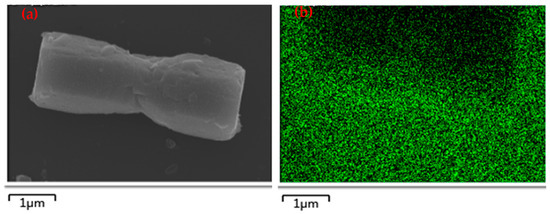
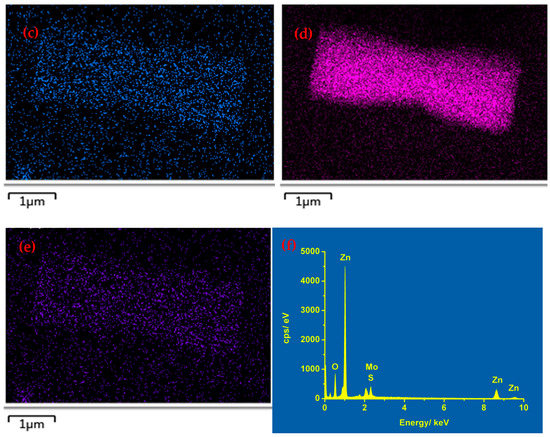
Figure 2.
(a) SEM image of the as–received ZnO@MoS2 core–shell heterostructure with the MoS2 growth time of 1 h and its element mapping of (b) O, (c) S, (d) Zn, and (e) Mo. (f) Its corresponding EDX pattern.
Except the element mapping images, the Raman spectrum is another technology used to confirm the fabrication of MoS2 directly. As shown in Figure 3, when the MoS2 growth time is 6 h, the intense peak of ZnO micro/nanorods at ~437 cm−1 is sharply decreased, and a very weak peak at about 406.4 cm−1 turns up. As the MoS2 growth time is increased to 8 h, the peak at 406 cm−1 becomes more prominent, and a new and weak peak at 377.3 cm−1 appears. When the MoS2 growth time is up to 10 h, the peaks at 406.4 cm−1 and 377.3 cm−1 can be seen distinctly. Meanwhile, the peak at 325 cm−1 gradually becomes weaker and disappears as the growth time of MoS2 is from 6 h to 10 h. According to previous publications [16,17,18,19], the peaks located at 377.3 cm−1 and 406.4 cm−1 can be assigned to the A1g mode of MoS2 and to E2g mode of the Mo–S bond, respectively. These results are well-matched with those of the MoS2 fabricated by the hydrothermal method [7]. Thus, the ZnO@MoS2 core–shell heterostructures have been successfully achieved by two-step hydrothermal growth.
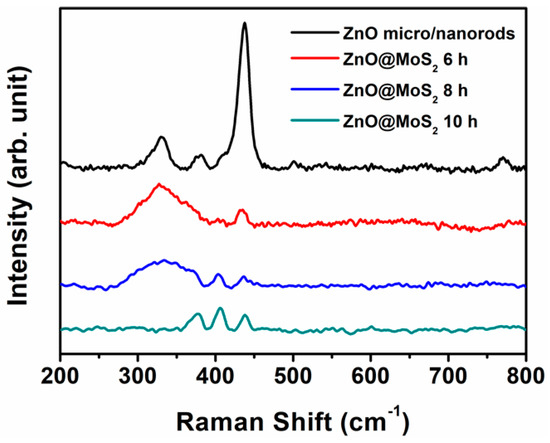
Figure 3.
Raman spectra of the as–received ZnO micro/nanorods and the as-received ZnO@MoS2 core–shell heterostructures under the MoS2 growth time of 6, 8, and 10 h.
It should be noted that the intensities of the peaks at 406.4 cm−1 and 377.3 cm−1 are about one-twentieth of that of the ZnO peak at ~437 cm−1. The intensity of the Raman peak is dependent on the quality and thickness of the materials based on our previous experiments. In this work, the ZnO materials are single microrods or nanorods, while the MoS2 materials are nanosheets. The quality and thickness of the ZnO micro/nanorods are much better than those of the MoS2 nanosheets. As a result, the Raman peak’s intensity of the ZnO micro/nanorods is much higher than that of the MoS2 nanosheets. Moreover, the peak at ~437 cm−1 for the ZnO@MoS2 heterostructures should be from the ZnO micro/nanorods, thanks to its super-strong intensity.
Much recent research has suggested that ZnO micro/nanorods produced by hydrothermal method exhibit smooth surfaces. In contrast, the MoS2 fabricated by the hydrothermal method usually endows rough surfaces or nanosheet-like structures. This means the surface diversification can be taken as an indirect method to just the hydrothermal growth of the MoS2 on the ZnO micro/nanorods. Figure 4a represents the SEM image of ZnO micro/nanorods. The SEM image shows that the as-grown ZnO samples consist of micro-rods with a typical diameter of ~2 μm and many small white particles. The SEM images recorded at high magnification clearly show the smooth surfaces of the ZnO micro/nanorods and the presence of the ZnO nanorods (Figure 4b).
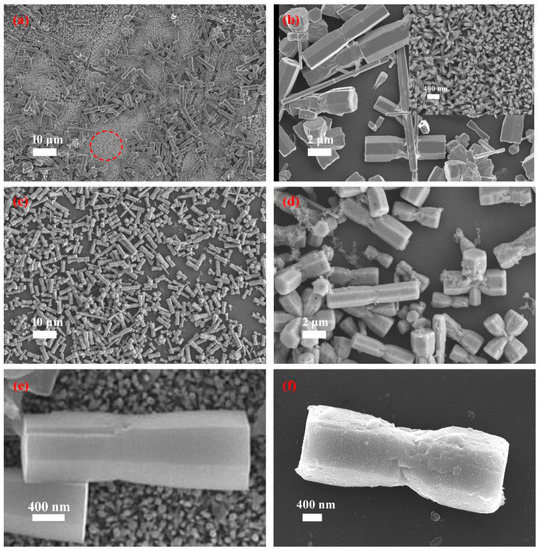
Figure 4.
SEM images of (a) the as-received ZnO micro/nanorods and (b) the as-received ZnO@MoS2 core–shell heterostructures grown for 1 h, (b,d) are the corresponding high-resolution SEM images of (a,c), respectively, and (e,f) are ZnO microrods and (b) ZnO@MoS2 core–shell heterostructures of (a,c) respectively. The insert picture of Figure 2b is the ZnO nanorods in Figure 2a marked by a red circle.
Furthermore, the insert SEM image in Figure 4b steads for the area in Figure 4a marked by a red circle at high magnification, which exhibits the ZnO nanorods, too. The ZnO samples grown hydrothermally in this work are the ZnO micro/nanorods. As illustrated in Figure 4c, after hydrothermal growth of MoS2, the micro/nanorods become grayish and rough. Figure 4d, a high magnification SEM image, displays the rough surface of micro/nanorods modified with small particles. A single microrod of the ZnO and the ZnO@MoS2 grown for 1 h are applied for comparison, as shown in Figure 4e,f, respectively. By comparing these two figures, the surface of the ZnO@MoS2 microrod is much rougher than that of the ZnO microrod, suggesting the growth of MoS2 again. Based on the discussion above, after the hydrothermal growth of the MoS2, the ZnO@MoS2 heterostructures have been obtained successfully.
According to our experiment, when the growth time is less than 6 h, the MoS2 shell layer is composed of nanoparticles. When the MoS2 growth time is 6 h, the surface morphology of the ZnO@MoS2 core–shell heterostructures is very distinct from that grown for 1 h, as shown in Figure 5a,b as well as Figure 4d. As shown in Figure 5a, the bottom turns rough with the feature of MoS2 nanosheets. Additionally, clearly, MoS2 shell layers are well-decorated on the ZnO micro/nanorods (in Figure 5b). The MoS2 nanosheets at the bottom grow significantly and more densely as the growth time is increased to 8 h, as shown in Figure 5c. However, it can be observed in Figure 5d that the growth rate of the MoS2 nanosheets is slower than those of the bottom. Unfortunately, the MoS2 nanosheets grown for 10 h have turned poor at the bottom, as illustrated in Figure 5e. Maybe due to the slow growth rate, the MoS2 nanosheets on the ZnO micro/nanorods still keep the shape of the nanosheets well (Figure 5f).
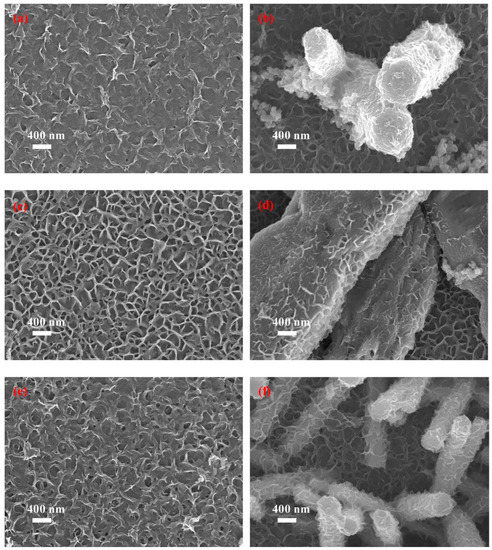
Figure 5.
SEM images of the as-received ZnO micro/nanorods and the as-received ZnO@MoS2 core–shell micro/nanorods under the MoS2 growth time of 6, 8, and 10 h: (a,c,e) correspond to MoS2 (the bottom); (b,d,f) correspond to the as-received ZnO@MoS2 core–shell heterostructures.
Methylene blue solution is introduced to evaluate the photocatalytic performance of the ZnO@MoS2 core–shell heterostructures. Furthermore, the ZnO micro/nanorods were chosen as a reference for comparison. Figure 6a illustrates that the ZnO@MoS2 core–shell heterostructures grown for 6 h show the best photocatalytic performance. It is also found that the photocatalytic performance of the ZnO@MoS2 core–shell heterostructures decreases as the MoS2 growth time ranges from 6 to 10 h. Furthermore, the photocatalytic performance of the ZnO@MoS2 core–shell heterostructures grown for 10 h is almost the same as that of the ZnO micro/nanorods. Based on previous work, the photocatalytic efficiency (η) is calculated from the following formula [19]:
where C0 and C are the methylene blue initial solution concentration and the methylene blue concentration after photocatalytic degradation. According to this formula, the photocatalytic efficiency of the ZnO@MoS2 core–shell heterostructures grown for 6, 8, and 10 h are 69.24%, 64.52%, and 58.34%, respectively. Moreover, the photocatalytic efficiency of the ZnO micro/nanorods is 58.13%. These results suggest that the growth time of the MoS2 nanosheets shell layer has been significantly reduced for the ZnO@MoS2 core–shell nano-structure photocatalyst on the premise of ensuring efficient catalysis. Furthermore, these results are comparable to those reported by Fu et al. [2] when grown for 24 h. In recent years, ZnO@ZnS@MoS2 [20], ZnO@CdS@MoS2 [21], ZnO@MoS2@rGO [22], and ZnO@MoS2@ polyaniline [23] dual heterojunctions have been developed to highly enhance photocatalytic performance. Moreover, MoS2@ZnO heterojunctions have also been demonstrated to be highly efficient photocatalysts [4,24]. The photocatalytic efficiency of this work is close to that of the reports mentioned above. It can be found that, in most of these reports, the growth time of the MoS2 nanosheets is over 10 h. Ref. [4] reported rapid growth of the MoS2@ZnO heterojunctions by electric spark erosion, which is our future goal. It is well-known that the longer the growth time, the thicker the thickness of the MoS2 shell layer. Normally, it is believed that the thicker thickness of the MoS2 nanosheets shell layer leads to better photocatalytic efficiency. However, the photocatalytic efficiency is reduced when the growth time is increased in this work. The photocatalytic efficiency changing trend of the MoS2 growth time in this work matches with the report by Putritama et al. [9]. However, the MoS2 nanosheets shell layer increases the contact angle and shows inactive catalytic sites in Ref. [9], which reduces the photocatalytic efficiency of the ZnO@MoS2 heterostructures.
η = (C0 − C)/C0
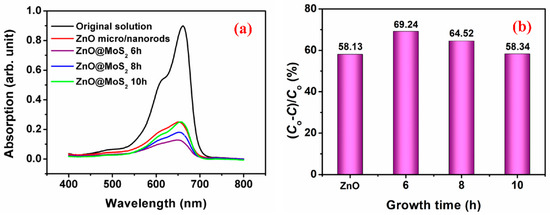
Figure 6.
Photocatalytic ability of the as-received ZnO micro/nanorods and the as-received ZnO@MoS2 core–shell heterostructures grown for 6, 8, and 10 h on methylene blue with a photocatalytic time of 3 h: (a) absorption spectra and (b) photocatalytic efficiency.
It is well-known that photocatalytic efficiency is significantly affected by light absorption. UV-visible spectra are employed to characterize the light absorption of ITO substrate, ZnO micro/nanorods, and ZnO@MoS2 core–shell heterostructures with the MoS2 growth time of 6 h, as illustrated in Figure 7. Compared with the blank ITO substrate, the ZnO micro/nanorods reveal a slightly higher light absorption in the range from 290 to 350 nm. The ZnO@MoS2 core–shell heterostructures show a much higher light absorption in the range from 290 to 600 nm in the three samples. Accordingly, a higher light absorption usually results in a higher photocatalytic efficiency. It also can be confirmed by the color change of the methylene blue after photocatalytic degradation, as shown in the insert picture of Figure 7. The reason for the higher photocatalytic efficiency of the ZnO@MoS2 core–shell heterostructures may be due to three aspects. The first is the rich sulfur vacancies in the MoS2 nanosheets shell layer [11,12]. The sulfur vacancies on the surface of the MoS2 shell layer have been demonstrated to be the active sites of the catalytic reactions. The more sulfur vacancies there are, the higher the photocatalytic efficiency is. The second is attributed to the heterojunction of MoS2/ZnO [2,15,25]. It has been demonstrated that the MoS2 chemically bonded to ZnO under high-pressure growth conditions to form the MoS2/ZnO heterojunction [2]. It should be noted that a strong internal field is set up by the MoS2/ZnO heterojunction, which leads to a significant promotion in the spatial separation of the photogenerated carriers [2]. The photogenerated carriers are believed to be the power source of the photocatalytic action. This indicates that the enhanced internal field created by the MoS2/ZnO heterojunction favors the photocatalytic efficiency. The third is the specific surface area enhanced by the MoS2 nanosheets. It is widely accepted that the MoS2 nanosheet’s shell layer owns a more extensive specific surface area than that of the ZnO micro/nanorods [11]. A bigger and rougher surface can absorb more organic dyes, suggesting a better photocatalytic efficiency [11].
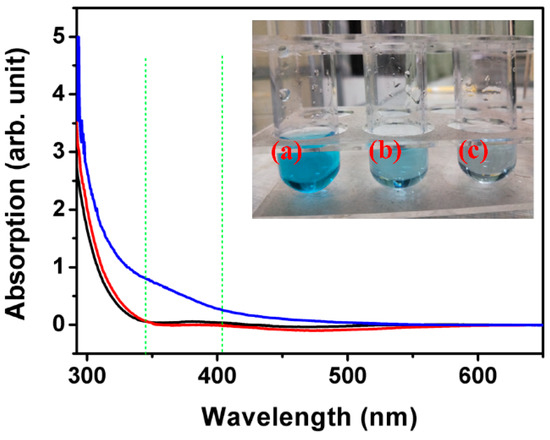
Figure 7.
Absorption spectra of ITO substrate (black line), the as-received ZnO micro/nanorods (red line), and the as-received ZnO@MoS2 core–shell heterostructures (blue line) grown for 6 h and the insert picture is of the methylene blue solution after a 3 h photocatalytic reaction: (a) without any photocatalyst, (b) ZnO micro/nanorods, and (c) ZnO@MoS2 core–shell heterostructures grown for 6 h.
However, as the growth time exceeds 6 h, the photocatalytic efficiency of the ZnO@MoS2 core–shell heterostructures is reduced and kept down as the growth time is increased. As mentioned above, the thickness of the MoS2 nanosheet’s shell layer is thicker as the growth time is increased. On the one hand, increasing the MoS2 nanosheet’s shell layer thickness will weaken the light absorption of the MoS2/ZnO heterojunction or ZnO micro/nanorods and further cut down on the spatial separation of the internal field [10]. Accordingly, this leads to a reduction in the photocatalytic efficiency. On the other hand, an increase in the MoS2 nanosheet’s shell layer thickness indicates an increase in the migrated path of the photogenerated carriers [9], which means that the recombination probability between the photogenerated carriers and the internal defects is increased. Meanwhile, the life of the photogenerated carriers is usually short, revealing that the photogenerated carriers would be possibly recombined before they migrate to the surface of the MoS2 nanosheet’s shell layer.
4. Conclusions
The ZnO@MoS2 core–shell heterostructures have been successfully fabricated by a two-step hydrothermal method. The surface morphology of the MoS2 shell layer is significantly affected by the growth time. Before 6 h, the MoS2 shell layer consists of nanoparticles. When the growth time is up to 6 h, the MoS2 nanoparticles have been turned into the MoS2 nanosheets. It is also found that the photocatalytic performance of the ZnO@MoS2 core–shell heterostructures is reduced as the growth time is increased from 6 to 10 h. Therefore, the growth time of the MoS2 nanosheet’s shell layer has been effectively reduced on the premise of ensuring the ZnO@MoS2 core–shell nano-structure’s photocatalytic efficiency.
Author Contributions
Data curation, F.W., C.L., Z.G. and B.L.; Writing-original draft, Y.Z.; Funding acquisition; Writing-review & editing, X.H. and W.Y. All authors have read and agreed to the published version of the manuscript.
Funding
This project is supported by the open foundation of Guangxi Key Laboratory of Processing for Non-ferrous Metals and Featured Materials, Guangxi University (grant No. 2020GXYSOF03); the College Innovation Team Project of Guangdong Province (2021KCXTD042); the University Student Innovation and Entrepreneurship Training Program Project of Guangdong Province (S202011349077); the Special Fund for Scientific and Technological Innovation Cultivation of University Students in Guangdong Province (pdjh2021a0503); the Innovative Leading Talents of Jiangmen (Jiangmen(2019)7); and the Key Laboratory of Optoelectronic materials and Applications in Guangdong Higher Education (2017KSYS011).
Institutional Review Board Statement
Not applicable.
Informed Consent Statement
Not applicable.
Data Availability Statement
Not applicable.
Acknowledgments
Yu Zhong and Bingshang Lu contributed equally to this work.
Conflicts of Interest
The authors declare no conflict of interest.
References
- Cheng, Y.; Bai, M.; Su, J.; Fang, C.; Li, H.; Chen, J.; Jiao, J. Synthesis of fluorescent carbon quantum dots from aqua mesophase pitch and their photocatalytic degradation activity of organic dyes. J. Mater. Sci. Technol. 2019, 35, 1515–1522. [Google Scholar] [CrossRef]
- Fu, Y.; Ren, Z.; Wu, J.; Li, Y.; Liu, W.; Li, P.; Xing, L.; Ma, J.; Wang, H.; Xue, X. Direct Z-scheme heterojunction of ZnO/MoS2 nanoarrays realized by flowing-induced piezoelectric field for enhanced sunlight photocatalytic performances. Appl. Catal. B Environ. 2021, 285, 119785. [Google Scholar] [CrossRef]
- Islam, S.E.; Hang, D.R.; Chen, C.H.; Sharma, K.H. Facile and Cost-Efficient Synthesis of Quasi-0D/2D ZnO/MoS2 Nanocomposites for Highly Enhanced Visible-Light-Driven Photocatalytic Degradation of Organic Pollutants and Antibiotics. Chem.-A Eur. J. 2018, 24, 9305–9315. [Google Scholar] [CrossRef] [PubMed]
- An, V.; Potgieter, H.; Usoltseva, N.; Valiev, D.; Stepanov, S.; Pustovalov, A.; Baryshnikov, A.; Titov, M.; Dolinina, A. MoS2@ZnO Nanoheterostructures Prepared by Electrospark Erosion for Photocatalytic Applications. Nanomaterials 2021, 11, 157. [Google Scholar] [CrossRef]
- Lin, J.; Wang, P.; Wang, H.; Li, C.; Si, X.; Qi, J.; Cao, J.; Zhong, Z.; Fei, W.; Feng, J. Defect-Rich Heterogeneous MoS2/NiS2 Nanosheets Electrocatalysts for Efficient Overall Water Splitting. Adv. Sci. 2019, 6, 1900246. [Google Scholar] [CrossRef] [Green Version]
- Kapatel, S.; Sumesh, C.K. Two-Step Facile Preparation of MoS2·ZnO Nanocomposite as Efficient Photocatalyst for Methylene Blue (Dye) Degradation. Electron. Mater. Lett. 2018, 15, 119–132. [Google Scholar] [CrossRef]
- Govatsi, K.; Antonelou, A.; Sygellou, L.; Neophytides, S.G.; Yannopoulos, S.N. Hybrid ZnO/MoS2 Core/Sheath Heterostructures for Photoelectrochemical Water Splitting. Appl. Nano 2021, 2, 148–161. [Google Scholar] [CrossRef]
- Yang, W.; Liu, J.; Guan, Z.; Liu, Z.; Chen, B.; Zhaoa, L.; Li, Y.; Cao, X.; He, X.; Zhang, C.; et al. Morphology, electrical and optical properties of magnetron sputtered porous ZnO thin films on Si(100) and Si(111) substrates. Ceram. Int. 2020, 46, 6605–6611. [Google Scholar] [CrossRef]
- Putritama, V.; Fauzia, V.; Supangat, A. The effect of the layer number of MoS2 nanosheets on the photocatalytic efficiency of ZnO/MoS2. Surf. Interfaces 2020, 21, 100745. [Google Scholar] [CrossRef]
- Islam, S.E.; Hang, D.R.; Chen, C.H.; Chou, M.M.C.; Liang, C.T.; Sharma, K.H. Rational design of hetero-dimensional C-ZnO/MoS2 nanocomposite anchored on 3D mesoporous carbon framework towards synergistically enhanced stability and efficient visible-light-driven photocatalytic activity. Chemosphere 2021, 266, 129148. [Google Scholar] [CrossRef]
- Wang, G.; Yuan, H.; Chang, J.; Wang, B.; Kuang, A.; Chen, H. ZnO/MoX2 (X = S, Se) composites used for visible light photocatalysis. RSC Adv. 2018, 8, 10828–10835. [Google Scholar] [CrossRef] [PubMed] [Green Version]
- Wang, X.; Zhang, Y.; Si, H.; Zhang, Q.; Wu, J.; Gao, L.; Wei, X.; Sun, Y.; Liao, Q.; Zhang, Z.; et al. Single-Atom Vacancy Defect to Trigger High-Efficiency Hydrogen Evolution of MoS2. J. Am. Chem. Soc. 2020, 142, 4298–4308. [Google Scholar] [CrossRef] [PubMed]
- Rameshkumar, S.; Henderson, R.; Padamati, R.B. Improved Surface Functional and Photocatalytic Properties of Hybrid ZnO-MoS2-Deposited Membrane for Photocatalysis-Assisted Dye Filtration. Membranes 2020, 10, 106. [Google Scholar] [CrossRef] [PubMed]
- Chang, M.; Jia, Z.; He, S.; Zhou, J.; Zhang, S.; Tian, M.; Wang, B.; Wu, G. Two-dimensional interface engineering of NiS/MoS2/Ti3C2Tx heterostructures for promoting electromagnetic wave absorption capability. Compos. Part B Eng. 2021, 225, 109306. [Google Scholar] [CrossRef]
- Wu, H.; Jile, H.; Chen, Z.; Xu, D.; Yi, Z.; Chen, X.; Chen, J.; Yao, W.; Wu, P.; Yi, Y. Fabrication of ZnO@MoS2 Nanocomposite Heterojunction Arrays and Their Photoelectric Properties. Micromachines 2020, 11, 189. [Google Scholar] [CrossRef] [Green Version]
- Kumar, S.; Sharma, V.; Bhattacharyya, K.; Krishnan, V. N-doped ZnO–MoS2 binary heterojunctions: The dual role of 2D MoS2 in the enhancement of photostability and photocatalytic activity under visible light irradiation for tetracycline degradation. Mater. Chem. Front. 2017, 1, 1093–1106. [Google Scholar] [CrossRef]
- Benavente, E.; Durán, F.; Sotomayor-Torres, C.; González, G. Heterostructured layered hybrid ZnO/MoS2 nanosheets with enhanced visible light photocatalytic activity. J. Phys. Chem. Solids 2018, 113, 119–124. [Google Scholar] [CrossRef]
- Sun, Y. Synthesis, Characterization and Performance of MoS2 Nanoflowers; Fujian Normal University: Fujian, China, 2009. [Google Scholar]
- Song, R.; Xi, Q.; Shi, X.; Lv, H.; Liu, K.; Chen, X.; Chen, J.; Li, Z.; Liu, J. Preparation and Photocatalytic Property of MoO3@MoS2 Composite. Mater. Sci. 2018, 8, 535–541. [Google Scholar]
- Fu, Y.; Wang, Y.; Zhao, H.; Zhang, Z.; An, B.; Bai, C.; Ren, Z.; Wu, J.; Li, Y.; Liu, W.; et al. Synthesis of ternary ZnO/ZnS/MoS2 piezoelectric nanoarrays for enhanced photocatalytic performance by conversion of dual heterojunctions. Appl. Surf. Sci. 2021, 556, 149695. [Google Scholar] [CrossRef]
- Jia, Y.; Wang, Z.; Qiao, X.-Q.; Huang, L.; Gan, S.; Hou, D.; Zhao, J.; Sun, C.; Li, D.-S. A synergistic effect between S-scheme heterojunction and Noble-metal free cocatalyst to promote the hydrogen evolution of ZnO/CdS/MoS2 photocatalyst. Chem. Eng. J. 2021, 424, 130368. [Google Scholar] [CrossRef]
- Ugur, N.; Bilici, Z.; Ocakoglu, K.; Dizge, N. Synthesis and characterization of composite catalysts comprised of ZnO/MoS2/rGO for photocatalytic decolorization of BR 18 dye. Colloids Surf. A Physicochem. Eng. Asp. 2021, 626, 126945. [Google Scholar] [CrossRef]
- Sharma, V.; Maivizhikannan, V.; Rao, V.N.; Kumar, S.; Kumar, A.; Kumar, A.; Shankar, M.V.; Krishnan, V. Sea urchin shaped ZnO coupled with MoS2 and polyaniline as highly efficient photocatalysts for organic pollutant decomposition and hydrogen evolution. Ceram. Int. 2021, 47, 10301–10313. [Google Scholar] [CrossRef]
- Chang, Y.-C.; Lin, Y.-W.; Lu, M.-Y. Construction of MoS2/ZnO heterostructures as highly efficient photocatalysts for enhanced visible-light decomposition of methylene blue and hydrogen evolution. Mater. Chem. Phys. 2021, 266, 124560. [Google Scholar] [CrossRef]
- Selvaraj, R.; Kalimuthu, K.R.; Kalimuthu, V. A type-II MoS2/ZnO heterostructure with enhanced photocatalytic activity. Mater. Lett. 2019, 243, 183–186. [Google Scholar] [CrossRef]
Publisher’s Note: MDPI stays neutral with regard to jurisdictional claims in published maps and institutional affiliations. |
© 2022 by the authors. Licensee MDPI, Basel, Switzerland. This article is an open access article distributed under the terms and conditions of the Creative Commons Attribution (CC BY) license (https://creativecommons.org/licenses/by/4.0/).