
Droplets Transmission Mechanism in a Commercial Wide-Body Aircraft Cabin


Abstract
:1. Introduction
2. Methods
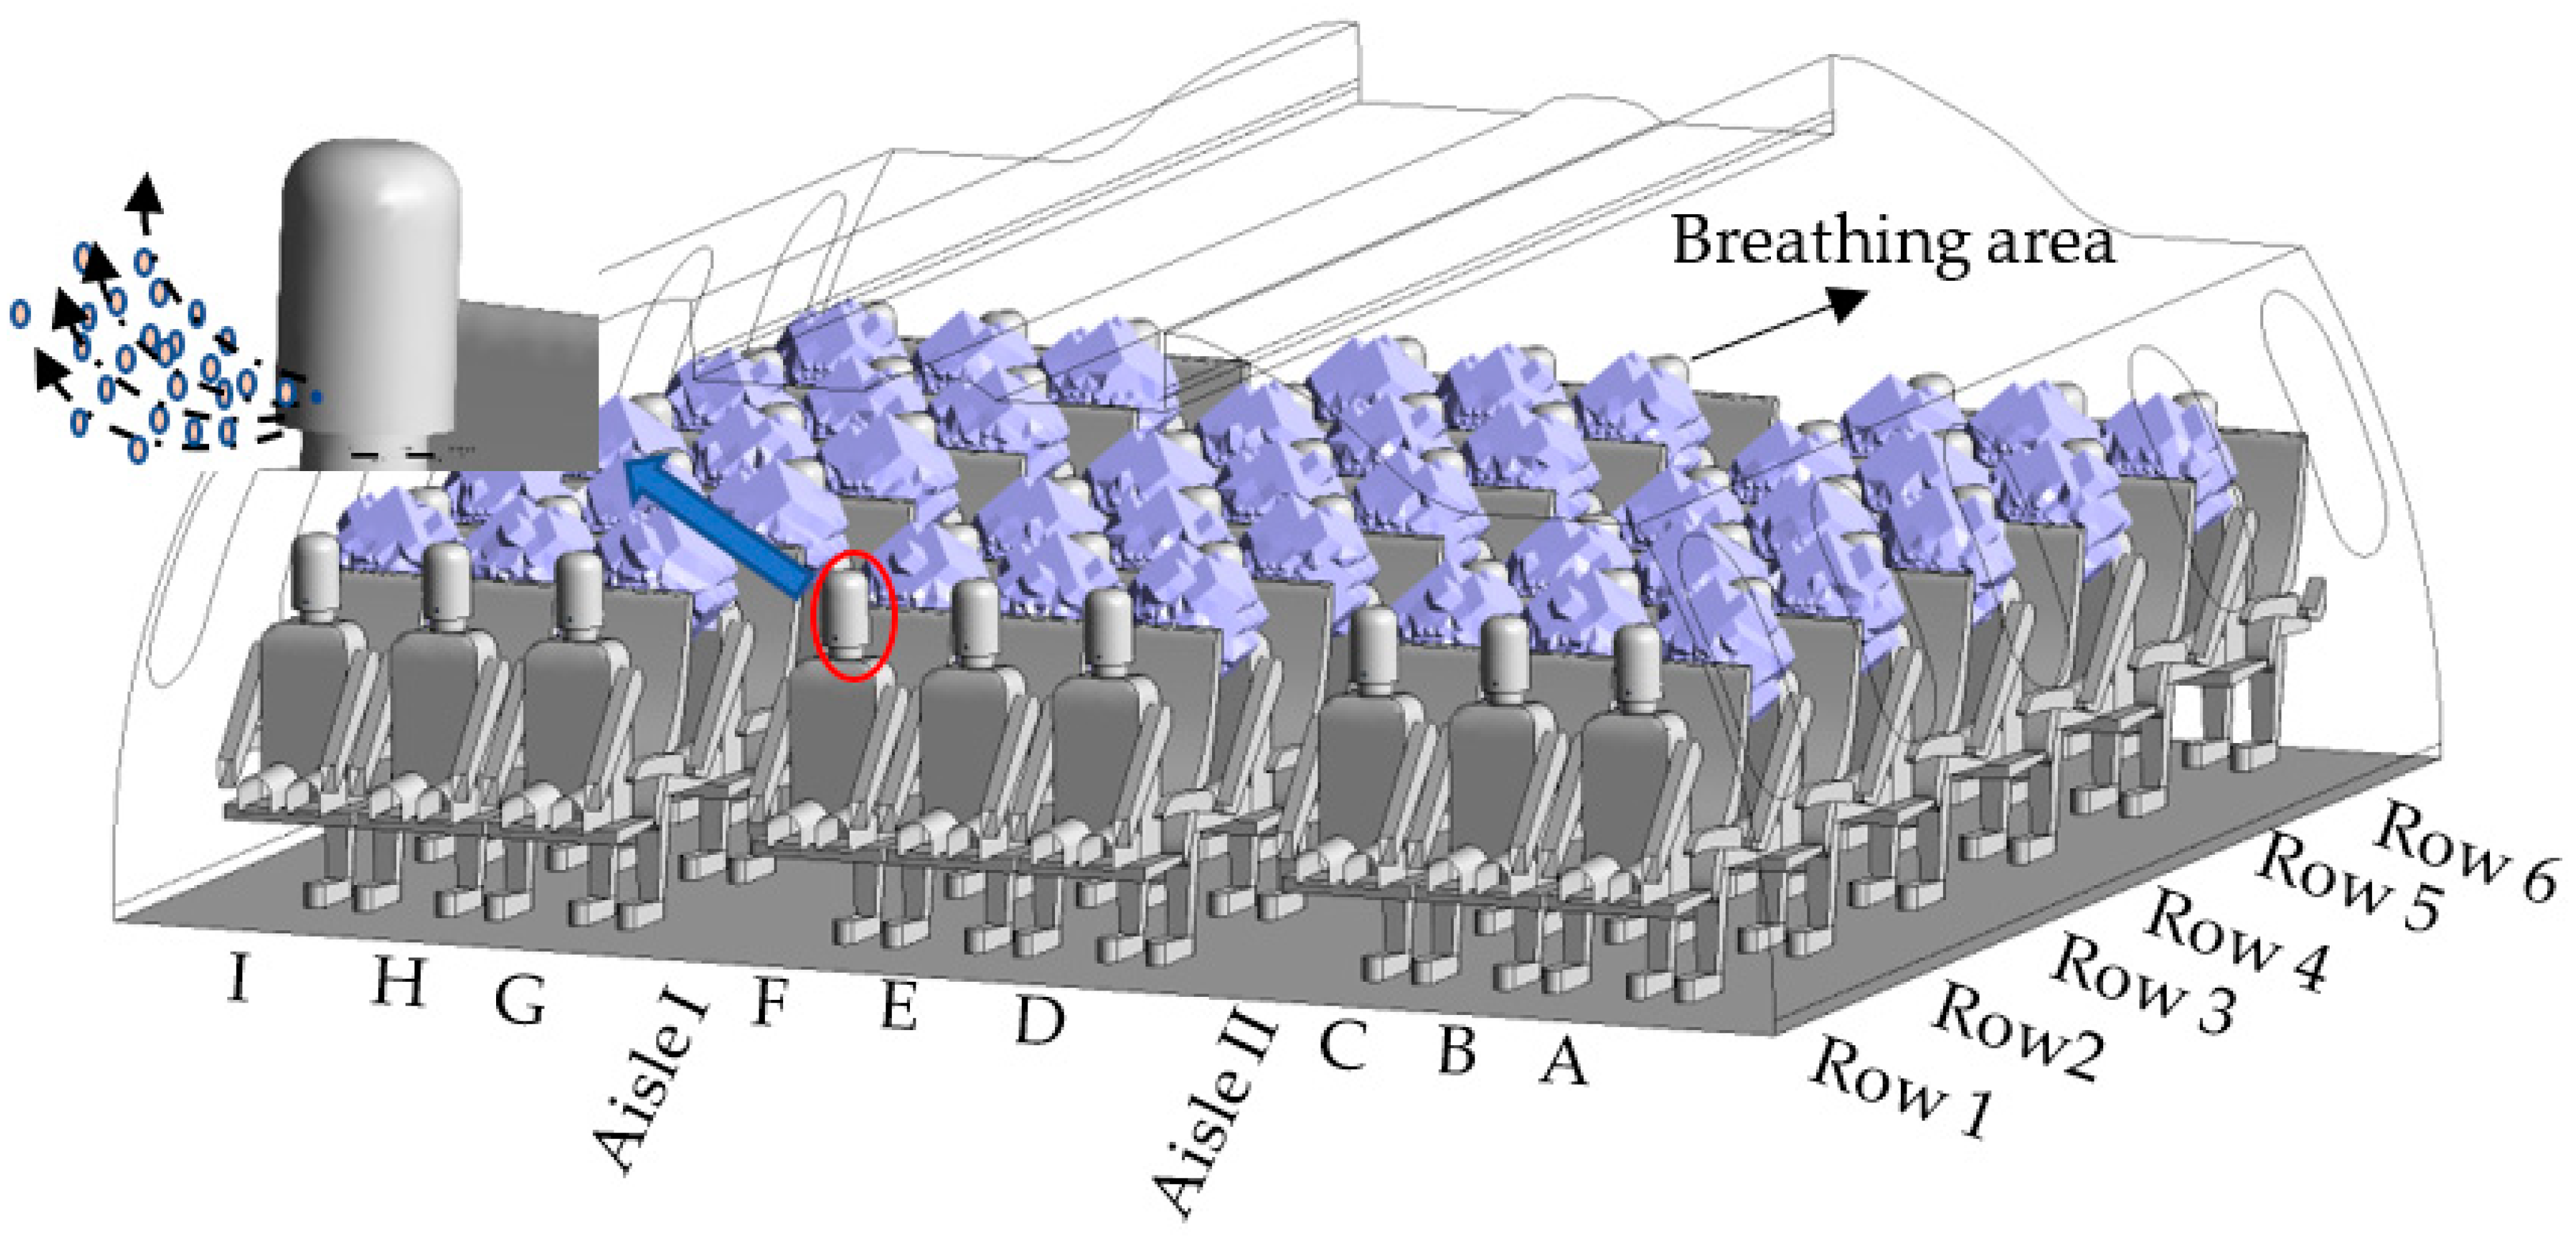
2.1. Model Description and Numerical Case Design
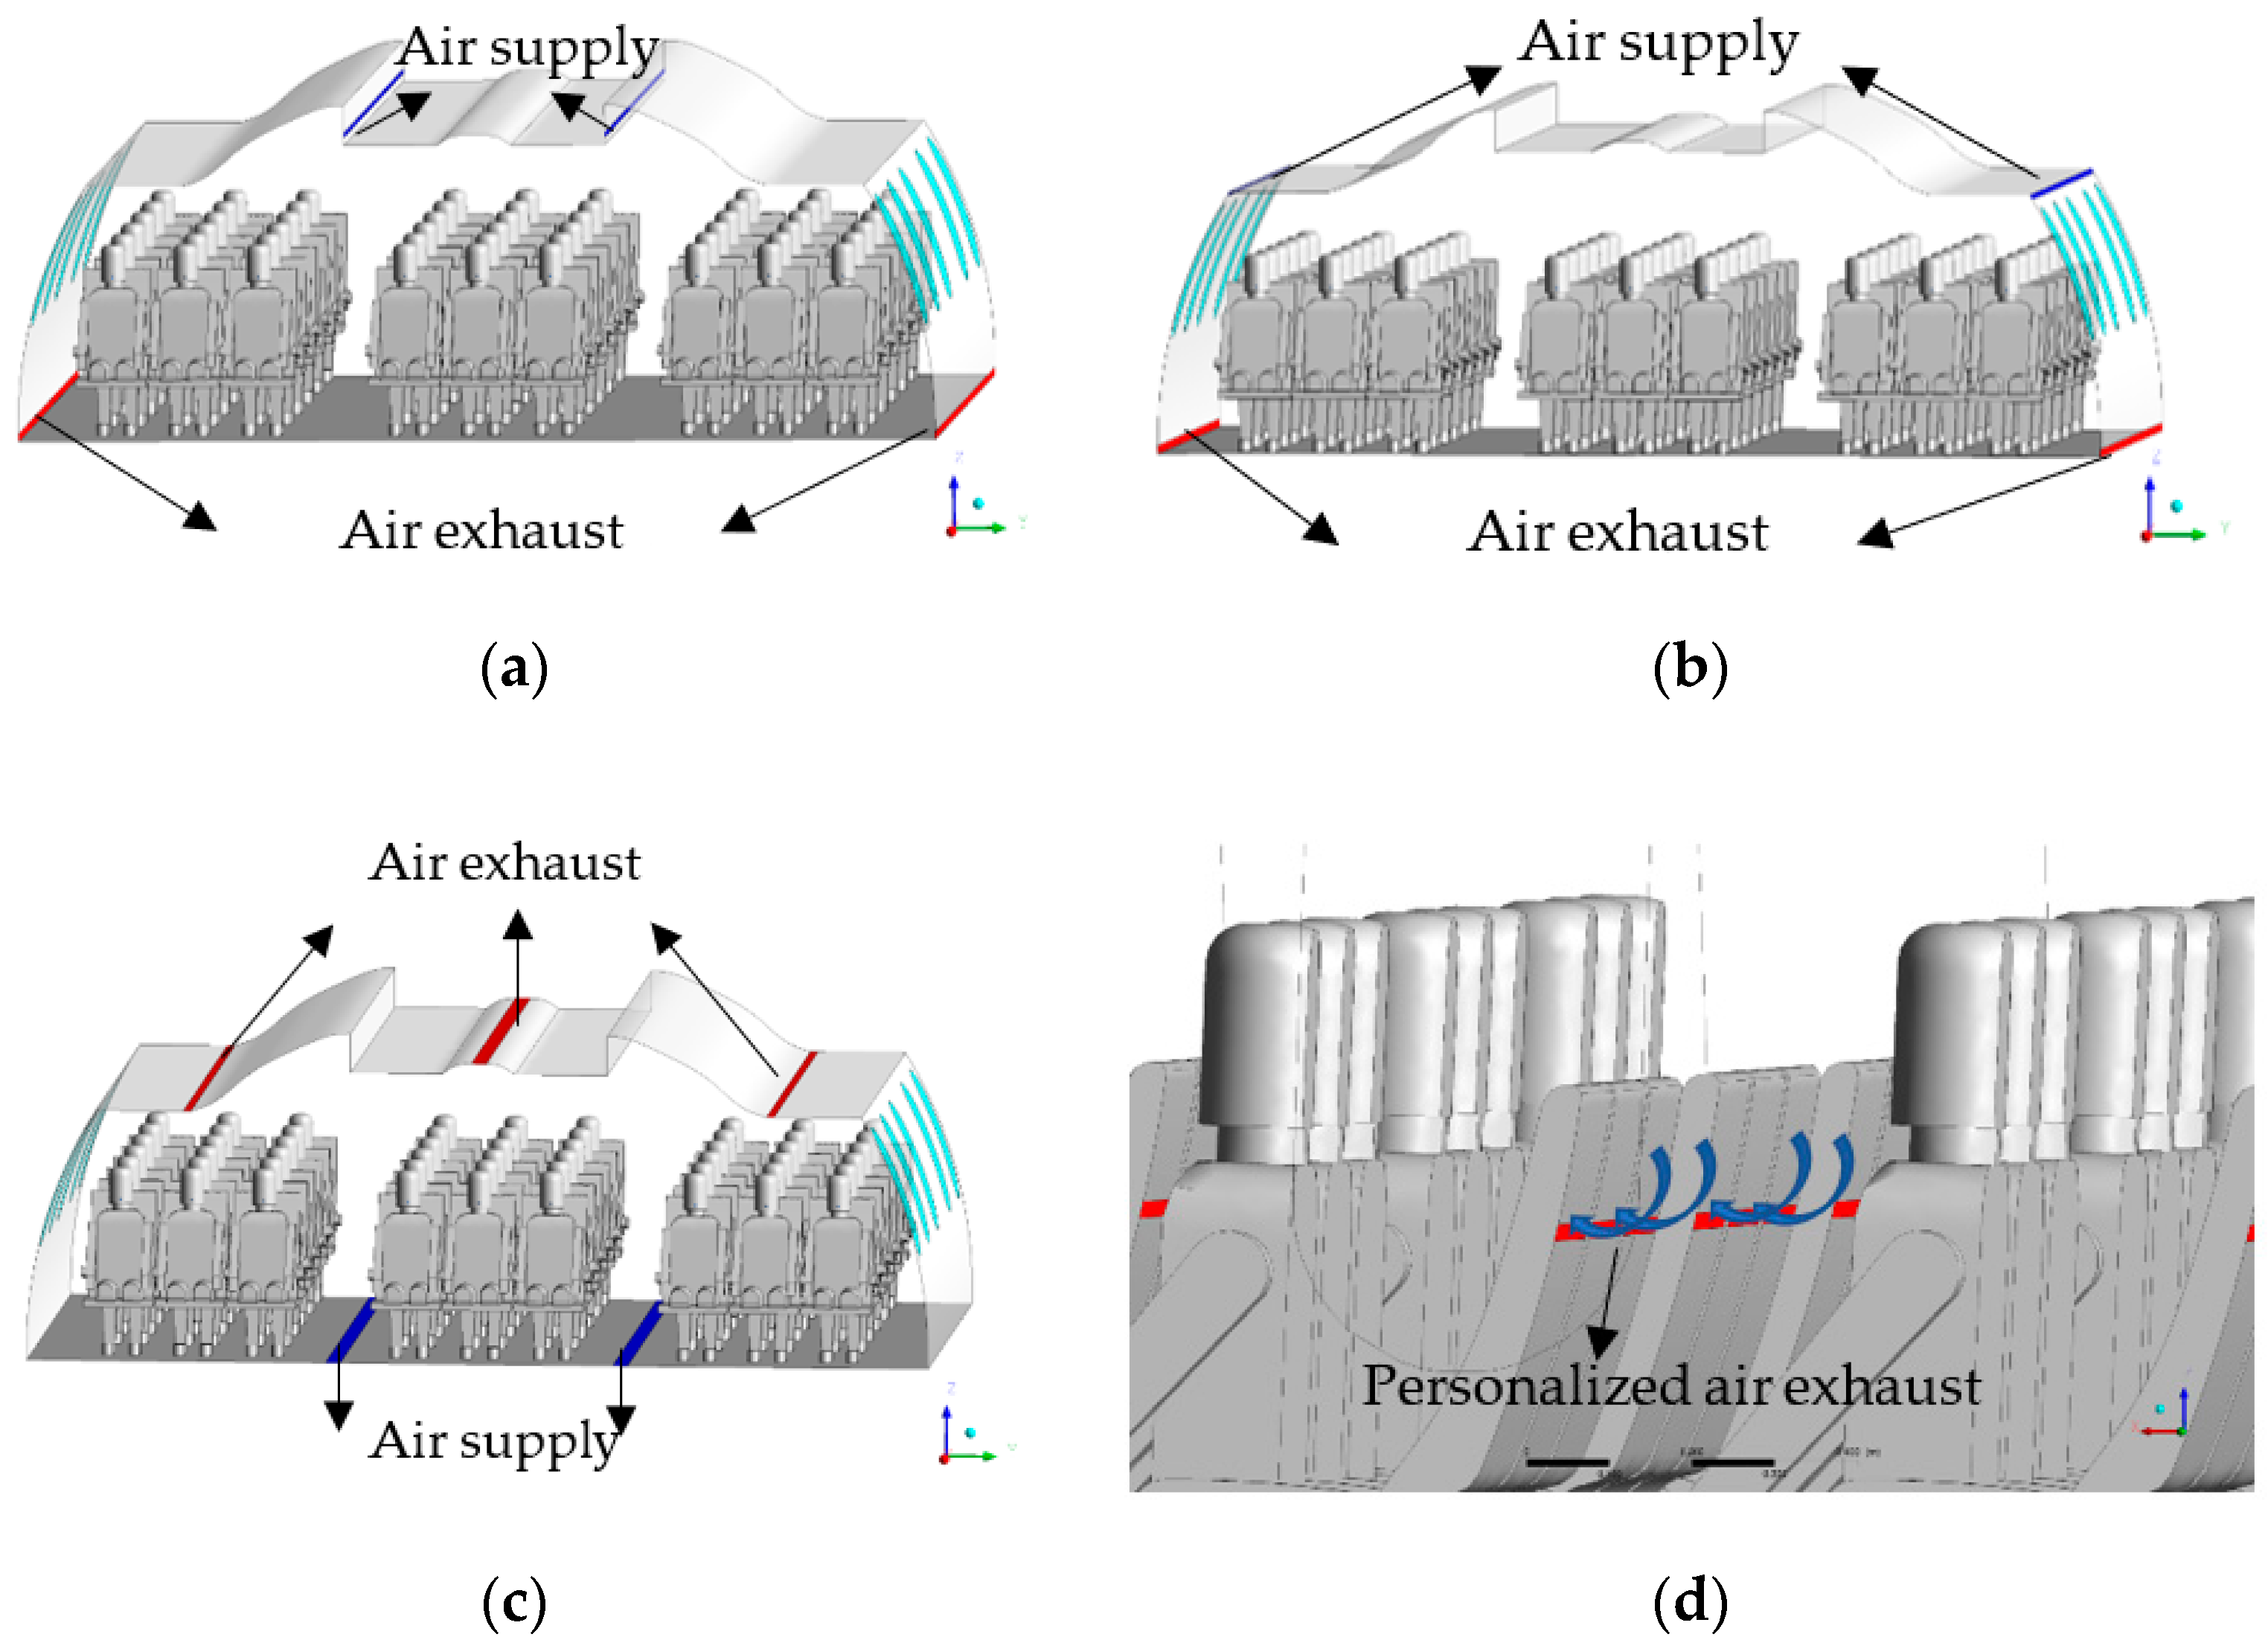
2.1.1. Cabin Ventilation Systems
2.1.2. Boundary Conditions
2.2. Numerical Simulation Method
2.2.1. Turbulence Model
2.2.2. Droplets Model
2.2.3. Algorithm Verification
2.3. Risk Assessment Model
3. Results and Discussion
3.1. Flow Fields of Different Ventilation Systems
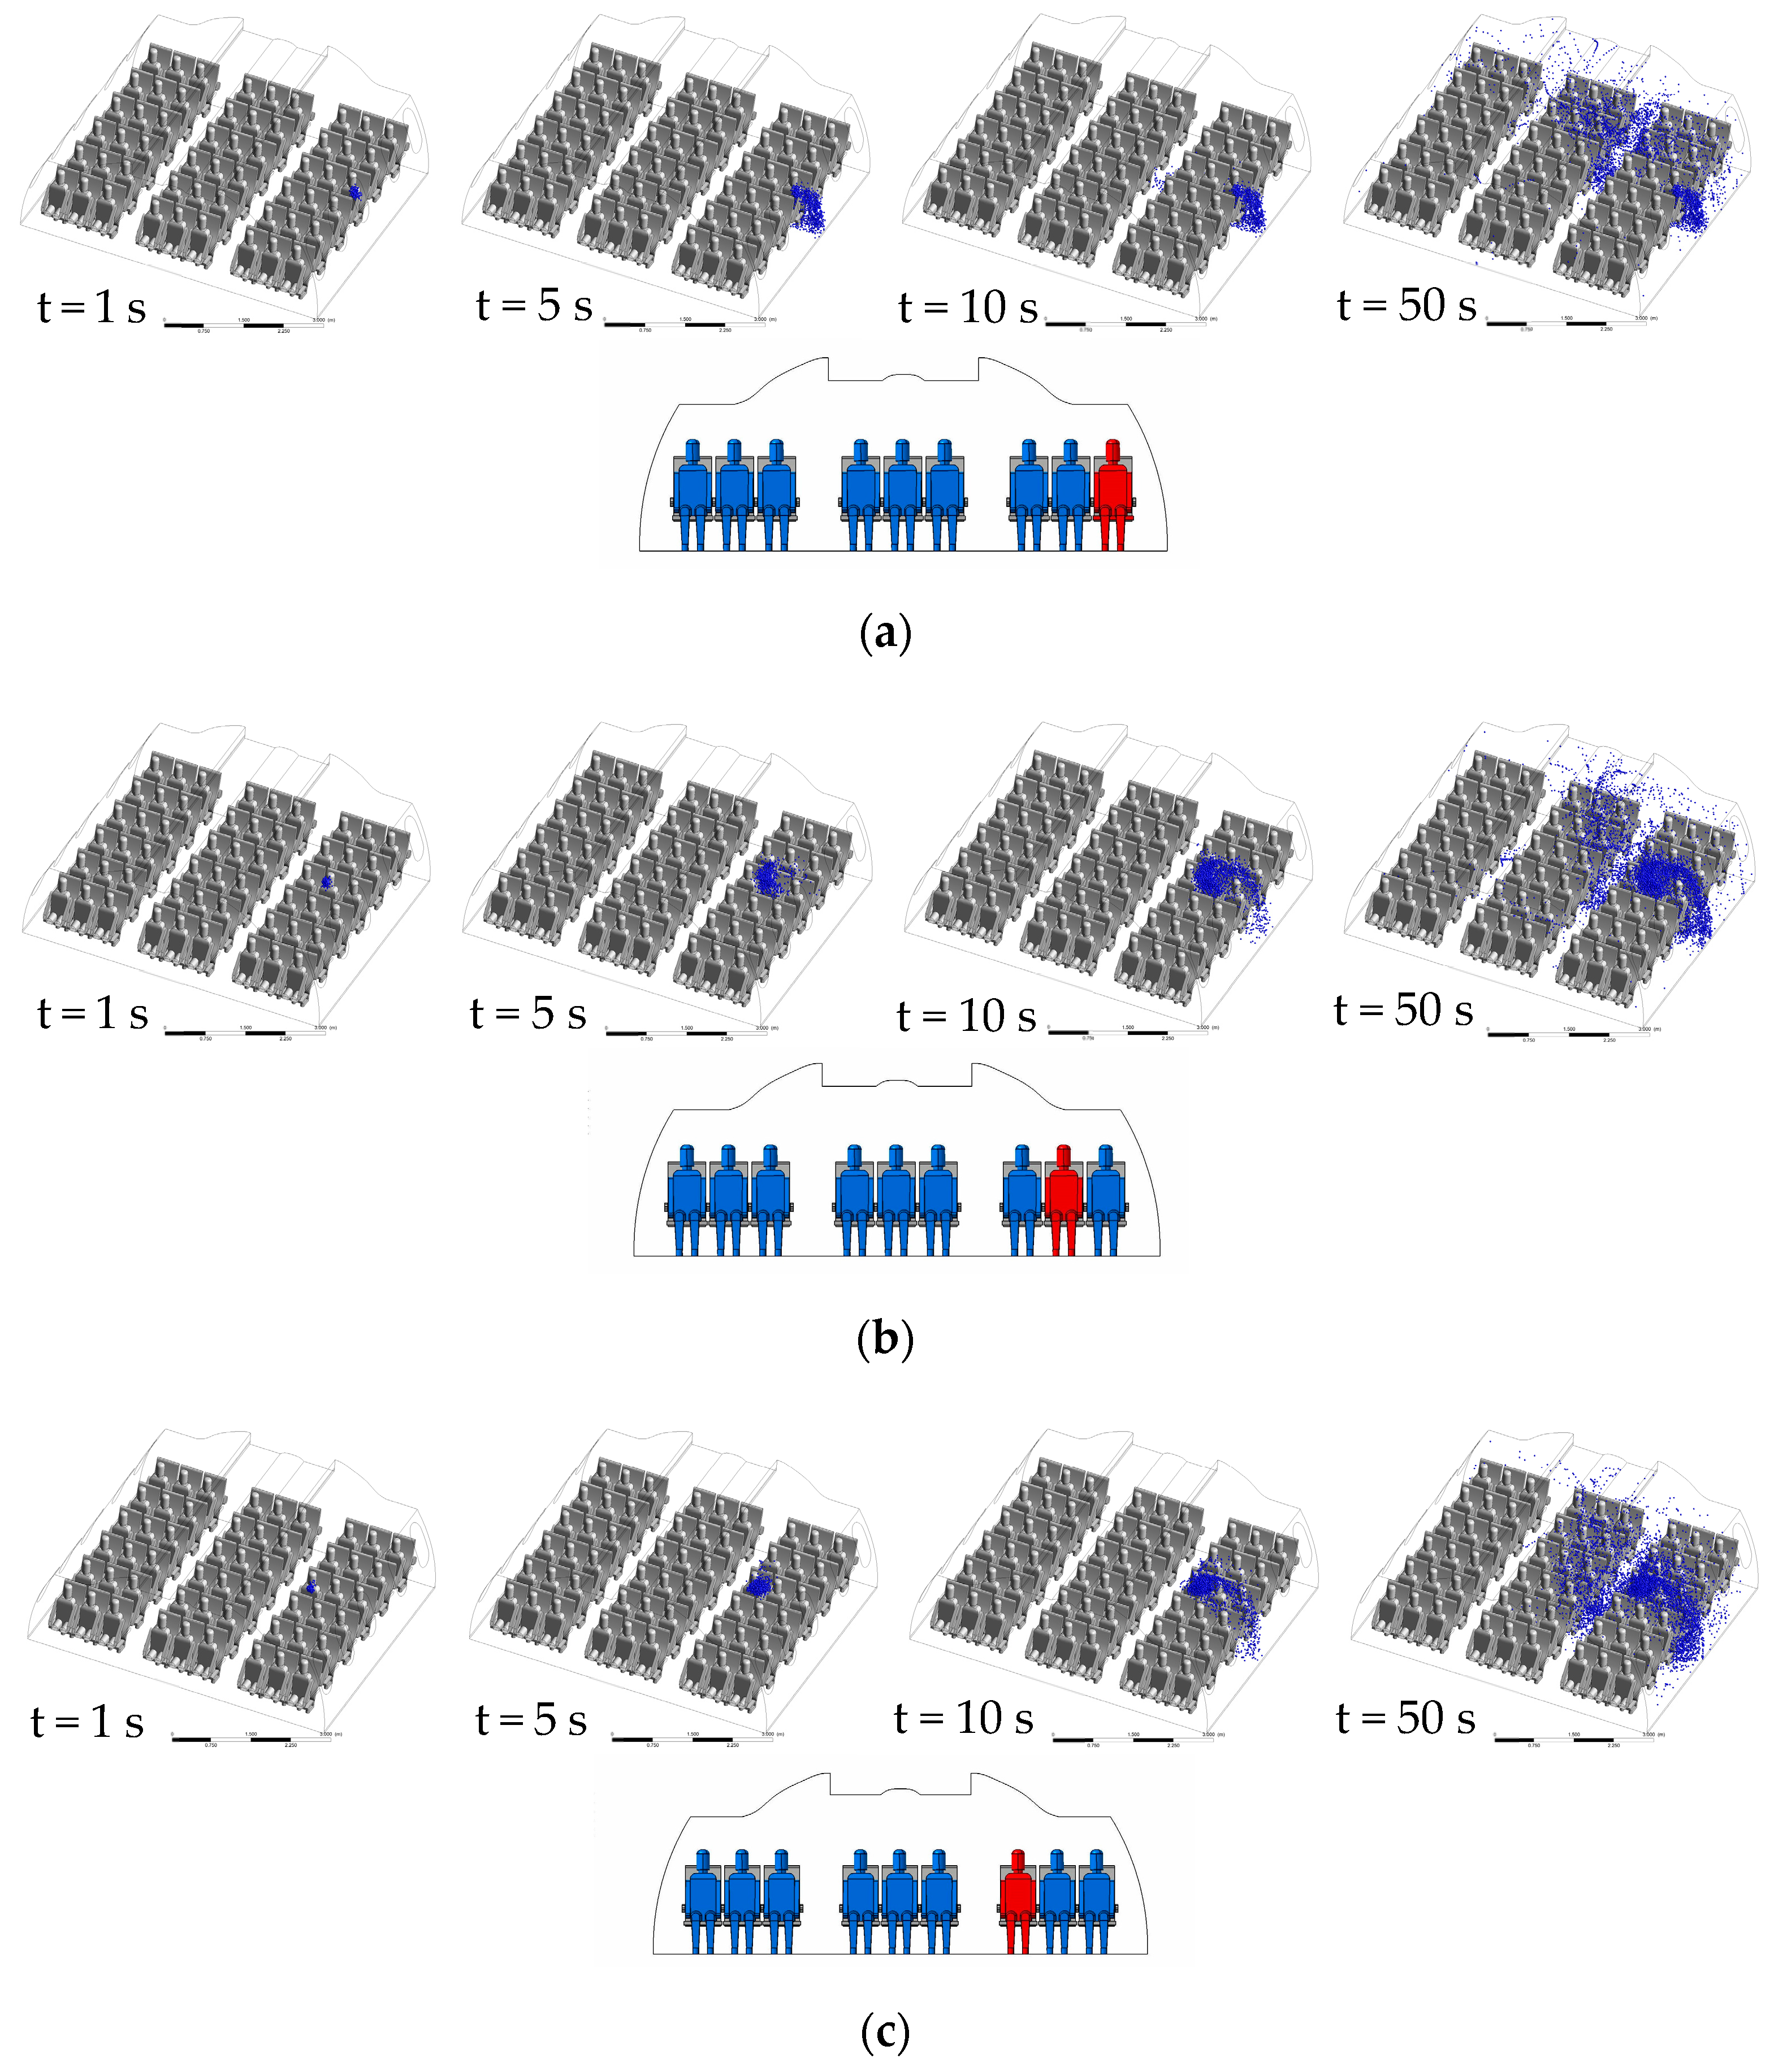
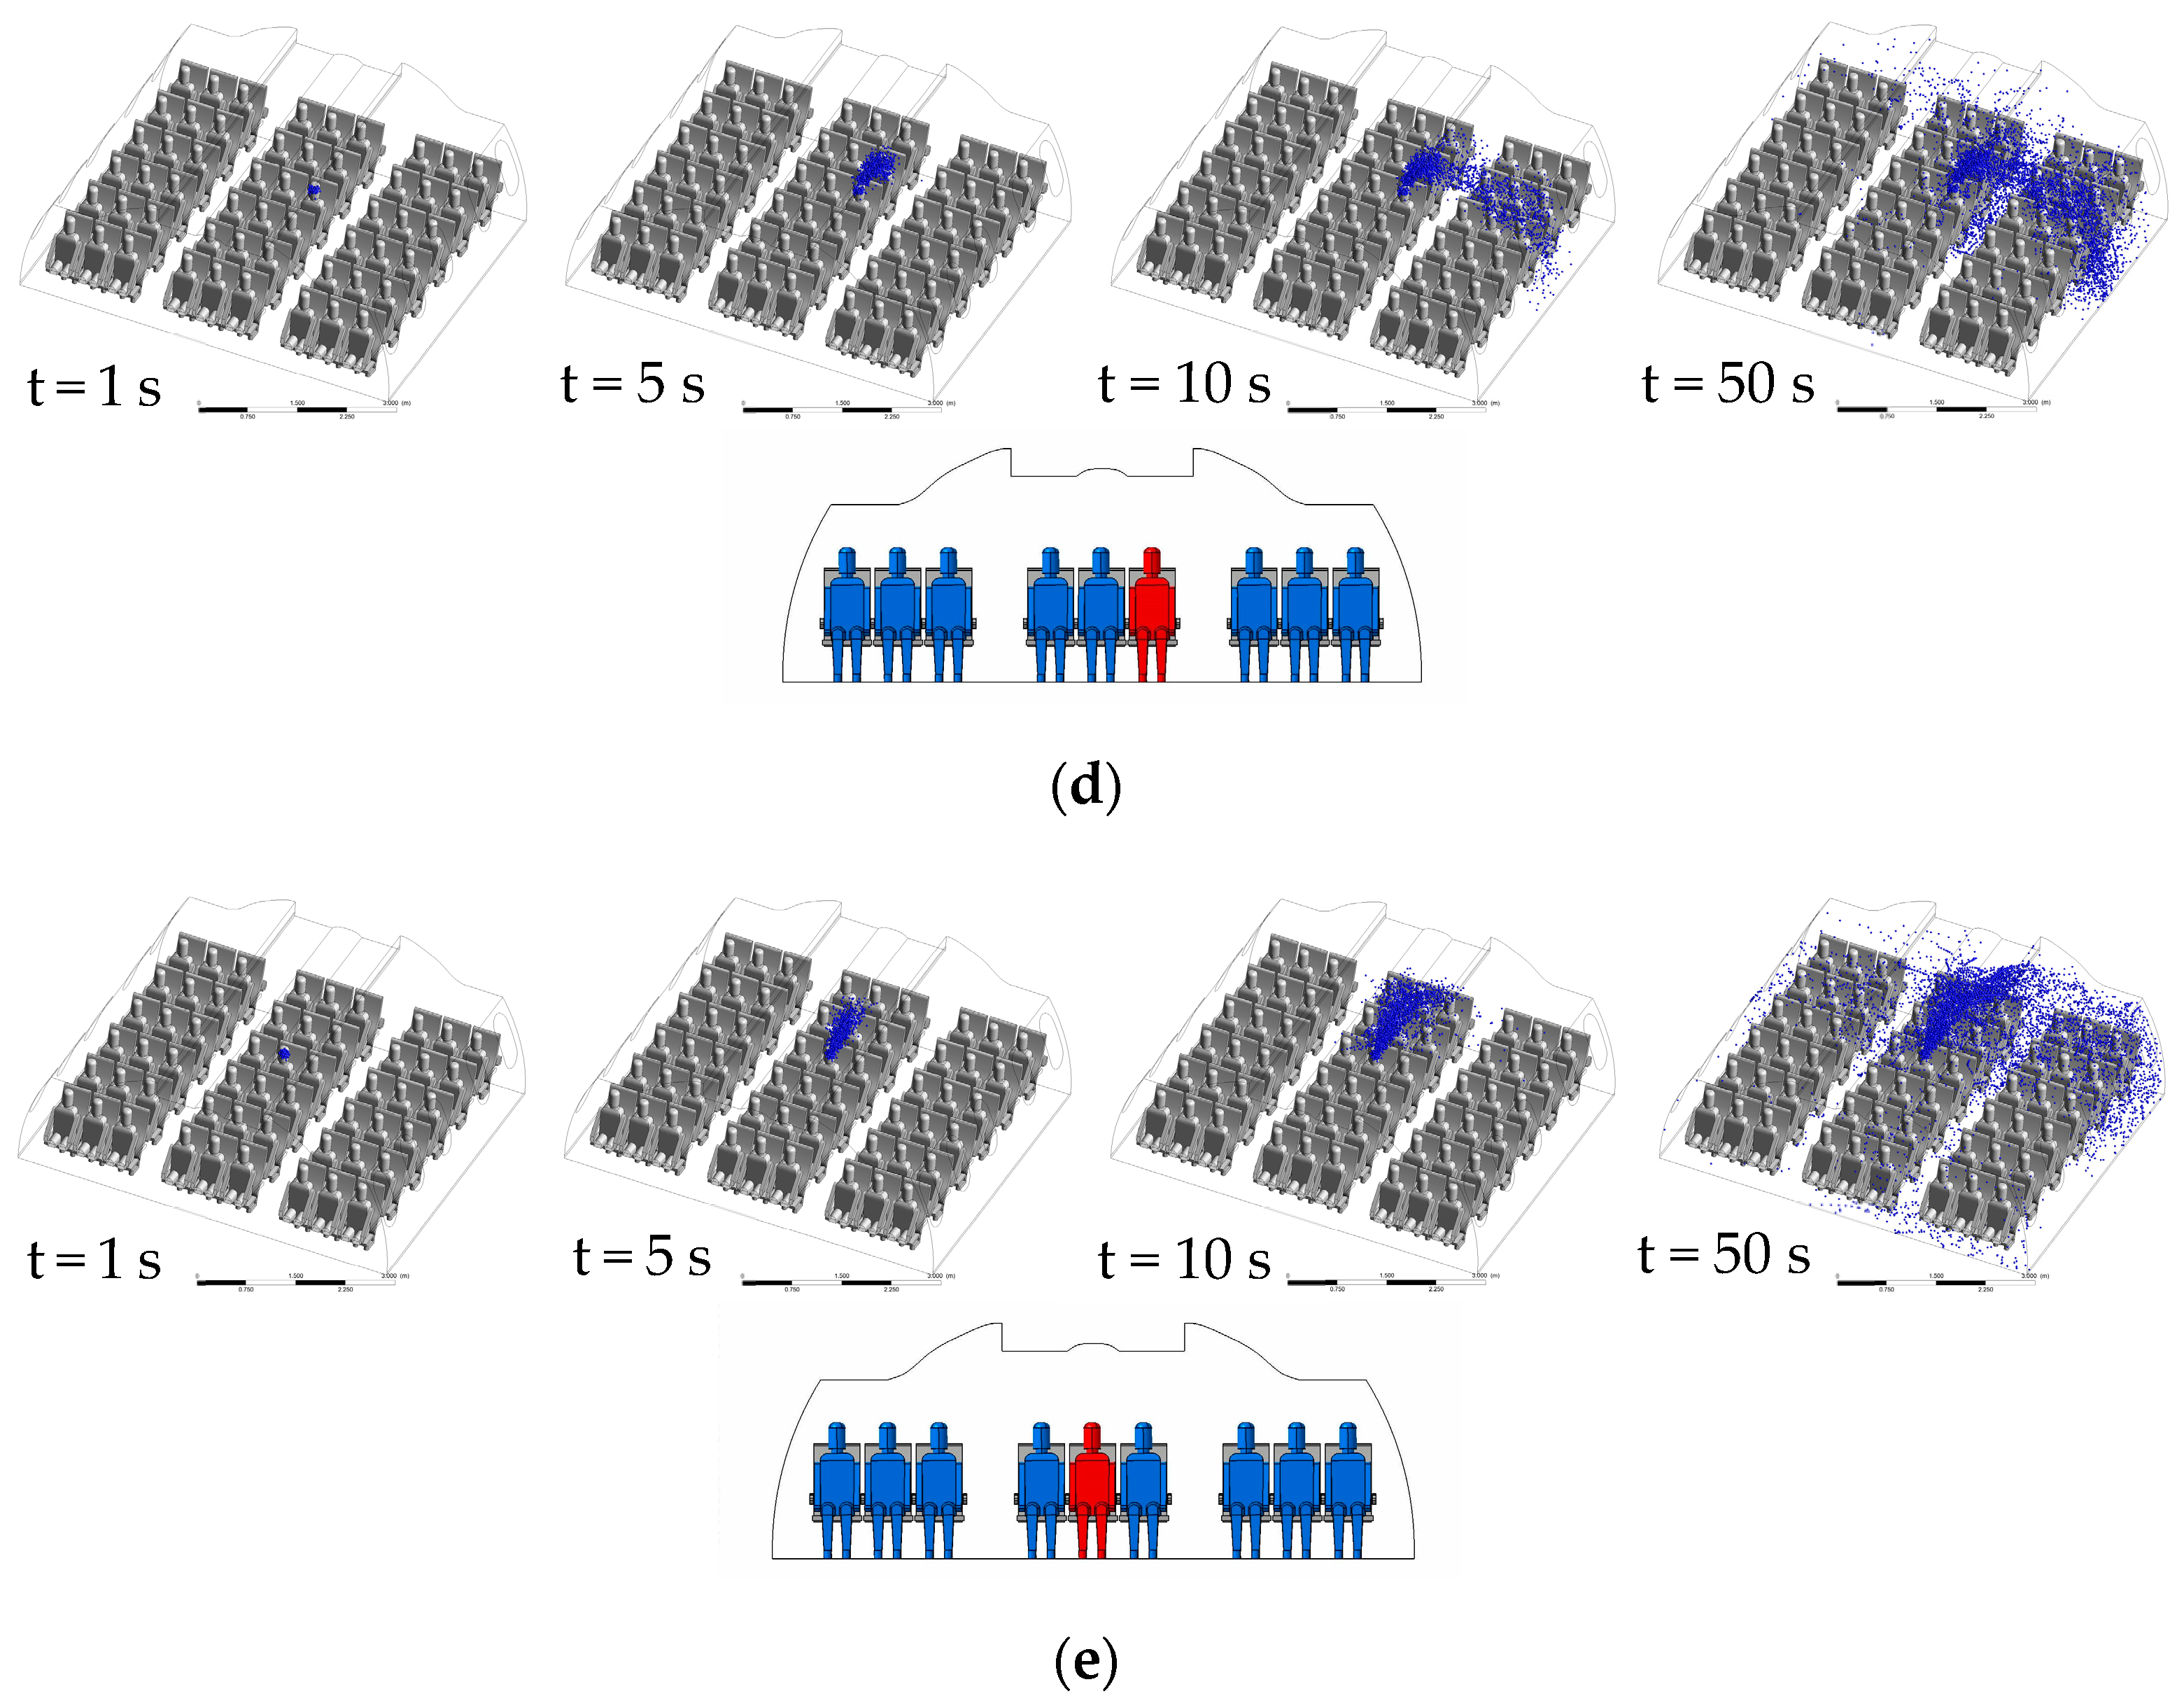
3.2. Droplets Transmission of CMVS
3.3. Droplets Infection Risk Assessment
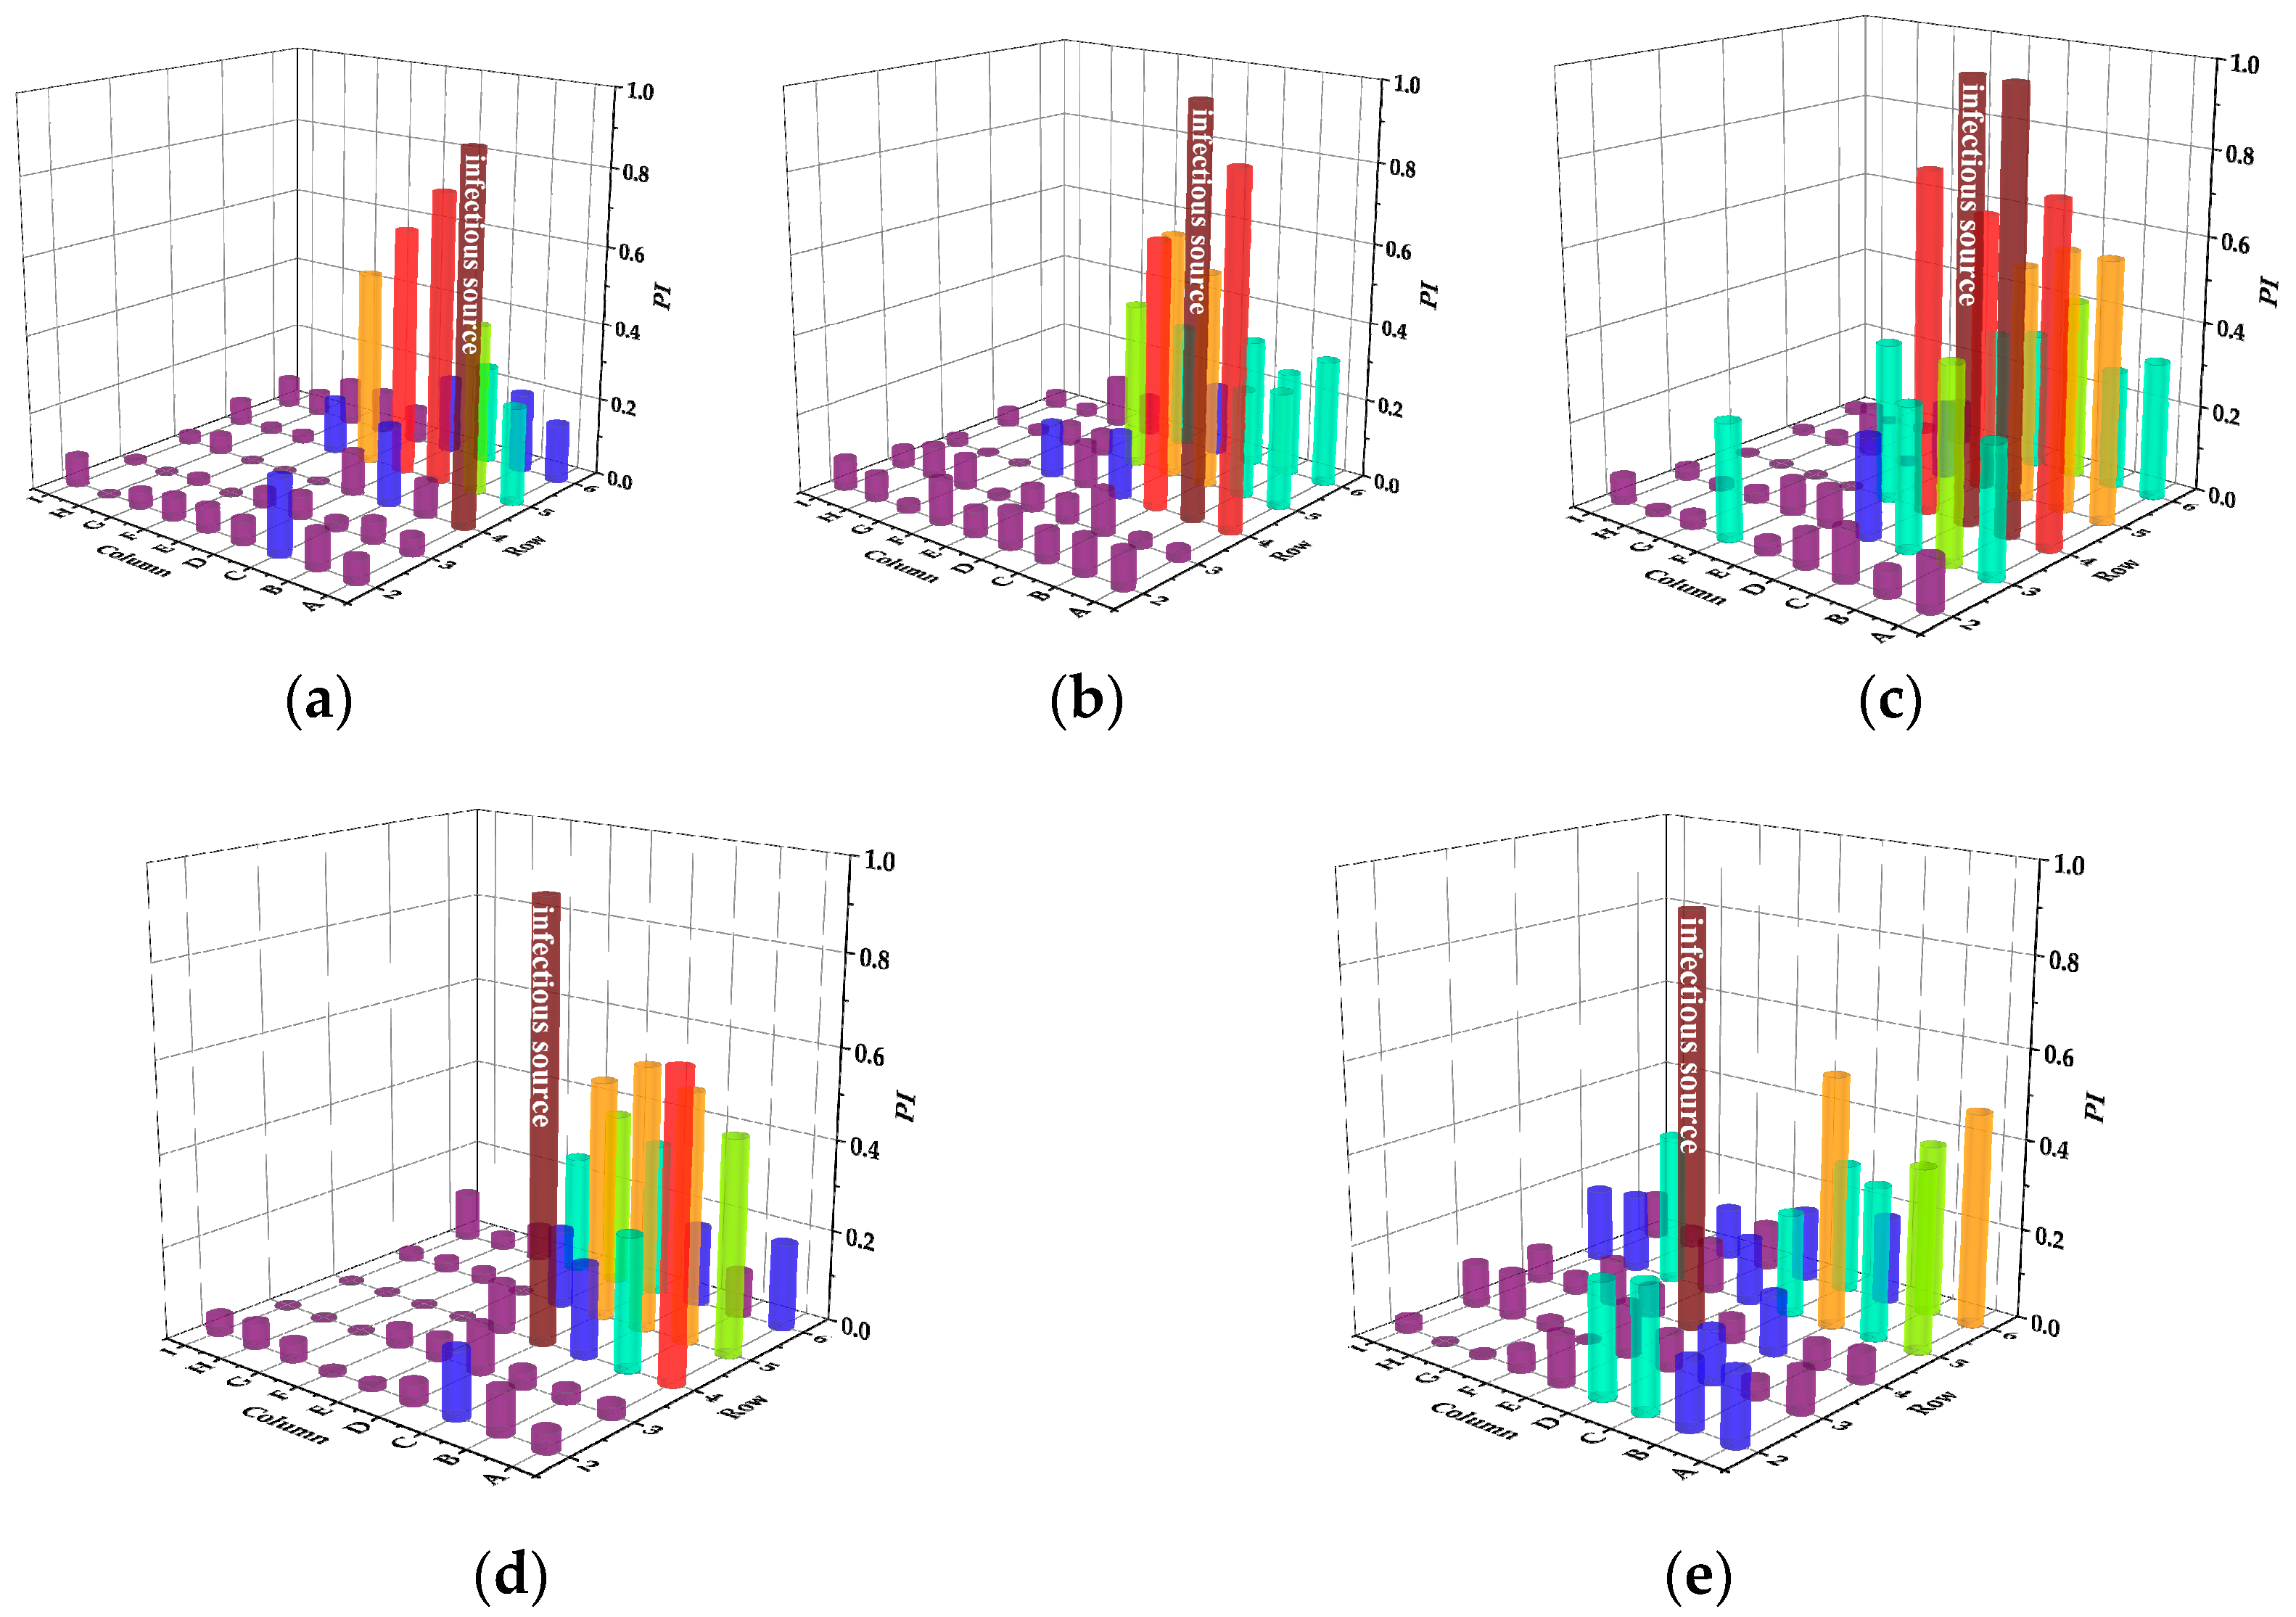
3.3.1. CMVS
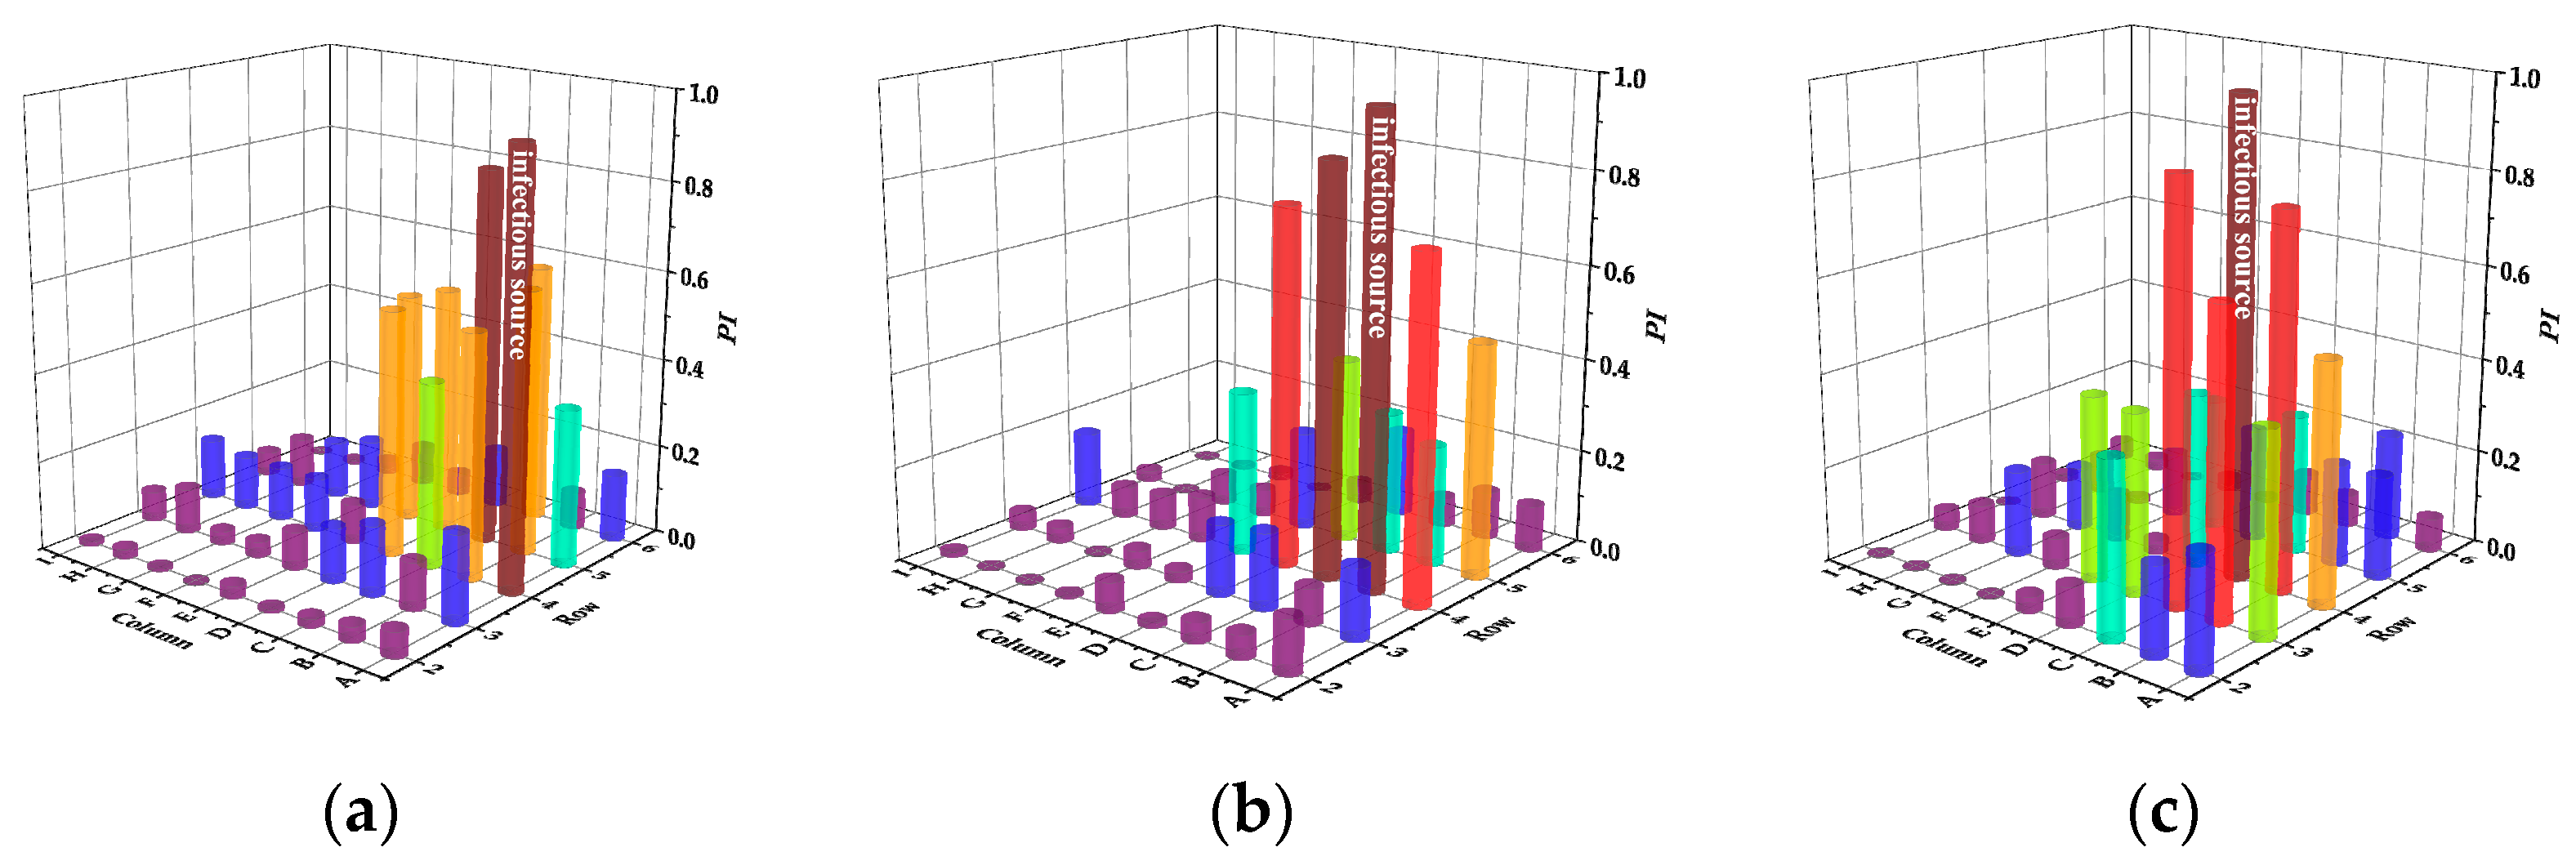
3.3.2. SMVS
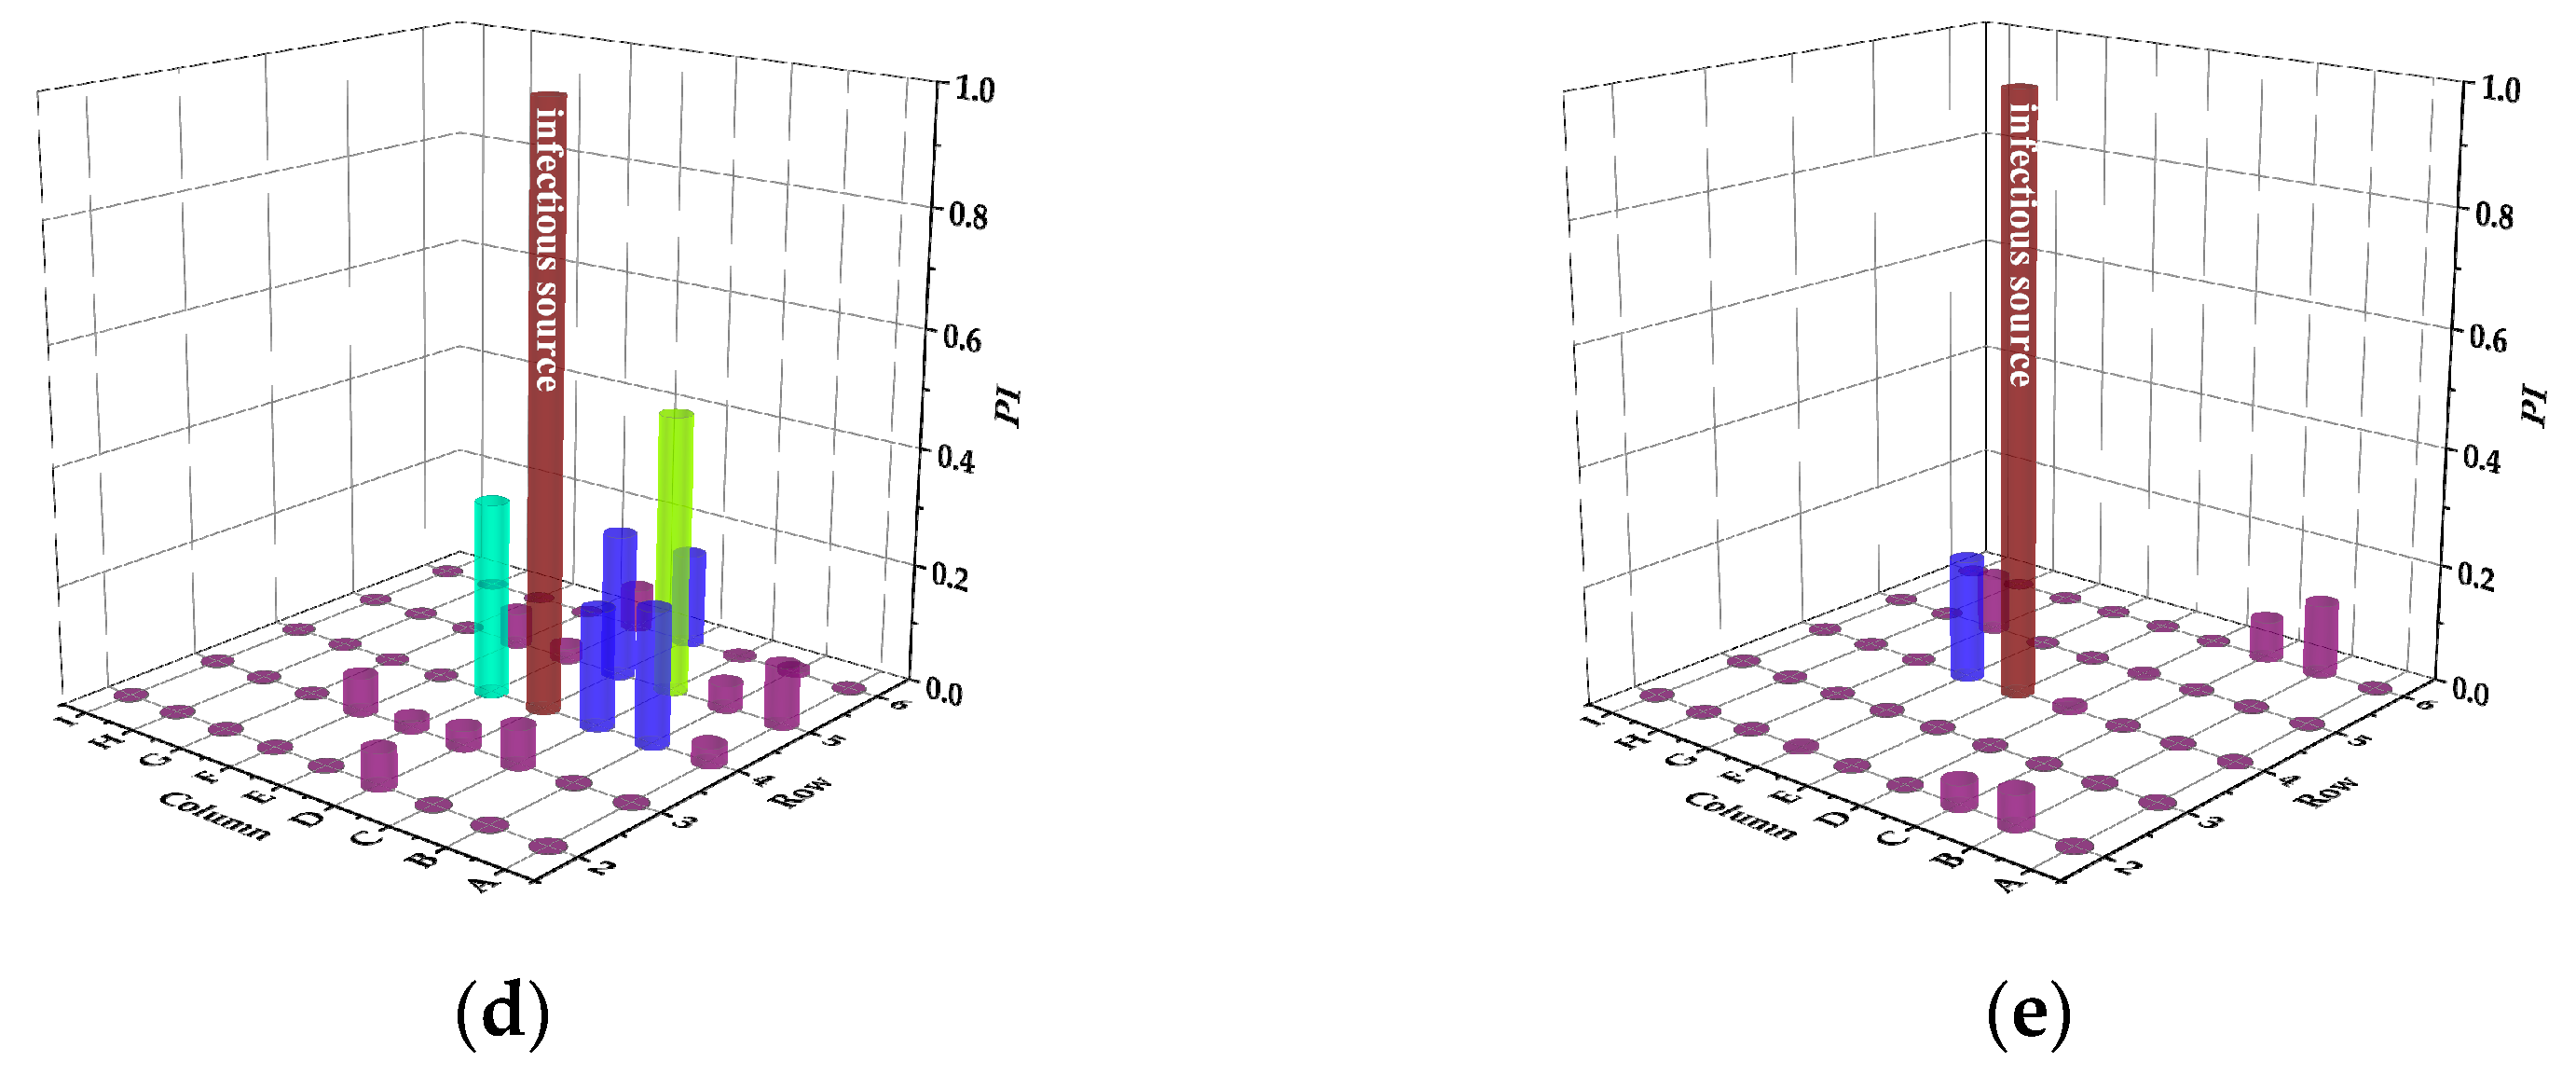
3.3.3. DVS
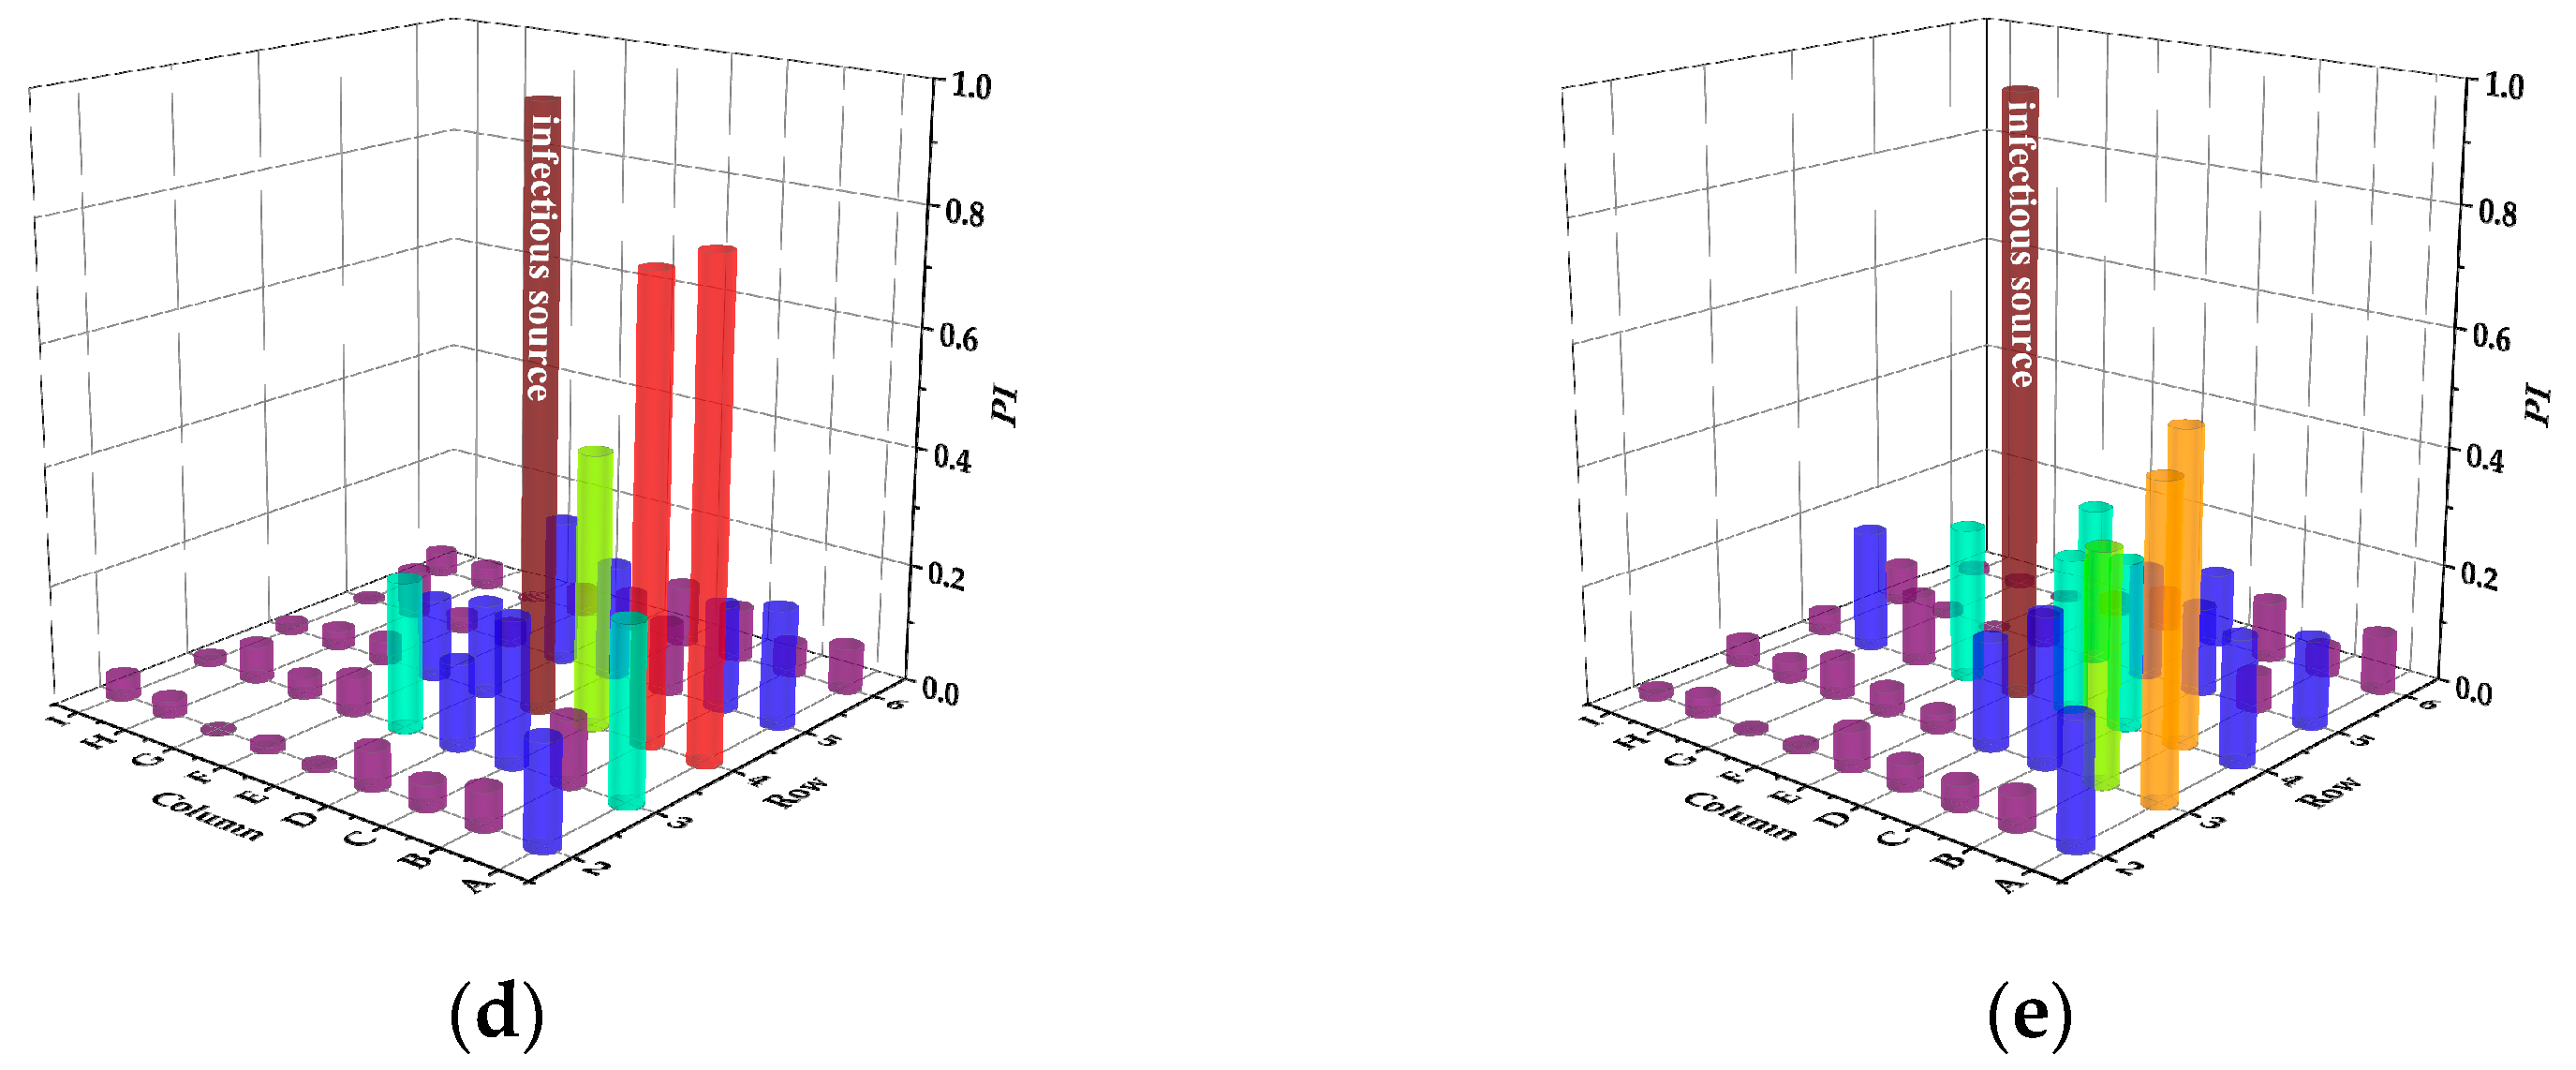
3.3.4. PVS
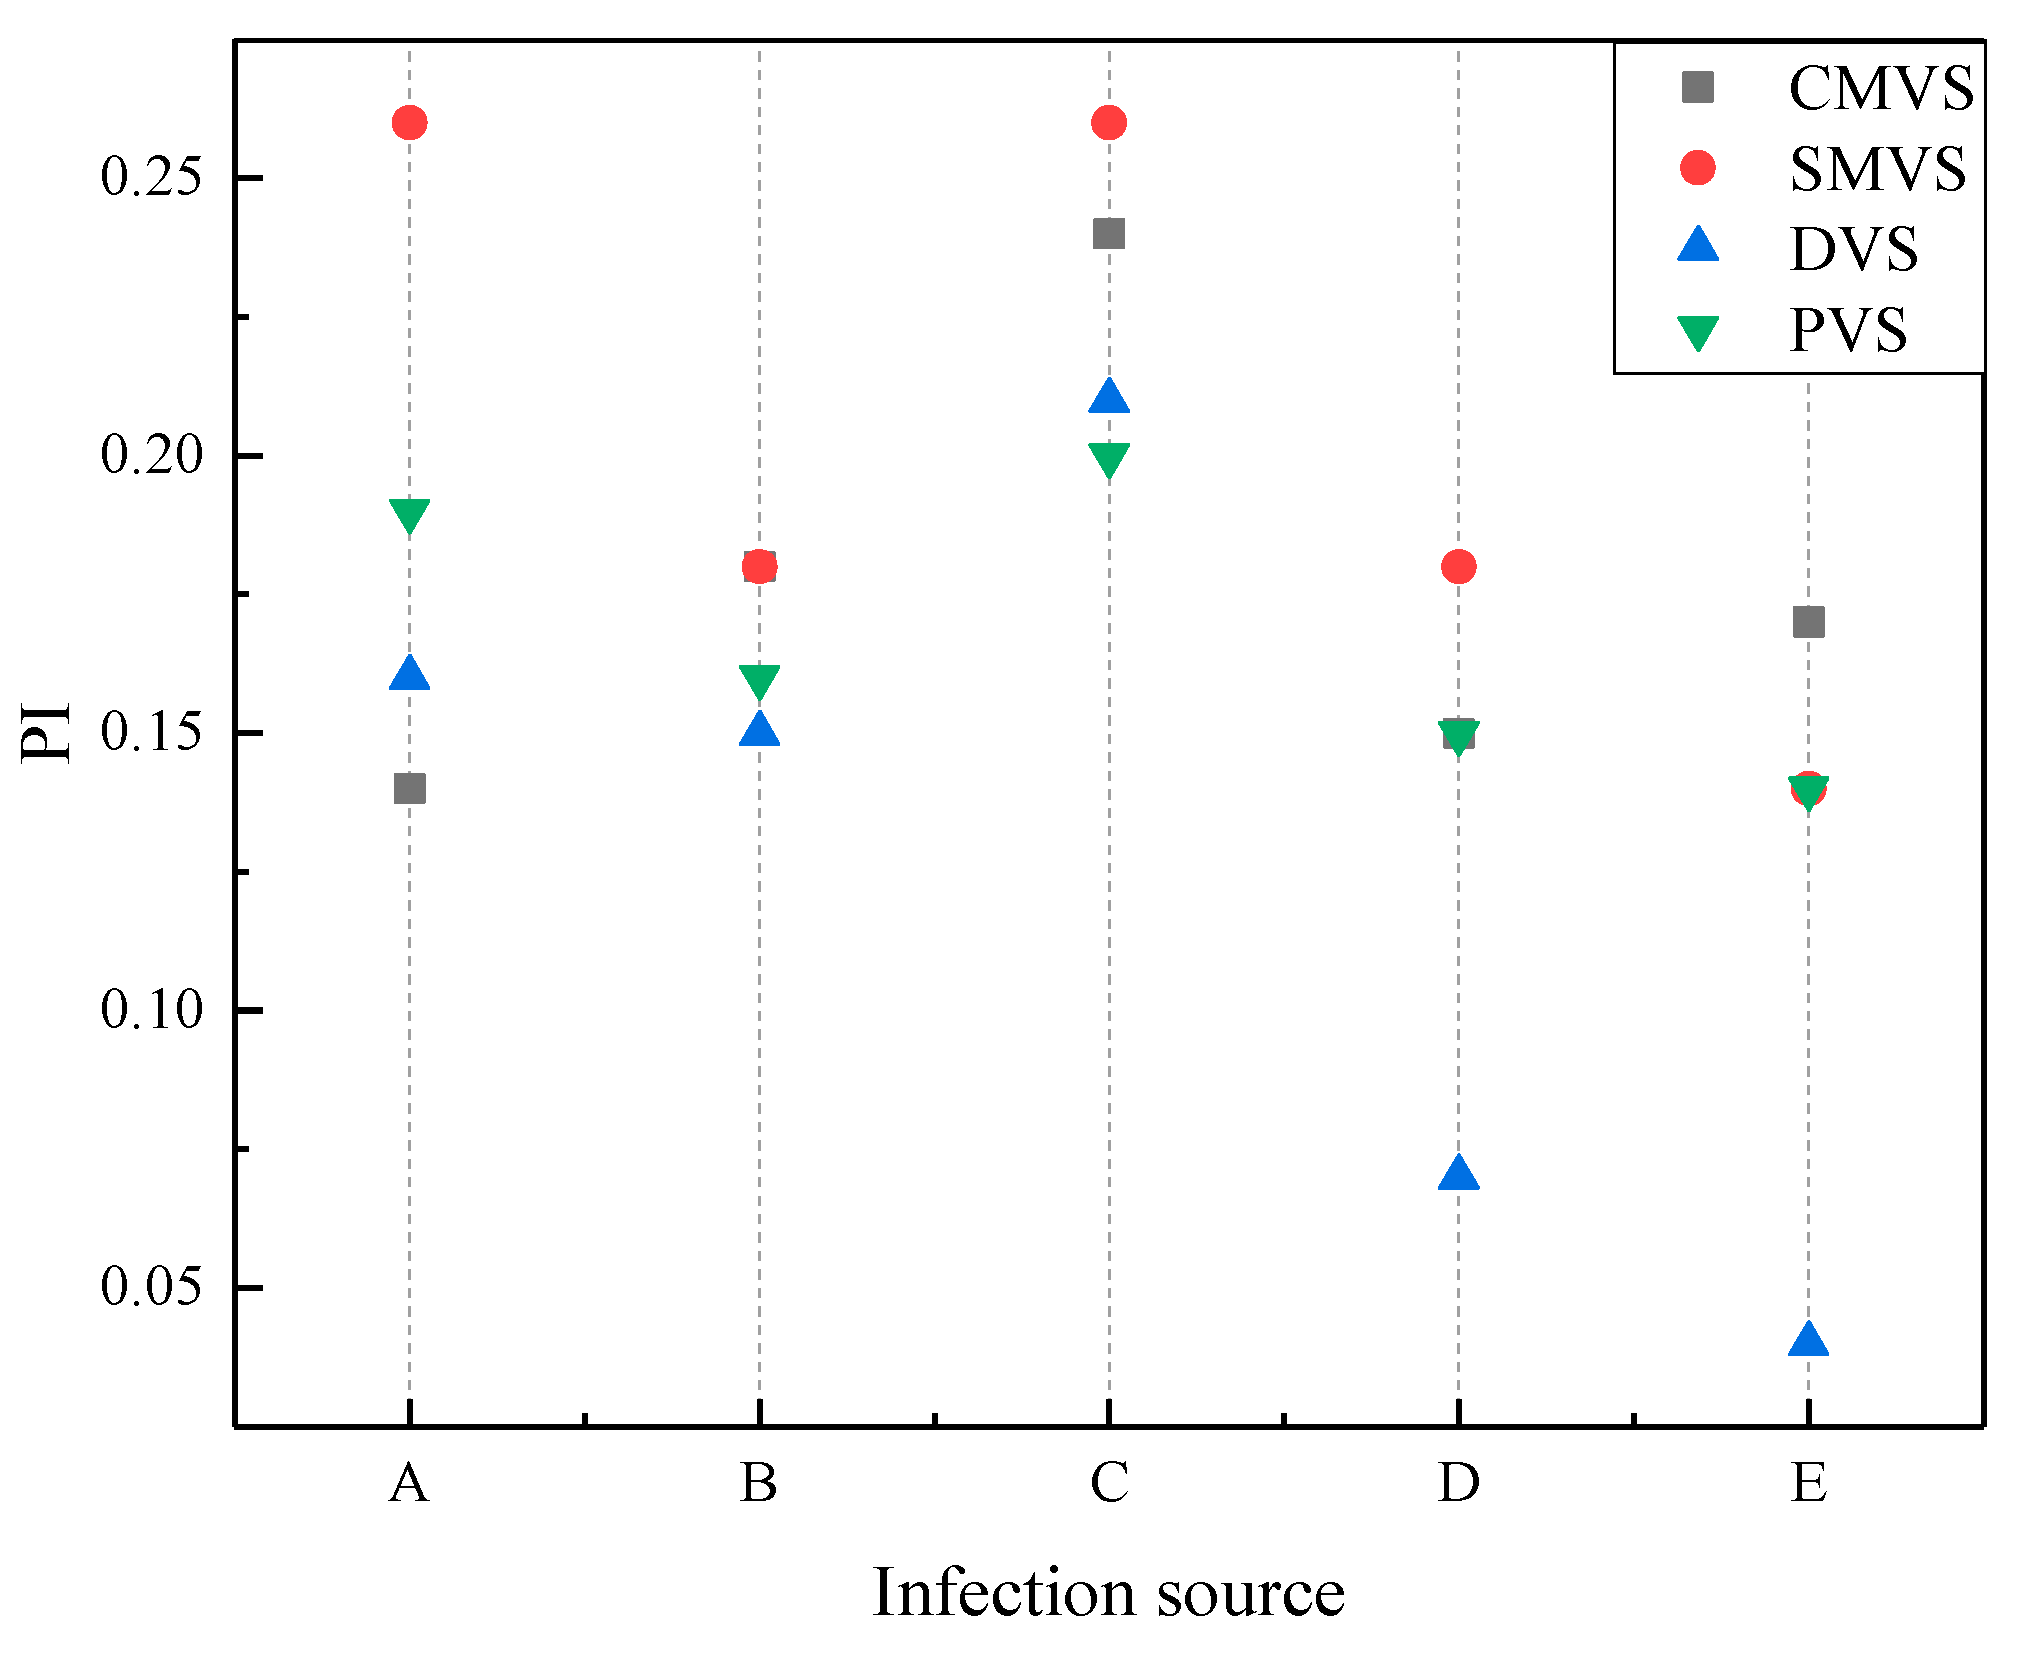
3.3.5. Performance Comparison of Different Ventilation Systems
4. Conclusions
- (1)
- The droplets transmission mechanism and the infection risk of passengers are closely related to the type of ventilation system used in the aircraft cabin and the location of the infectious source.
- (2)
- Under the same ventilation system, when passenger C is the infectious source, the cabin environment is at greatest risk compared with other infectious sources.
- (3)
- The infection risk of mixing ventilation is greater than that of displacement ventilation. Therefore, from the perspective of epidemic prevention, the cabin air flow should be organized as direct as possible, and the passenger breathing area should avoid the air flow pathways between the passenger’s mouth and the air outlet as far as possible.
- (4)
- The personalized ventilation system proposed in this study can effectively reduce the infection risk of the cabin, the infection risk of passengers is reduced by up to 27%.
Author Contributions
Funding
Data Availability Statement
Conflicts of Interest
References
- Flugge, C. Uber luftinfection. Z. Hyg. Infekt. 1897, 25, 179–224. [Google Scholar]
- World Health Organization. Novel Coronavirus (2019-nCoV): Situation Report; WHO: Geneva, Switzerland, 2020. [Google Scholar]
- Chao, C.Y.H.; Wan, M.P.; Sze To, G.N. Transport and removal of expiratory droplets in hospital ward environment. Aerosol Sci. Technol. 2008, 42, 377–394. [Google Scholar] [CrossRef]
- Qian, H.; Li, Y. Removal of exhaled particles by ventilation and deposition in a multibed airborne infection isolation room. Indoor Air 2010, 20, 284–297. [Google Scholar] [CrossRef] [PubMed]
- Liu, Z.; Zhu, H.; Song, Y.; Cao, G. Quantitative distribution of human exhaled particles in a ventilation room. Build. Simul. 2022, 15, 859–870. [Google Scholar] [CrossRef] [PubMed]
- Yang, X.; Ou, C.; Yang, H.; Liu, L.; Song, T.; Kang, M.; Lin, H.; Hang, J. Transmission of pathogen-laden expiratory droplets in a coach bus. J. Hazard. Mater. 2020, 397, 122609. [Google Scholar] [CrossRef]
- Zhang, L.; Li, Y. Dispersion of coughed droplets in a fully-occupied high-speed rail cabin. Build. Environ. 2012, 47, 58–66. [Google Scholar] [CrossRef]
- Mangili, A.; Gendreau, M.A. Transmission of infectious diseases during commercial air travel. Lancet 2005, 365, 989–996. [Google Scholar] [CrossRef]
- Yin, S.; Sze To, G.N.; Chao, C.Y.H. Retrospective analysis of multi-drug resistant tuberculosis outbreak during a flight using computational fluid dynamics and infection risk assessment. Build. Environ. 2012, 47, 50–57. [Google Scholar] [CrossRef]
- Gupta, J.K.; Lin, C.; Chen, Q. Transport of expiratory droplets in an aircraft cabin. Indoor Air 2011, 21, 3–11. [Google Scholar] [CrossRef]
- Sze To, G.N.; Wan, M.P.; Chao, C.Y.H.; Fang, L.; Melikov, A. Experimental study of dispersion and deposition of expiratory aerosols in aircraft cabins and impact on infectious disease transmission. Aerosol Sci. Technol. 2009, 43, 466–485. [Google Scholar] [CrossRef]
- Yan, Y.; Li, X.; Shang, Y.; Tu, J. Evaluation of airborne disease infection risks in an airliner cabin using the Lagrangian-based Wells-Riley approach. Build. Environ. 2017, 121, 79–92. [Google Scholar] [CrossRef] [PubMed]
- Yan, Y.; Li, X.; Yang, L.; Yan, P.; Tu, J. Evaluation of cough-jet effects on the transport characteristics of respiratory-induced contaminants in airline passengers’ local environments. Build. Environ. 2020, 183, 107206. [Google Scholar] [CrossRef] [PubMed]
- Yan, Y.; Li, X.; Fang, X.; Yan, P.; Tu, J. Transmission of COVID-19 virus by cough-induced particles in an airliner cabin section. Eng. Appl. Comput. Fluid Mech. 2021, 15, 934–950. [Google Scholar] [CrossRef]
- Liu, M.; Liu, J.; Cao, Q.; Li, X.; Liu, S.; Ji, S.; Lin, C.; Wei, D.; Shen, X.; Long, Z.; et al. Evaluation of different air distribution systems in a commercial airliner cabin in terms of comfort and COVID-19 infection risk. Build. Environ. 2022, 208, 108590. [Google Scholar] [CrossRef] [PubMed]
- Talaat, K.; Abuhegazy, M.; Mahfoze, O.; Anderoglu, O.; Poroseva, S. Simulation of aerosol transmission on a Boeing 737 airplane with intervention measures for COVID-19 mitigation. Phys. Fluids 2021, 33, 033312. [Google Scholar] [CrossRef] [PubMed]
- Mboreha, C.; Sun, J.; Wang, Y.; Sun, Z. Airflow and contaminant transport in innovative personalized ventilation systems for aircraft cabins: A numerical study. Sci. Technol. Built Environ. 2022, 28, 557–574. [Google Scholar] [CrossRef]
- Wang, W.; Wang, F.; Lai, D.; Chen, Q. Evaluation of SARS-CoV-2 transmission and infection in airliner cabins. Indoor Air 2022, 32, e12979. [Google Scholar] [CrossRef]
- Li, M.; Zhao, B.; Tu, J.; Yan, Y. Study on the carbon dioxide lockup phenomenon in aircraft cabin by computational fluid dynamics. Build. Simul. 2015, 8, 431–441. [Google Scholar] [CrossRef]
- Zhang, T.; Li, P.; Wang, S. A personal air distribution system with air terminals embedded in chair armrests on commercial airplanes. Build. Environ. 2012, 47, 89–99. [Google Scholar] [CrossRef]
- Dygert, R.K.; Dang, T.Q. Mitigation of cross-contamination in an aircraft cabin via localized exhaust. Build. Environ. 2010, 45, 2015–2026. [Google Scholar] [CrossRef]
- Dygert, R.K.; Dang, T.Q. Experimental validation of local exhaust strategies for improved IAQ in aircraft cabins. Build. Environ. 2012, 47, 76–88. [Google Scholar] [CrossRef]
- Gupta, J.K.; Lin, C.; Chen, Q. Characterizing exhaled airflow from breathing and talking. Indoor Air 2010, 20, 31–39. [Google Scholar] [CrossRef] [PubMed]
- Zhang, T.; Chen, Q. Novel air distribution systems for commercial aircraft cabins. Build. Environ. 2007, 42, 1675–1684. [Google Scholar] [CrossRef]
- Zhang, Z.; Chen, X.; Mazumdar, S.; Zhang, T.; Chen, Q. Experimental and numerical investigation of airflow and contaminant transport in an airliner cabin mockup. Build. Environ. 2009, 44, 85–94. [Google Scholar] [CrossRef] [Green Version]
- Zhang, T.; Yin, S.; Wang, S. An under-aisle air distribution system facilitating humidification of commercial aircraft cabins. Build. Environ. 2010, 45, 907–915. [Google Scholar] [CrossRef]
- Zítek, P.; Vyhlídal, T.; Simeunovic, G.; Nováková, L.; Čížek, J. Novel personalized and humidified air supply for airliner passengers. Build. Environ. 2010, 45, 2345–2353. [Google Scholar] [CrossRef]
- Mboreha, C.A.; Tytelman, X.; Nwaokocha, C.; Layeni, A.; Okeze, R.C.; Amiri, A.S. Numerical simulations of the flow fields and temperature distribution in a section of a Boeing 767–300 aircraft cabin. Mater. Today Proc. 2021, 47, 4098–4106. [Google Scholar] [CrossRef]
- Almstrand, A.; Bake, B.; Ljungström, E.; Larsson, P.; Bredberg, A.; Mirgorodskaya, E.; Olin, A. Effect of airway opening on production of exhaled particles. J. Appl. Physiol. 2010, 108, 584–588. [Google Scholar] [CrossRef] [Green Version]
- Fabian, P.; Brain, J.; Houseman, E.; Gern, J.; Milton, D. Origin of exhaled breath particles from healthy and human rhinovirus-infected subjects. J. Aerosol Med. Pulm. Drug Deliv. 2011, 24, 137–147. [Google Scholar] [CrossRef] [Green Version]
- Haslbeck, K.; Schwarz, K.; Hohlfeld, J.M.; Seume, J.R.; Koch, W. Submicron droplet formation in the human lung. J. Aerosol Sci. 2010, 41, 429–438. [Google Scholar] [CrossRef]
- Johnson, G.; Morawska, L. The mechanism of breath aerosol formation. J. Aerosol Med. Pulm. Drug Deliv. 2009, 22, 229–237. [Google Scholar] [CrossRef] [PubMed] [Green Version]
- Morawska, L.; Johnson, G.R.; Ristovski, Z.D.; Hargreaves, M.; Mengersen, K.; Corbett, S.; Chao, C.Y.H.; Li, Y.; Katoshevski, D. Size distribution and sites of origin of droplets expelled from the human respiratory tract during expiratory activities. J. Aerosol Sci. 2009, 40, 256–269. [Google Scholar] [CrossRef] [Green Version]
- Höppe, P. Temperatures of expired air under varying climatic conditions. Int. J. Biometeorol. 1981, 25, 127–132. [Google Scholar] [CrossRef] [PubMed]
- Liu, L.; Wei, J.; LI, Y.; Ooi, A. Evaporation and dispersion of respiratory droplets from coughing. Indoor Air 2017, 27, 179–190. [Google Scholar] [CrossRef] [PubMed]
- Zhai, Z.; Li, H. Distributed probability of infection risk of airborne respiratory diseases. Indoor Built Environ. 2021, 1–10. [Google Scholar] [CrossRef]


| Ventilation System | Air Supply Diffusers | Air Exhaust Diffusers |
|---|---|---|
| CMVS | 0.03 m × 5.04 m | 0.05 m × 5.04 m |
| SMVS | 0.03 m × 5.04 m | 0.05 m × 5.04 m |
| DVS | 0.10 m × 5.04 m | Air exhaust diffusers on both sides: 0.05 m × 5.04 m Center air exhaust diffusers: 0.1 m × 5.04 m |
| PVS | 0.03 m × 5.04 m | Main air exhaust diffusers: 0.05 m × 5.04 m Personalized air exhaust diffusers: 0.02 m × 0.44 m |
| Boundary Name | Boundary Type | Velocity | Temperature | Droplet |
|---|---|---|---|---|
| Air supply diffusers | Velocity-inlet | 10 L/(s·person) | 292.45 K | Escape |
| Air exhaust diffusers | Pressure-outlet | - | - | Escape |
| Ceiling | Wall | - | 296.15 K | Reflect |
| Sidewall | Wall | - | 294.15 K | Reflect |
| Floor | Wall | - | 296.15 K | Reflect |
| Windows | Wall | - | 290.15 K | Reflect |
| Human | Wall | - | 304.15 K | Trap |
| Mouth of infectious source | Velocity-inlet | 1.25 m/s | 306.15 K [34] | Escape |
| Mouth of susceptible person | Velocity-inlet | −1.25 m/s | - | Escape |
| Conditions | Infection Intensity of Front-Row | Infection Intensity of Same-Row | Infection Intensity of Back-Row |
|---|---|---|---|
| CMVS Case A | ▼▼▼▼▼▼ | ||
| CMVS Case B | ●●●●● | ▼▼▼▼▼▼▼ | |
| CMVS Case C | ▲▲▲ | ●●●●●●●● | ▼▼▼▼▼▼▼▼ |
| CMVS Case D | ●● | ▼▼▼▼▼▼ | |
| CMVS Case E | ▼▼▼▼▼ |
| Conditions | Infection Intensity of Front-Row | Infection Intensity of Same-Row | Infection Intensity of Back-Row |
|---|---|---|---|
| SMVS Case A | ▲▲▲▲▲▲▲ | ●●●●●●● | ▼▼▼▼▼▼ |
| SMVS Case B | ●●●●●● | ▼▼▼▼ | |
| SMVS Case C | ▲▲▲ | ●●●●●●●●●● | ▼▼▼▼▼▼▼ |
| SMVS Case D | ▲ | ●●●●●●● | ▼▼▼▼▼▼ |
| SMVS Case E | ●●●●● | ▼ |
| Conditions | Infection Intensity of Front-Row | Infection Intensity of Same-Row | Infection Intensity of Back-Row |
|---|---|---|---|
| DVS Case A | ▲▲ | ●●●●●●● | ▼▼ |
| DVS Case B | ●●●●●● | ▼▼▼▼▼▼ | |
| DVS Case C | ▲▲▲▲▲▲▲ | ●●●●●●●●●● | ▼▼▼ |
| DVS Case D | ● | ▼ | |
| DVS Case E |
| Conditions | Infection Intensity of Front-Row | Infection Intensity of Same-Row | Infection Intensity of Back-Row |
|---|---|---|---|
| PVS Case A | ●●● | ▼▼▼▼▼▼▼▼ | |
| PVS Case B | ●●●●●●●● | ▼▼ | |
| PVS Case C | ▲▲▲▲▲▲▲▲▲ | ●●●● | |
| PVS Case D | ▲ | ●●●●●● | |
| PVS Case E | ▲▲ | ● |
Publisher’s Note: MDPI stays neutral with regard to jurisdictional claims in published maps and institutional affiliations. |
© 2022 by the authors. Licensee MDPI, Basel, Switzerland. This article is an open access article distributed under the terms and conditions of the Creative Commons Attribution (CC BY) license (https://creativecommons.org/licenses/by/4.0/).
Share and Cite
Kong, B.; Zou, Y.; Cheng, M.; Shi, H.; Jiang, Y. Droplets Transmission Mechanism in a Commercial Wide-Body Aircraft Cabin. Appl. Sci. 2022, 12, 4889. https://doi.org/10.3390/app12104889
Kong B, Zou Y, Cheng M, Shi H, Jiang Y. Droplets Transmission Mechanism in a Commercial Wide-Body Aircraft Cabin. Applied Sciences. 2022; 12(10):4889. https://doi.org/10.3390/app12104889
Chicago/Turabian StyleKong, Benben, Yitao Zou, Mengmeng Cheng, Hong Shi, and Yanlong Jiang. 2022. "Droplets Transmission Mechanism in a Commercial Wide-Body Aircraft Cabin" Applied Sciences 12, no. 10: 4889. https://doi.org/10.3390/app12104889
APA StyleKong, B., Zou, Y., Cheng, M., Shi, H., & Jiang, Y. (2022). Droplets Transmission Mechanism in a Commercial Wide-Body Aircraft Cabin. Applied Sciences, 12(10), 4889. https://doi.org/10.3390/app12104889