
Compression and Fungal Heat Production in Maize Bulk Considering Kernel Breakage


Abstract
:1. Introduction
2. Materials and Methods
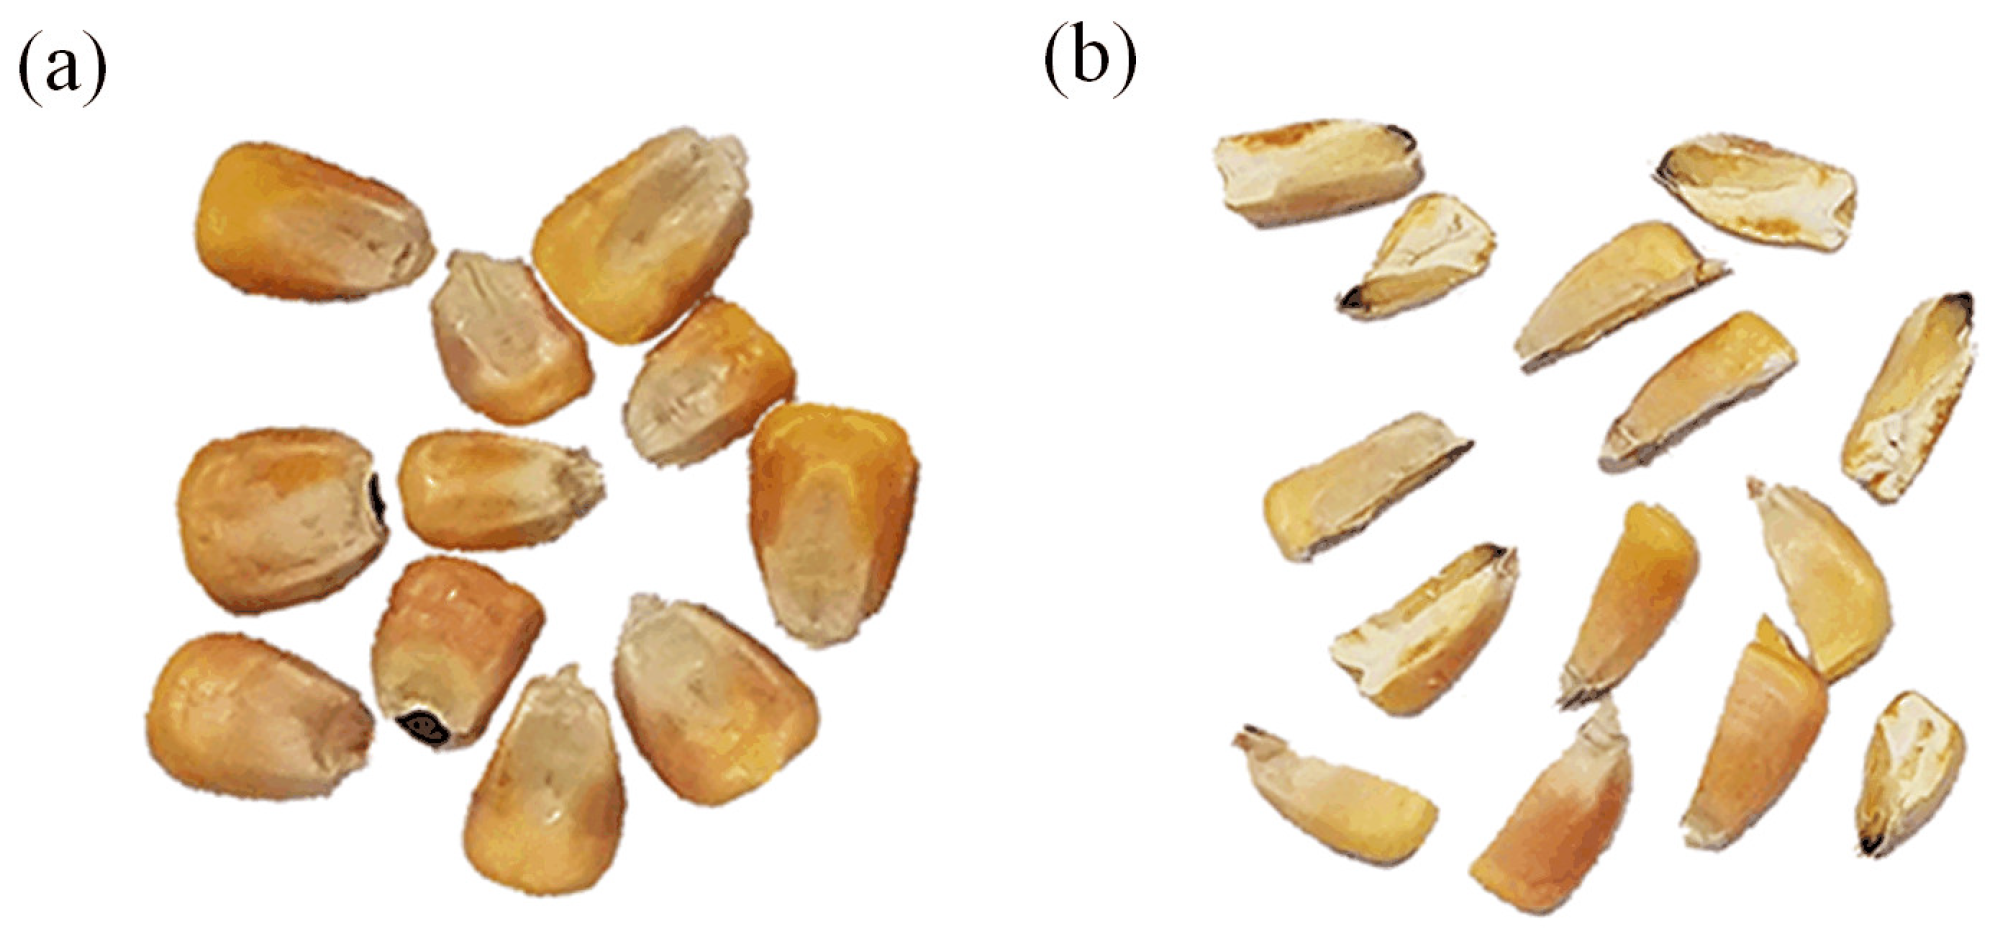
2.1. Test Materials
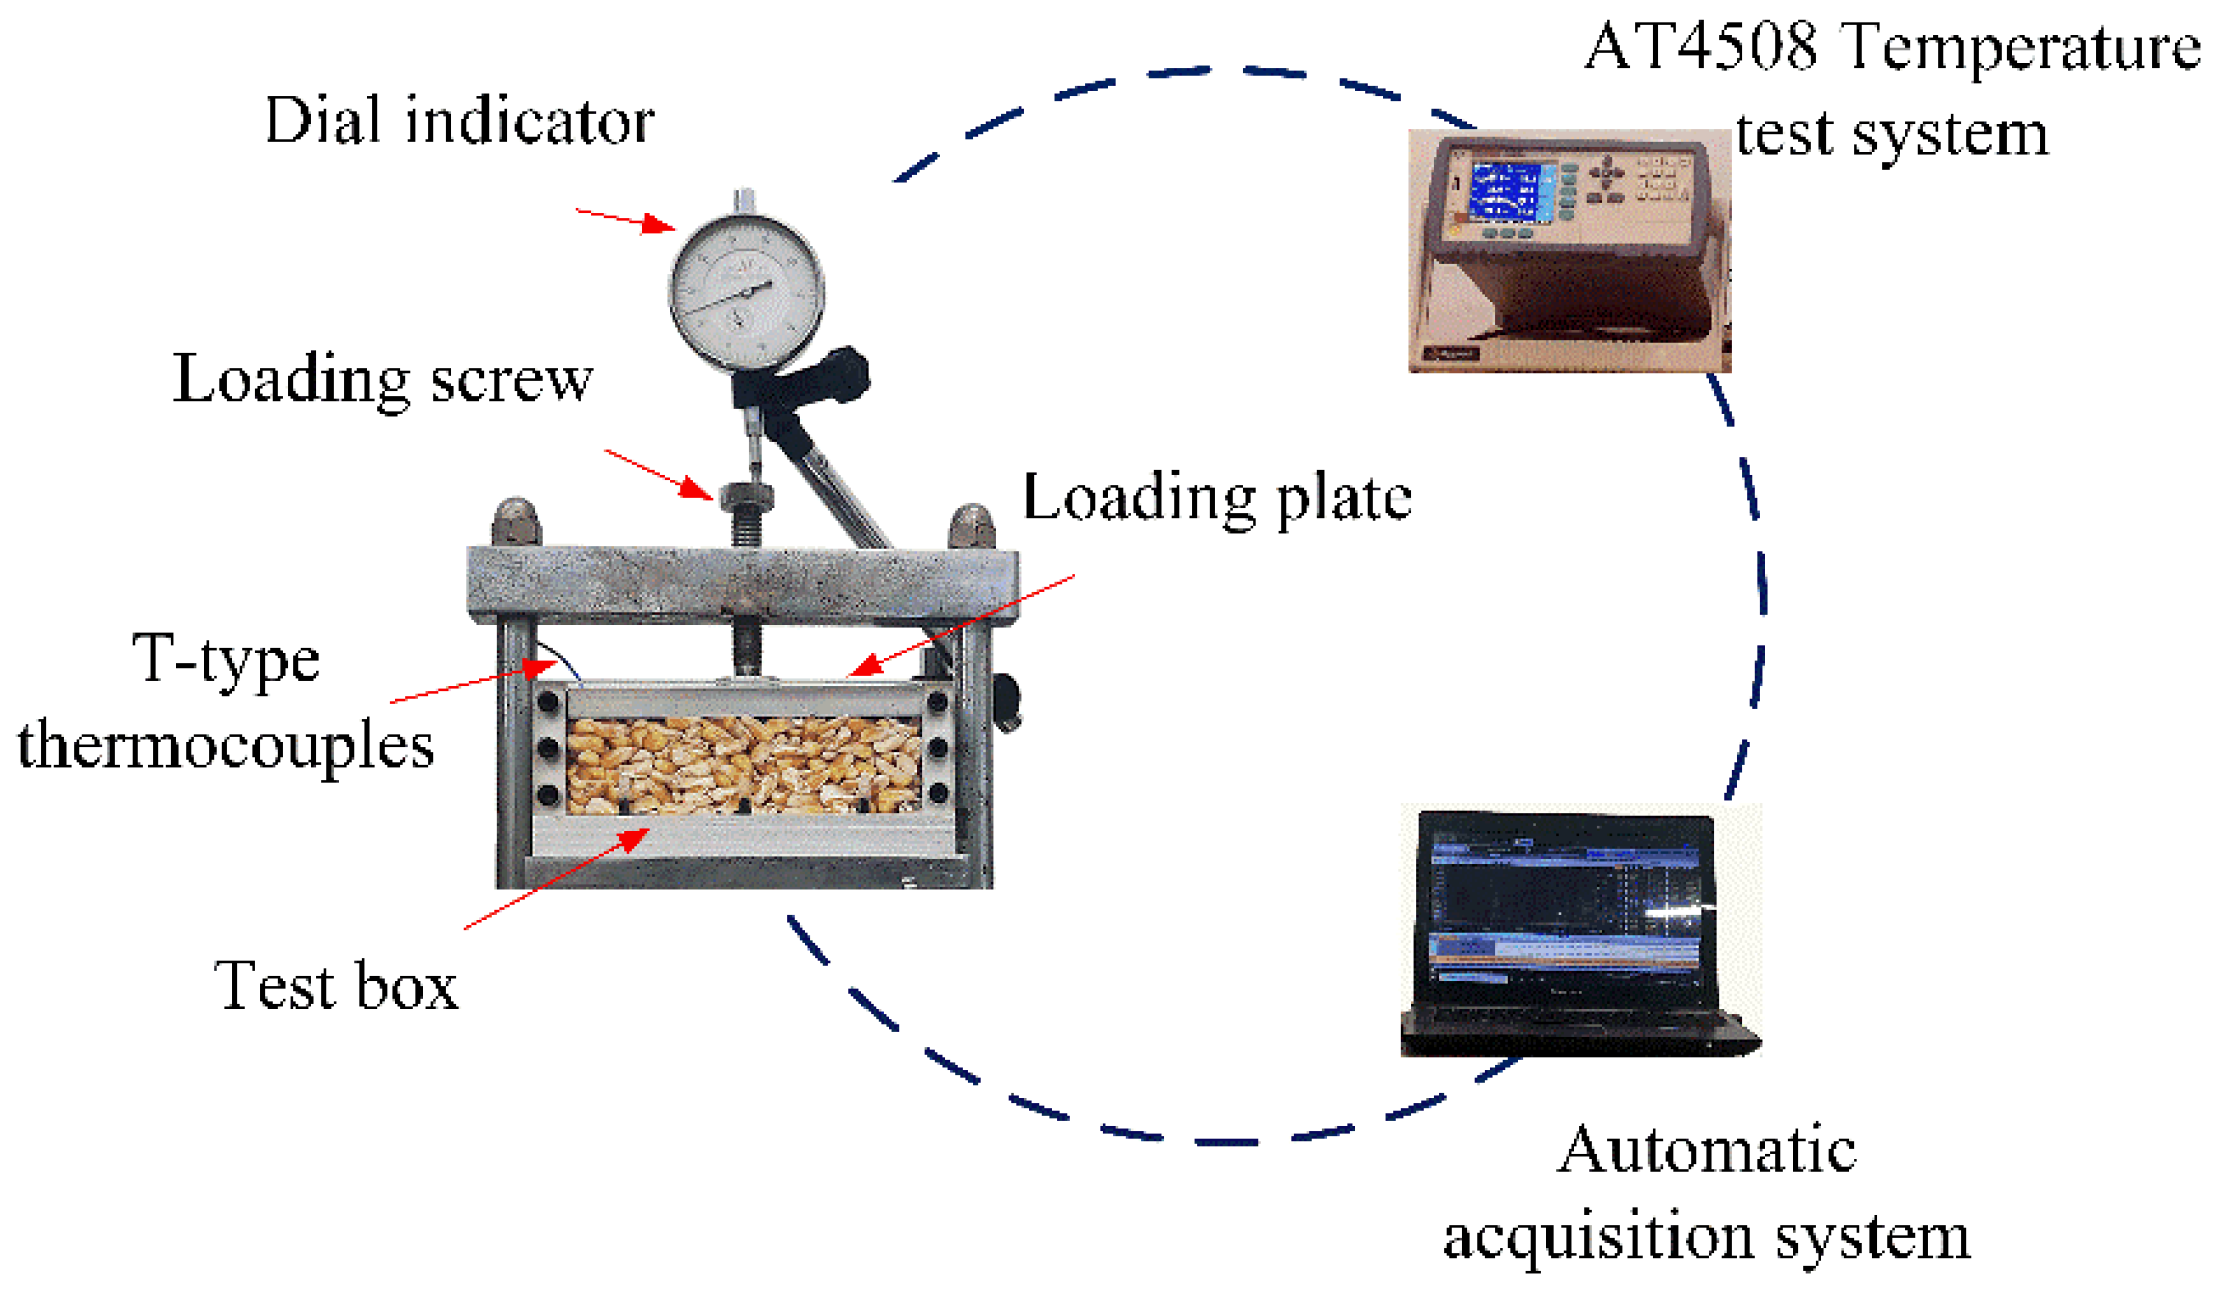
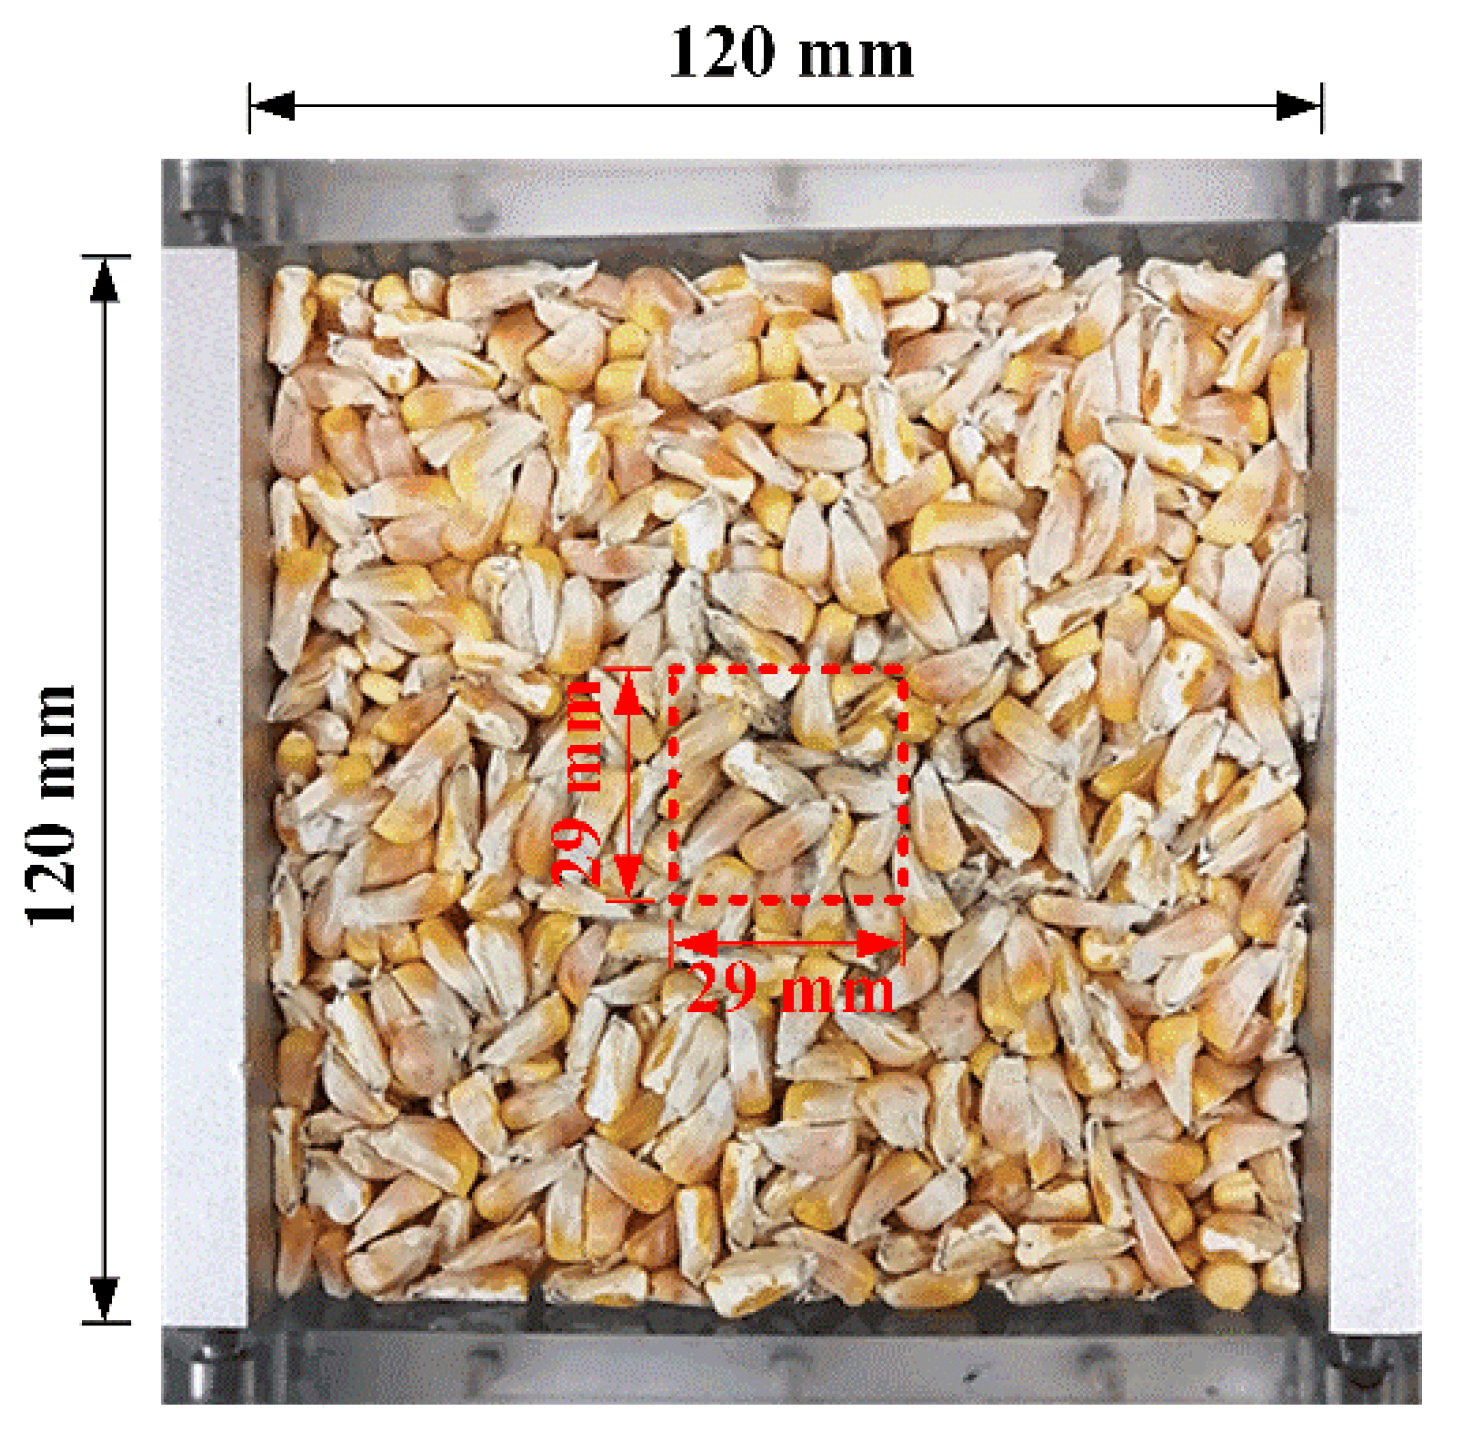
2.2. Test Methods
2.3. Inspection of APC
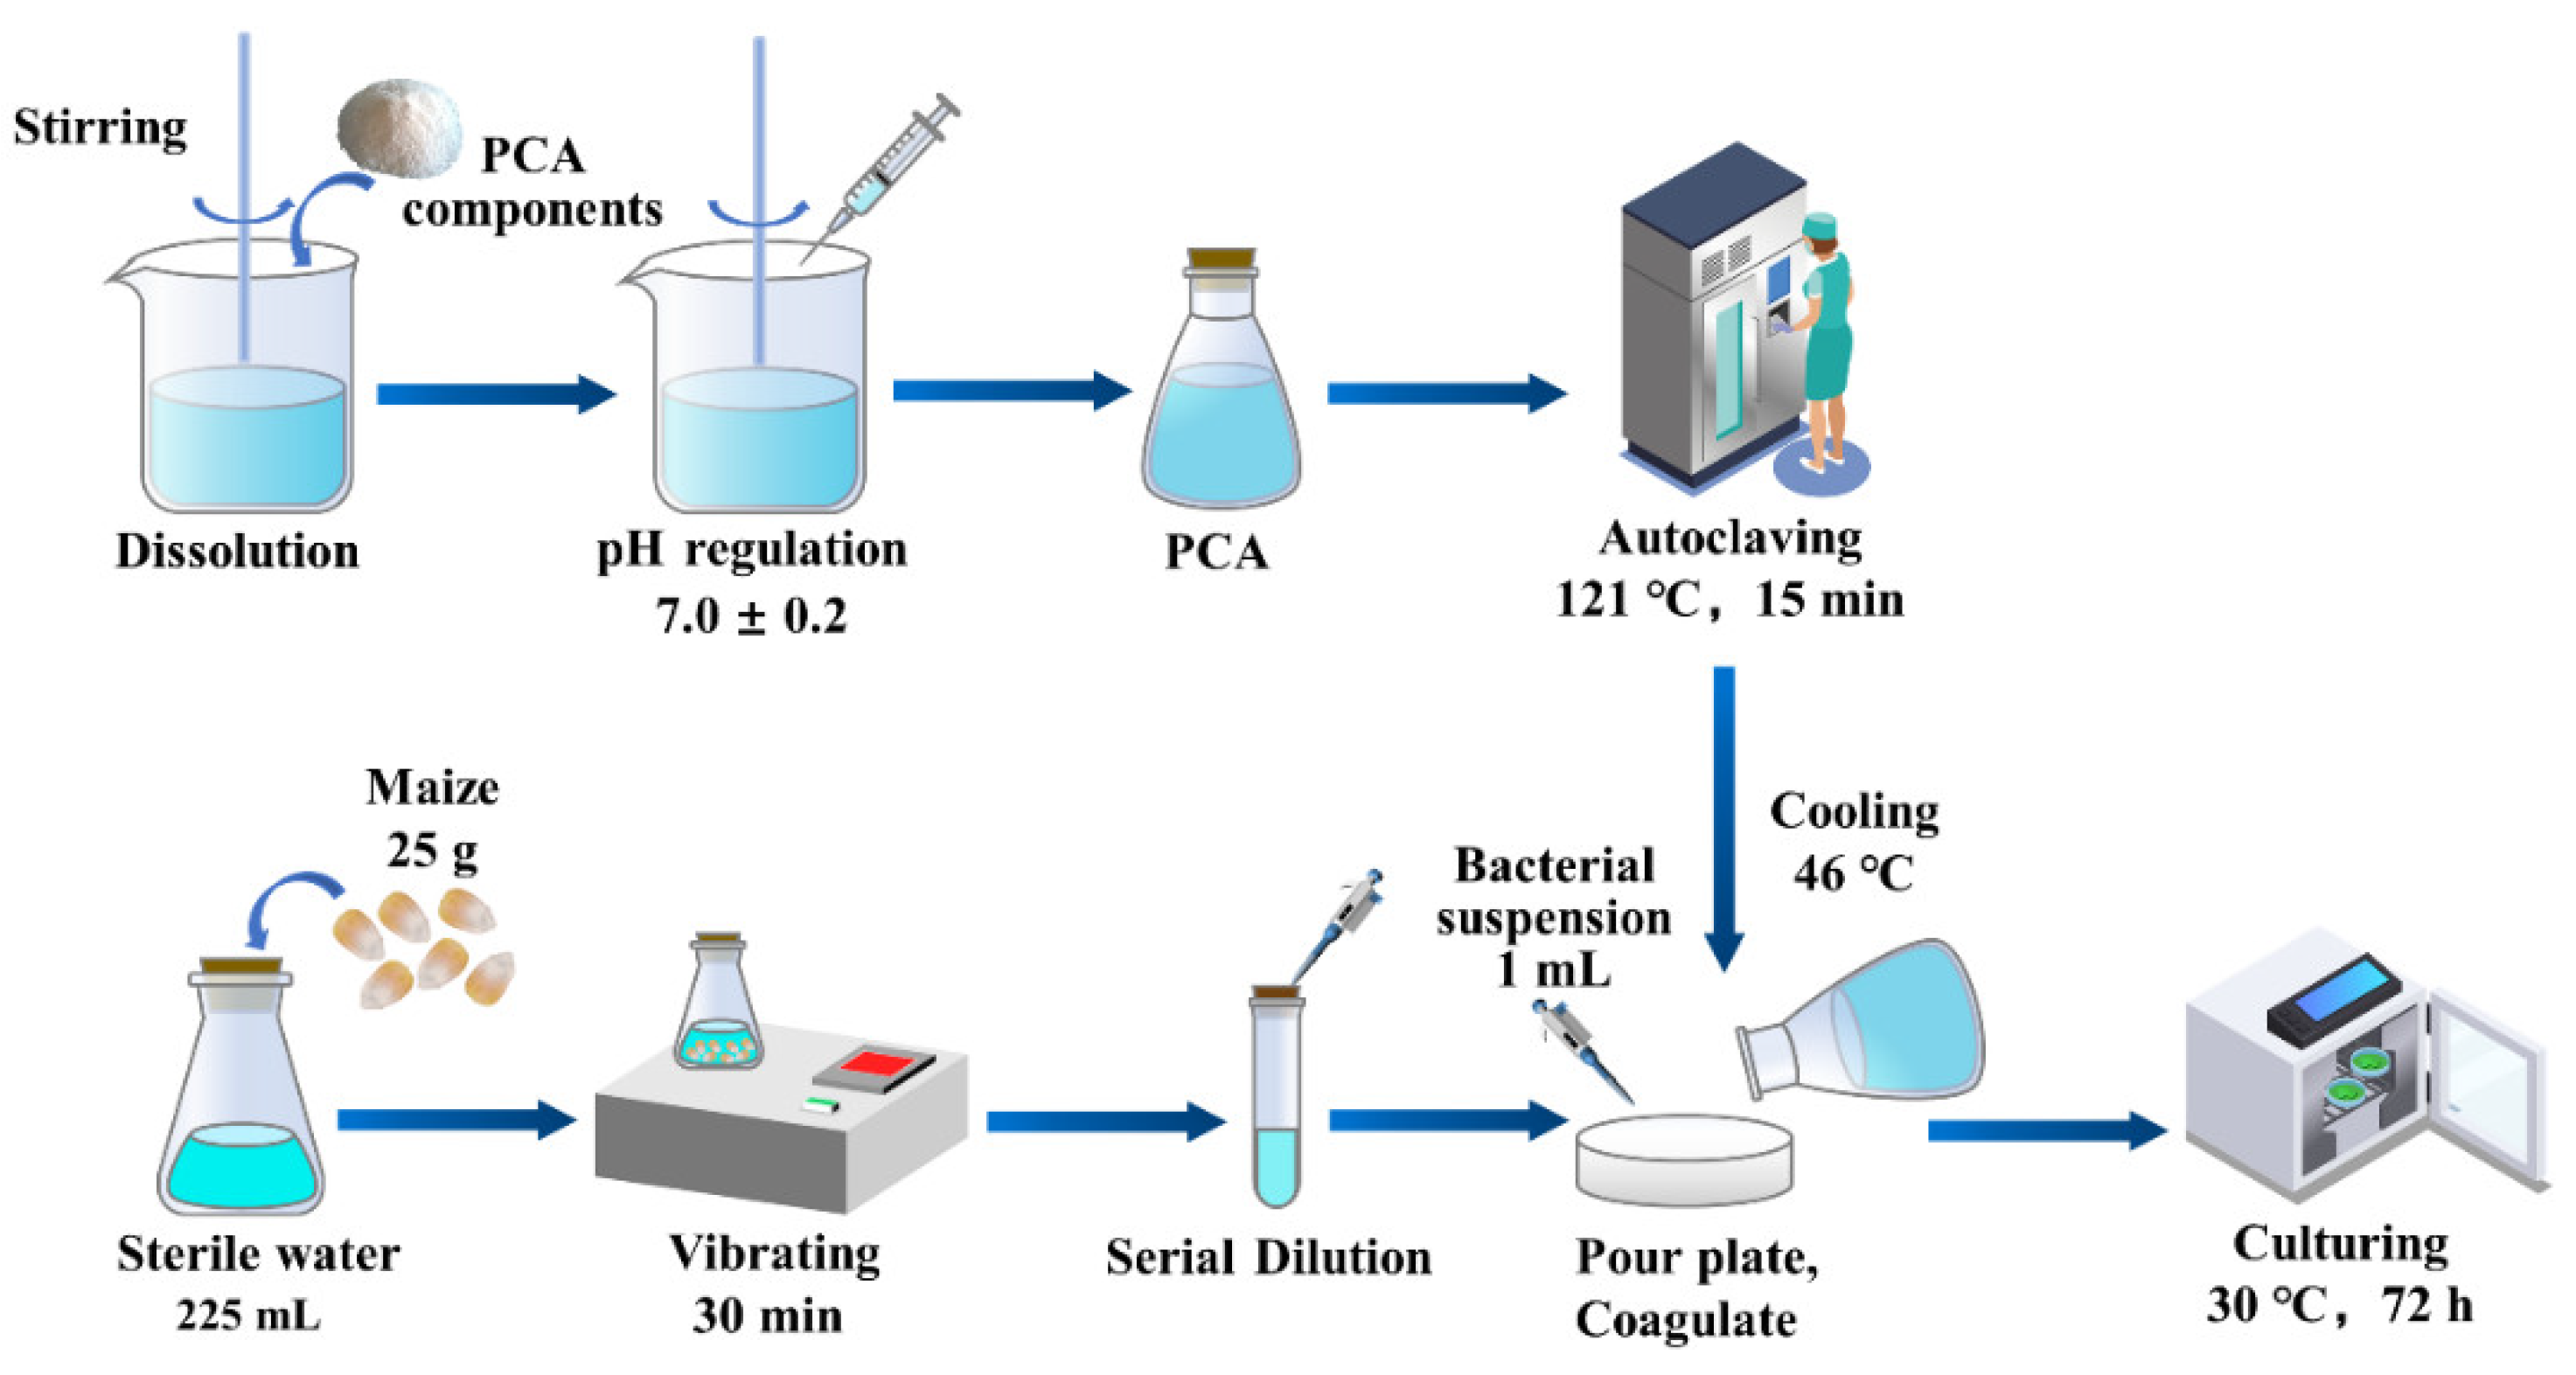
- Preparation of the plate counting agar (PCA): First, the tryptone, yeast extract, glucose, and agar were mixed thoroughly and dissolved fully, and the pH was controlled at 7.0 ± 0.2. The mixed solution was autoclaved at 121 °C for 15 min in a conical flask;
- Preparation of the bacterial suspension: Briefly, 25 g maize sample and 225 mL sterile water were put into a 500 mL conical flask. The conical flask was placed in an oscillator and vibrated for 30 min at a speed of 10,000 r∙min−1. The aim of this process was to fully diffuse the microorganisms on the surface of the maize kernels into the sterile water. By this process, a homogenate with a concentration of 1:10 was obtained;
- Preparation of homogenates with different concentrations by serial dilution: For this step, 1 mL of 1:10 sample homogenate, drawn by a 1000 µL pipette, was mixed in a test tube containing 9 mL sterile water to obtain a sample homogenate, with 1:100 concentration. The above steps were repeated several times to obtain a series of solutions with different concentrations. Normally, two homogenates with different concentrations should be prepared for later fungus culture depending on the contamination conditions. In this study, sample homogenates with concentrations of 1:10 and 1:100 were selected for maize before testing, and 10−5 and 10−6 were selected after the test;
- Fungus culture: Briefly, 1 mL of sample homogenate with desired concentration was taken and mixed with 15–20 mL PCA. Then, the mixture was cooled to 46 °C before injecting into 3 pre-sterilized Petri dishes. After the agar was coagulated, the dishes were turned over and cultured at 30 ± 1 °C for 72 h (MJPS-150, Shanghai Jing Hong Laboratory Instrument Co., Ltd., Shanghai, China);
- Colony counting: For each sample, one from the 3 dishes with mold colony number ranging from 100 to 150 colony-forming units (cfus) were selected, and the type and number of colonies were recorded by observing under a microscope. The number of colonies was calculated as follows:
3. Results and Discussion
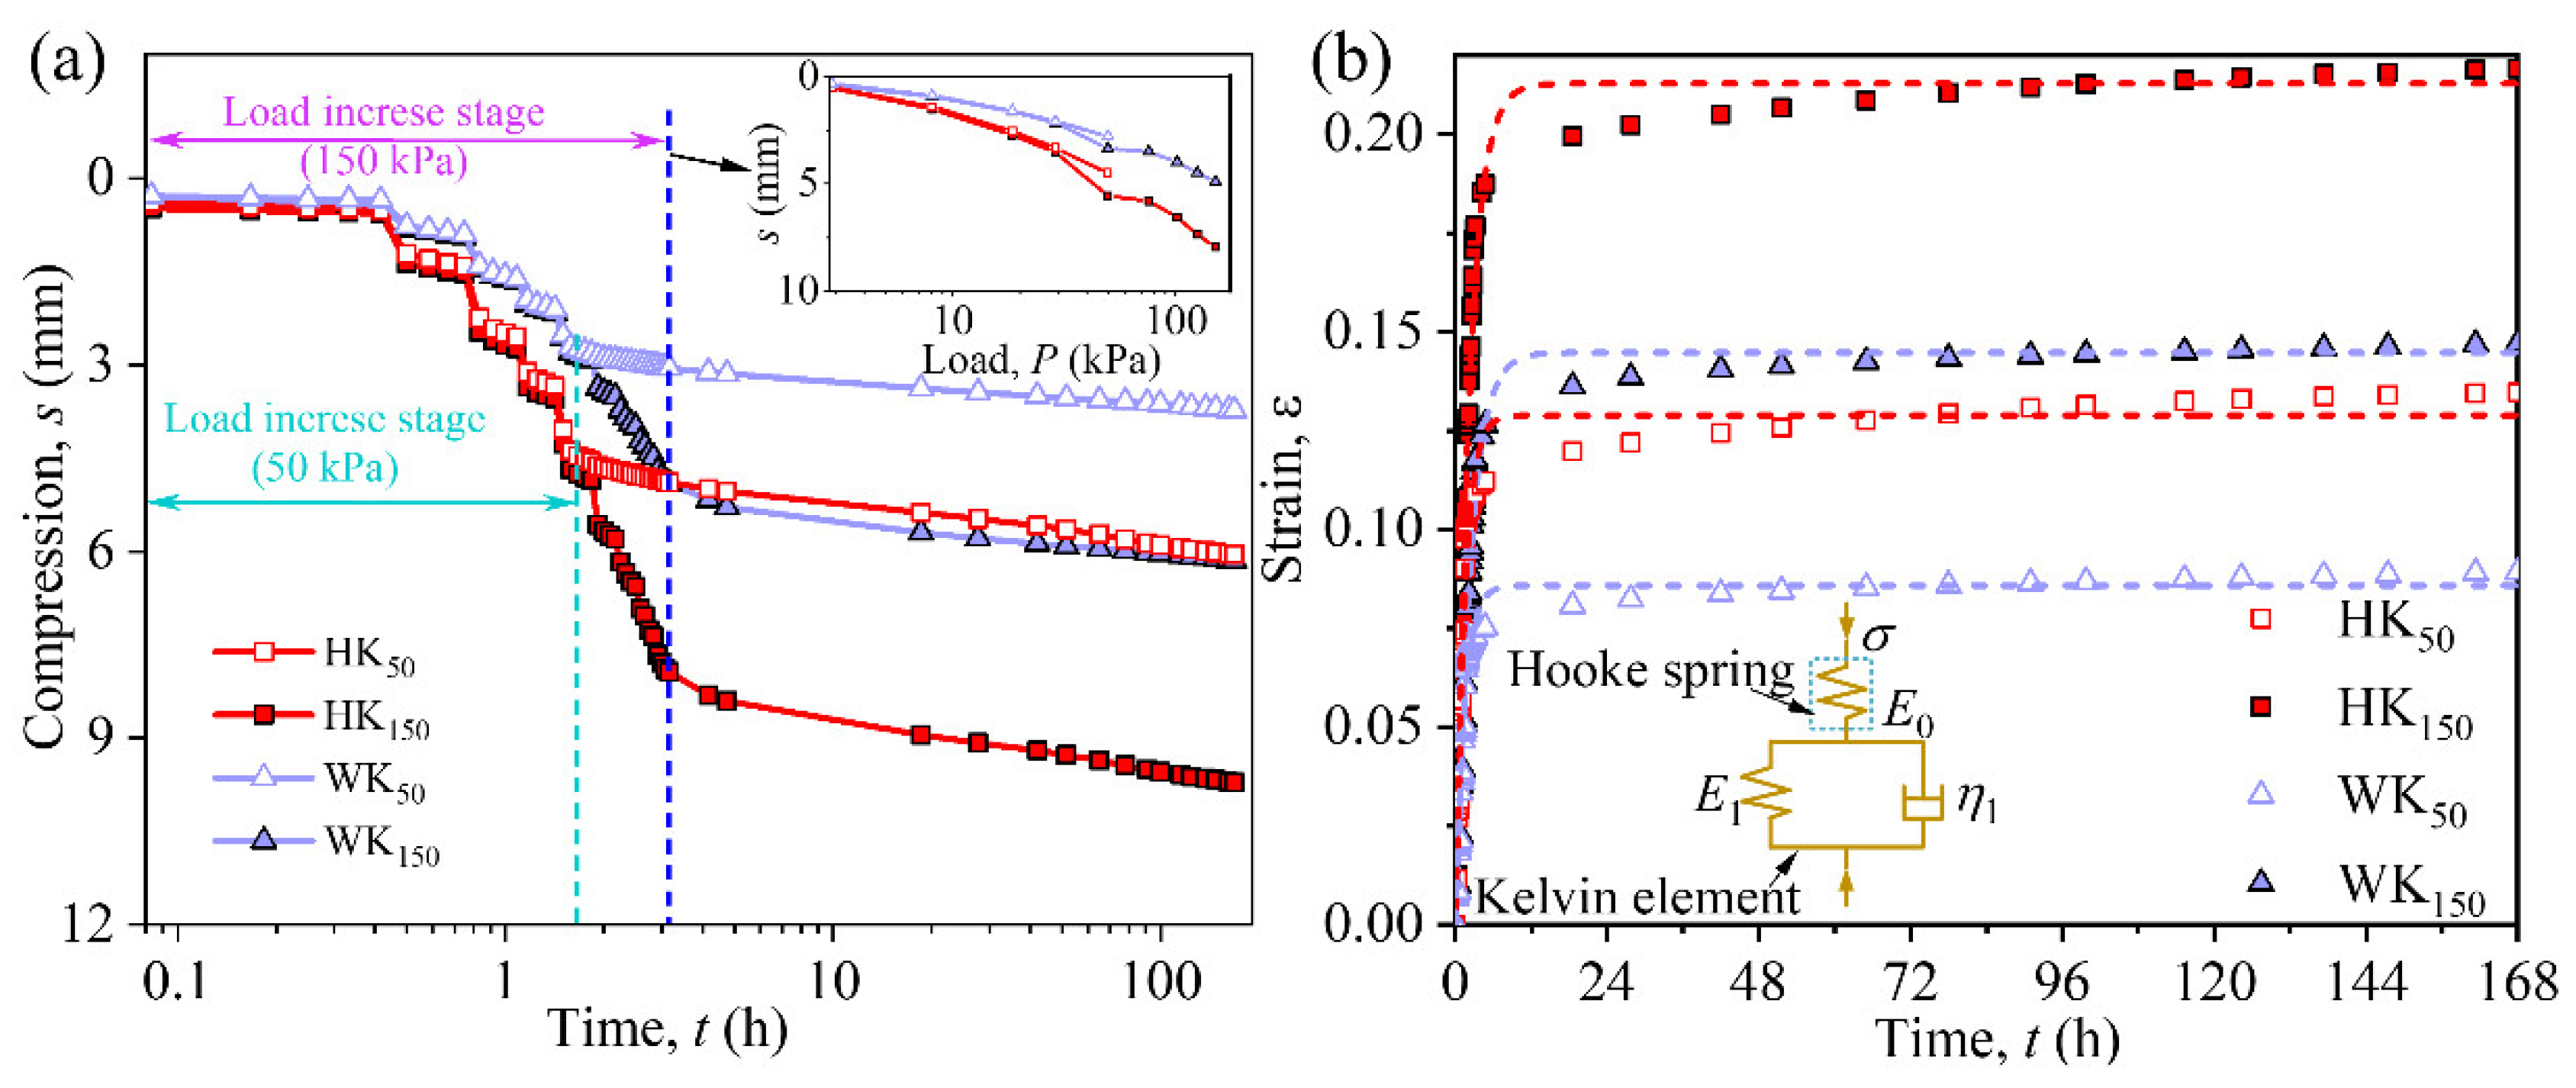
3.1. Creep Behavior
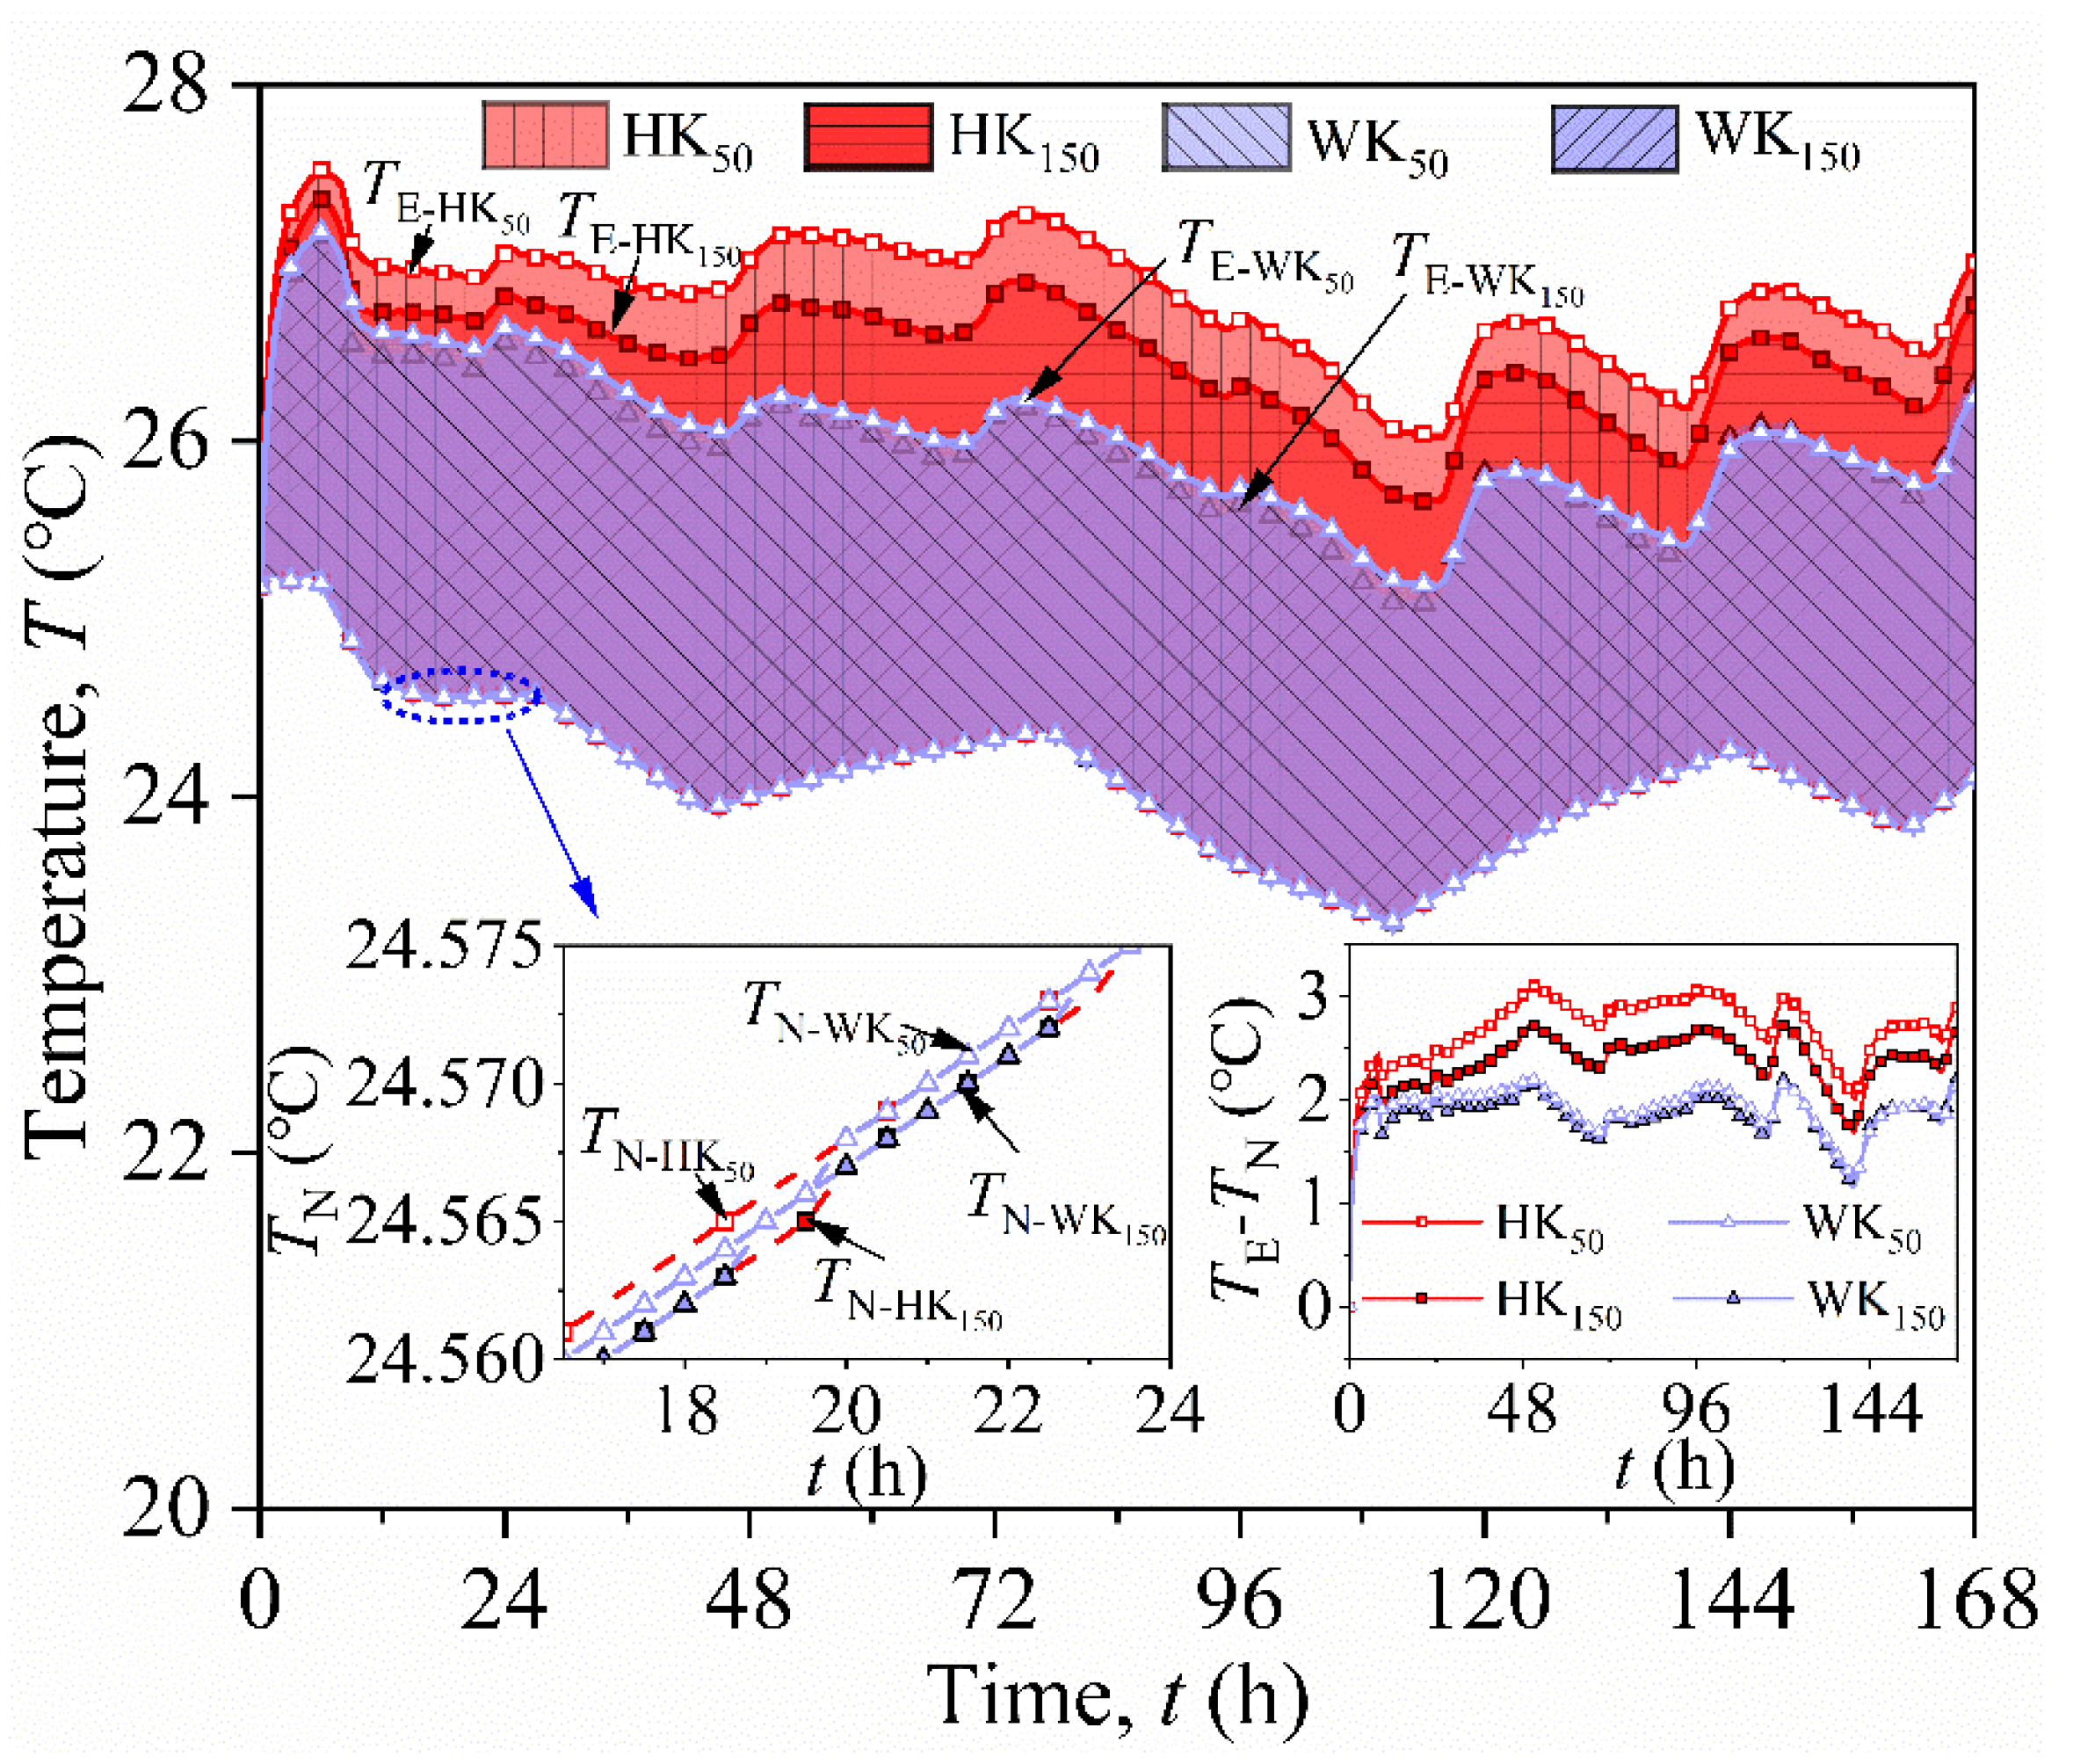
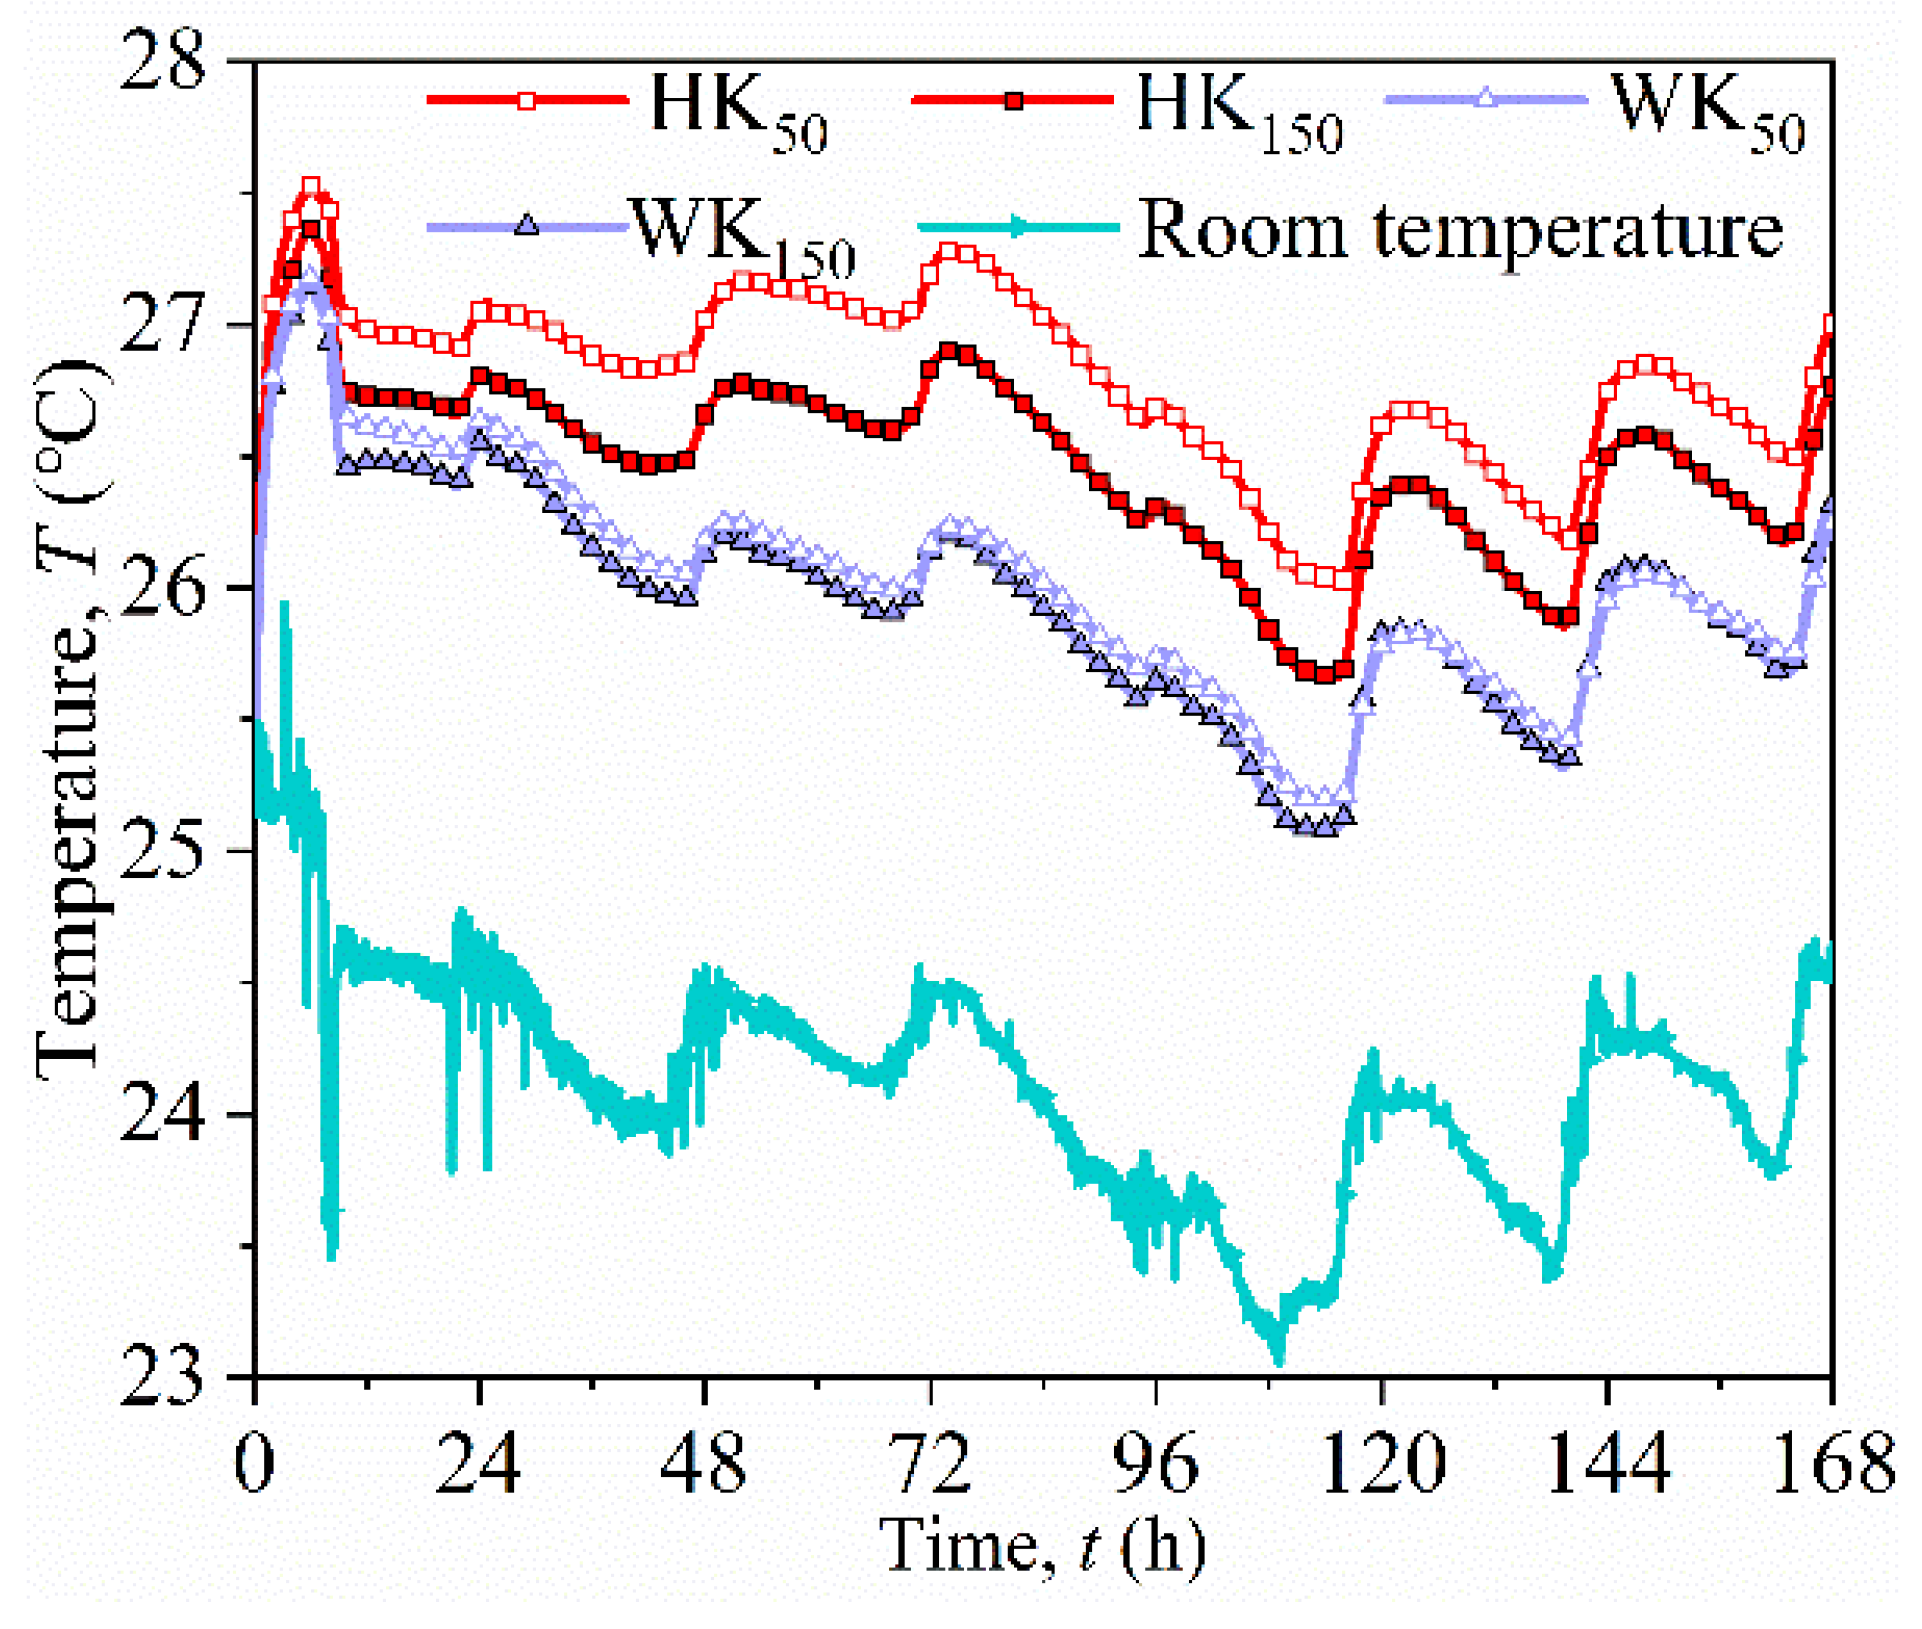
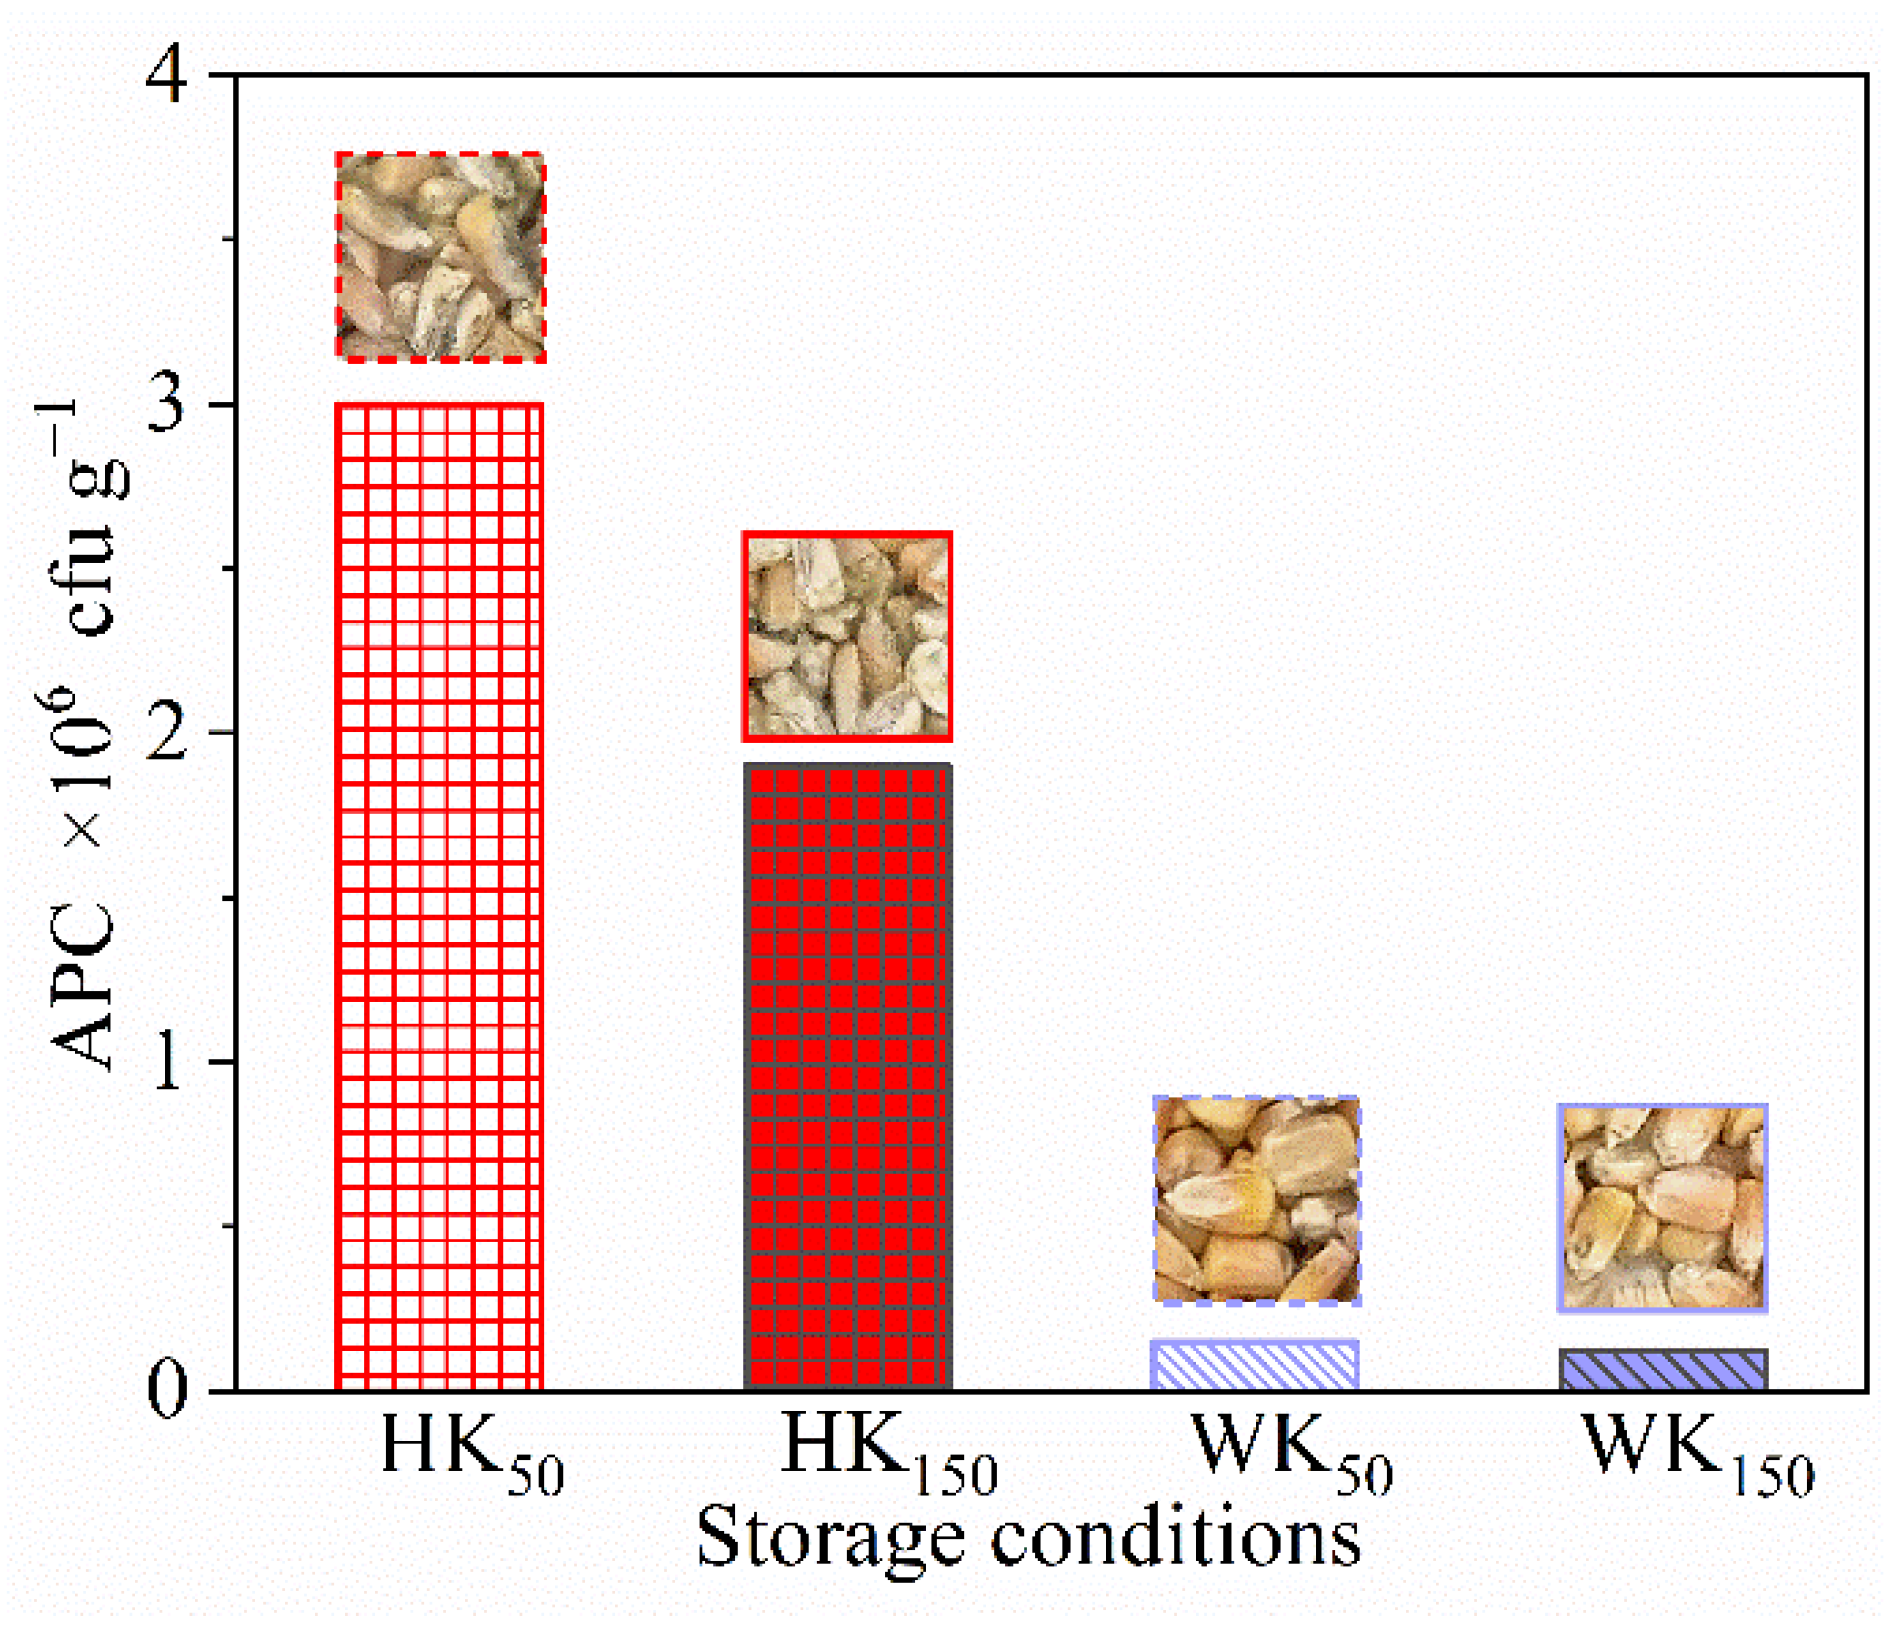
3.2. Temperature and APC
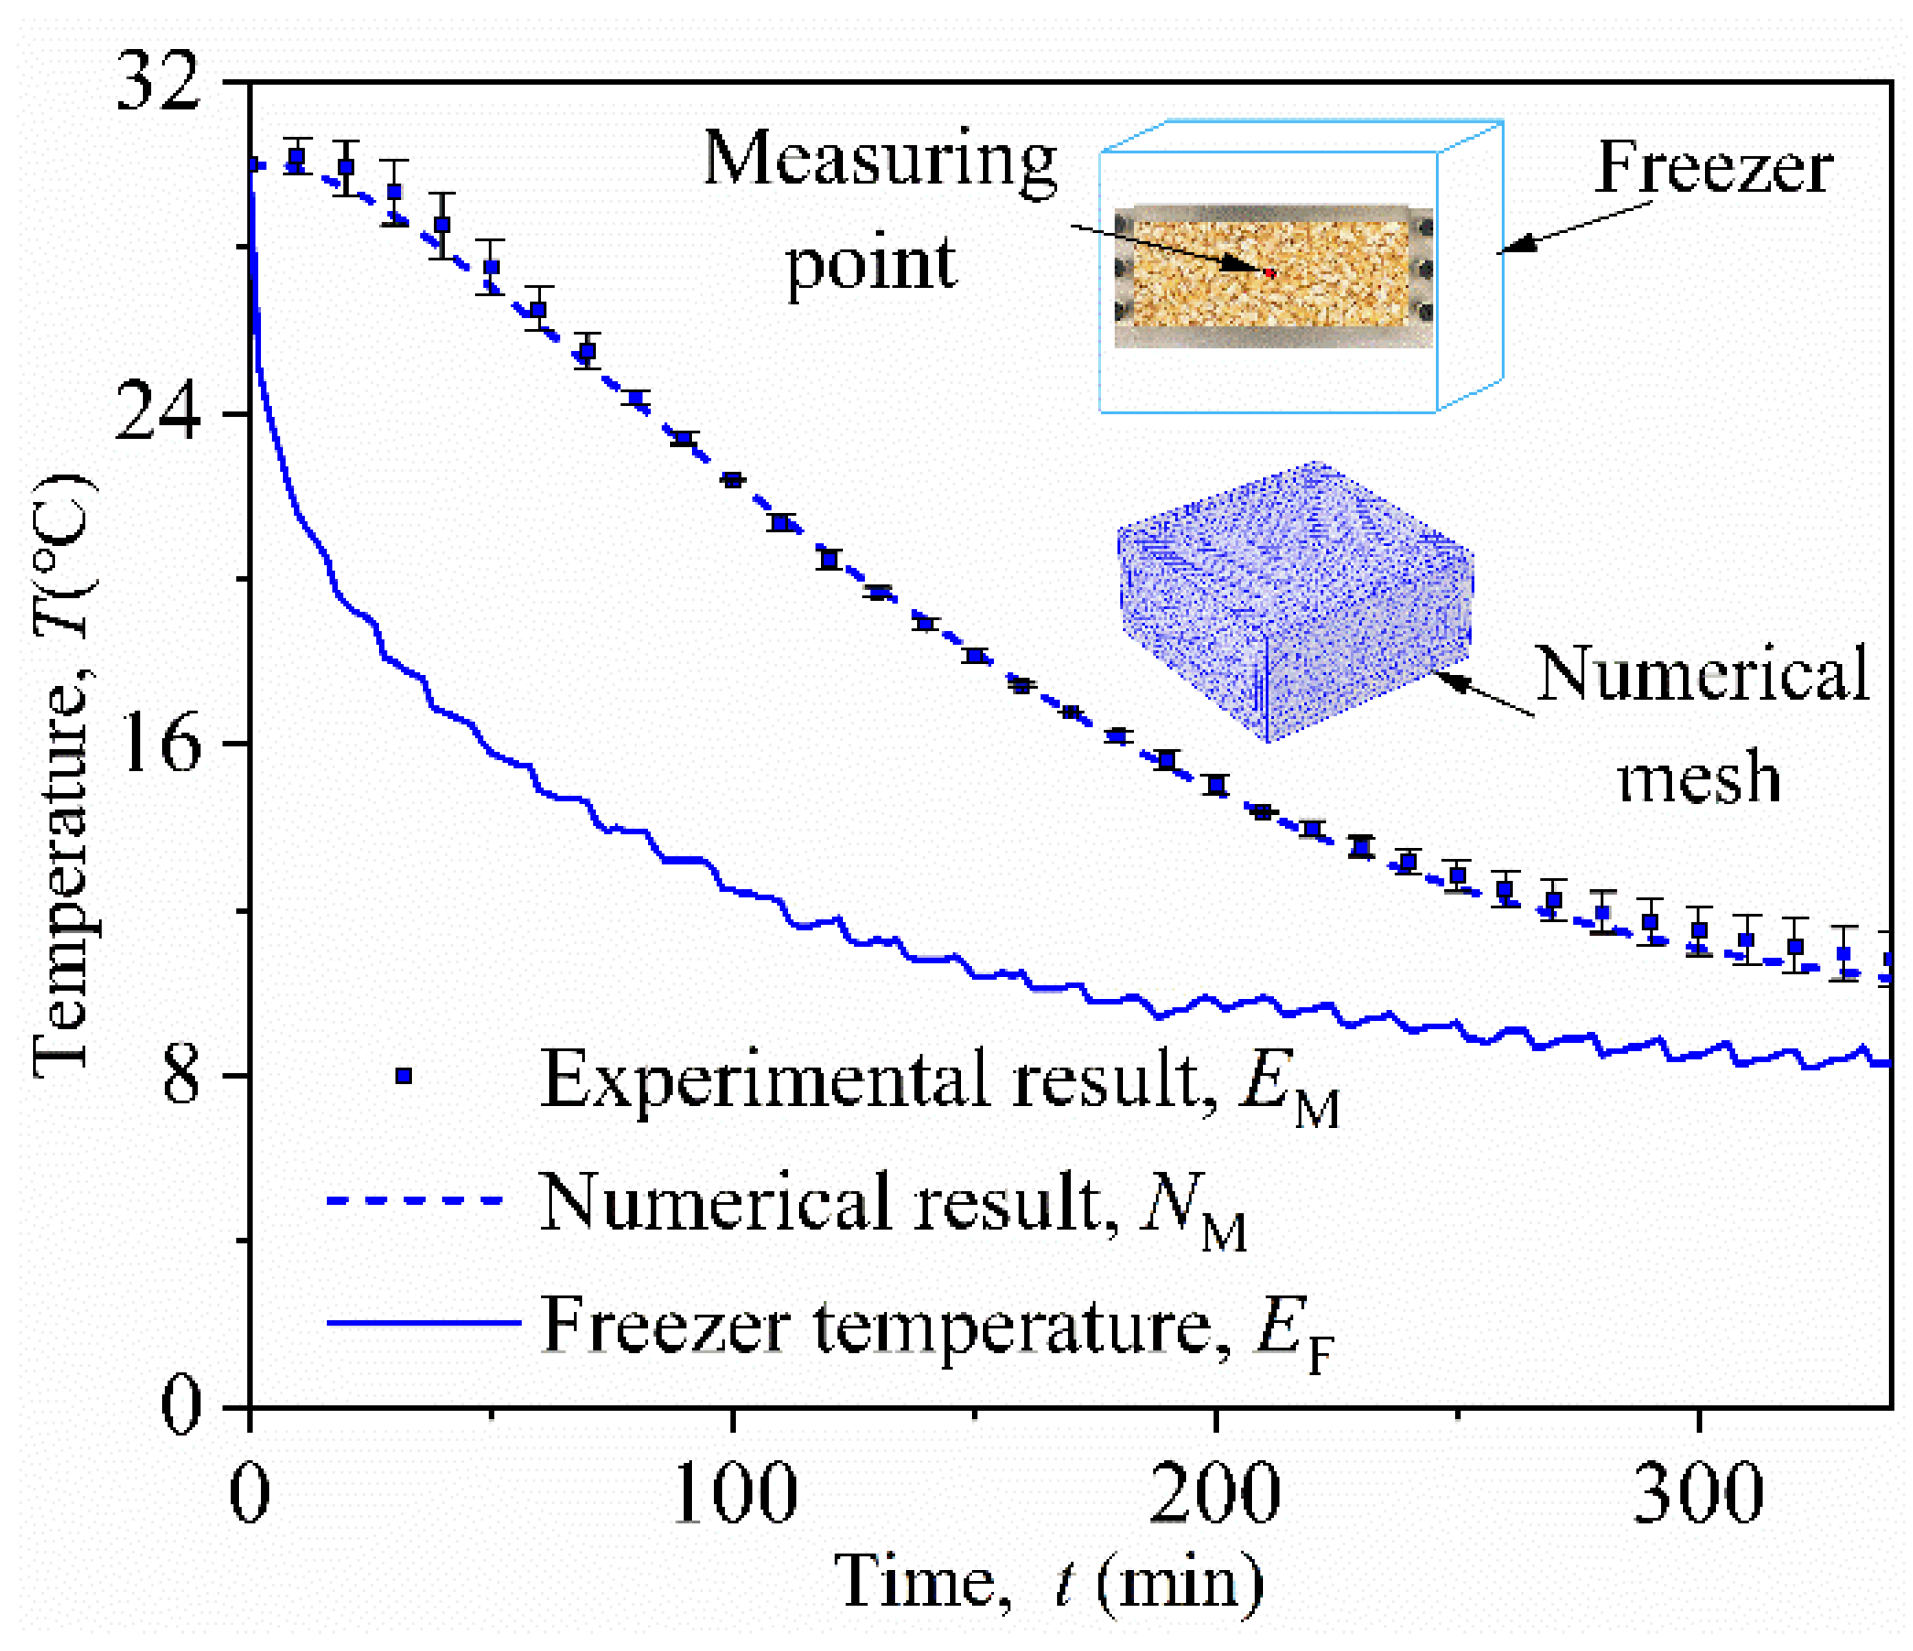
3.3. Physical Modeling of Heat Transfer and Verification
3.4. Simulation Results and Analysis
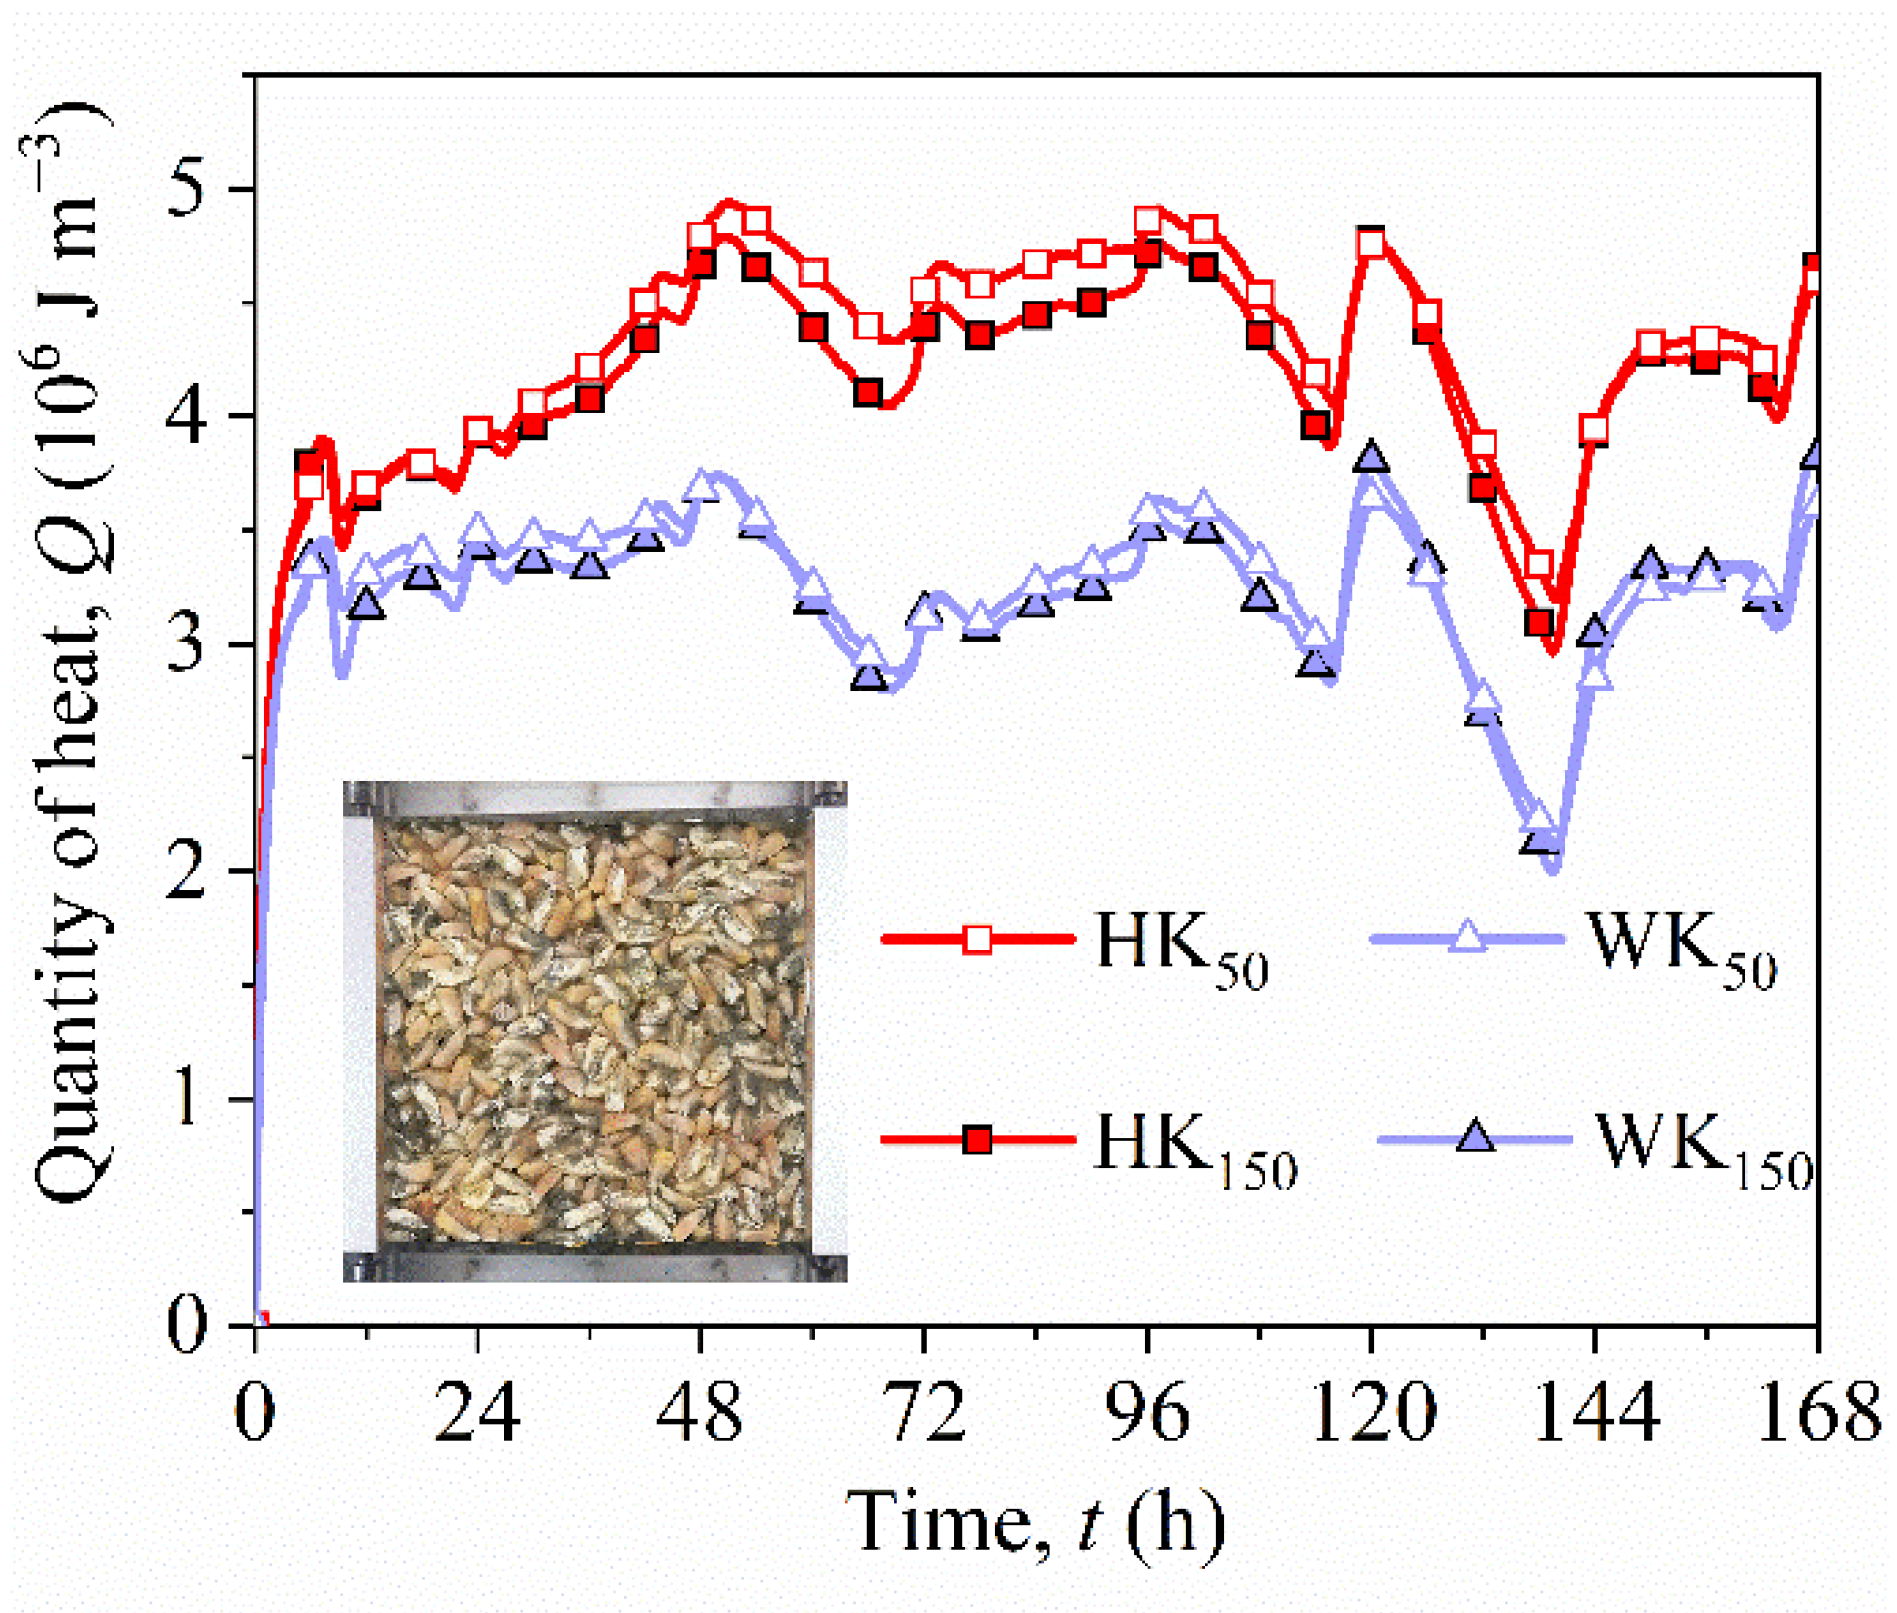
3.5. Estimation of Fungal Heat Production
4. Conclusions
Author Contributions
Funding
Institutional Review Board Statement
Informed Consent Statement
Data Availability Statement
Conflicts of Interest
References
- National Bureau of Statistics. China Statistical Yearbook; China Statistics Press: Beijing, China, 2020. Available online: http://www.stats.gov.cn/tjsj/ndsj/2021/indexch.htm (accessed on 1 November 2021).
- Godfray, H.C.J.; Beddington, J.R.; Crute, I.R.; Haddad, L.; Lawrence, D.; Muir, J.F.; Pretty, J.; Robinson, S.; Thomas, S.M.; Toulmin, C. Food security: The challenge of feeding 9 billion people. Science 2010, 327, 812–818. [Google Scholar] [CrossRef] [PubMed] [Green Version]
- Lawrence, J.; Maier, D.E. Three-dimensional airflow distribution in a maize silo with peaked, levelled and cored grain mass configurations. Biosyst. Eng. 2011, 110, 321–329. [Google Scholar] [CrossRef]
- Ziegler, V.; Paraginski, R.T.; Ferreira, C.D. Grain storage systems and effects of moisture, temperature and time on grain quality—A review. J. Stored Prod. Res. 2021, 91, 101770. [Google Scholar] [CrossRef]
- Schaarschmidt, S.; Fauhl-Hassek, C. The fate of mycotoxins during the primary food processing of maize. Food Control 2021, 121, 107651. [Google Scholar] [CrossRef]
- Coradi, P.C.; Maier, D.E.; Channaiah, L.H.; Campabadal, C. Effects of the processing on the distribution of aflatoxin and fumonisin levels in corn fractions and feeds. J. Food Process. Eng. 2020, 39, 215–225. [Google Scholar] [CrossRef]
- Oliveira, T.R.; Jaccoud, D.D.; Henneberg, L.; Michel, M.D.; Demiate, I.M.; Pinto, A.T.B.; Machinski, M.; Barana, A.C. Maize (Zea Mays L.) landraces from the southern region of Brazil: Contamination by fusarium sp, zearalenone, physical and mechanical characteristics of the kernels. Braz. Arch. Biol. Technol. 2009, 52, 11–16. [Google Scholar] [CrossRef]
- Pietri, A.; Zanetti, M.; Bertuzzi, T. Distribution of aflatoxins and fumonisins in dry-milled maize fractions. Food Addit. Contam. A 2009, 26, 372–380. [Google Scholar] [CrossRef]
- Burger, H.M.; Shephard, G.S.; Louw, W.; Rheeder, J.P.; Gelderblom, W.C.A. The mycotoxin distribution in maize milling fractions under experimental conditions. Int. J. Food Microbiol. 2013, 165, 57–64. [Google Scholar] [CrossRef]
- Suleiman, R.; Bern, C.J.; Brumm, T.J.; Rosentrater, K.A. Impact of moisture content and maize weevils on maize quality during hermetic and non-hermetic storage. J. Stored Prod. Res. 2018, 78, 1–10. [Google Scholar] [CrossRef]
- Mohapatra, D.; Kumar, S.; Kotwaliwale, N.; Singh, K.K. Critical factors responsible for fungi growth in stored food grains and non-chemical approaches for their control. Ind. Crop. Prod. 2017, 108, 162–182. [Google Scholar] [CrossRef]
- Moreira, R.; Chenlo, F.; Arufe, S.; Rubinos, S.N. Physicochemical characterization of white, yellow and purple maize flours and rheological characterization of their doughs. J. Food Sci. Technol. Mys. 2015, 52, 7954–7963. [Google Scholar] [CrossRef] [PubMed] [Green Version]
- Kamboj, U.; Guha, P.; Mishra, S. Changes in rheological properties of wheat due to storage. J. Sci. Food Agric. 2017, 98, 1374–1380. [Google Scholar] [CrossRef] [PubMed]
- Sheng, S.Y.; Wang, L.J.; Li, D.; Mao, Z.H.; Adhikari, B. Viscoelastic behavior of maize kernel studied by dynamic mechanical analyzer. Carbohyd. Polym. 2014, 112, 350–358. [Google Scholar] [CrossRef] [PubMed]
- Cheng, X.D.; Zhang, Q.; Shi, C.X.; Yan, X.J. Model for the prediction of grain density and pressure distribution in hopper-bottom silos. Biosyst. Eng. 2017, 163, 159–166. [Google Scholar] [CrossRef]
- Chang, C.S. Thermal conductivity of wheat, corn, and grain sorghum as affected by bulk density and moisture content. Trans. ASAE 1986, 29, 1447–1450. [Google Scholar] [CrossRef]
- Kara, M.; Ozturk, I.; Bastaban, S.; Kalkan, F. Thermal conductivity of safflower (Carthamus tinctorius L.) seeds. Span. J. Agric. Res. 2011, 9, 687–692. [Google Scholar] [CrossRef] [Green Version]
- Jia, C.C.; Sun, D.W.; Cao, C.W. Mathematical simulation of temperature fields in a stored grain bin due to internal heat generation. J. Food Eng. 2000, 43, 227–233. [Google Scholar] [CrossRef]
- Wang, Y.C.; Yang, K.M.; Zhang, Z.T.; Qi, W.; Yang, J. Natural convection heat and moisture transfer with thermal radiation in a cavity partially filled with hygroscopic porous medium. Dry. Technol. 2016, 34, 275–286. [Google Scholar] [CrossRef]
- Hammami, F.; Ben Mabrouk, S.; Mami, A. Modelling and simulation of heat exchange and moisture content in a cereal storage silo. Math. Comput. Model. Dyn. Syst. 2016, 22, 207–220. [Google Scholar] [CrossRef]
- Wu, Z.D.; Zhang, Q.; Yin, J.; Wang, X.M.; Zhang, Z.J.; Wu, W.F.; Li, F.J. Interactions of mutiple biological fields in stored grain ecosystems. Sci. Rep. 2020, 10, 9302. [Google Scholar] [CrossRef]
- ASAE S352.2 APR1988 (R2017); Moisture Measurement–Unground Grain and Seeds. ASAE: St. Joseph, MI, USA, 2017.
- Talesnick, M. Measuring soil pressure within a soil mass. Can. Geotechn. J. 2013, 50, 716–722. [Google Scholar] [CrossRef]
- GB4789.2-2016; National Standards of the People’s Republic of China. Food Microbiological Analysis: Determination of Aerobic Plate Count. State Food and Drug Administration: Beijing, China, 2016.
- Ubhi, G.S.; Sadaka, S. Temporal valuation of corn respiration rates using pressure sensors. J. Stored Prod. Res. 2015, 61, 39–47. [Google Scholar] [CrossRef]
- ASAE D243.4 MAY2003 (R2017); Thermal Properties of Grain and Grain Products. ASAE: St. Joseph, MI, USA, 2017.


| Material | Property | Value |
|---|---|---|
| Aluminum alloy | Thickness (lA) | 0.01 m |
| Thermal conductivity (kA) | 201 W∙m−1∙°C −1 | |
| Density (ρA) | 2720 kg∙m−3 | |
| Specific heat (cA) | 90.64 J∙kg−1∙°C −1 | |
| PMMA | Thickness (lP) | 0.01 m |
| Thermal conductivity (kP) | 0.19 W∙m−1∙°C −1 | |
| Density (ρP) | 1180 kg∙m−3 | |
| Specific heat (cP) | 1424 J∙kg−1∙°C −1 | |
| Air | Air thermal conductivity (ka) | 0.025 W∙m−1∙°C −1 |
| Air density (ρa) | 1.205 kg∙m−3 | |
| Air specific heat (ca) | 1006 J∙kg−1∙°C −1 | |
| Air tortuosity factor (τ) | 1.2 | |
| Air viscosity (μ) | 1.79 × 10⁻⁵ Pa∙s | |
| Maize | Maize moisture content (Mmaize) | 9.8% |
| Maize density (ρmaize) | 768 kg∙m−3 | |
| Maize thermal conductivity (kmaize) | 0.12 W∙m−1∙°C −1 | |
| Maize specific heat (cmaize) | 2223 J∙kg−1∙°C −1 | |
| Maize permeability (Kmaize) | 1.9 × 10⁻⁹ m2 |
| Material Property | Value | |
|---|---|---|
| Moisture content (M) | 21% | |
| Mass (m) | 0.4 kg | |
| Initial height (h0) | HK | 0.042 m |
| WK | 0.045 m | |
| Maize bulk density (ρb) | m/0.0144 × (h0 − s) | |
| Particle Density (ρs) | 1230.2 kg∙m−3 | |
| Porosity (ϕ) | 1 − ρb/ρs | |
| Thermal conductivity (kb) | 0.0902 + 1.165 × 10⁻⁴ ρb [16] | |
Publisher’s Note: MDPI stays neutral with regard to jurisdictional claims in published maps and institutional affiliations. |
© 2022 by the authors. Licensee MDPI, Basel, Switzerland. This article is an open access article distributed under the terms and conditions of the Creative Commons Attribution (CC BY) license (https://creativecommons.org/licenses/by/4.0/).
Share and Cite
Liu, C.; Zhou, Y.; Chen, G.; Zheng, D.; Yue, L. Compression and Fungal Heat Production in Maize Bulk Considering Kernel Breakage. Appl. Sci. 2022, 12, 4870. https://doi.org/10.3390/app12104870
Liu C, Zhou Y, Chen G, Zheng D, Yue L. Compression and Fungal Heat Production in Maize Bulk Considering Kernel Breakage. Applied Sciences. 2022; 12(10):4870. https://doi.org/10.3390/app12104870
Chicago/Turabian StyleLiu, Chaosai, Yang Zhou, Guixiang Chen, Deqian Zheng, and Longfei Yue. 2022. "Compression and Fungal Heat Production in Maize Bulk Considering Kernel Breakage" Applied Sciences 12, no. 10: 4870. https://doi.org/10.3390/app12104870
APA StyleLiu, C., Zhou, Y., Chen, G., Zheng, D., & Yue, L. (2022). Compression and Fungal Heat Production in Maize Bulk Considering Kernel Breakage. Applied Sciences, 12(10), 4870. https://doi.org/10.3390/app12104870