
Predicting Partner’s Digital Transformation Based on Artificial Intelligence

Abstract
:1. Introduction
- (1)
- How to identify partners who are transforming or are ready to transform across one or many of the transformation dimensions (such as New Buying Centers, Platform-Based Outcomes, and Customer Experience Life cycle);
- (2)
- When a partner is transforming along one or many of the transformation dimensions, how do their economics change;
- (3)
- Can we spot any unethical behavior by looking through the deal transaction data, which could put all of this at risk?
- (1)
- Generalize useful data into a new database from raw data and denoise data;
- (2)
- Propose an efficient machine-learning model to predict partner transformation;
- (3)
- Analyze a transformation partner regarding their economic change;
- (4)
- Introduce a novel algorithm based on the model to identify partners with unethical behavior.
2. Related Work
2.1. Data-Driven Method
2.2. The Six Ts of Transformation Model
2.3. Building Blocks of the Successful Digital Transformation Method
3. Methodology
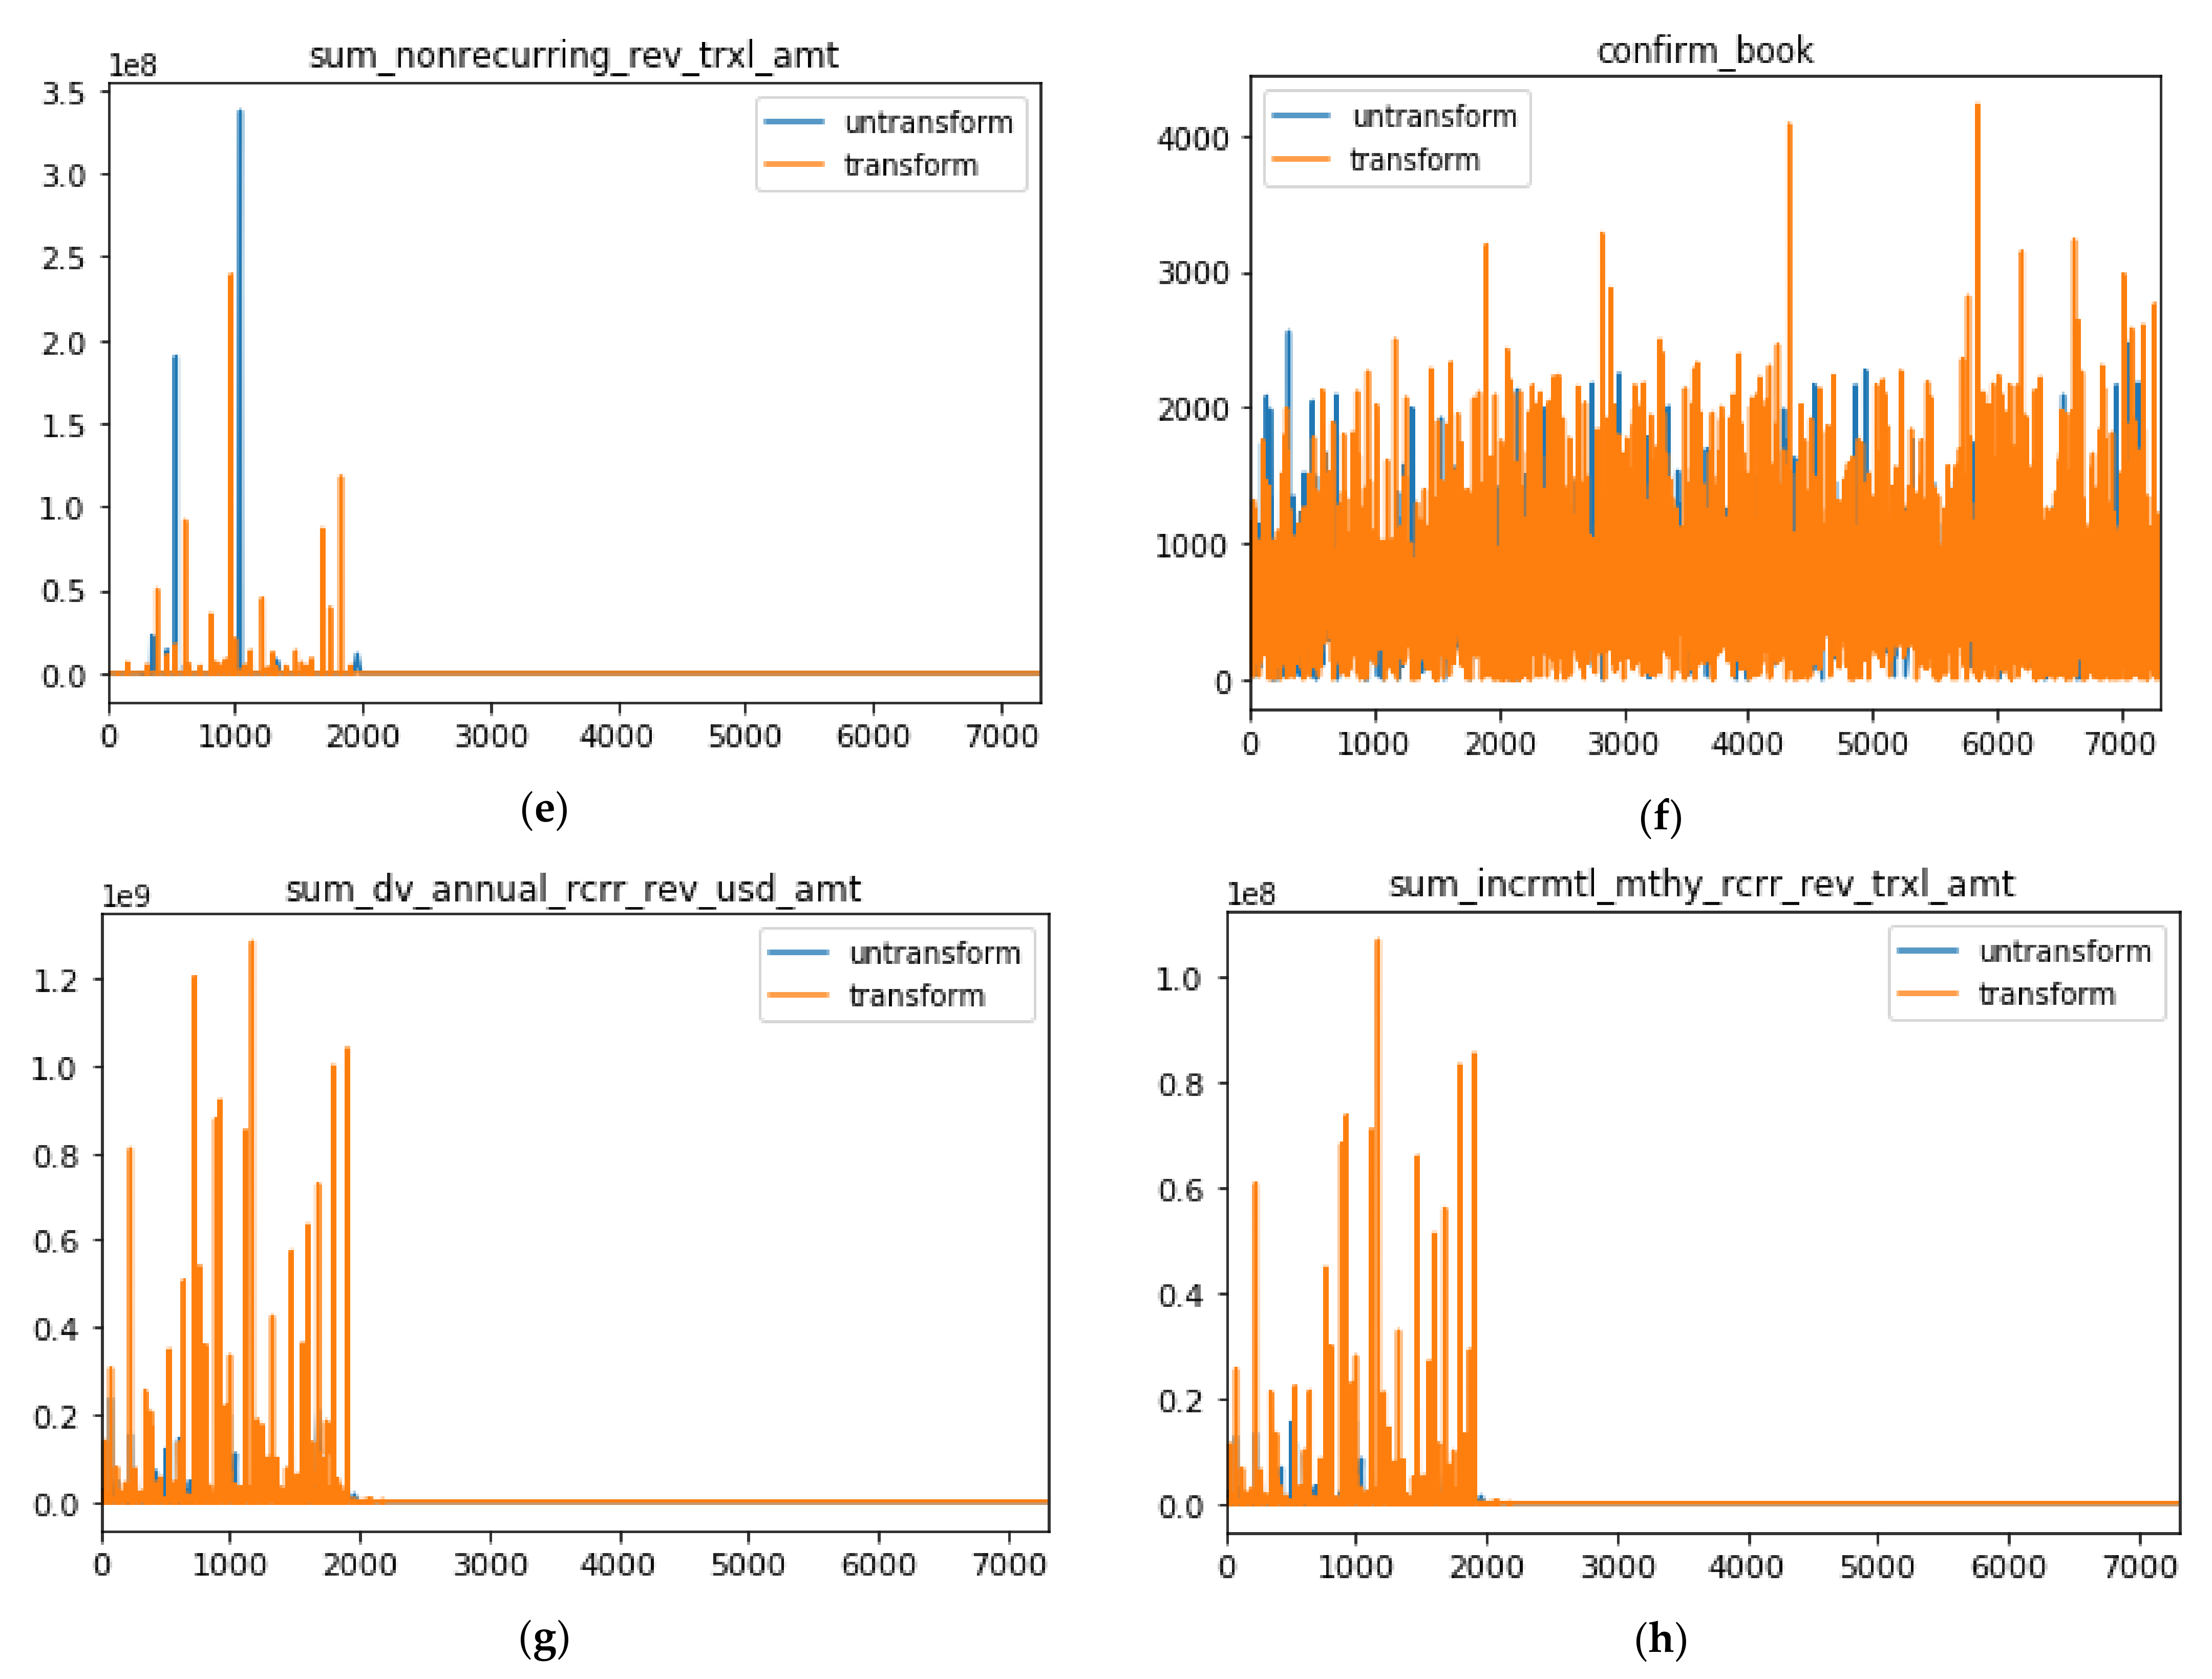
3.1. Data Preprocess and Feature Engineering
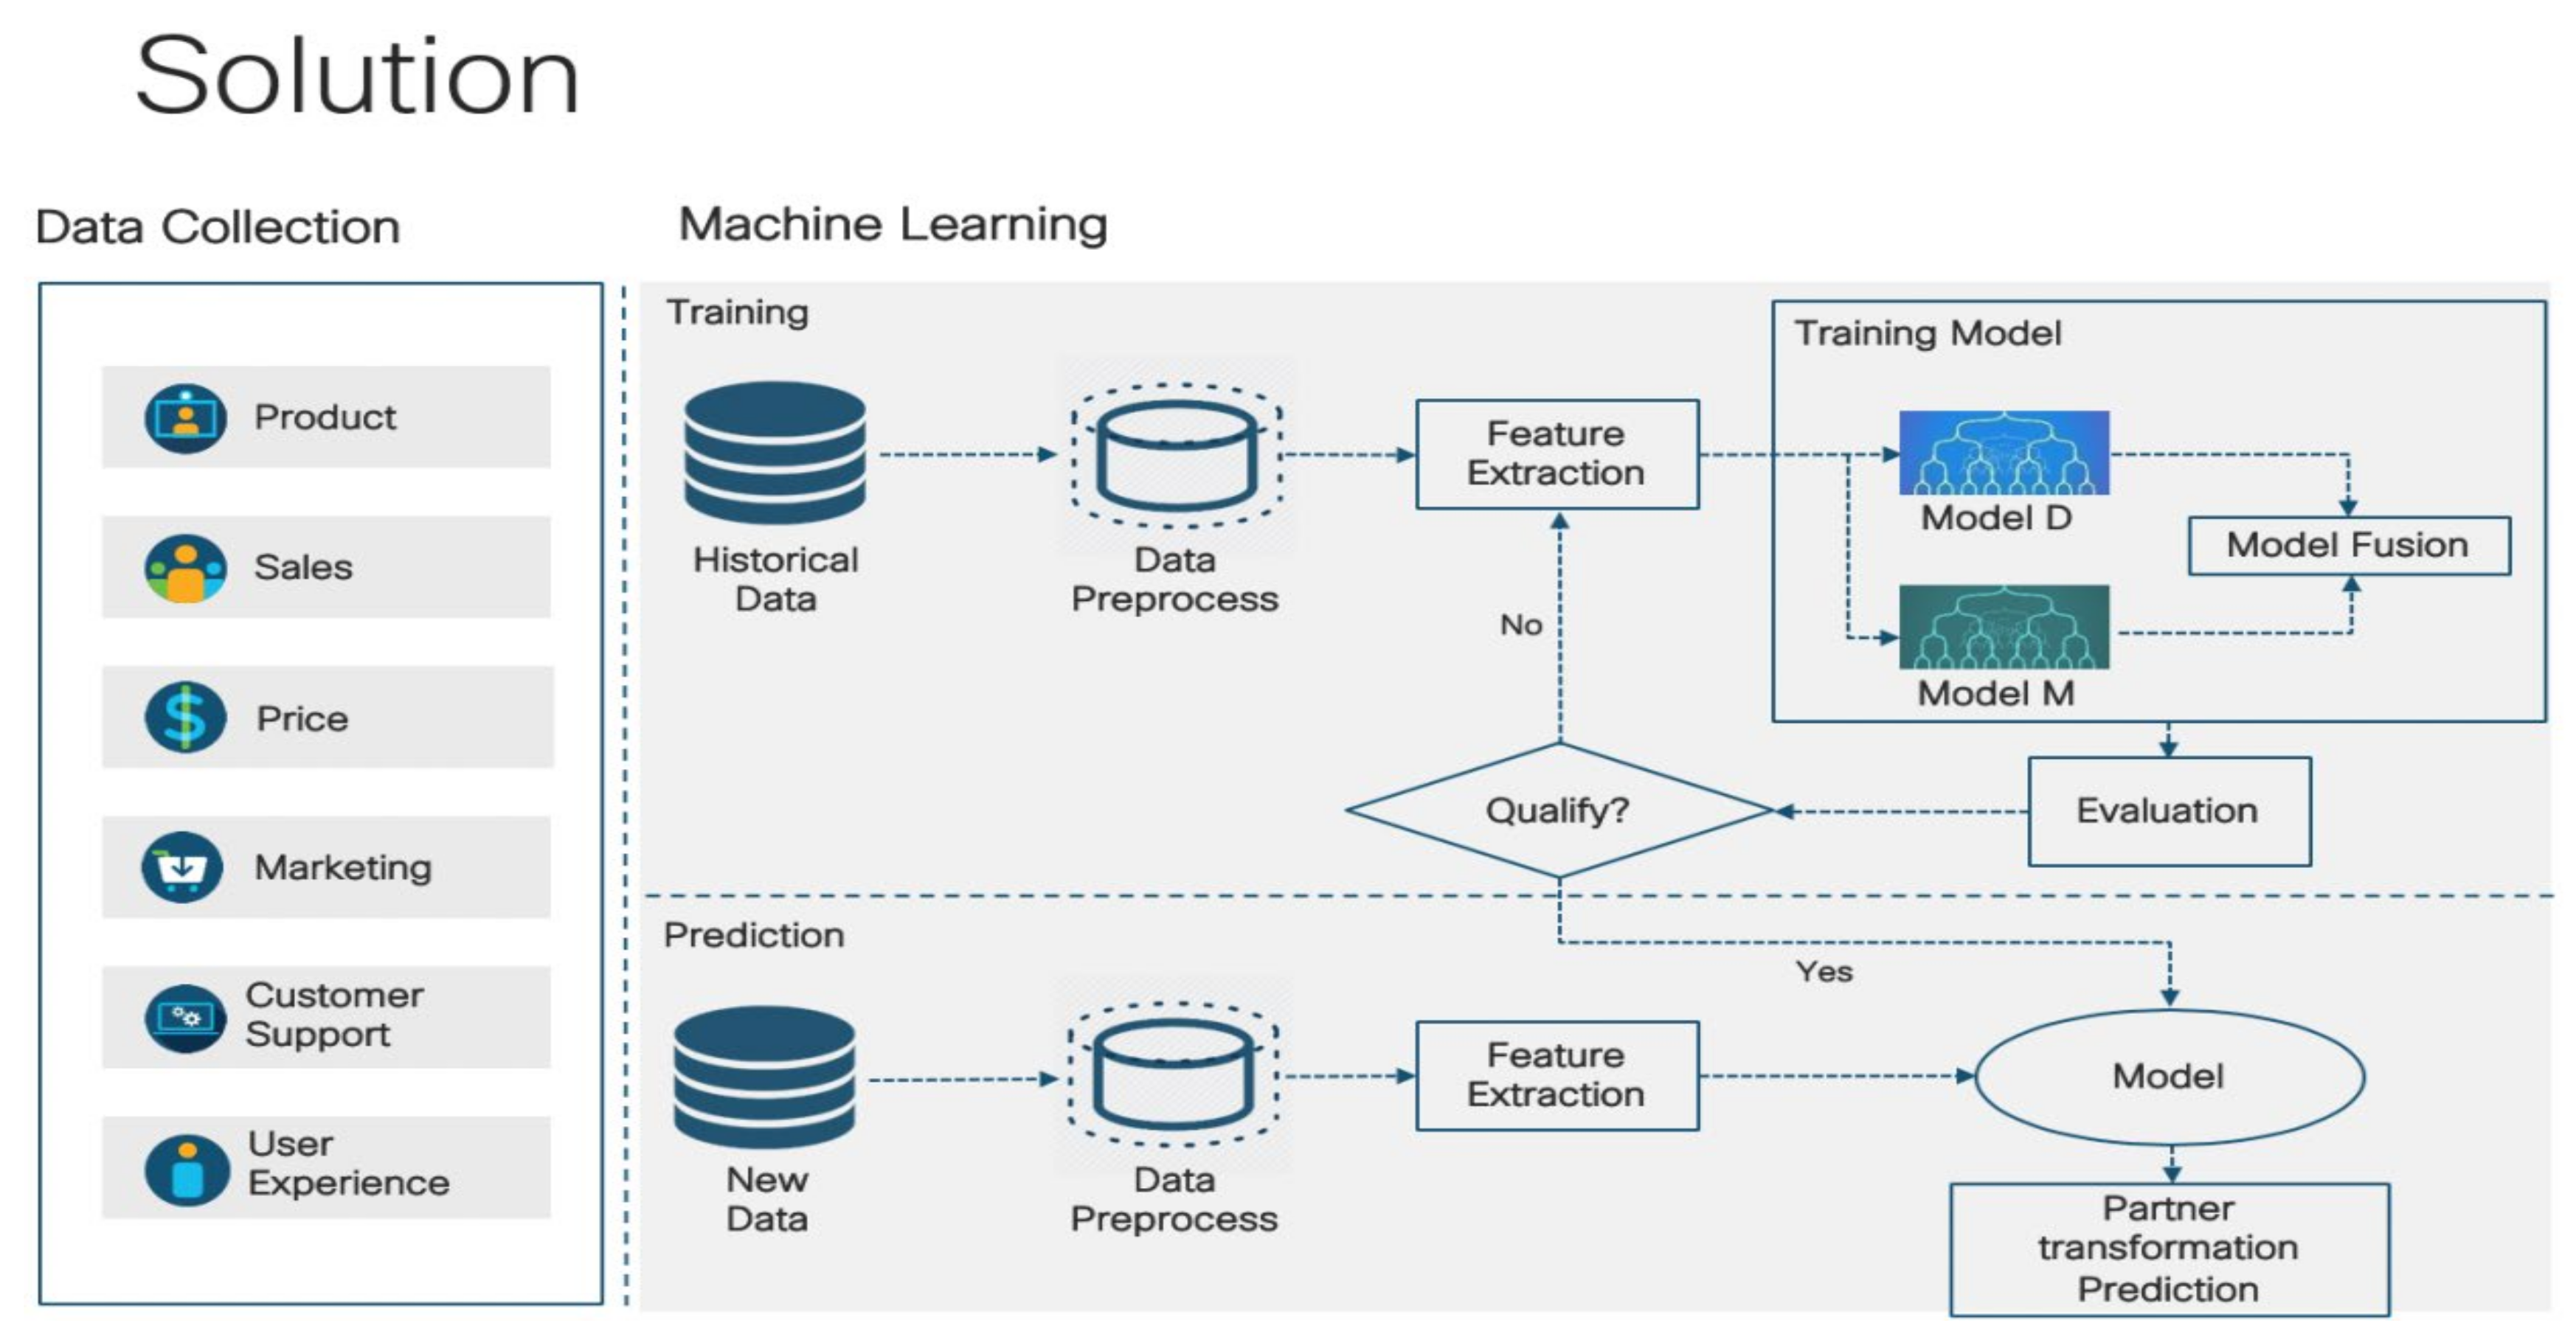
3.2. Machine-Learning Model Solution
3.3. VKR Algorithm Analysis
| Algorithm 1: Hybrid VKR (VAE, K-means, random forest) algorithm |
| Input: Data matrix , there m is total data number and n is the dimension of each data |
| 1. Deal with missing values(Sparse coding) |
| 2. Use normalization data to restructure the input data matrix X |
| 3. Build and training Model |
| 3.1 Using VAE model to generate latent mean vector |
| 3.2 Input latent vector to RF (Random Forest) to training model to identify partner transformation |
| 3.3 Input latent vector to K-means to training model to identify an unethical issue |
| 4. Using training VKR model to the prediction result |
| 5. Using a random forest algorithm to analyze the important indicators |
| 6. When meeting convergence condition output result |
| Output: Output matrix about the clustering result |
4. Experiment
4.1. Dataset
4.2. Experimental Method
5. Results and Discussion
5.1. How Do We Identify Partners Who Are Transforming or Are Ready to Transform across One or Many of the Transformation Dimensions
5.1.1. The Result of Prediction Transformation Partners
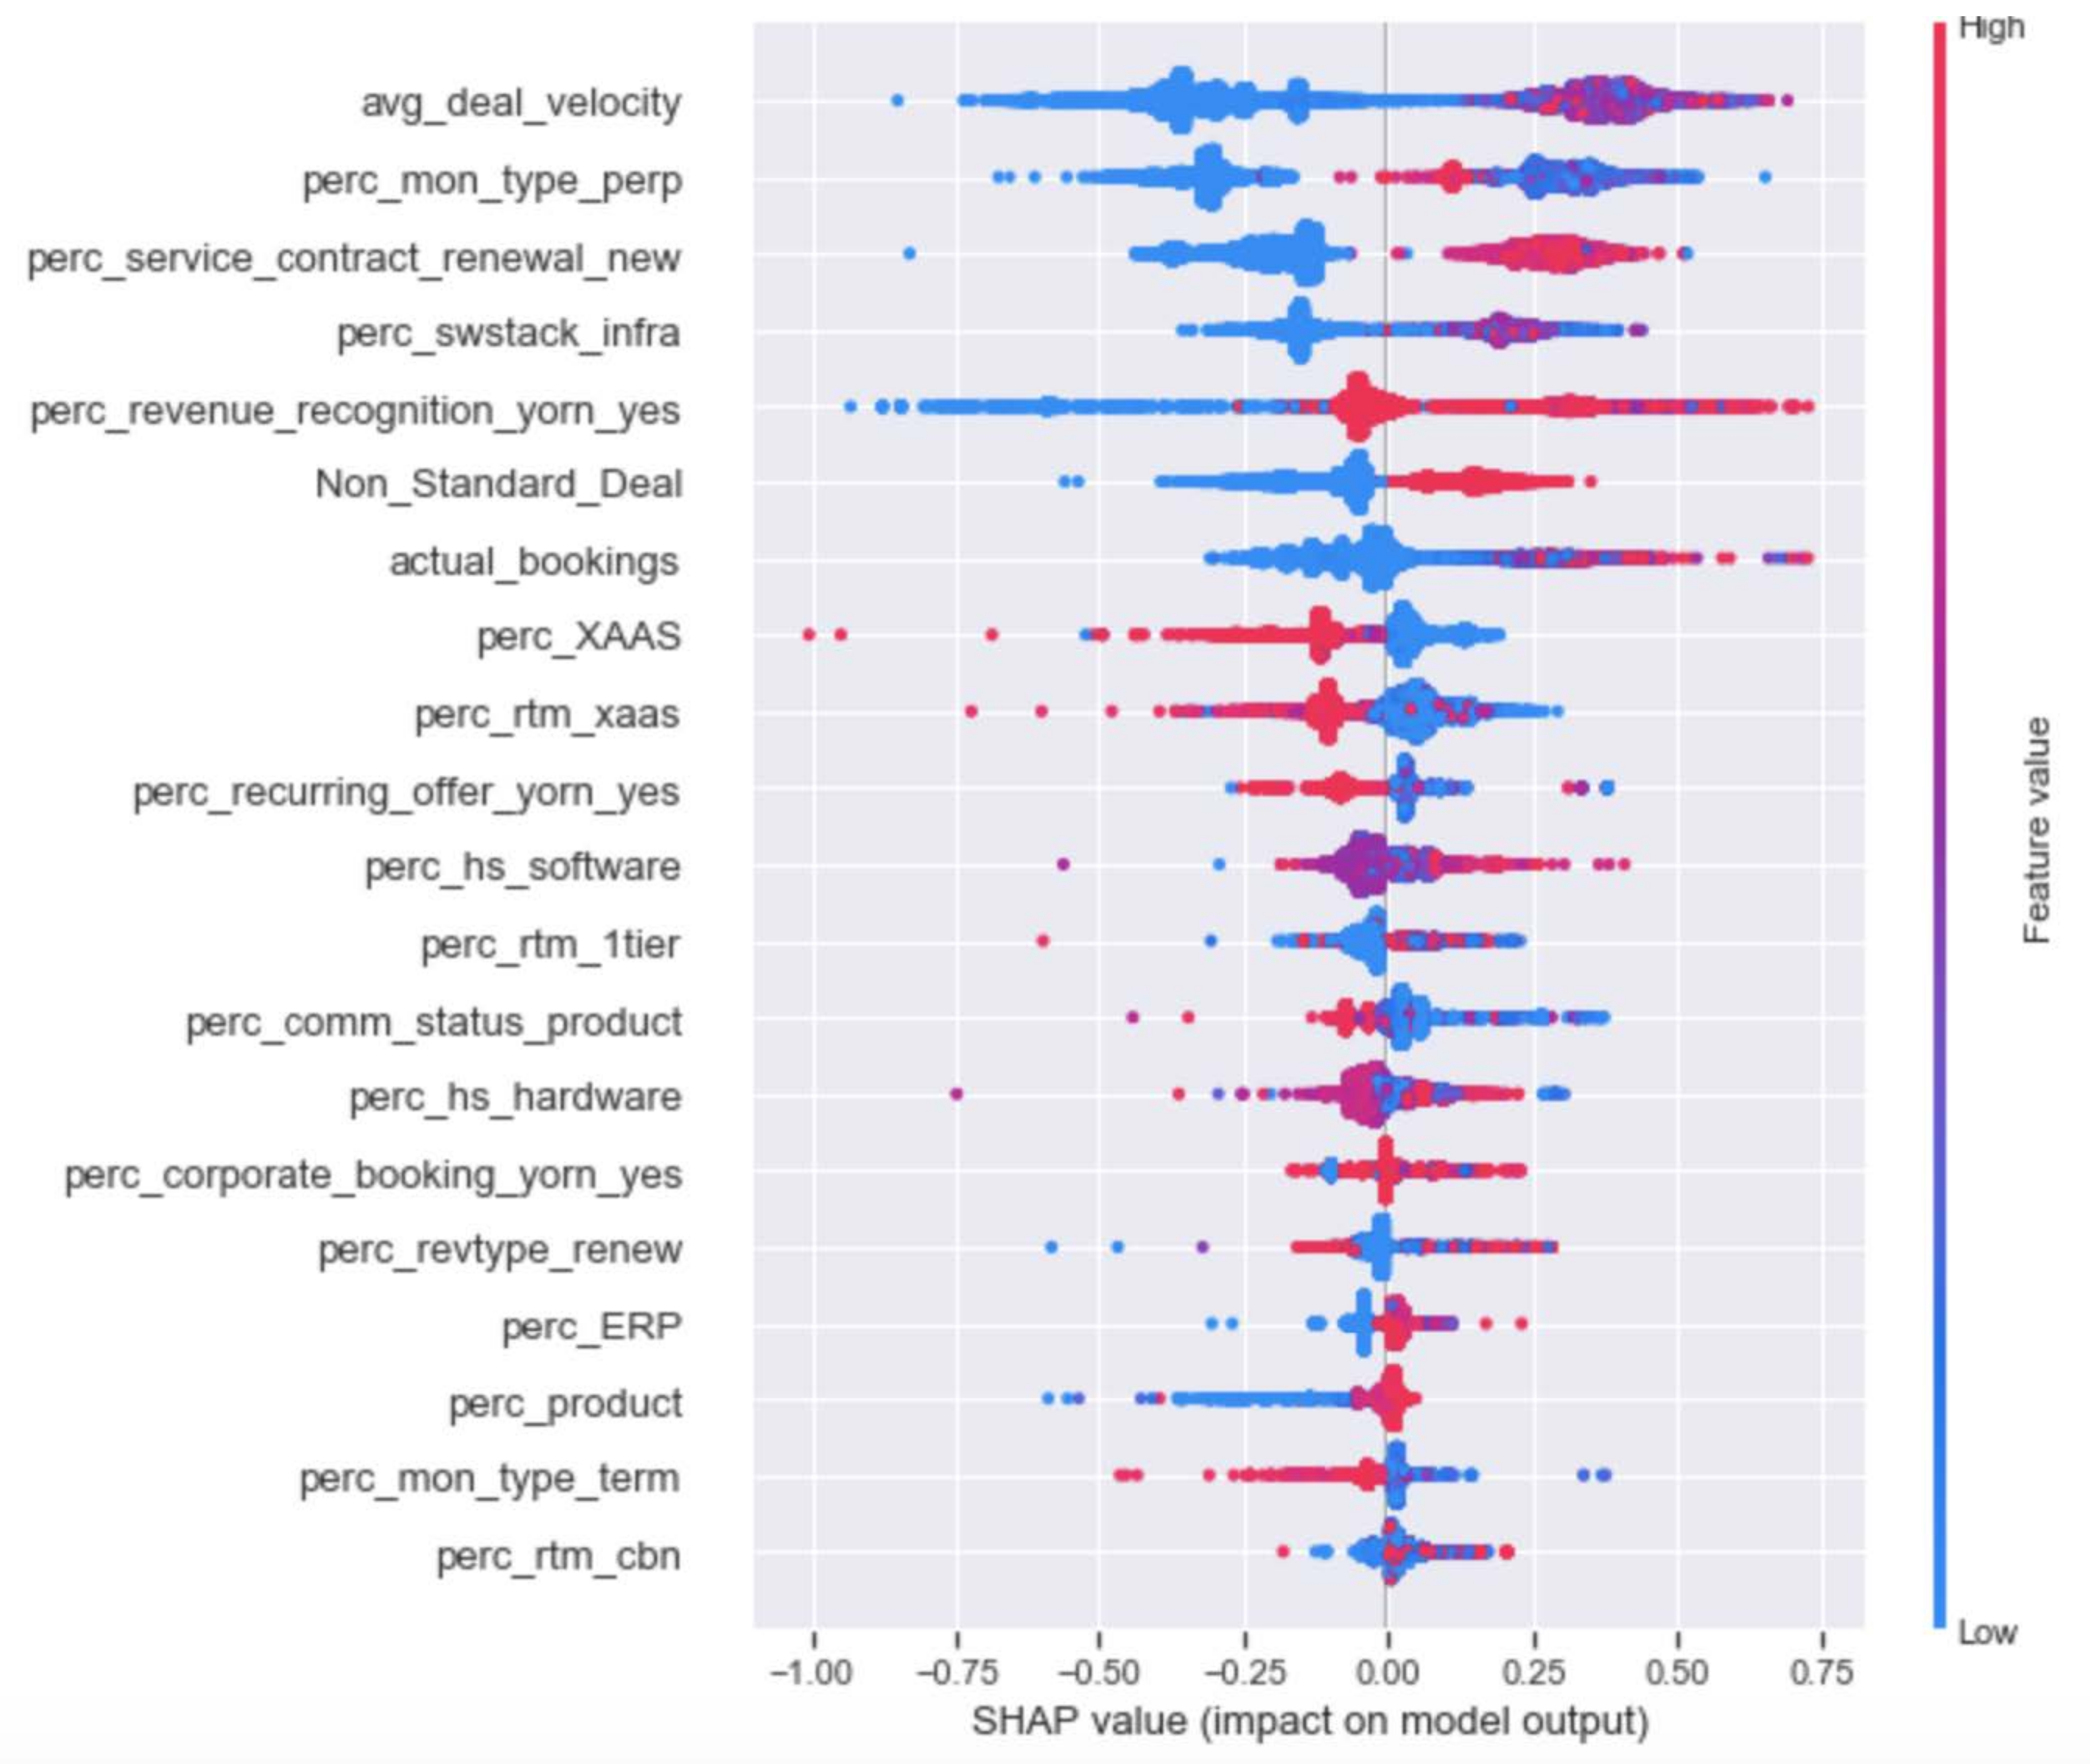
5.1.2. Importance of the Transformation Dimensions Analysis
5.1.3. Discussion
5.2. When a Partner Is Transforming along One or Many of the Transformation Dimensions, How Do Their Economics Change?
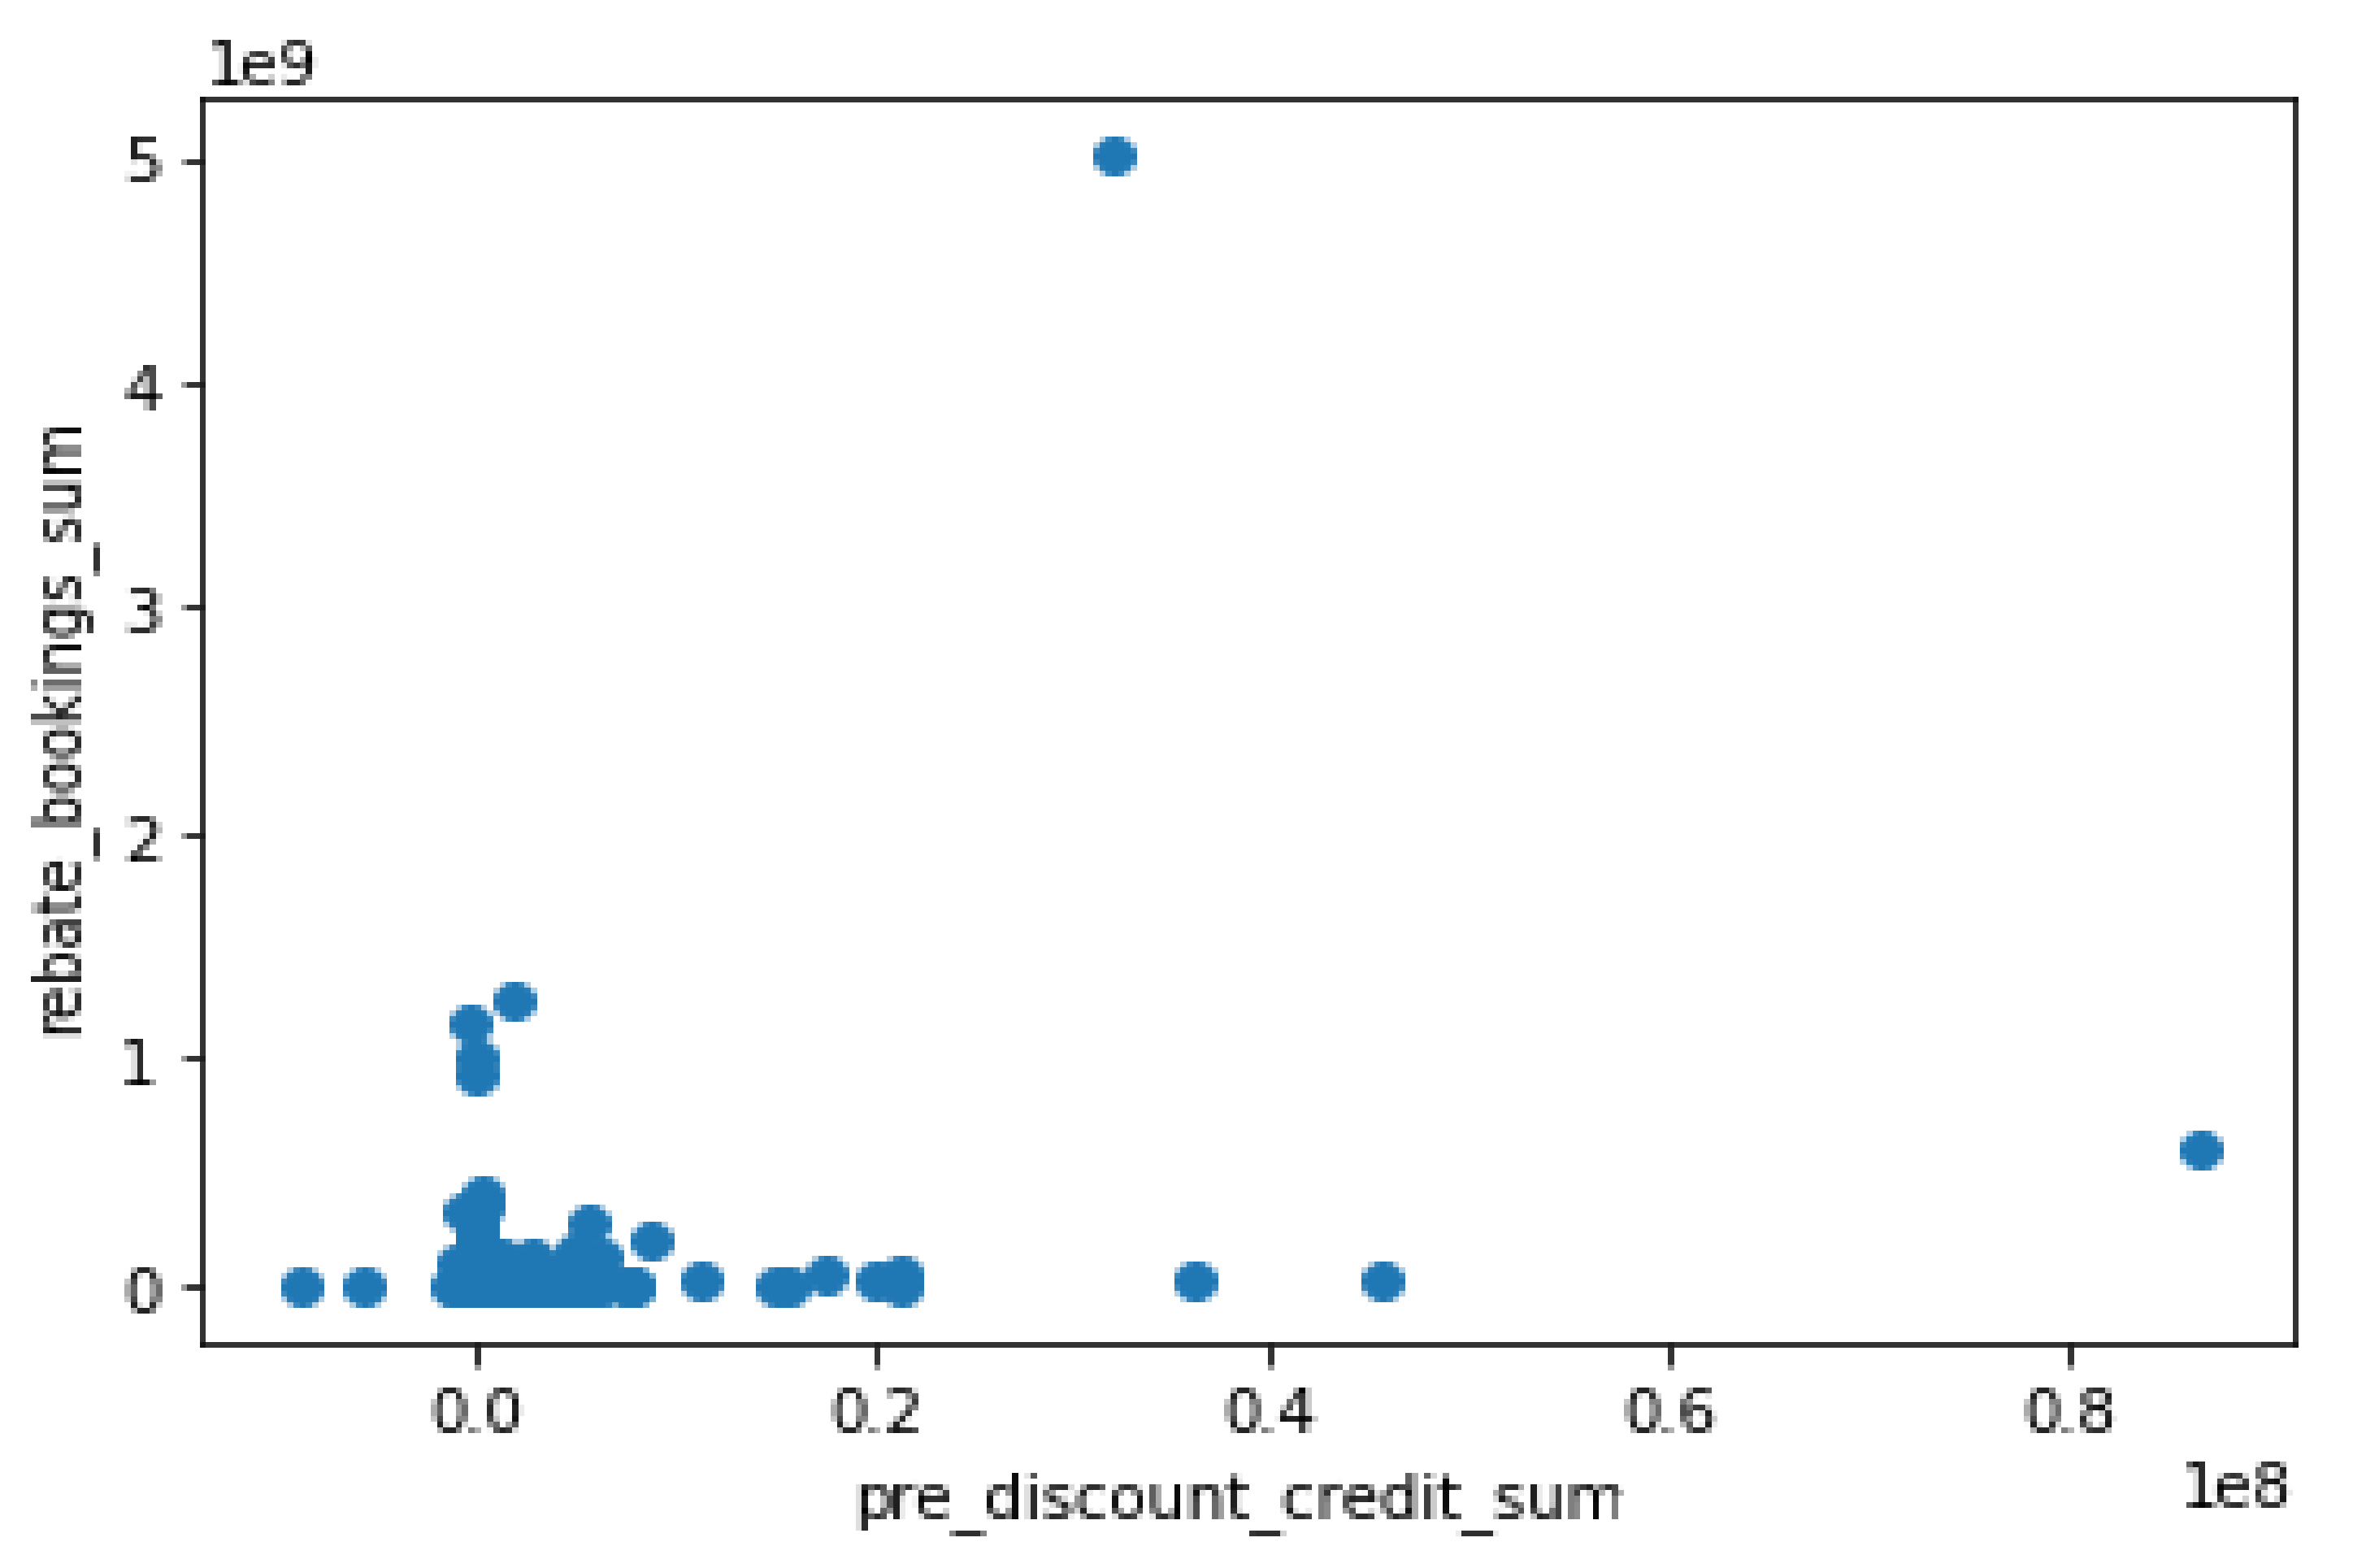
5.2.1. Relevant Data Collection
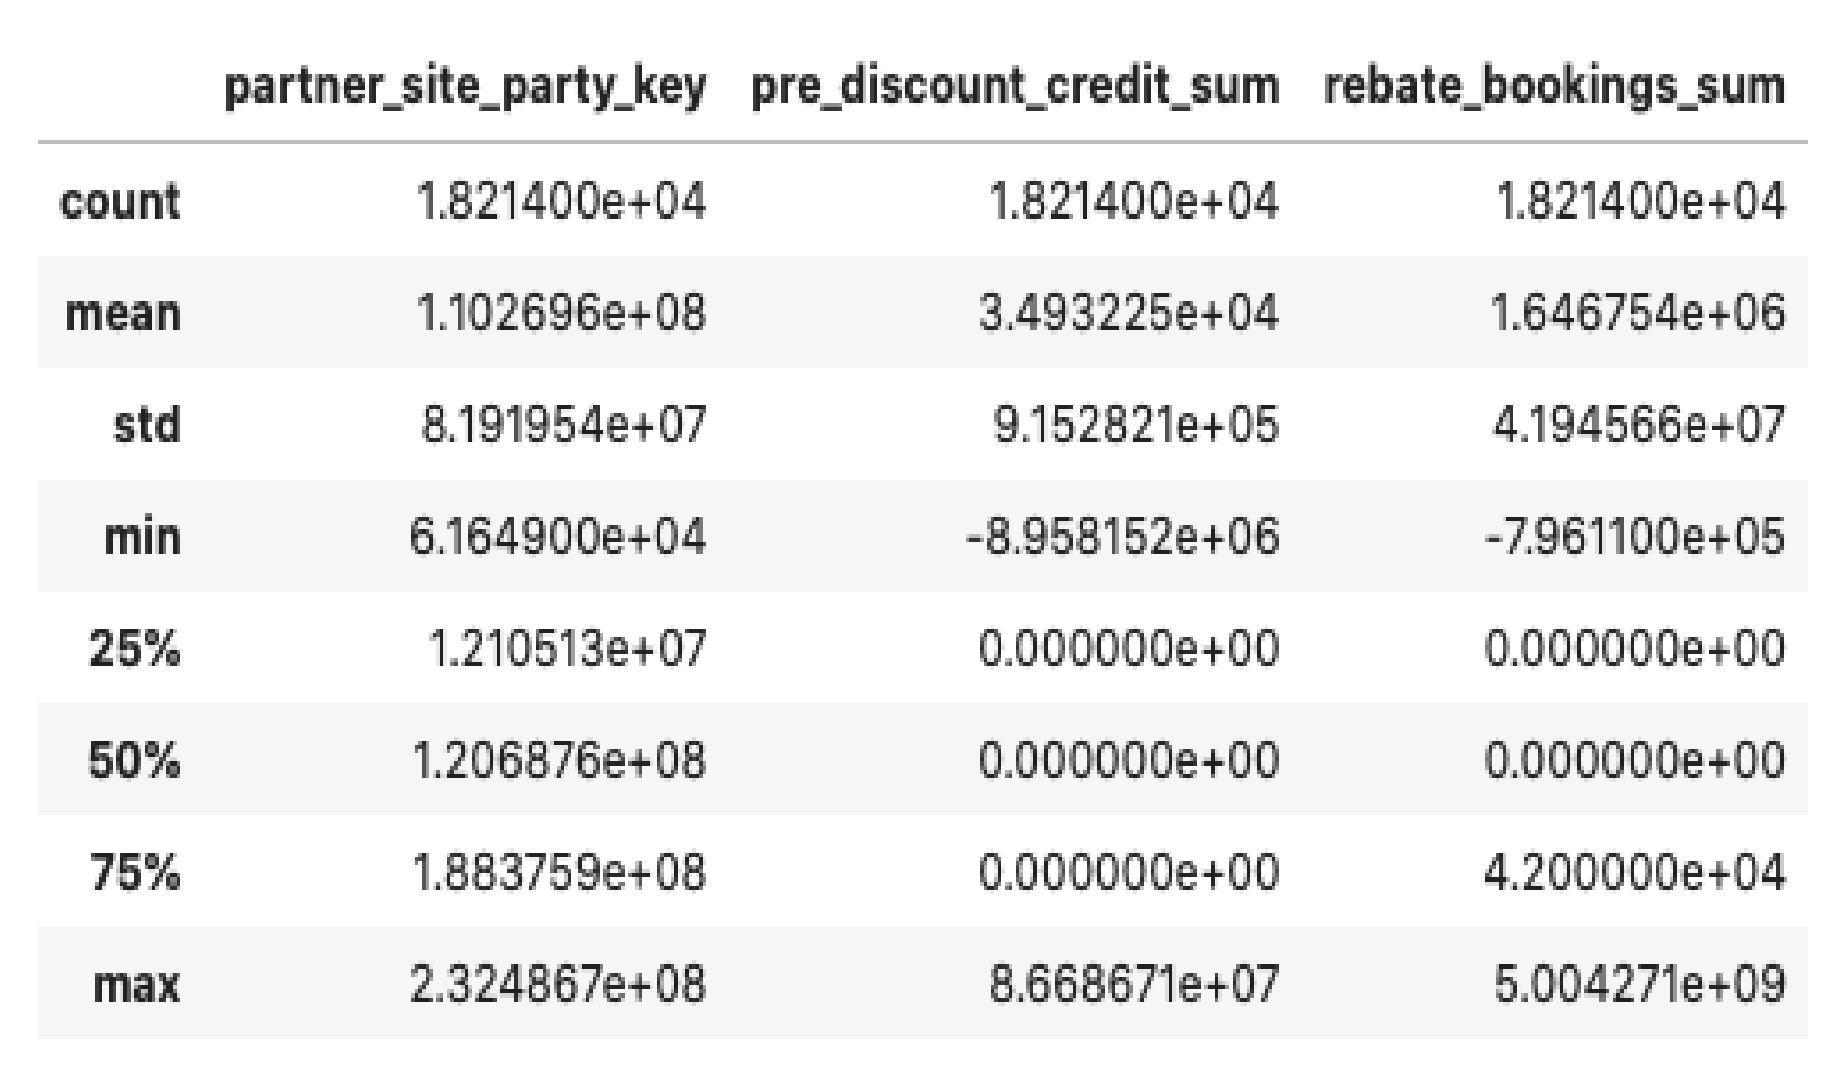
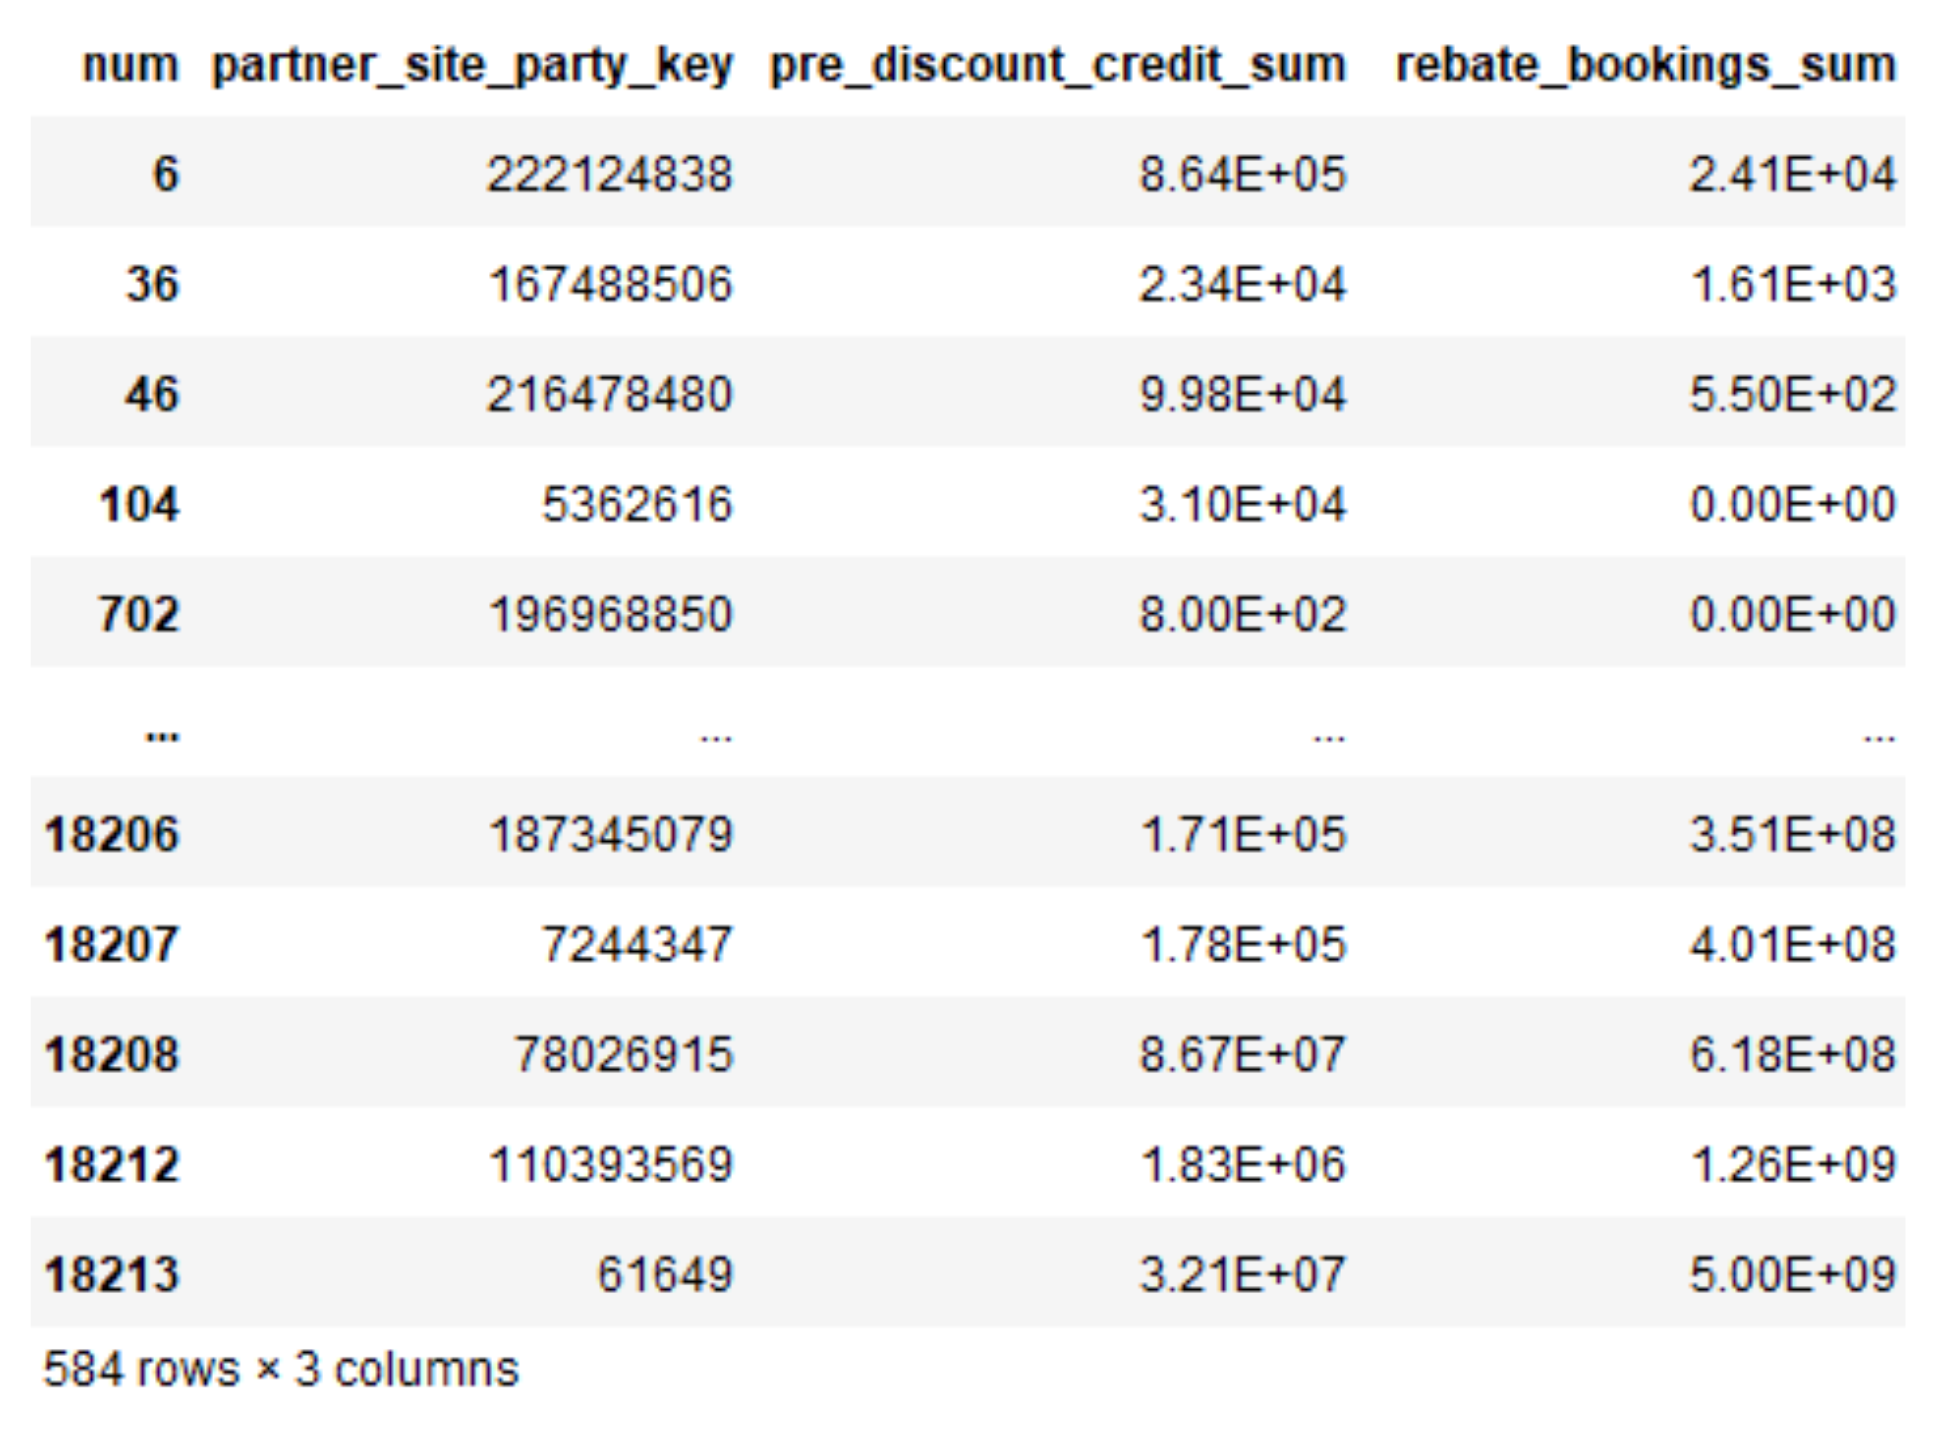
5.2.2. Data Analysis
5.2.3. Data Comparison Diagram
5.2.4. Discussion
5.3. Can We Spot Any Unethical Behavior by Looking through Our Deal Transaction Data?
5.3.1. Anomaly Detection
5.3.2. Discussion
6. Conclusions and Prospect
Author Contributions
Funding
Institutional Review Board Statement
Informed Consent Statement
Data Availability Statement
Conflicts of Interest
References
- AWS Partner Transformation [EB/OL]. Available online: https://aws.amazon.com/partners/partner-transformation (accessed on 13 October 2021).
- Microsoft Partner Transformation [EB/OL]. Available online: https://partner.microsoft.com/en-us/solutions/digital-transformation (accessed on 18 November 2020).
- NetApp Partner Transformation [EB/OL]. Available online: https://www.comparethecloud.net/articles/the-value-of-partnership-in-digital-transformation (accessed on 19 August 2020).
- Mitchell, T. Cisco Resellers Add Value. Ind. Mark. Manag. 2001, 30, 115–118. [Google Scholar] [CrossRef]
- Voorpostel, M.; van der Lippe, T.; Gershuny, J. Trends in Free Time with a Partner: A Transformation of Intimacy? Soc. Indic. Res. 2009, 93, 165–169. [Google Scholar] [CrossRef] [Green Version]
- Yin, H.; Zou, L.; Nguyen, Q.V.H.; Huang, Z.; Zhou, X. Joint Event-Partner Recommendation in Event-Based Social Networks. In Proceedings of the 2018 IEEE 34th International Conference on Data Engineering (ICDE), Paris, France, 16–19 April 2018; pp. 929–940. [Google Scholar]
- Jason, G.; Mehandjiev, N.; Wan, G. The Partner Ecosystem Evolution from On-premises Software to Cloud Services: A case study of SAP. In Proceedings of the PACIS 2019, X’ian, China, 8–12 July 2019. [Google Scholar]
- Malykh, A.A.; Nutku, Y.; Sheftel, M.B. Partner symmetries and non-invariant solutions of four-dimensional heavenly equations. J. Phys. A Math. Gen. 2004, 37, 7527–7545. [Google Scholar] [CrossRef]
- Vantara, H.; Kalakota, R.; Partner, L. Transform telecom: A data-driven strategy for digital transformation. White Paper Hitachi Vantara. 2019. Available online: https://www.hitachivantara.com/en-us/pdfd/white-paper/digital-transformation-of-telecom-industry-liquid-hub-whitepaper.pdf (accessed on 22 June 2019).
- Lichtenthaler, U. Building Blocks of Successful Digital Transformation: Complementing Technology and Market Issues. Int. J. Innov. Technol. Manag. 2019, 17, 2050004. [Google Scholar] [CrossRef]
- Forestiero, A.; Mastroianni, C.; Meo, M.; Papuzzo, G.; Sheikhalishahi, M. Hierarchical Approach for Green Workload Management in Distributed Data Centers. In Proceedings of the Intelligent Systems; Springer Science and Business Media LLC: Berlin/Heidelberg, Germany, 2014; Volume 8805, pp. 323–334. [Google Scholar]
- Forestiero, A.; Mastroianni, C.; Papuzzo, G.; Spezzano, G. A Proximity-Based Self-Organizing Framework for Service Composition and Discovery. In Proceedings of the 2010 10th IEEE/ACM International Conference on Cluster, Cloud and Grid Computing, Melbourne, VIC, Australia, 17–20 May 2010; pp. 428–437. [Google Scholar]
- Matheson, F.I.; Daoud, N.; Hamilton-Wright, S.; Borenstein, H.; Pedersen, C.; O’Campo, P. Where Did She Go? The Transformation of Self-Esteem, Self-Identity, and Mental Well-Being among Women Who Have Experienced Intimate Partner Violence. Women’s Health Issues 2015, 25, 561–569. [Google Scholar] [CrossRef] [PubMed]
- Rothenberg, R. The Transformation of Partner Notification. Clin. Infect. Dis. 2002, 35 (Suppl. 2), S138–S145. [Google Scholar] [CrossRef] [PubMed]
- Baker, S. From teacher to school librarian leader and instructional partner: A proposed transformation framework for educators of preservice school librarians. Synergy 2018, 16, 143–158. [Google Scholar]
- Ilhan, N.; Rahim, M.M. Understanding digital transformation of procurement through e-procurement systems implementation: Business partner relationship perspective. In Leadership, Management, and Adoption Techniques for Digital Service Innovation; IGI Global: Hershey, PA, USA, 2020; pp. 182–206. [Google Scholar]
- Manita, R.; Elommal, N.; Baudier, P.; Hikkerova, L. The digital transformation of external audit and its impact on corporate governance. Technol. Forecast. Soc. Chang. 2020, 150, 119751. [Google Scholar] [CrossRef]
- He, S.; Malik, B.; Borkin, D.; Miao, H.; Shukla, S.; Kempinska, K.; Purohit, T.; Wang, J.; Chen, L.; Parkin, B.; et al. Menin-MLL inhibitors block oncogenic transformation by MLL-fusion proteins in a fusion partner-independent manner. Leukemia 2016, 30, 508–513. [Google Scholar] [CrossRef] [PubMed] [Green Version]
- Bai, T.; Li, Y.; Wang, Y.; Huang, L. A Hybrid VAE Based Network Embedding Method for Biomedical Relation Mining. Neural Process. Lett. 2021, 1–12. [Google Scholar] [CrossRef]
- Ruby, U.; Yendapalli, V. Binary cross entropy with deep learning technique for image classification. Int. J. Adv. Trends Comput. Sci. Eng. 2020, 9. [Google Scholar] [CrossRef]
- Jadon, S. A survey of loss functions for semantic segmentation. In Proceedings of the 2020 IEEE Conference on Computational Intelligence in Bioinformatics and Computational Biology (CIBCB), Vina del Mar, Chile, 27–29 October 2020; pp. 1–7. [Google Scholar]
- Ibarra, H. Making partner: A mentor’s guide to the psychological journey. Harv. Bus. Rev. 2000, 78, 146–155. [Google Scholar]
- De Simone, A.; Matsedonskyi, O.; Rattazzi, R.; Wulzer, A. A first top partner hunter’s guide. J. High Energy Phys. 2013, 4, 1–50. [Google Scholar] [CrossRef] [Green Version]
- Petrescu, I. The manager in the process of client transformation into partner. Rev. Gen. Manag. 2019, 29, 5–26. [Google Scholar]
- Zhu, K.; Dong, S.; Xu, S.; Kraemer, K.L. Innovation diffusion in global contexts: Determinants of post-adoption digital transformation of European companies. Eur. J. Inf. Syst. 2006, 15, 601–616. [Google Scholar] [CrossRef]
- Hitt, M.A.; Dacin, M.T.; Levitas, E.; Arregle, J.L.; Borza, A. Partner selection in emerging and developed market contexts: Resource-based and organizational learning perspectives. Acad. Manag. J. 2000, 43, 449–467. [Google Scholar]
- Riggins, F.J.; Tridas, M. Interdependent benefits from inter-organizational systems: Opportunities for business partner reengineering. J. Manag. Inf. Syst. 1994, 11, 37–57. [Google Scholar] [CrossRef]
- Campbell, J.; Jones, A.S.; Dienemann, J.; Kub, J.; Schollenberger, J.; O’Campo, P.; Gielen, A.C.; Wynne, C. Intimate partner violence and physical health consequences. Arch. Intern. Med. 2002, 162, 1157–1163. [Google Scholar] [CrossRef] [PubMed] [Green Version]
- MacDonald, A.; Clarke, A.; Huang, L.; Seitanidi, M.M. Partner Strategic Capabilities for Capturing Value from Sustainability-Focused Multi-Stakeholder Partnerships. Sustainability 2019, 11, 557. [Google Scholar] [CrossRef] [Green Version]
- Brock, J.K.U.; Von Wangenheim, F. Demystifying AI: What digital transformation leaders can teach you about realistic arti-ficial intelligence. Calif. Manag. Rev. 2019, 61, 110–134. [Google Scholar] [CrossRef]
- Samui, P.; Roy, S.S.; Balas, V.E. (Eds.) Handbook of Neural Computation; Academic Press: Cambridge, MA, USA, 2017. [Google Scholar]
- Centobelli, P.; Cerchione, R.; Ertz, M. Agile supply chain management: Where did it come from and where will it go in the era of digital transformation? Ind. Mark. Manag. 2020, 90, 324–345. [Google Scholar] [CrossRef]
- Roy, S.S.; Samui, P.; Deo, R.; Ntalampiras, S. (Eds.) Big Data in Engineering Applications; Springer: Berlin/Heidelberg, Germany, 2018; Volume 44. [Google Scholar]
- Nambisan, S.; Wright, M.; Feldman, M. The digital transformation of innovation and entrepreneurship: Progress, challenges and key themes. Res. Policy 2019, 48, 103773. [Google Scholar] [CrossRef]


| No. | Dataset Name | Table Name |
|---|---|---|
| 1 | reference_ss | customers_d |
| 2 | reference_ss | deals_d |
| 3 | reference_ss | partners_d |
| 4 | reference_ss | products_d |
| 5 | reference_ss | pv_fiscal_day_to_year |
| 6 | reference_ss | pv_sales_hierarchy |
| 7 | sales_ss | bookings_f |
| 8 | sales_ss | pipeline_f |
| 9 | sales_ss | pv_bookings_channel_measure |
| 10 | sales_ss | pv_cs_deal_so_line_link |
| 11 | sales_ss | pv_sales_order_line |
| 12 | sales_ss | pv_sales_order_tv |
| 13 | sales_ss | pv_sol_end_customer |
| 14 | services_ss | df_installed_product_f |
| Field Name | Type | Description |
|---|---|---|
| partner_site_party_key | INTEGER | PartnerId which we want to identify |
| annual_rcrr_rev_2017 | NUMERIC | recurring revenue in 2017 |
| annual_rcrr_rev_2018 | NUMERIC | recurring revenue in 2018 |
| nonrecurring_rev_2017 | NUMERIC | nonrecurring revenue in 2017 |
| nonrecurring_rev_2018 | NUMERIC | nonrecurring revenue in 2018 |
| order_cnt_2017 | INTEGER | the number of orders the partner participated in in 2017 |
| order_cnt_2018 | INTEGER | the number of orders the partner participated in in 2018 |
| muti_partner_deal_id_amt | INTEGER | number of muti_partner_deal each partner involved in |
| rate_of_2017_2018 | FLOAT | the ratio of multiparter deals to all kinds of deals per year |
| rate_of_2018_2019 | FLOAT | the ratio of multiparter deals to all kinds of deals per year |
| rate_of_2019_2020 | FLOAT | the ratio of multiparter deals to all kinds of deals per year |
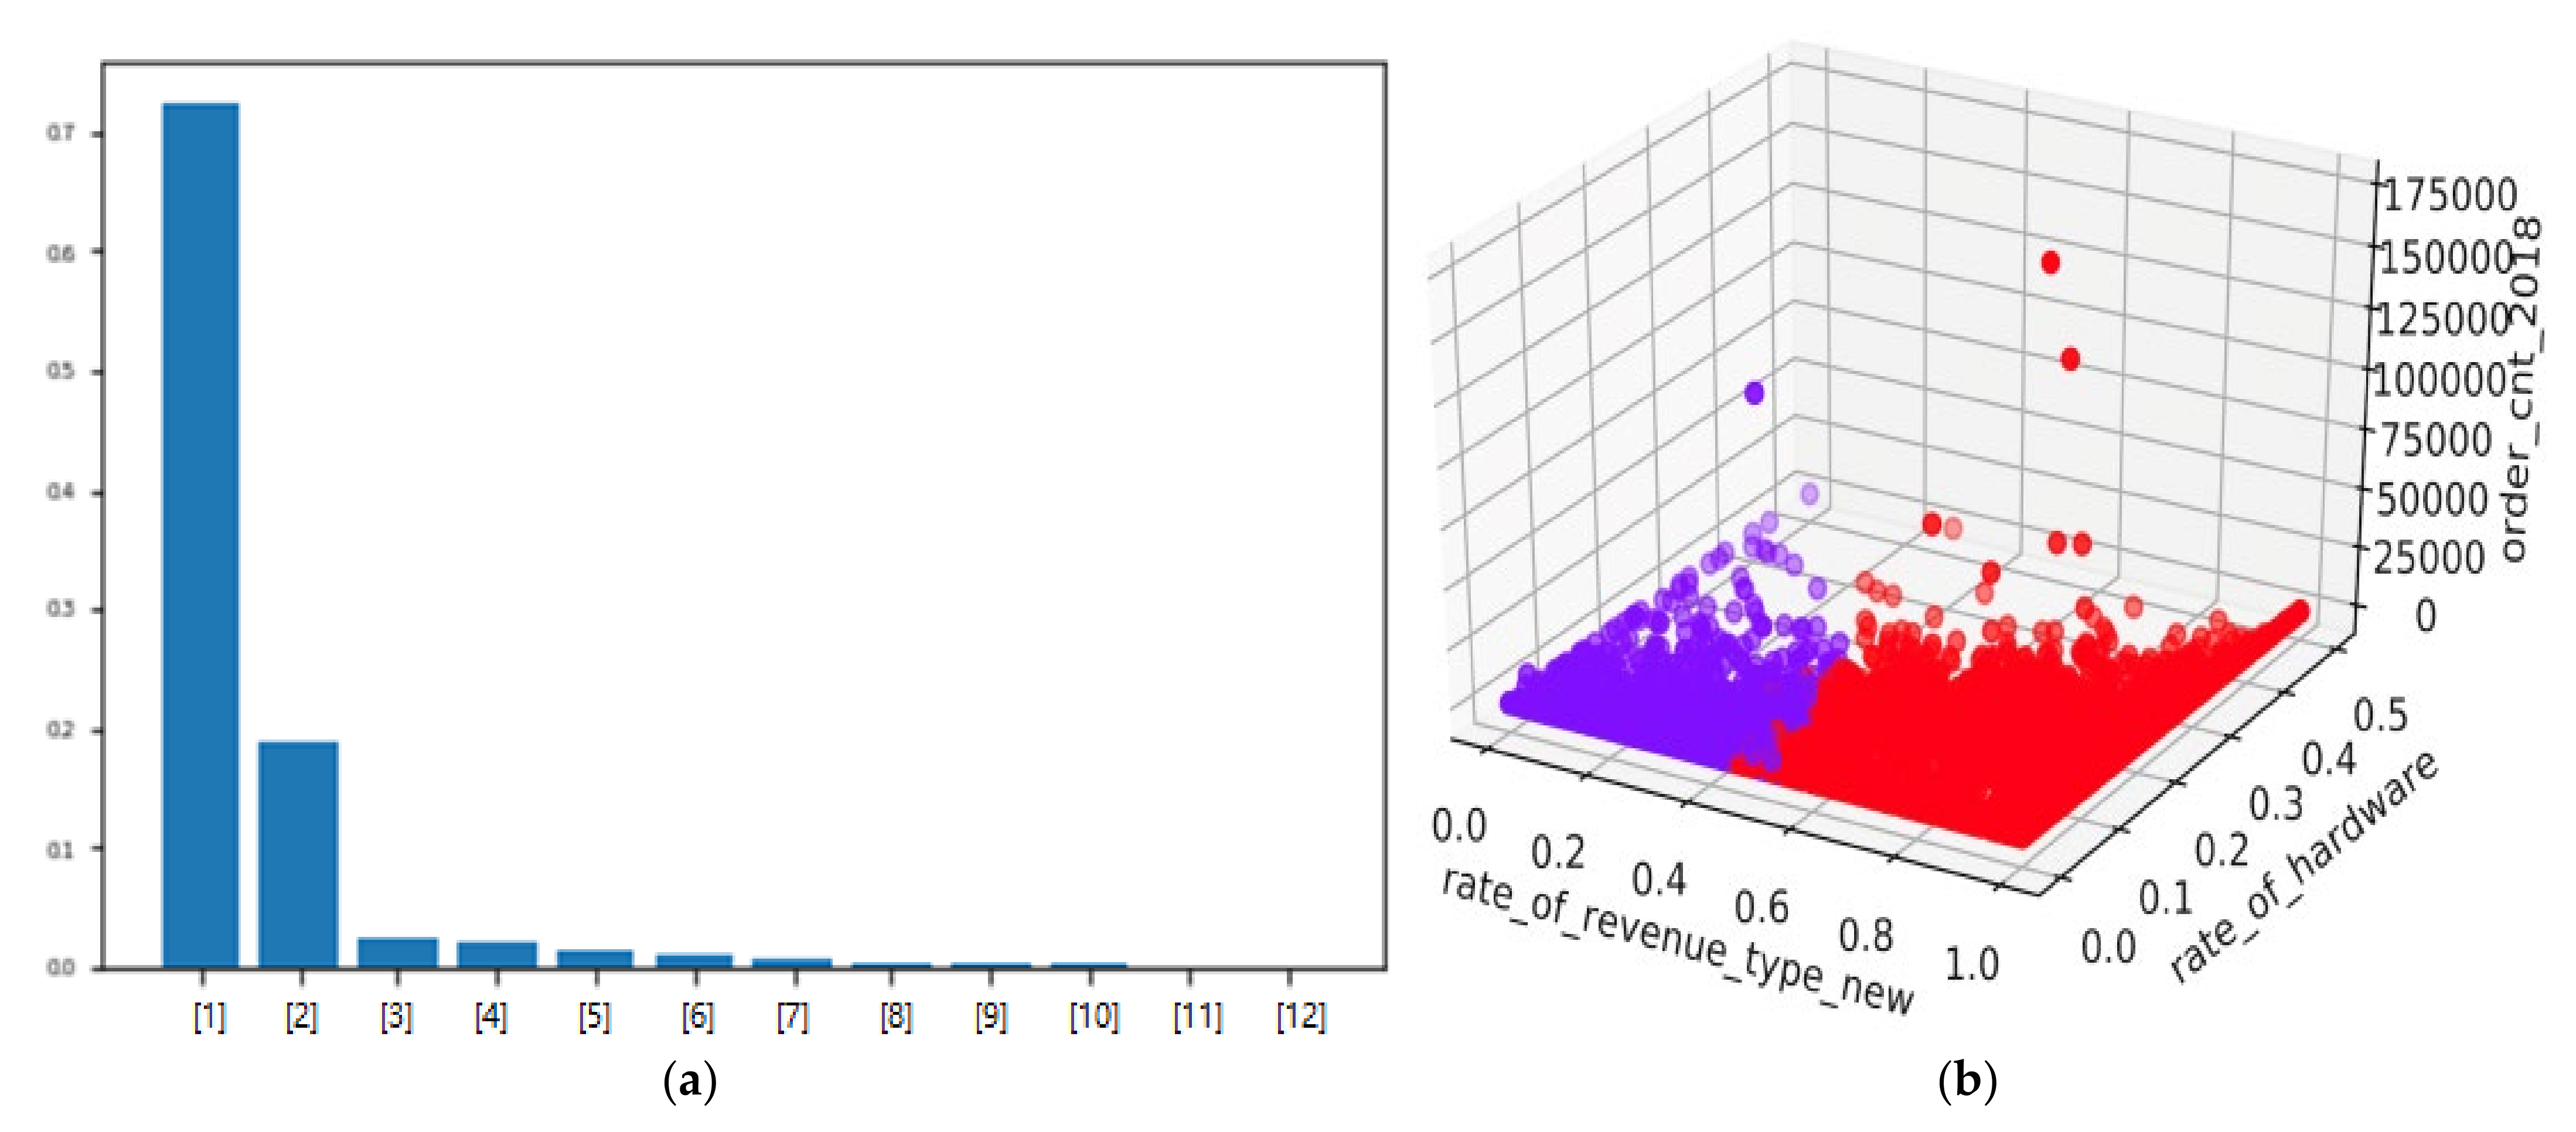
| rate_of_revenue_type_new | FLOAT | the percentage of new revenue |
| rate_of_hardware | FLOAT | the percentage of hardware booking |
| partner_site_key | annual_rev_2017 | annual_rev_2018 | order_cnt_2017 | order_cnt_2018 | rate_of_revenue | rate_of_hardware | Predict |
|---|---|---|---|---|---|---|---|
| 10018921 | 0.00E + 00 | 20442 | 24 | 43 | 0.94846009 | 0.18667505 | 1 |
| 4894595 | 0.00E + 00 | 12003.36 | 181 | 253 | 0.99975032 | 0.45575752 | 1 |
| 13451993 | 0.00E + 00 | 0.00E + 00 | 21 | 42 | 0.99270483 | 0.2295174 | 1 |
| 157253070 | 1578.72 | 0.00E + 00 | 24 | 36 | 0.96423562 | 0.19565217 | 1 |
| 12732302 | 0.00E + 00 | 28056 | 14 | 43 | 0.83266325 | 0.17856648 | 1 |
| 3480934 | 0.00E + 00 | 0.00E + 00 | 12 | 29 | 0.98648649 | 0.04504505 | 1 |
| 197212382 | 0.00E + 00 | 0.00E + 00 | 45 | 59 | 0.96057866 | 0.08788427 | 1 |
| 215969797 | 0.00E + 00 | 0.00E + 00 | 6 | 19 | 0.49645669 | 0.26122047 | 1 |
| 9823118 | 0.00E + 00 | 0.00E + 00 | 14 | 43 | 1 | 0 | 1 |
| 5635975 | 0.00E + 00 | 142830 | 0 | 21 | 1 | 0.44736842 | 1 |
| 210118079 | 18000 | 1500000 | 153 | 296 | 1 | 0.1515625 | 1 |
| 2963274 | 0.00E + 00 | 0.00E + 00 | 476 | 1283 | 1 | 0 | 1 |
| 11864141 | 0.00E + 00 | 0.00E + 00 | 10 | 34 | 0.96503497 | 0.04195804 | 1 |
| 564774 | 0.00E + 00 | 44004 | 80 | 208 | 0.96732889 | 0.06323015 | 1 |
| 222156482 | 23148.84 | 826367.4 | 384 | 665 | 0.69586588 | 0.19068726 | 1 |
| 98668929 | 2787 | 0.00E + 00 | 26 | 45 | 0.79325843 | 0.0411236 | 1 |
| 7897872 | 1671.6 | 0.00E + 00 | 29 | 83 | 0.93974556 | 0.22997344 | 1 |
| 143938004 | 0.00E + 00 | 1094.16 | 28 | 107 | 0.93018403 | 0.10434453 | 1 |
| 203076171 | 0.00E + 00 | 0.00E + 00 | 42 | 44 | 0.70868347 | 0.19794585 | 1 |
| 209689932 | 0.00E + 00 | 0.00E + 00 | 1 | 38 | 0.71361502 | 0.13849765 | 1 |
| 162572460 | 0.00E + 00 | 0.00E + 00 | 5 | 17 | 0.61871286 | 0.13646139 | 1 |
| 230369460 | 271542.12 | 1310853.96 | 28 | 76 | 1 | 0.31467964 | 1 |
| 100342751 | 6573.84 | 303184.08 | 6 | 144 | 1 | 0 | 1 |
| 12102582 | 6280.32 | 11995.68 | 13 | 28 | 1 | 0.25290698 | 1 |
| Booking | Revenue | Gross Margin | Deal Size | Deal Velocity |
|---|---|---|---|---|
| rebate_bookings | annual_rcrr_rev_trxl_amt | sum_tss_gross_margin | list_price | shipment_confirmed_date |
| annualized_bookings | dv_annual_rcrr_rev_usd_amt | sum_product_bookings_gross_margin | cost | booked_date |
| actual_bookings | mthly_rcrr_rev_trxl_amt | base_price | ||
| nonrecurring_rev_trxl_amt |
| partner_site_party_key | pre_discount_credit_sum | rebate_bookings_sum |
|---|---|---|
| 222124838 | 863,944.85 | −24,060 |
| 167488506 | 23,364 | −1610 |
| 216478480 | 99,774,44 | −550 |
| 5362616 | 30,999,96 | 0 |
| 196968850 | 800 | 0 |
| 3105456 | 99,000 | 0 |
Publisher’s Note: MDPI stays neutral with regard to jurisdictional claims in published maps and institutional affiliations. |
© 2021 by the authors. Licensee MDPI, Basel, Switzerland. This article is an open access article distributed under the terms and conditions of the Creative Commons Attribution (CC BY) license (https://creativecommons.org/licenses/by/4.0/).
Share and Cite
He, C.; H. Q. Ding, C. Predicting Partner’s Digital Transformation Based on Artificial Intelligence. Appl. Sci. 2022, 12, 91. https://doi.org/10.3390/app12010091
He C, H. Q. Ding C. Predicting Partner’s Digital Transformation Based on Artificial Intelligence. Applied Sciences. 2022; 12(1):91. https://doi.org/10.3390/app12010091
Chicago/Turabian StyleHe, Chenggang, and Chris H. Q. Ding. 2022. "Predicting Partner’s Digital Transformation Based on Artificial Intelligence" Applied Sciences 12, no. 1: 91. https://doi.org/10.3390/app12010091
APA StyleHe, C., & H. Q. Ding, C. (2022). Predicting Partner’s Digital Transformation Based on Artificial Intelligence. Applied Sciences, 12(1), 91. https://doi.org/10.3390/app12010091