1. Introduction
The theory and practice of industrial production have been dealing with the issues of loss elimination and labor productivity growth for several decades. In 1921, Herbert Hoover set up The Committee on the Elimination of Waste in Industry [
1]. The causes of losses are extremely complex. Even for the simplest tasks, it is possible to detect many errors contributing to waste of matter or of human and machine energy, but especially over time. Wasted time has proven to be the biggest cause of losses, although losses seem to arise differently. Equally important is the correct use of production equipment. However, no loss is caused by a single reason. Therefore, it is possible to consider losses only in relation to each other. This is the basic knowledge of the loss analysis. It is conditioned by the very dynamics of the production process, which is often similar to sociological phenomena [
2]. For practical reasons, losses are divided into only a few main groups, such as production, administrative, financial, business losses, and those caused by external influences. Each of these major groups is divided into a confusing number of smaller units, of various origins and compositions. The units are very diverse and differently graded and important in each company, depending on the method of production, environment, and personal relationships [
3].
Production losses arise from the non-utilization of the full production capacity of the plant, frequent restrictions and interruptions of production, caused by accidents, diseases, intentionally, etc. The extent of production losses depend mainly on correct technical and personal assumptions. The four groups of causes of industrial losses according to [
4,
5] are (a) low production, caused by incorrect management of raw materials, production, production equipment and incorrect management of workers, (b) intermittent (periodic) production, caused by inactivity of employees, materials, workshops and production facilities, (c) reduced production intentionally caused by business owners, management and employees; and (d) reduced production due to illness, physical defects and production injuries.
The impetus for writing this article was research carried out on a production line that produces fire dampers. Based on initial analyzes of the production process, various forms of waste were revealed, which contributed to a significant part of the working time of workers on the production line. The losses were eliminated and thus the costs and the course of production were optimized. Three different approaches to measuring and managing losses on the production line were used. The aim was to point out how the choice of method of measuring and managing losses during production will affect the results. The results of all three approaches were evaluated from a technical and economic point of view. Research conceived in this way, with a focus on a production line with three workplaces, is rare in the literature.
2. Literature Review
According to [
6,
7,
8], two concepts can be encountered in the context of production optimization. The word loss was used, mainly, at the beginning of the last century after the First World War, and the word “waste” was not brought into practice until the 1970s. The biggest obstacle to increasing productivity is ignorance of waste, of any kind. The process is a series of consecutive steps that begins with the input of raw materials and ends with the output of finished products. Value is added to the product in each of the process steps. Workers and machines thus add value to the product, or do not add value. The term waste refers to all activities that do not add value to the product and, at the same time, increase the cost of the product [
9,
10]. Waste is defined as activities that consume resources but do not create any value for the customer [
11]. Most value-flowing activities that create value for the customer are a small part of all activities. Eliminating large amounts of waste has the greatest potential for improving performance [
12]. Waste is anything that increases the cost of a product or service without increasing its value [
13].
Through the gradual development of the concept of leanness, Shingo defined waste as 3 MU: MUDA—waste (time, material, resources), MURI—congestion (workers, lines, transport), MURA—non-continuity (work, supplies) [
5,
8,
10]. MUDA (waste) is classified into today’s seven categories:
Overproduction—production of items for which there is no use. It is the worst form of waste because it contributes to the creation of another waste.
Supplies—in the form of raw materials, work in progress or finished products, represent capital expenditures that do not generate revenue for either the producer or the customer.
Waiting—arises when the work of workers stops. These are waiting for material, machine failures, the uneven workload of individual consecutive operations.
Transport—this is an unnecessary transfer of parts or products, such as from a warehouse processing step to a subsequent processing step, where the second step could be located immediately adjacent to the first step.
Movements—all unnecessary movements that workers must perform at work, e.g., search for tools, documents, etc.
Errors—these are inspections, rework of failures and scrap.
Overwork—performing unnecessary or incorrect processing, usually due to a bad tool or product design [
14,
15,
16,
17,
18].
Unused employee creativity—losses from not using ideas, skills, new improvements or learning opportunities [
19].
The eighth type of waste was later added to this categorization. Today, in professional practice, waste from overproduction is considered waste according to the Toyota Production System [
20]. Another way to classify waste is the 4M Ishikawa designation from 1950. The different types of waste are divided according to their origin: M = Man, M = Material, M = Machine, M = Method of work [
21]. It is also possible to meet 5M, where the fifth component is added, M = Mother nature (temperature, humidity, etc.).
According to [
22,
23,
24], it is important to know the consequences for the overall production when defining waste. Recognizable consequences of waste include unused machines, work in progress, high stocks, overloaded workers, high error rates, ineligible processes, hazardous work, work in non-ergonomic working positions and conditions, complex material flows, and constant slippages in the plan. As reported by [
25], production distinguishes two crucial dimensions of performance: quality and productivity. Productivity is then defined as the number of quality-compliant outputs produced per unit of each source (input) used. Quality is measured by the extent to which a product meets the specificities of its design. Continuously increasing productivity is one of the most important objectives of management. It is also one of the most difficult, as productivity means finding a balance between a variety of factors, few of which are easily defined or easily measurable [
26].
According to [
27,
28,
29], the company does not focus only on reducing costs, but on reducing time consumed in individual operations, while creating real and lasting market advantages. Based on [
30], companies find that by reducing the duration of individual operations, they reduce costs without further effort. Productivity could be characterized as a measure of the correctness of the use of resources in the production of a product. The basic factors that can be used to analyze productivity well and look for potential productivity improvements are:
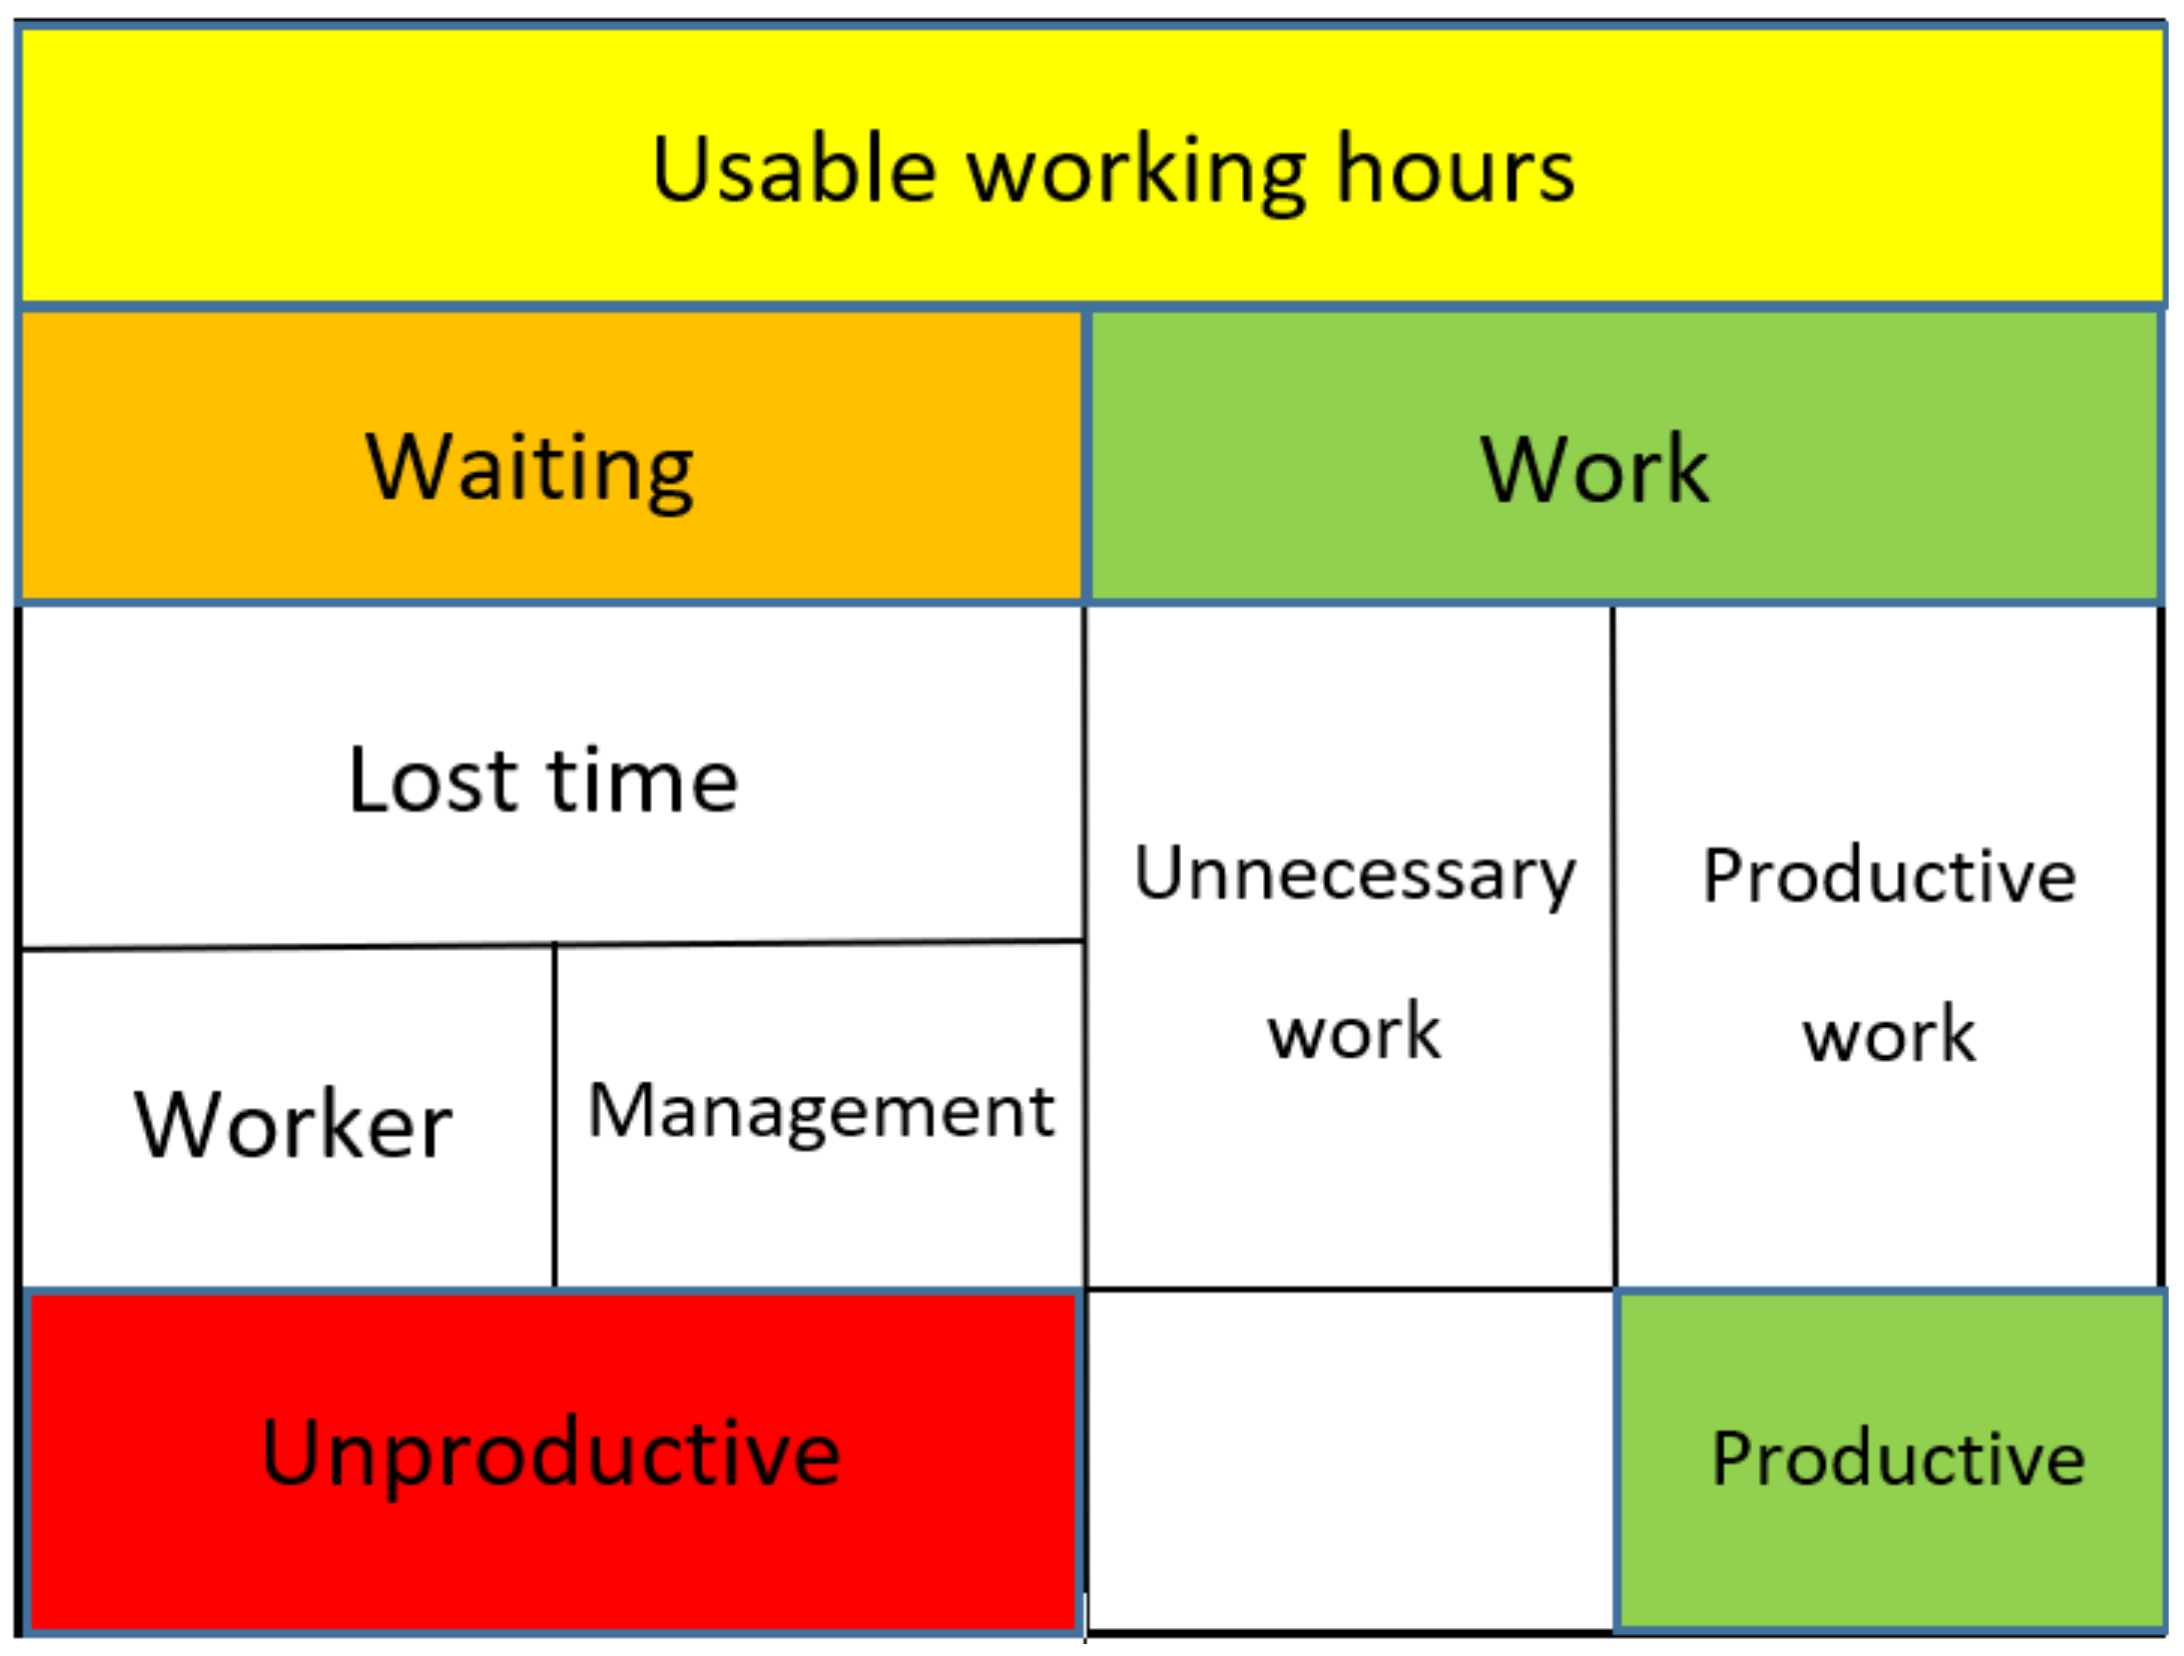
Utilization rate (U), which corresponds to the actual value of resources that are transformed into a product. To increase productivity, it is necessary to know the factors that contribute to the indicator. It is mainly the use of inputs, especially the use of working hours of the worker, usable time for machinery, and usability of the acquired material. Working time is the time for which the worker is paid. Waiting is caused, for example, by unnecessary breaks, but also by the organization of work. Working time consists of excess work that the worker should not perform in optimal condition (repairs of failures, bad technological procedure, etc.) and productive work. The role of management is to increase the share of productive work. The distribution of usable working time is shown in
Figure 1.
The usable work fund of the employee relates to his behavior. Losses are often the same as using labor, but larger losses are due to poor planning [
31]. When evaluating the utilization of the production capacity of production lines and evaluating their performance, the following are considered:
- 2.
Performance measure (P), which describes the speed and pace of transformation. The rate of performance is the speed and pace of work, and if the speed is higher, productivity will increase. This factor is mainly influenced by machines and workers [
32].
- 3.
Quality measure (Q), which records the accuracy and quality of the transformation. The level of quality is measured through various activities, which are summarized in the issue of “quality management”, which includes checking the conformity or non-conformity of products with defined patterns [
32].
- 4.
Methods level (M) presents the methods used in the transformation [
33]. Proper use of time leads to good performance and products that are of good quality, but if work is not done using productive working methods, the resulting productivity will be significantly lower than that which could be achieved [
32].
To express the effect of these factors affecting productivity, it is appropriate to use a mathematical relationship that is the product of them all. Total Productivity Index (TIP) is equal to:
It follows from this formula that when increasing productivity, no factor can be forgotten, because even an exceptional improvement of two factors will not attain the highest productivity.
The goal of all lean manufacturing methods and tools is to eliminate, or at least reduce, waste. In connection with the elimination of losses of the production process, three basic types of tools are used according to the waste management phase they are used in: (a) methods and tools in the analysis phase—standard analytical tools aimed at identifying waste in the process, (b) methods and tools in the phase elimination—aimed at achieving improvement of the current state, (c) methods and tools in the functionality phase—verification of the functionality of the proposed solution and maintaining a new state [
34]. Individual methods and tools for loss elimination can be focused on the analysis and measurement of work, balancing operations, standardization and visualization, ergonomics and economics of movements or modeling and simulation of processes.
The problem of achieving growth of productivity during production on assembly lines is related to balancing the elimination of waste. Scientists and experts have been working on the issue of balancing production and assembly lines for decades. According to [
35], the authors dealt with balancing assembly lines with different workplaces to minimize workstation costs. In solving the problem of waste, based on [
36], the authors place importance on reducing downtime in production, with an emphasis on meeting customer requirements and increasing product quality. As reported by [
37], the authors are also working to reduce the waste associated with a lean line balanced design. They identify waste at individual workplaces using time studies. The methodology for evaluating the performance of the assembly line workstation was proposed by [
38]. The goal is to achieve maximum performance in individual workplaces.
3. Materials and Methods
3.1. Description of the Production Process of Fire Dampers
Fire dampers belong to the components of building ventilation. Different types of fire dampers are produced according to size parameters. The research focused on six types of fire dampers, which are described in
Table 1. The main representative of the product was chosen fire throttle type FD 160×, due to its highest representation in production on the analyzed production line and overall, in the production program analyzed company.
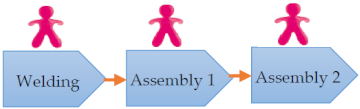
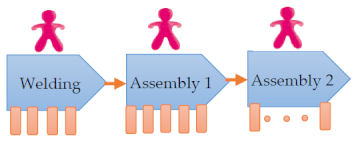
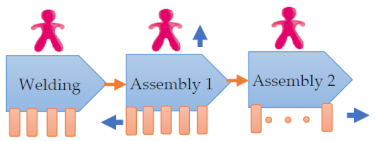
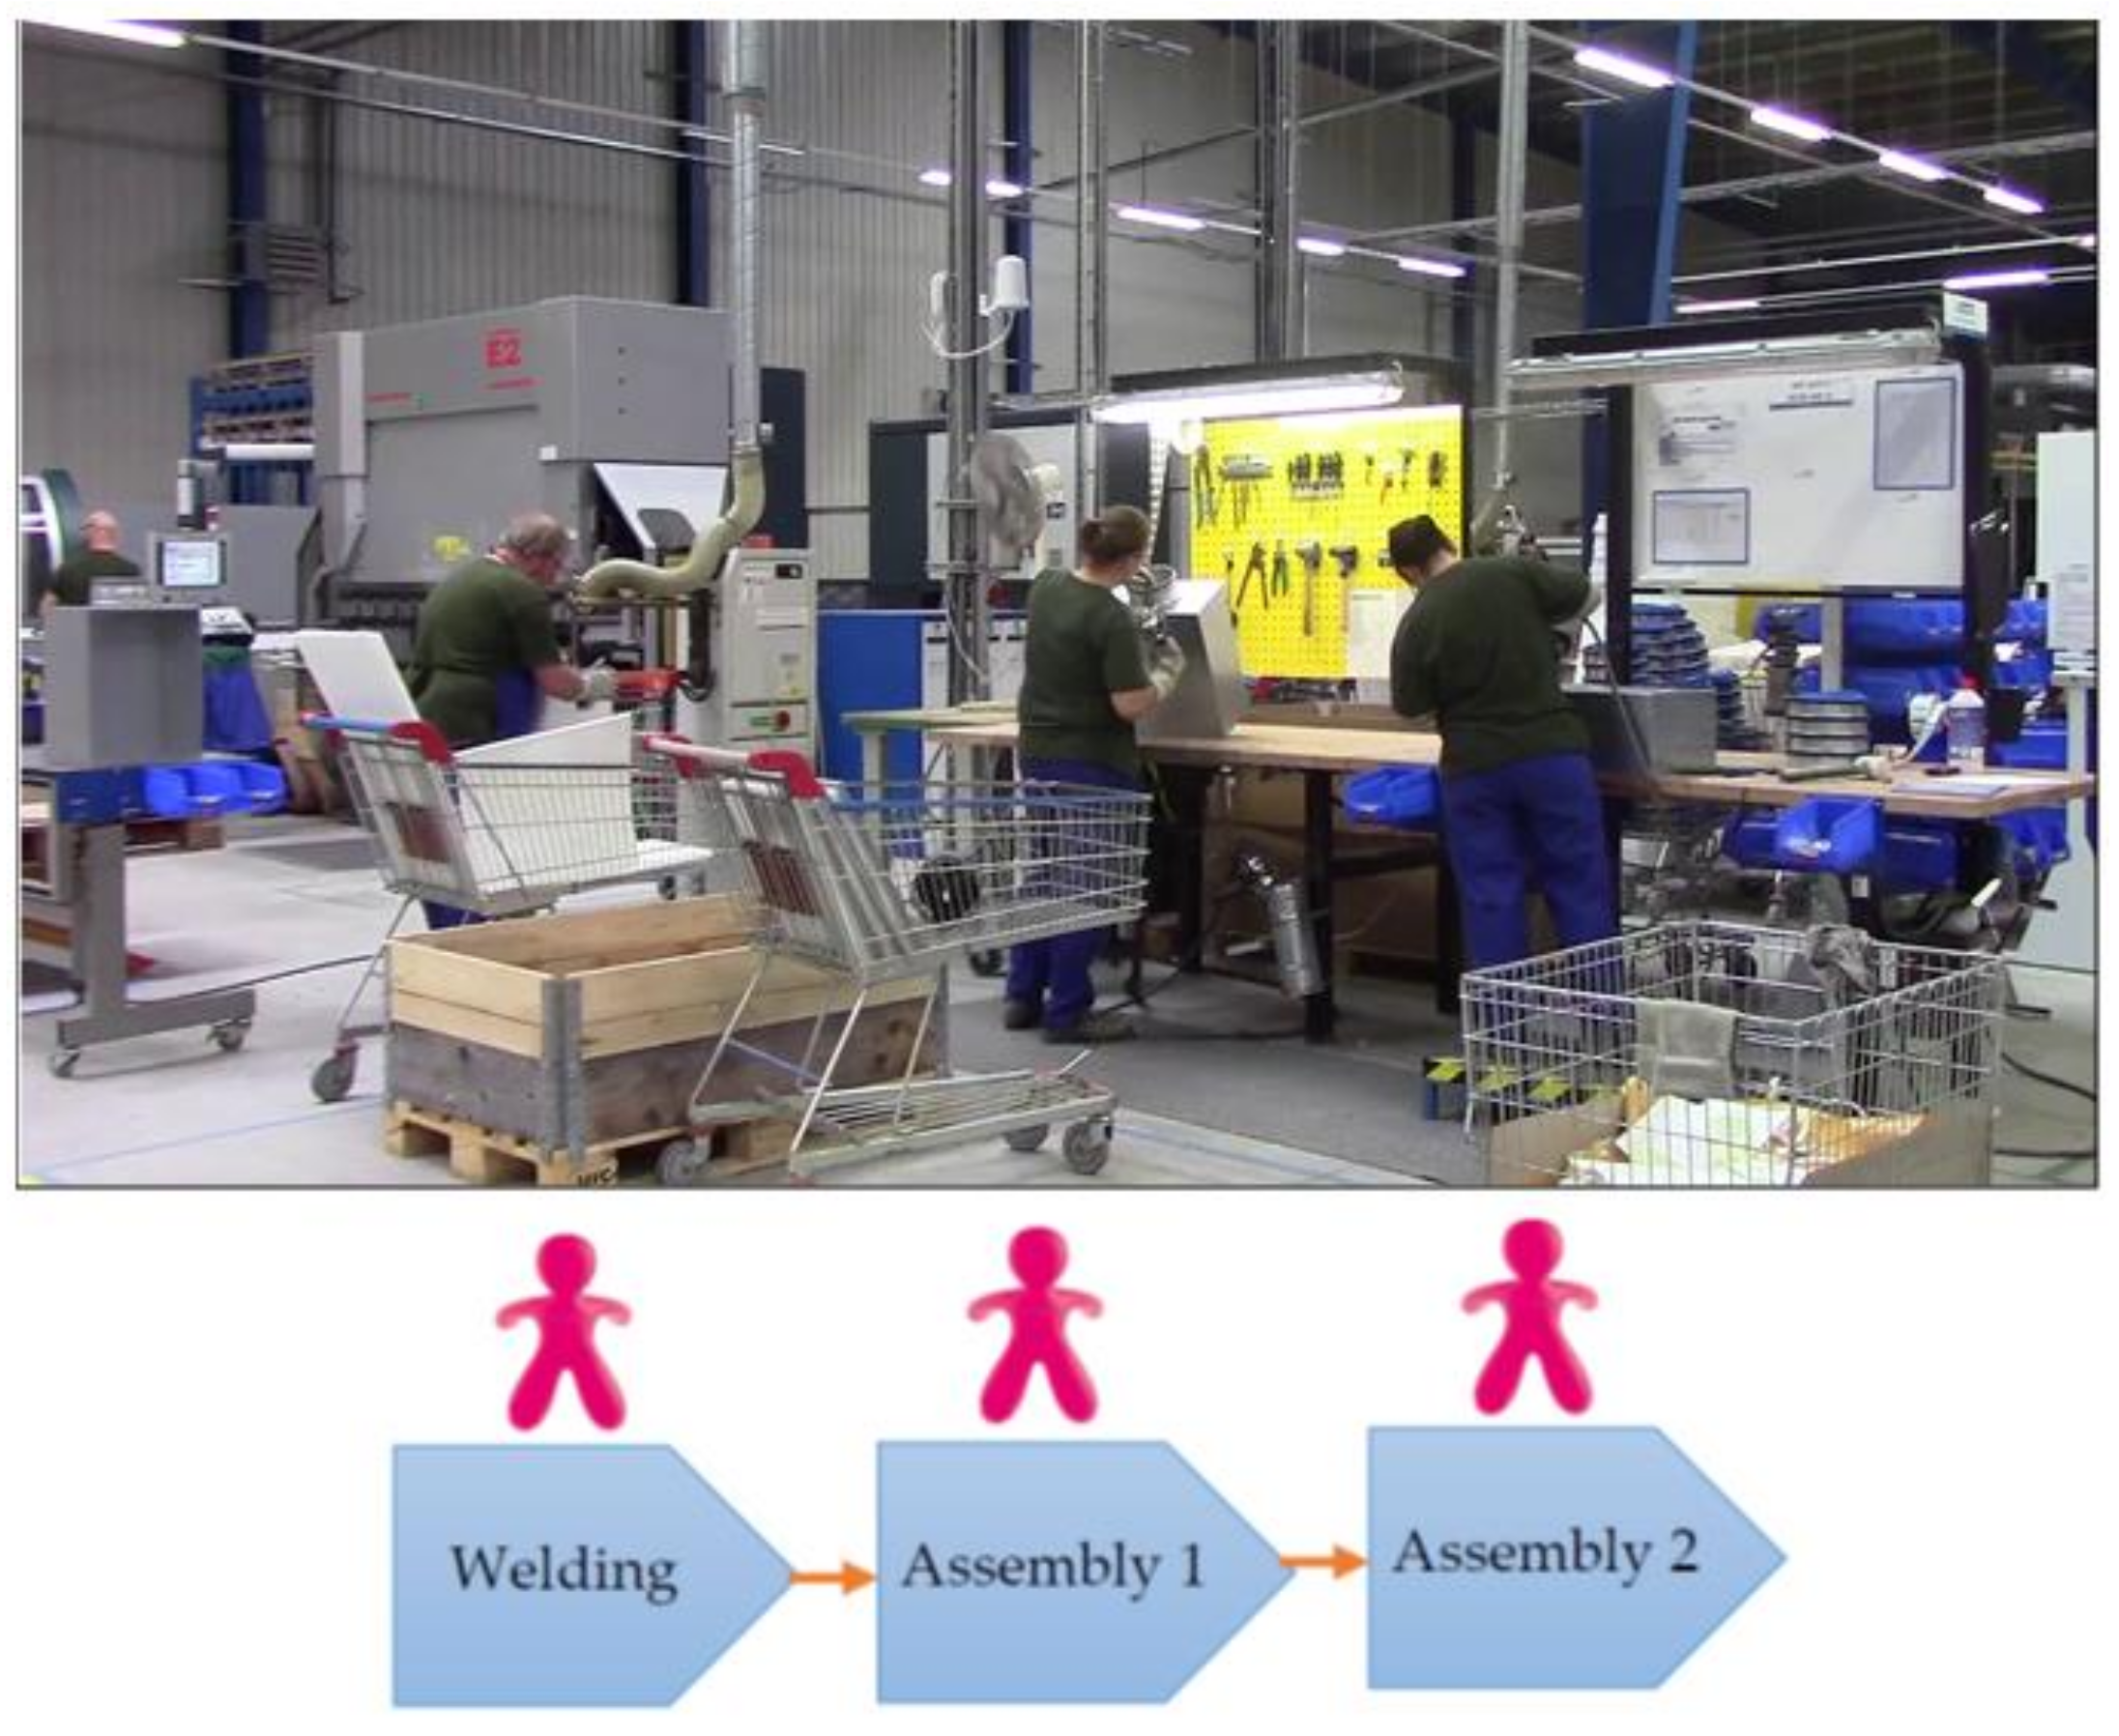
The production of fire dampers takes place on the production line in two shifts. Three workers work on each shift. Production is carried out at three sites, as shown in
Figure 2.
The first workplace is the Welding workplace, where the cut and bent sheet metal enters. At this workplace, one worker spot welds this sheet into a shape, the so-called box, using the spot welder TE 90 MARK II (Tecna, Bruxelles, Belgium). The two following workplaces are Assembly 1 and Assembly 2, where two workers work. At these workplaces, the box is sealed and assembled with other components. At the same time, quality control is performed. Finally, the box is placed on a pallet and is ready for shipment to the warehouse.
3.2. Identification of Waste on the Production Line
Techniques that directly measured time at the individual workplaces were used to identify waste on the production line; i.e. a snapshot of the operation and a snapshot of the individual’s working day. Repeated weekday slides were taken for analysis: In the workplace Welding—four times, in the workplace Assembly 1—three times, and in the workplace Assembly 2—three times.
For the analysis of waste, measurements of the onset of shifts were also performed, which were evaluated at two levels. First, the onset of the morning shift was evaluated (
Figure 3) once. It was found that the workers arrived at the workplace 2 min before the start of the work shift.
Second, the transmission of the morning shift to the afternoon shift was evaluated. The measurement was performed twice. It was found that the production line loses an average of 6 min in waiting for the end of the work shift, 5 min in checking after the start of a new work shift, and another 6 min in handling. Another finding was that work shifts do not leave work in progress.
By analyzing the data from the images for the working day schedule of individual positions and the start of shifts, the total waste on the production line for one year was determined (
Table 2).
The average waste on the production line was determined as the percentage of waste in the total working time of the worker during one shift. This is the average waste calculated for all three jobs. At the same time, the waste was expressed in terms of costs for the company. As a basis for calculating waste costs, the total hourly costs per employee were calculated, which are at the level of 10.50 EUR/h. The length of the work shift is set by the company at 430 min and the annual working time fund is set at 262.5 days. Waste accounts for an average of up to 29% of an employees working time, which represents an untapped potential for the production line and at the same time costs 34,370.46 EUR per year.
3.3. Methods of Cost Optimization and Production Process on the Production Line
Three management approaches were chosen to optimize costs and the processes on the production line making fire dampers. The first method was based on the count of the number of products produced on the line in one hour. The counts were repeated 30 times and the average value of the products made was calculated. Based on the count of finished products per hour, other indicators, costs, and time required for production were also calculated.
In the second and third methods, the individual workplaces were divided into operations. The duration of individual operations and workplaces were determined repeatedly. The hourly output of the production line, cycle time, and balance index was calculated. In the third approach, the balancing method of the existing production line was applied. To use this method, it is necessary to focus on the evaluation of:
- 5.
Hourly output, which represents the average number of products made on an entire production line per hour.
where:
—average number of products,
—number of production hours,
—clock order.
- 6.
Tact-time line, which indicates the average time required to produce one piece of product.
where:
—production time,
—number of pieces of products produced.
- 7.
Balance Index—the balance of operations on the line, which expresses the ratio of the second-longest production time of the workplace to the longest production time at the workplace of the production line.
where:
—the longest production time on the work line,
—the second longest production time on the work line.
As part of the comparison of individual approaches, labor costs per 1 piece of the manufactured product were also evaluated.
4. Results
Based on 30 counts of the number of products produced per hour, the average initial hourly output on the production line was calculated to be 19 pieces of products per hour (
Figure 4).
Based on the average initial hourly output for the production line, the initial clock-time of the line was calculated to be 189.47 s. The time bar represents the time required to produce one product. When an average of 19 products are produced per hour, which is 3600 s, then (3600 s/19 pcs) one product is produced in 189.47 s. The analysis of the measurement of the number of products produced per hour showed that the individual workplaces of the production line are unbalanced, i.e., each workplace on the production line is assigned a different workload. For this reason, it was necessary to divide the individual workplaces of the production line into sub-operations and analyze them in detail. For the purposes of analysis and acquisition of relevant data, 14 measurements of the duration of each operation, in seconds, were performed at each workplace. Due to the scale of the research, we present only conclusions.
At the Welding workplace, four operations were identified, namely chimney installation, chimney welding, side riveting and side welding. For each of these operations, the average starting time of the individual operations was calculated. By adding up the duration of the individual operations, we found the initial working time at the Welding workplace was 132.78 s. To this time, we must add the time required to clean the tip of the spot welder, which based on the images of working time, was determined to be 13% of the total production time of the Welding workplace, which was 19.92 s. The four welding operations took 132.78 s, which was 87% of the workplace working time. To calculate the total average production time at the Welding site, we added 15% of their production time to the four basic operations to find the final 100% production time for the Welding site. The total average starting production time at the Welding workplace was 152.70 s. The individual data are given in
Table 3.
The same procedure was applied at the other two workplaces. At the Assembly 1 workplace, five operations were identified, namely stickers including filing, sealing the chimney and interior, inserting the seal, fitting the flap and sealing the covers. The average initial duration of individual operations and the total initial time of work at the Assembly 1 workplace was 105.07 s. The data are shown in
Table 4.
At the Assembly 2 workplace, nine operations were identified, namely closing with a lid, riveting a lid, tapping rivets, affixing labels, checking the flap, fitting accessories, closing with two lids, affixing a QA label, and transferring to a box. The average starting time of individual operations and the total starting time of work at the Assembly 2 workplace was 121.00 s. The data are shown in
Table 5.
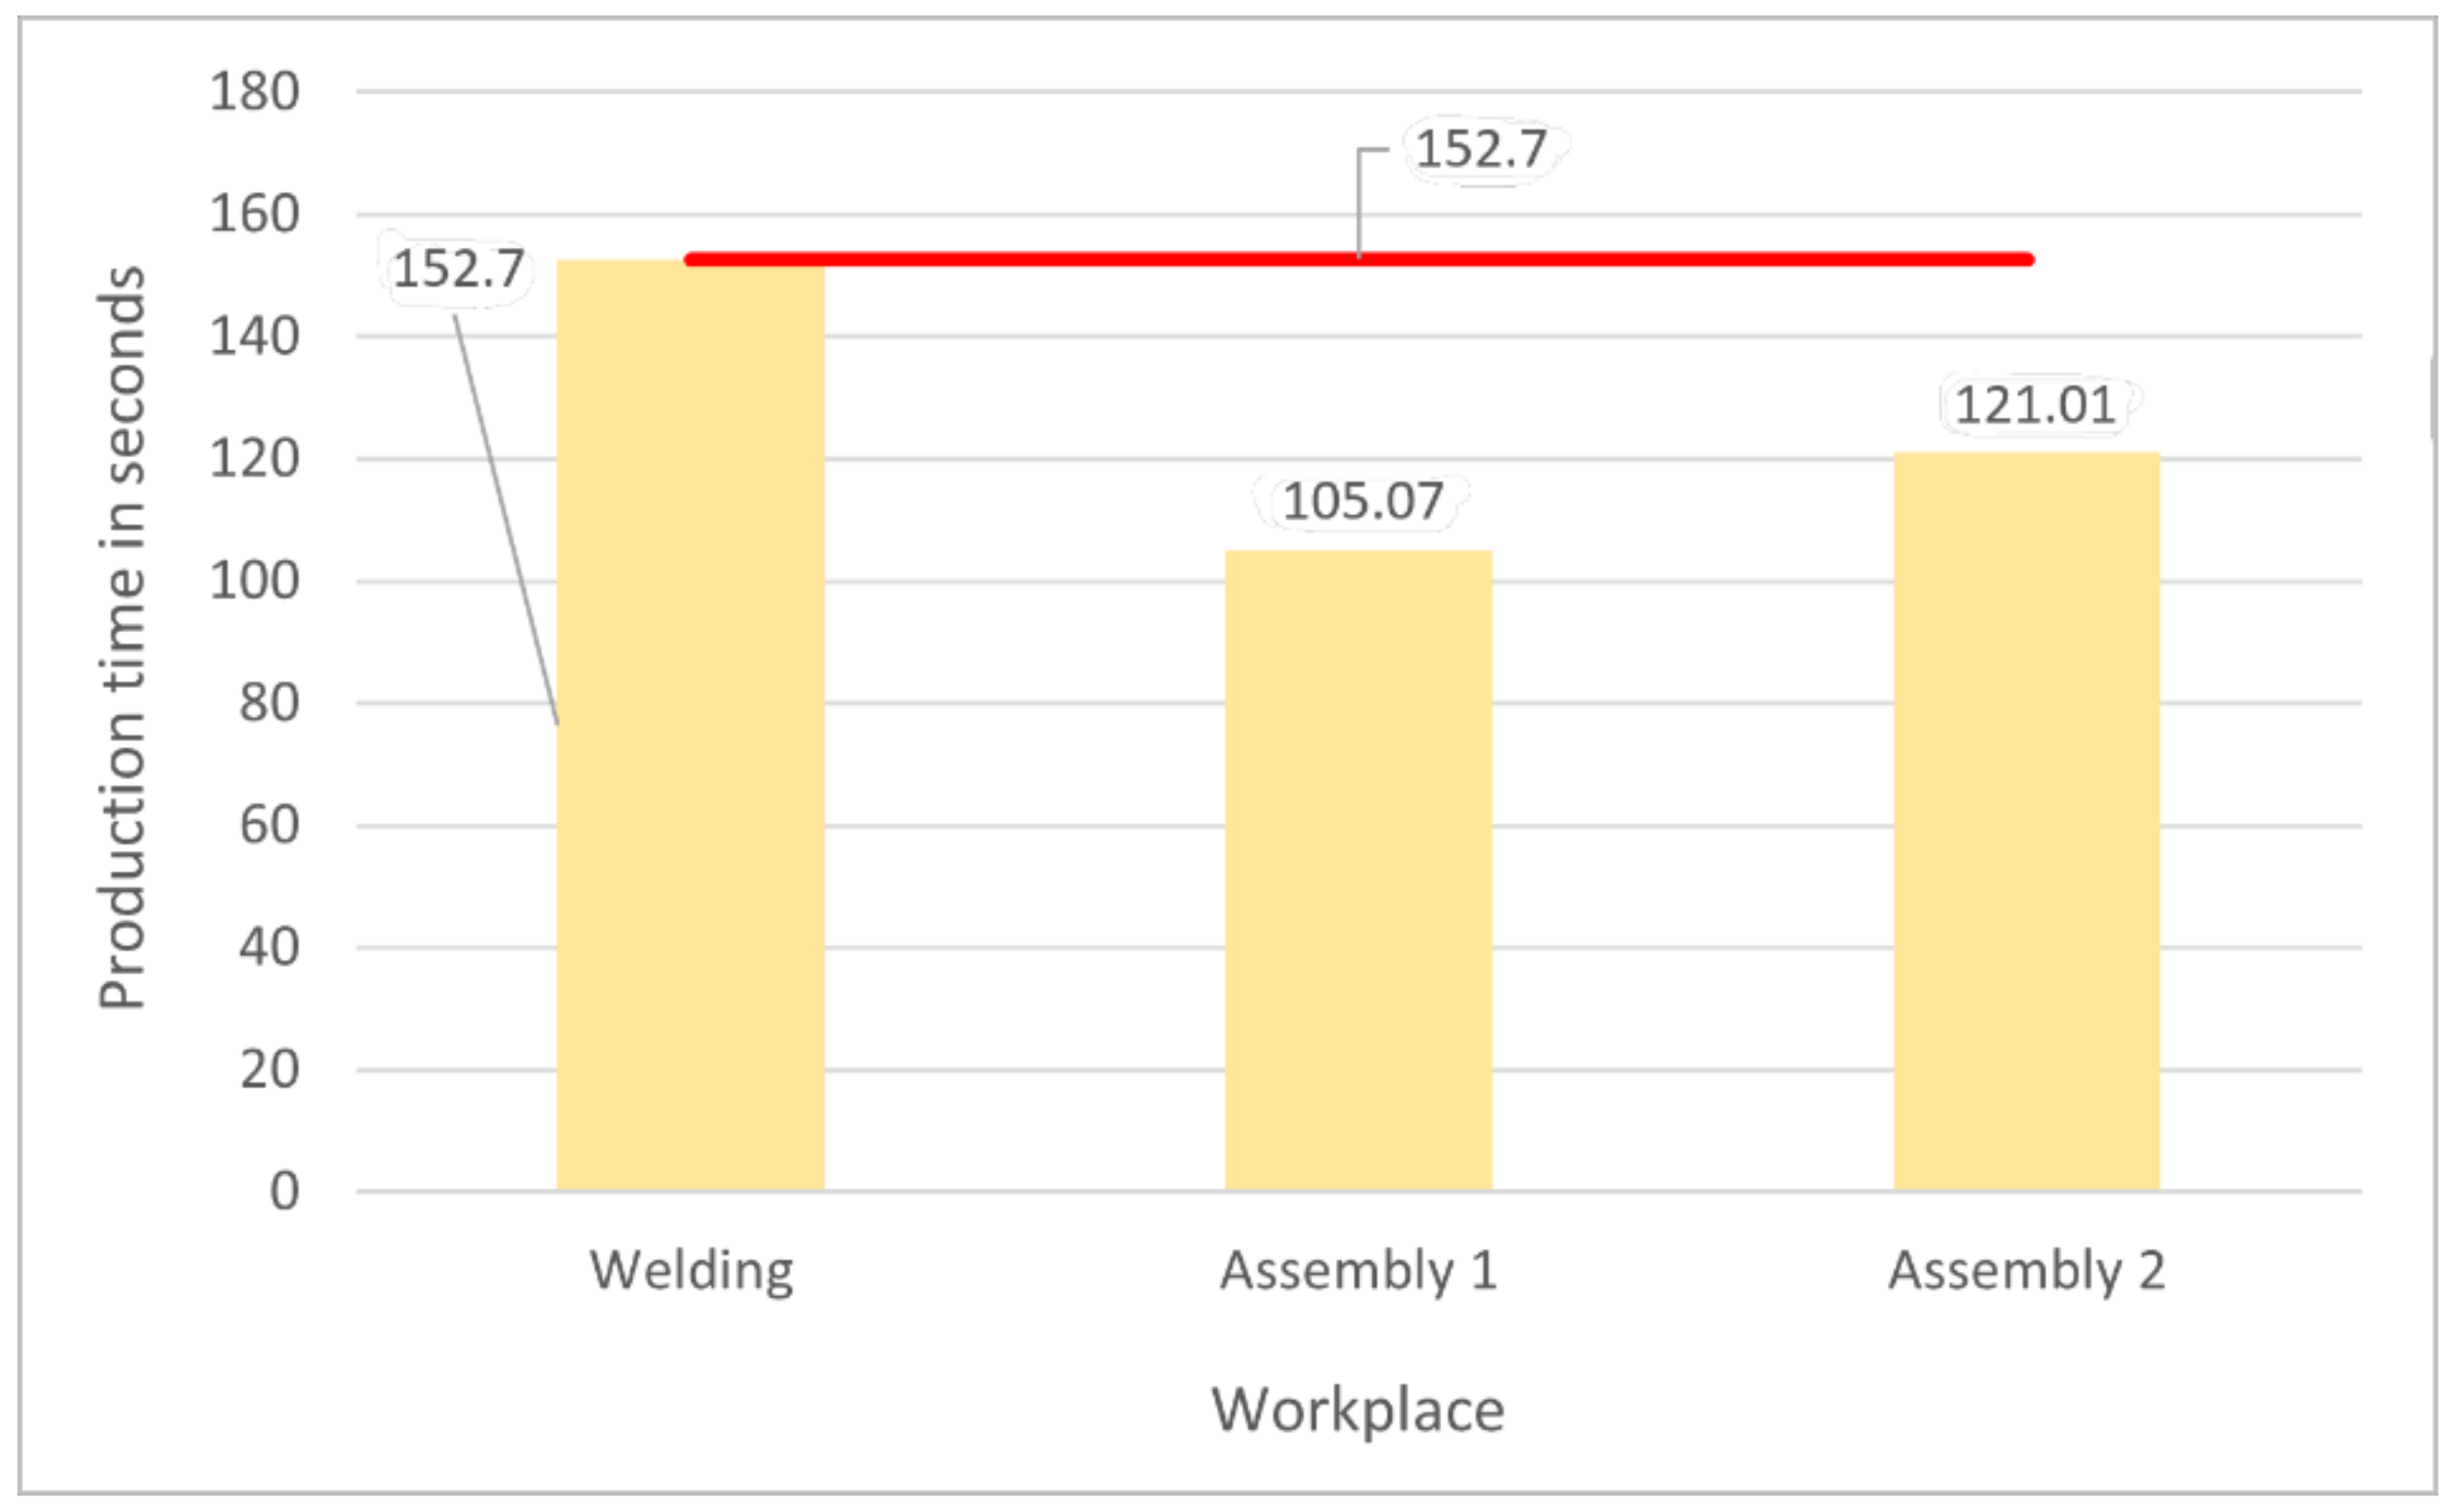
As the individual workplaces on the production line can also work in parallel, to use the method of balancing activities across individual workplaces, it was necessary to determine the workload of individual workplaces and determine which had the highest. Based on the analysis of the duration of individual operations in the production line workplaces, the initial state of work and balance of the production line workplaces was determined, see
Figure 5. The highest workload was found at the Welding workplace at 152.7 s per product.
The workload of the Welding workplace limits the other two workplaces, whose workload is lower, and therefore these workplaces have downtime associated with waiting for semi-finished products to be delivered from the Welding workplace. The calculated workplace balance index is at the level of 79.24%. After a more detailed analysis of individual operations at the workplaces, the timeline clock was calculated, i.e., the time required to produce one product to 152.7 s. The time cycle is given by the duration of all operations at the Welding workplace, which has the highest workload on the production line. At a clock time of 152.7 s, 23.58 pieces of the product are produced per hour on the production line.
In the next step, after the analysis of individual operations, the individual operations at all workplaces were balanced at the level of 79.24%. When balancing workplaces, attention was focused on the Welding workplace, which had the highest workload and needed to be reduced.
First, we tried to solve the problem of cleaning the tip of the spot welder, which accounted for 13% of the total working time at the Welding workplace and added another 15% to the total production time for the Welding workplace. During the measurement, it was observed that an employee in the Welding workplace devotes an average of 13% of the entire work shift to adjusting the tip of the spot welder. This represented up to 0.93 h (55.8 min) per shift. The proposed solution to this waste was to replace the tip with a NITRODETM tip. This tip achieves better connections and does not clog as quickly. Measurements have shown that with a classic tip, it is necessary to grind the tip after every hundred joints. Grinding of NITRODETM tips is required after three hundred joints. This eliminates the time required to clean the tip by two thirds, i.e., from 13% to 4.3% of the production time of the Welding workplace. It was possible to save 0.62 h (37.2 min) per work shift and the annual savings amount to 3417.75 EUR.
The next step was to analyze the possibility for employees from the Assembly 1 and Assembly 2 workplaces to assist in selected operations at the Welding Workplace. As part of the balancing between the workplaces, a 15 s help from the Assembly 1 workplace at the Welding workplace was proposed, which would reduce the duration of the Welding operation from the original 152.7 s to the new 124.42 s (
Table 6).
Workplace Assembly 1 will increase the workload by 15 s, by helping at the Welding workplace (
Table 7).
The Labeling operation was transferred from the Assembly 2 workplace to a worker outside the production line, who is a manipulator that has free work capacity (
Table 8).
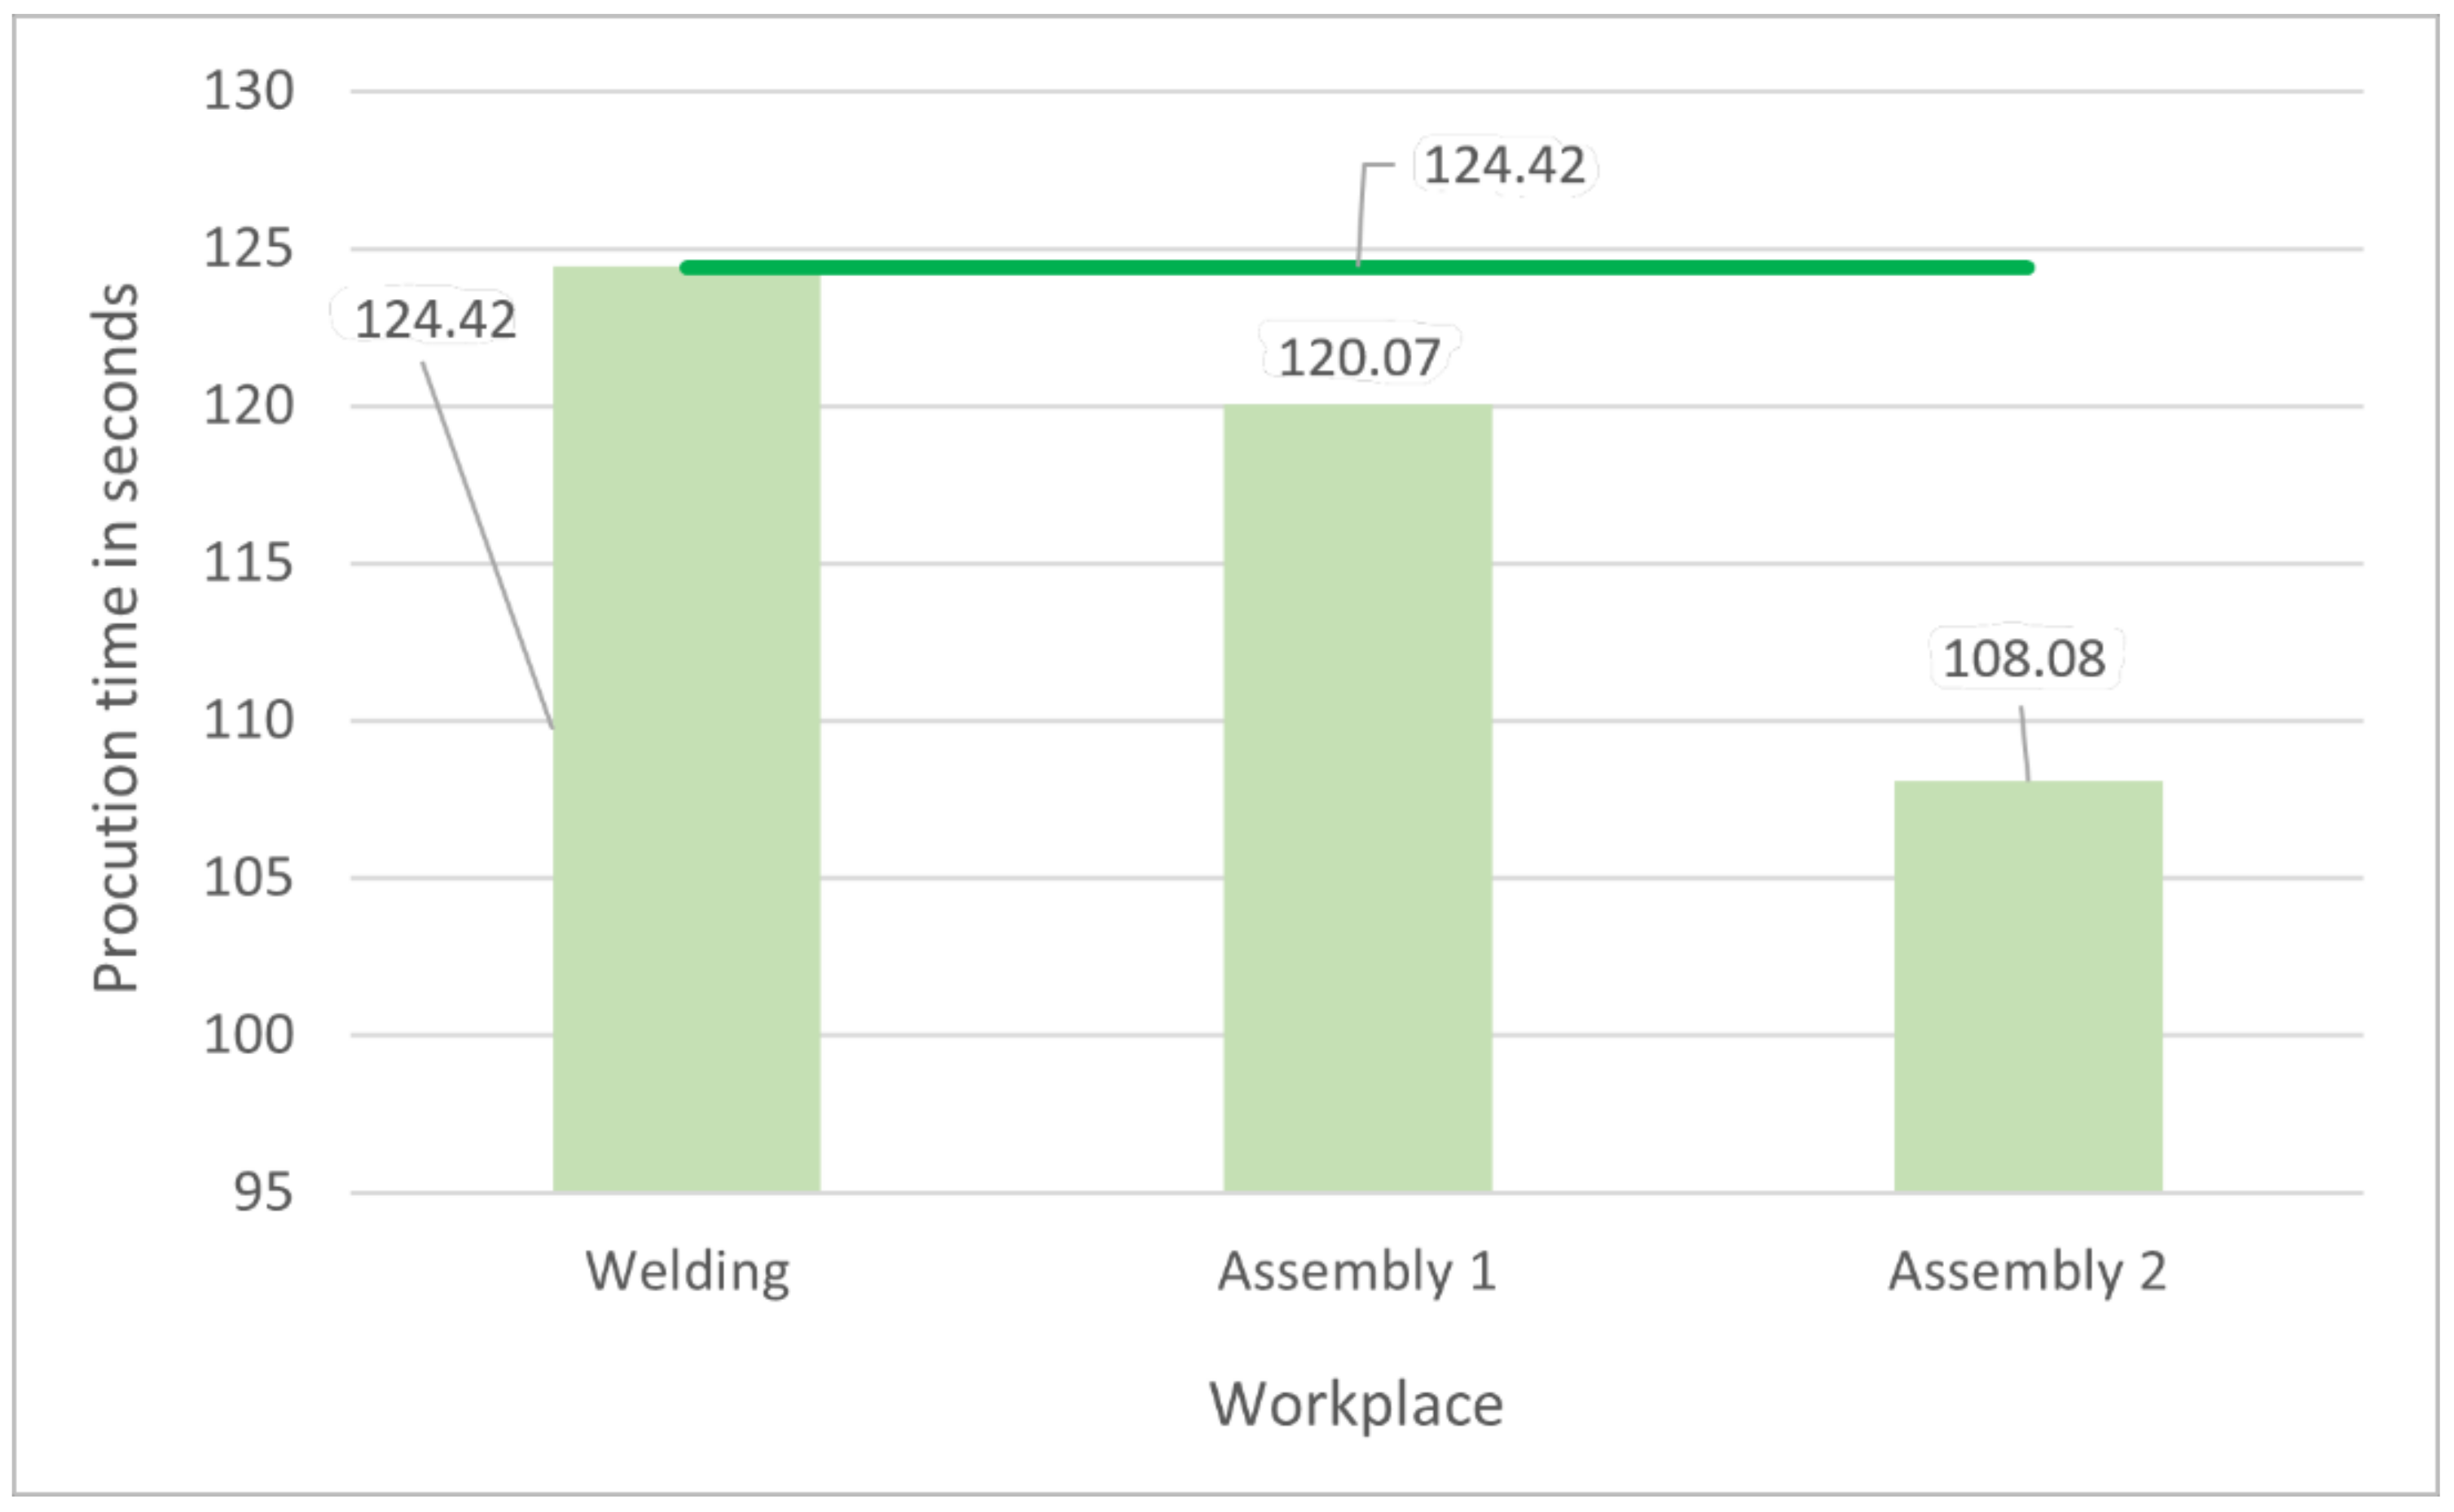
Based on the balancing of individual operations at all three workplaces of the production line, the total duration of activity at the workplaces was adjusted and their clock time was changed. The proposed balancing of individual operations between workplaces is shown in
Figure 6.
The proposed adjustments to the duration of activities at the individual workplaces were also reflected in the increase in the value of the balance index to a level of 96.50%. The production line time has been reduced from 152.7 s to 124.42 s by balancing, which leads to an increase in the line’s hourly production. The number of products produced on the production line per hour increased from 23.67 before balancing to 28.93 pieces.
5. Discussion
According to the use of several methods of industrial engineering in the fields of ergonomics, technical and economic analysis and production management, different approaches were used to manage the course and productivity of the production line. The results obtained using the different approaches in production line management are summarized in
Table 9. The individual possibilities and results of production management are defined based on selected indicators, namely hourly output, timeline cycle and the like, which are described in the Methods (
Section 3.3).
The first method used to manage the production line belongs to the field of ergonomics. The methods of counting the number of products produced per hour and analyses of images of the working day schedules were used, from which the average hourly output of the production line was calculated to be 19 pieces of product. The tact time was 189.47 s. In this case, there was extensive waste, which was also identified in the initial state of operation for all production line workplaces. There was downtime, the activity of workplaces was not harmonized, and workplaces Assembly 1 and Assembly 2 waited for the outputs from the workplace Welding, which had the most work. Each shift completed all products, so there were no unfinished products that the next shift could work on. Much of the waste was generated by the need to adjust the tip of the spot welder: this accounted for 13% of work time, representing 55.8 min out of 430 min of shift work.
In the second method of production line management, technical and economic analyzes of individual operations were used, into which the activities of the three workplaces were divided. The input data for determining the duration of individual operations were again obtained based on more detailed images of the working day schedule, which were then analyzed and statistically processed. The analysis of the duration of individual operations determined the duration of activity at individual workplaces. The Welding workplace had the greatest workload with the amount of 152.70 s, which also represents the time cycle of the entire production line. By shortening the clock time by 36.77 s, the total hourly output of the production line increased by 4.67 pieces of product. The production line balance index is 79.24%.
In the third production line management method, balancing the production line was used. Priority was given to the activities at the Welding Workplace, which had the highest workload and determined the clock time of the entire production line. First, the 13% waste of working time in the workplace Welding caused by the need to clean the tip of the spot welder was solved.
To compare the state, which was determined by the count of the number of completed products, after the analysis of operations of individual workplaces and after balancing operations, it was necessary to calculate the cost per piece produced for each possible solution. It was proposed to replace the tip of the tip with another, which reduced waste from 13% to 4.33%, which ultimately saved 37.2 min per shift, which will save 3417.75 EUR in labor costs per year. Furthermore, a 15 s time allowance was proposed to be transferred from the Assembly 1 workplace to the Welding workplace. All these proposed modifications reduced the production line’s time cycle to 124.42 s and increased the production line’s total hourly output to 28.93 pieces of product. The balance index reached 96.50%.
The total increase in production line output compared to the initial state increased by 9.93 pieces of product, or by 52.26%. The production line time was shortened by 65.05 s. Overall, a higher work balance was achieved between the individual workplaces of the production line. To compare methods of product line management, it was also necessary to evaluate them economically. In evaluating the economic parameters, we focused on the number of labor costs attributable to the production of one piece of product.
Table 10 shows a baseline with an hourly production output of 19 pieces/hour. The wage cost per product is 1.66 EUR.
Table 11 shows the solution after a detailed analysis of individual workplace operations. The hourly output of the production line was 23.67 pieces/hour. The wage cost per piece was 1.33 EUR.
Balancing the operations of individual production line workplaces increased the total production line output from 19 to 28.93 pieces per hour, and at the same time, the labor costs per product decreased from 1.66 to 1.09 EUR, which is a decrease of 0.57 EUR per piece, or a decrease of 34.34% (
Table 12).
Based on the comparison of the selected production line management approaches, it was revealed that the most suitable approach for the production lines to produce fire dampers of the FD type was the balancing method. Using this method, the best technical and economic results for the production line were achieved.
6. Conclusions
Businesses deal with issues of waste in production quite often. In this article, we focused on a specific production line that produces fire dampers of the FD 160× type pulley for analysis. From the taken images of the working day schedule of individual employees at the Welders, Assembly 1 and Assembly 2 workplaces, a waste of 29% of working time per employee was found and quantified, which for the whole year amounts to a waste of 34,370.46 EUR. These are basically unused labor costs. A substantial part of the waste was caused by grinding the tip of the spot welder. It accounted for an average of up to 13% of the entire welder’s work shift. By replacing the tip with a better one, the NITRODETM brand, the time needed to clean the tip was reduced by two-thirds, which represented a saving of 37.2 min per shift. In annual terms, 3417.35 EUR in labor costs was saved.
The contribution of this article is a comparison of the results achieved using different approaches to production management and the elimination of waste on a production line. The results of the research and the proposed mitigation measures were applied in practice. The research used methods of industrial engineering in the fields of technical and economic analysis, ergonomics, and production management.
Author Contributions
Conceptualization, J.K. and L.L.; data curation, A.S.; formal analysis, A.S. and L.L.; funding acquisition, M.K.; investigation, J.K., M.K. and L.L.; methodology, J.K.; project administration, A.S.; resources, K.T.; software, K.T.; supervision, M.K. and L.L.; validation, M.K.; writing—original draft, J.K.; writing—review and editing, K.T., A.S. and L.L. All authors have read and agreed to the published version of the manuscript.
Funding
This research received no external funding.
Institutional Review Board Statement
Not applicable.
Informed Consent Statement
Not applicable.
Data Availability Statement
Data sharing is not applicable to this article.
Acknowledgments
This paper was developed within the implementation of the projects: KEGA 009TUKE-4/2020 “Transfer of Digitization into Education in the Study Program Business Management and Economics”, and VEGA 1/0340/21 “The impact of a pandemic and the subsequent economic crisis on the development of digitization of enterprises and society in Slovakia”. This work was supported by the Slovak Research and Development Agency under Contract no. APVV-19-0418 “Intelligent solutions to enhance business innovation capability in the process of transforming them into smart businesses”.
Conflicts of Interest
The authors declare no conflict of interest.
References
- Hoover, H. Losses in Industrial Production; Masaryk Academy of Labor: Prague, Czech Republic, 1922. [Google Scholar]
- Janda, B. Encyklopedie Výkonnosti, Zväzok Druhý: Production; Masaryk Academy of Labor: Prague, Czech Republic, 1932. [Google Scholar]
- Liker, J.K. Tak to Dělá Toyota 14 Zásad Řízení Největšího Světového Výrobce; Management Press: Prague, Czech Republic, 2008; ISBN 978-80-7261-173-7. [Google Scholar]
- Wan, H.; Chen, F.F. Decision Support for Lean Practitioners: A Web-based Adaptive Assessment Approach. Comput. Ind. 2009, 60, 277–283. [Google Scholar] [CrossRef]
- Becker, C.; Scholl, A. Balancing assembly lines with variable parallel workplaces: Problem definition and effective solution procedure. Eur. J. Oper. Res. 2009, 199, 359–374. [Google Scholar] [CrossRef]
- Imai, M. Kaizen: Metoda, Jak Zavést Úspornejší a Flexibilnejší Výrobu v Podniku. 1. Vyd; Computer Press, a. s.: Brno, Czech Republic, 2008; p. 272. ISBN 978-1-4398-3853-2. [Google Scholar]
- Womack, J.P.; Jones, D.T. Lean Thinking–Banish Waste and Create Wealth in Your Corporation, 2nd ed.; Free Press: New York, NY, USA, 2003. [Google Scholar]
- Burieta, J.; Kakačka, S. Simulácia výrobných a logistických procesov. In Úspěch–Produktivita a Inovace v Souvislostech; API—Akademie produktivity a inovací: Slaný, Czech Republic, 2007; Volume 4, pp. 15–18. ISSN 1803-5183. [Google Scholar]
- Meng, W.; Zhang, X. Optimization of Remanufacturing Disassembly Line Balance Considering Multiple Failures and Material Hazards. Sustainability 2020, 12, 7318. [Google Scholar] [CrossRef]
- Košturiak, J.; Frolík, Z. A Kol.: Štíhly a Inovatívny Podnik; Alfa Publishing: Prague, Czech Republic, 2006; p. 240. ISBN 80-86851-38-9. [Google Scholar]
- Debnár, P. Základní stavební kameny a principy štíhleho podniku. In Úspech–Produktivita a Inovace v Souvislostech; API—Akademie produktivity a inovací: Slaný, Czech Republic, 2009; Volume 1, pp. 6–8. ISSN 1803-5183. [Google Scholar]
- Lean Enterprise Institute. Lean Lexicon; Lean Enterprise Institute, Inc.: Boston, MA, USA, 2014; ISBN 10-0-9667843-6-7. [Google Scholar]
- Blackburn, J.D. Závod s Časem; Victoria Publishing: Prague, Czech Republic, 1994; ISBN 80-85605-34-1. [Google Scholar]
- Liker, J.K. Becoming Lean; Free Press: New York, NY, USA, 1996. [Google Scholar]
- Marodin, G.A.; Frank, A.G.; Tortorella, G.L.; Fetterman, D.C. Lean Production and Operational Performance in the Brazilian Automotive Supply Chain. Total. Qual. Manag. Bus. Excell. 2017, 30, 370–385. [Google Scholar] [CrossRef]
- Rother, M. Learning to See; Lean Enterprise Institute: Boston, MA, USA, 1999; ISBN 0966784308. [Google Scholar]
- Mo, J.P.T. The Role of Lean in the Application of Information Technology to Manufacturing. Comput. Ind. 2009, 60, 266–276. [Google Scholar] [CrossRef]
- Maurizio, F.; Ferrari, E.; Mauro, G.; Pilati, F. Human Factor Analyser for work measurement of manual manufacturing and assembly processes. Int. J. Adv. Manuf. Technol. 2019, 103, 861–877. [Google Scholar] [CrossRef]
- Womack, J.P.; Jones, D.T.; Ross, D. The Machine That Changed the World; Rawcon Associates: New York, NY, USA, 1990. [Google Scholar]
- Jolai, F.; Rezaee, M.J.; Vazifeh, A. Multi-criteria decision making for assembly line balancing. J. Intell. Manuf. 2009, 20, 113–121. [Google Scholar] [CrossRef]
- Košturiak, J.; Gregor, M. Jak Zvyšovat Produktivitu Firmy; inFORM, 1 sv (různé stránkování): Žilina, Slovakia, 2002; ISBN 8096858319. [Google Scholar]
- Gregorovičová, L. Nástroj pro identifikaci plýtvání: Mapovaní toku hodnot (Value Stream Mapping) 1. čásť. In Úspěch: Produktivita a Inovace v Souvislostech: Časopis pro Úspěšné Manažéry; API: Želevčice, Czech Republic, 2009; Volume 4, ISSN 1803-5183. [Google Scholar]
- Mašín, I.; Vytlačil, M. Nové Cesty k Vyšší Produktivitě: Metody Průmyslového Inženýrství; Institut Průmyslového Inženýrství: Liberec, Czech Republic, 2000; ISBN 80-902235-6-7. [Google Scholar]
- Tuček, D.; Bobák, R. Výrobní Systémy. Vyd. 2. upr; Univerzita Tomáše Bati ve Zlíně: Zlín, Czech Republic, 2009; ISBN 8073183811. [Google Scholar]
- Vacík, E. Současné nástroje pro měření, sledování a řizení výkonnosti spoločností. In Economic a Management; Technická univerzita v Liberci: Liberec, Czech Republic, 2004; Volume 7, pp. 61–67. ISSN 1212-369. [Google Scholar]
- Emde, S.; Boysen, N.; Scholl, A. Balancing mixed-model assembly lines: A computational evaluation of objectives to smoothen workload. Int. J. Prod. Res. 2010, 48, 3173–3191. [Google Scholar] [CrossRef] [Green Version]
- Košturiak, J. Procesné Audity, Meranie Podnikových Potenciálov a Podnikové Ukazovatele. Available online: http://www.ipaslovakia.sk/UserFiles/File/ZL/Procesne%20audity%20a%20podnikove%20ukazovatele.pdf (accessed on 7 November 2021).
- Kováč, J.; Mihok, J. Priemyselné Inžinierstvo; TU: Košice, Slovakia, 2013; ISBN 978-80-553-0806-7. [Google Scholar]
- Drucker, P. Výzvy Managementu po 21. Století; Management Press: Prague, Czech Republic, 1999; ISBN 80-7261-021-X. [Google Scholar]
- Bartholdi, J.J. Balancing two-sided assembly lines: A case study. Int. J. Prod. Res. 1993, 31, 2447–2461. [Google Scholar] [CrossRef]
- Simboli, A.; Taddeo, R.; Morgante, A. Value and Wastes in Manufacturing: An Overview and a New Perspective Based on Eco-Efficiency. Adm. Sci. 2014, 4, 173–191. [Google Scholar] [CrossRef]
- Hayes, R.H. Dynamická Výroba; Victoria Publishing: Prague, Czech Republic, 1993; ISBN 80-85605-20-1. [Google Scholar]
- Mašín, I.; Vytlačil, M. Cesty k Vyšší Produktivitě; Alfa Publishing: Prague, Czech Republic, 1996; ISBN 80-902235-0-8. [Google Scholar]
- Tangen, S. Performance measurement: From philosophy to practice. Int. J. Product. Perform. Manag. 2004, 53, 726–737. [Google Scholar] [CrossRef]
- Nicosia, G.; Pacciarelli, D.; Pacifici, A. Optimally balancing assembly lines with different workstations. Discret. Appl. Math. 2002, 118, 99–113. [Google Scholar] [CrossRef]
- Pilati, F.; Ferrari, E.; Gamberi, M.; Margelli, S. Multi-Manned Assembly Line Balancing: Workforce Synchronization for Big Data Sets through Simulated Annealing. Appl. Sci. 2021, 11, 2523. [Google Scholar] [CrossRef]
- Fansuri, A.F.H.; Rose, A.N.M.; Ab Rashid, M.F.F.; Nik, N.M.; Ahmad, H. Productivity Improvement Through Line Balancing at Electronic Company-Case Study. In IOP Conference Series-Materials Science and Engineering; IOP Publishing Ltd.: Kuala Lumpur, Malaysia, 2018; Volume 409, p. 012015. [Google Scholar] [CrossRef]
- Goncalves, M.T.; Salonitis, K. Lean assessment tool for workstation design of assembly lines. Procedia CIRP 2017, 60, 386–391. [Google Scholar] [CrossRef]
Figure 1.
Usable working time structure.
Figure 1.
Usable working time structure.
Figure 2.
Production of fire dampers on the production line.
Figure 2.
Production of fire dampers on the production line.
Figure 3.
The start of the morning work shift.
Figure 3.
The start of the morning work shift.
Figure 4.
Average initial hourly output of the production line.
Figure 4.
Average initial hourly output of the production line.
Figure 5.
Baseline state of work and balance of production line workplaces after the analysis of operations.
Figure 5.
Baseline state of work and balance of production line workplaces after the analysis of operations.
Figure 6.
Proposed balance of production times of production line workplaces.
Figure 6.
Proposed balance of production times of production line workplaces.
Table 1.
Selection of the main representative of the production of fire damper.
Table 1.
Selection of the main representative of the production of fire damper.
| Indicator | Unit | Fire Damper Type FD | Together |
|---|
| 100× | 125× | 160× | 200× | 250× | 315× |
|---|
| Production volume | p/year | 8647 | 22,616 | 28,046 | 18,777 | 9522 | 3237 | 90,845 |
| Share in the production of all FD | % | 10 | 25 | 31 | 20 | 10 | 4 | 100 |
| Share in the total production of the company | % | 5 | 14 | 17 | 11 | 6 | 2 | 55 |
Table 2.
Quantification of waste on the production line.
Table 2.
Quantification of waste on the production line.
| Reason for the Waste | Average Waste per Worker in % of Working Time | Waste Costs |
|---|
Cost per Worker
During One Shift | Annual Waste on the Production Line |
|---|
| Waiting | 11% | 8.28 € | 13,037,07 € |
| Outside the workplace | 4% | 3.01 € | 4740.75 € |
| Personal talk | 2% | 1.51 € | 2370.38 € |
| Overwork | 5% | 3.76 € | 5925.94 € |
| No plan | 7% | 5.27 € | 8296.32 € |
| Together | 29% | 21.82 € | 34,370.46 € |
Table 3.
Average starting production time (seconds) at the workplace Welding.
Table 3.
Average starting production time (seconds) at the workplace Welding.
| Workplace | Welding |
|---|
| Additional activity | Tip cleaning 15%,
19.92 |
| Operation | Chimney installation | Chimney welding | Side riveting | Sidewall welding |
| Duration of activity in seconds | 15.21 | 24.43 | 43.07 | 50.07 |
| Average starting production time at the workplace | 152.70 |
Table 4.
Average initial production time (seconds) at the workplace Assembly 1.
Table 4.
Average initial production time (seconds) at the workplace Assembly 1.
| Workplace | Assembly 1 |
|---|
| Operation | Filing stickers | Chimney sealing | Insert the seal | Flap installation | Sealing the cover |
| Duration of activity in seconds | 13.43 | 35.71 | 17.29 | 20.50 | 18.14 |
| Average starting production time at the workplace | 105.07 |
Table 5.
Average initial production time (seconds) at the workplace Assembly 2.
Table 5.
Average initial production time (seconds) at the workplace Assembly 2.
| Workplace | Assembly 2 |
|---|
| Operation | Closing the lid | Lid riveting | Knocking the lid | Labeling | Flap inspection | Inserting accessories | Closing with 2 lids | Affixing the QA label | Transfer to the box |
| Duration of activity in seconds | 10.93 | 33.86 | 12.21 | 12.93 | 19.79 | 3.86 | 15.00 | 3.43 | 9.00 |
| Average starting production time at the workplace | 121.01 |
Table 6.
Average balanced total production time at the Welding workplace.
Table 6.
Average balanced total production time at the Welding workplace.
| Workplace | Welding |
|---|
| Operation | Tip cleaning 15%,
19.92 |
| Proposed modification | −13.28 |
| Operation | Chimney installation | Chimney welding | Side riveting | Sidewall welding |
| Duration of activity in seconds | 15.21 | 24.43 | 43.07 | 50.07 |
| Proposed modification | | | −15.00 | |
| Average balanced total production time at the workplace | 124.42 |
Table 7.
Average balanced total production time at the workplace Assembly 1.
Table 7.
Average balanced total production time at the workplace Assembly 1.
| Workplace | Assembly 1 |
|---|
| Operation | Filing stickers | Chimney sealing | Insert the seal | Flap installation | Sealing the cover |
| Duration of activity in seconds | 13.43 | 35.71 | 17.29 | 20.50 | 18.14 |
| Proposed modification | +15.00 |
| Average balanced total production time at the workplace | 120.07 |
Table 8.
Average balanced total production time at the workplace Assembly 2.
Table 8.
Average balanced total production time at the workplace Assembly 2.
| Workplace | Assembly 2 |
|---|
| Operation | Closing the lid | Lid
riveting | Knocking the lid | Labeling | Flap inspection | Inserting accessories | Closing with 2 flaps | Affixing the QA label | Transfer to the box |
| Duration of activity in seconds | 10.93 | 33.86 | 12.21 | 12.93 | 19.79 | 3.86 | 15.00 | 3.43 | 9.00 |
| Proposed modification | | | | −12.93 | | | | | |
| Average balanced total production time at the workplace | 108.08 |
Table 9.
Comparison of results based on the chosen approach of production management.
Table 9.
Comparison of results based on the chosen approach of production management.
| | Performance per Hour | Tact Time in Seconds | Balance Index | Overall Improvement |
|---|
| Unit | pieces | seconds | % | |
| Measuring the number of outputs | 19 | 189.47 | Not specified | 52.26% |
| Detailed analysis of operations | 23.67 | 152.07 | 79.24 |
| Workplace balancing | 28.93 | 124.42 | 96.50 |
| Improvement | +9.93 | −65.05 | |
Table 10.
Calculation of labor costs per product when measuring the number of finished products of the production line.
Table 10.
Calculation of labor costs per product when measuring the number of finished products of the production line.
| Indicator | Unit | Value | | |
|---|
Number of employees
on the line | pcs | 3 | ![Applsci 12 00075 i001]() | Tact time of line 189.49 s
Performance
Per hour
19 pcs |
| Hourly employee rate | € | 10.50 |
| Hourly labor costs | € | 31.50 |
| Hourly line performance | pcs | 19 |
| Tact time | s | 189.47 |
| Cost of 1 product | € | 1.66 |
Table 11.
Calculation of labor costs for one product in the analysis of individual operations of production line workplaces.
Table 11.
Calculation of labor costs for one product in the analysis of individual operations of production line workplaces.
| Indicator | Unit | Value | | |
|---|
Number of employees
on the line | pcs | 3 | ![Applsci 12 00075 i002]() | Tact time of line
152.07 s
Performance
Per hour
23.67 pcs |
| Hourly employee rate | € | 10.50 |
| Hourly labor costs | € | 31.50 |
| Hourly line performance | pcs | 23.67 |
| Tact time | s | 152.07 |
| Cost of 1 product | € | 1.33 |
Table 12.
Calculation of labor costs for one product when balancing production line workplaces.
Table 12.
Calculation of labor costs for one product when balancing production line workplaces.
| Indicator | Unit | Value | | |
|---|
| Number of employeeson the line | pcs | 3 | ![Applsci 12 00075 i003]() | Tact time of line
124.42 s
Performance
Per hour
28.93 pcs |
| Hourly employee rate | € | 10.50 |
| Hourly labor costs | € | 31.50 |
| Hourly line performance | pcs | 28.93 |
| Tact time | s | 124.42 |
| Cost of 1 product | € | 1.09 |
| Publisher’s Note: MDPI stays neutral with regard to jurisdictional claims in published maps and institutional affiliations. |
© 2021 by the authors. Licensee MDPI, Basel, Switzerland. This article is an open access article distributed under the terms and conditions of the Creative Commons Attribution (CC BY) license (https://creativecommons.org/licenses/by/4.0/).


 ,
, 


