Article

Digital Holographic Microscopy as Identifier of Ultrafine Particles Emitted during Fused Deposition Modelling

by
Daniel Alberto García-Espinosa
1,
Miguel León-Rodríguez
1,*,
Pedro Yañez-Contreras
1,
Israel Miguel-Andrés
2,
José Alfredo Padilla-Medina
3,
Alejandra Cruz-Bernal
1 and
Patricia Ibarra-Torres
1
1
Maestría en Tecnología Avanzada, Universidad Politécnica de Guanajuato, Cortazar 38496, Mexico
2
Department of Biomechanics, Centro de Innovación Aplicada en Tecnologías Competitivas, Leon 37545, Mexico
3
Departamento de Ingeniería Electrónica, Tecnológico Nacional de México/IT de Celaya, Celaya 38010, Mexico
*
Author to whom correspondence should be addressed.
Appl. Sci. 2022, 12(1), 65; https://doi.org/10.3390/app12010065
Submission received: 16 November 2021 / Revised: 15 December 2021 / Accepted: 16 December 2021 / Published: 22 December 2021
(This article belongs to the Section Additive Manufacturing Technologies)

Abstract

:
Additive manufacturing has acquired a global industrial panorama for being an alternative to redirect the industry towards sustainability. However, previous studies have indicated that fused deposition modelling (FDM) techniques are potential sources of particles that are harmful to health. For this reason, this work is focused on exploring the behaviour and distribution of FDM resultant nanoparticles from the most commonly used printable materials through alternative methods as digital holographic microscopy (DHM). In this paper, we present the feasibility of using DHM to determine the presence of nanoparticles in the FDM process. Experimental results validate this technology’s precision and provide extensive knowledge about the implications of the FDM on health. The measure of the thin films deposited in glass substrates was between a minimum of 9 nm to a maximum of 200 nm, in agreement with the previous studies.

1. Introduction

Additive manufacturing has acquired a great interest from the global industrial panorama since its appearance in the late 1980s, gaining ground in diverse sectors, as being considered a technology capable to guide the industry towards an environmentally sustainable direction [1,2,3,4]. This direction is due to its characteristics such as the efficient use of resources (raw materials and energy), as well as the reduction of CO2 emissions derived from its processes [3,5,6,7,8,9]. At the same time, additive manufacturing is composed of various techniques, such as stereolithography (SLA), digital light processing (DLP), selective laser sintering (SLS), and FDM [10]. This last, consists in the passing of filament through a nozzle previously heated to a specific temperature. Immediately afterward, the material is deposited progressively in the form of a layer on a construction platform, achieving this by employing a system of axes (X, Y, and Z) in order to create three-dimensional structures [11].
On the other hand, recent studies have defined those thermoplastic materials subjected to thermal processing act as emitting sources of gases and particles. Specifically, harmful to health compounds such as ultrafine particles, aldehydes, carbonyls and volatile organic compounds (VOCs). Proof of this, is the case of the primary gas-phase derived from the thermal decomposition of some thermoplastics as acrylonitrile butadiene styrene (ABS), which is one of the most common materials used in FDM. It has shown the presence of subproducts such as carbon monoxide, characterized by having a high degree of toxicity that can produce mild discomforts such as cough, sore throat, irritation of the nasal passage, headache and nausea, to hard complications as pulmonary edema, pneumonia, development of heart conditions, infertility and increasing risks of premature births; hydrogen cyanide, which is a highly hazardous material classified as a non-cumulative protoplasmic poison by its ease of combining with cell oxygenation regulatory blood enzymes, generating a prolonged deficit of oxygen and resulting in a respiratory failure of the affected person; ultrafine particles, which can easily lodge in the lungs, alveoli and respiratory tract, causing conditions such as translocation of this thin materials to the brain through the olfactory nerve, cardiorespiratory problems, cardiovascular accidents, asthma symptoms and even death; and VOCs, which can cause irritations in the respiratory tract to fertility problems [12,13,14,15,16,17,18,19,20,21,22,23,24,25,26]. Stephens et al., report the presence of particles with lengths ranging from 11.5 to 116 nm, in concentrations that exceed 1010 units per minute, a fact that translates into potential health danger [13]. In addition, a large part of the investigations focused on the study of emission phenomena derived from FDM processes made use of specialized equipment, such as: vacuum containers, air filters, and chromatography equipment, to identify the presence and characteristics of the resulting particles. However, carrying out these tests represents a high monetary cost; being necessary the development of different alternatives using emerging technologies that facilitate the study of the environmental effects derived from additive manufacturing, promoting the solution of its main challenges. In this way, the digital holography technique, developed by Dennis Gabor in 1948 to improve the electron microscope’s resolution, has been positioned as an attractive tool for developing research in the nanotechnology field. Due to its properties, digital holography has the capability to acquire holograms quickly; it facilitates the availability of complete information about the amplitude and phase of the optical wavefront. Phase distribution allows us to calculate the thickness of thin films formed by nanoparticles and the versatility present in the techniques that compound them, such as interferometric and image processing [27].
This study was developed to analyse the distribution of the resultant ultrafine particles from the filament smelt and deposition processes presented on the FDM; through the use of a digital holographic microscope in order to propose new methodological alternatives, focused on the economic and technical feasibility of its appliance. It contributes to a broader understanding of the environmental and health implications of the implementation of additive manufacturing in the industry. This work shows the measurement of nanoparticles distribution present in the additive manufacturing process of eight printable thermoplastics, being these materials: polylactic acid (PLA), acrylonitrile butadiene styrene (ABS), carbon fiber, nylon, polyethylene terephthalate (PETG), high impact polystyrene (HIPS), thermoplastic polyurethane (TPU), and polypropylene (PP). The technique used to carry out this inspection was through digital holographic microscopy (HDM). Despite the lateral limitations of the microscope, the measurement of the thickness of the film deposited on a glass substrate in the case of PLA and ABS were between 11.5 nm to 96.72 nm, in agreement with recent studies. As far as we know, this technique was not already used before for the analysis of nanoparticles derived of FDM thermoplastics smelting process.
This work is divided into three main sections; the first of them is Materials and Methods, which present the procedure used in the microparticle collection employing glass substrates from the most frequently used thermoplastic materials in 3D printing, mentioned above, through set-ups that simulate the melting process present in the FDM additive manufacturing technique. At the same time, the microscopic digital holography is detailed exposed; describing its main characteristics, explaining the theoretical principles that govern its operation and the configurations used to carry out the measurements related to the object of study. On the other hand, the Section 3 report the results obtained from the experimental procedures, making an analysis based on previous research related with the ordering behaviour of the particles of those used materials. Finally, the last section, entitled Conclusions, synthesizes the most important contributions obtained from the research, as well as multiple recommendations to mitigate the negative effects derived from use of FDM as a manufacturing method. Being the main objective of this research, the recollection, measurement and analysis of nanoparticles derived from de smelting process that conform FDM with the technique of DHM.

2. Materials and Methods

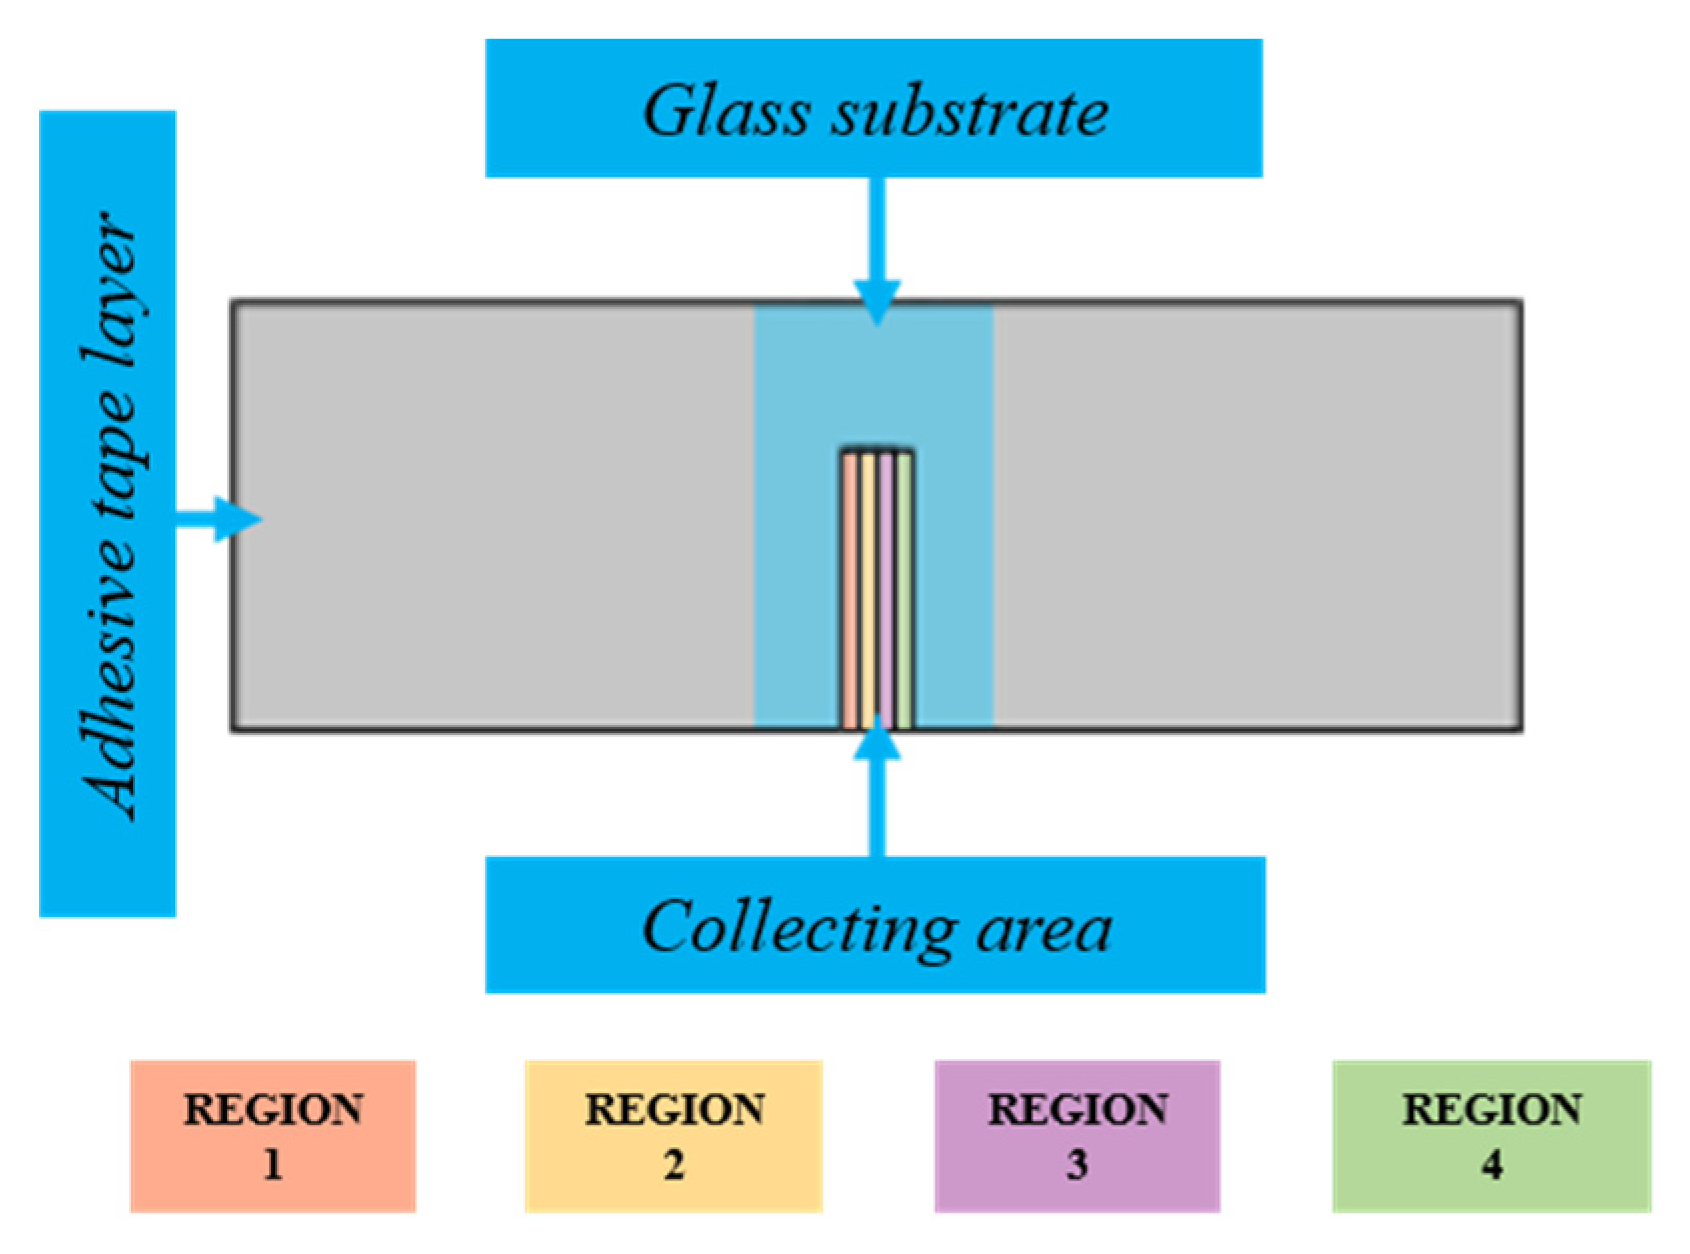
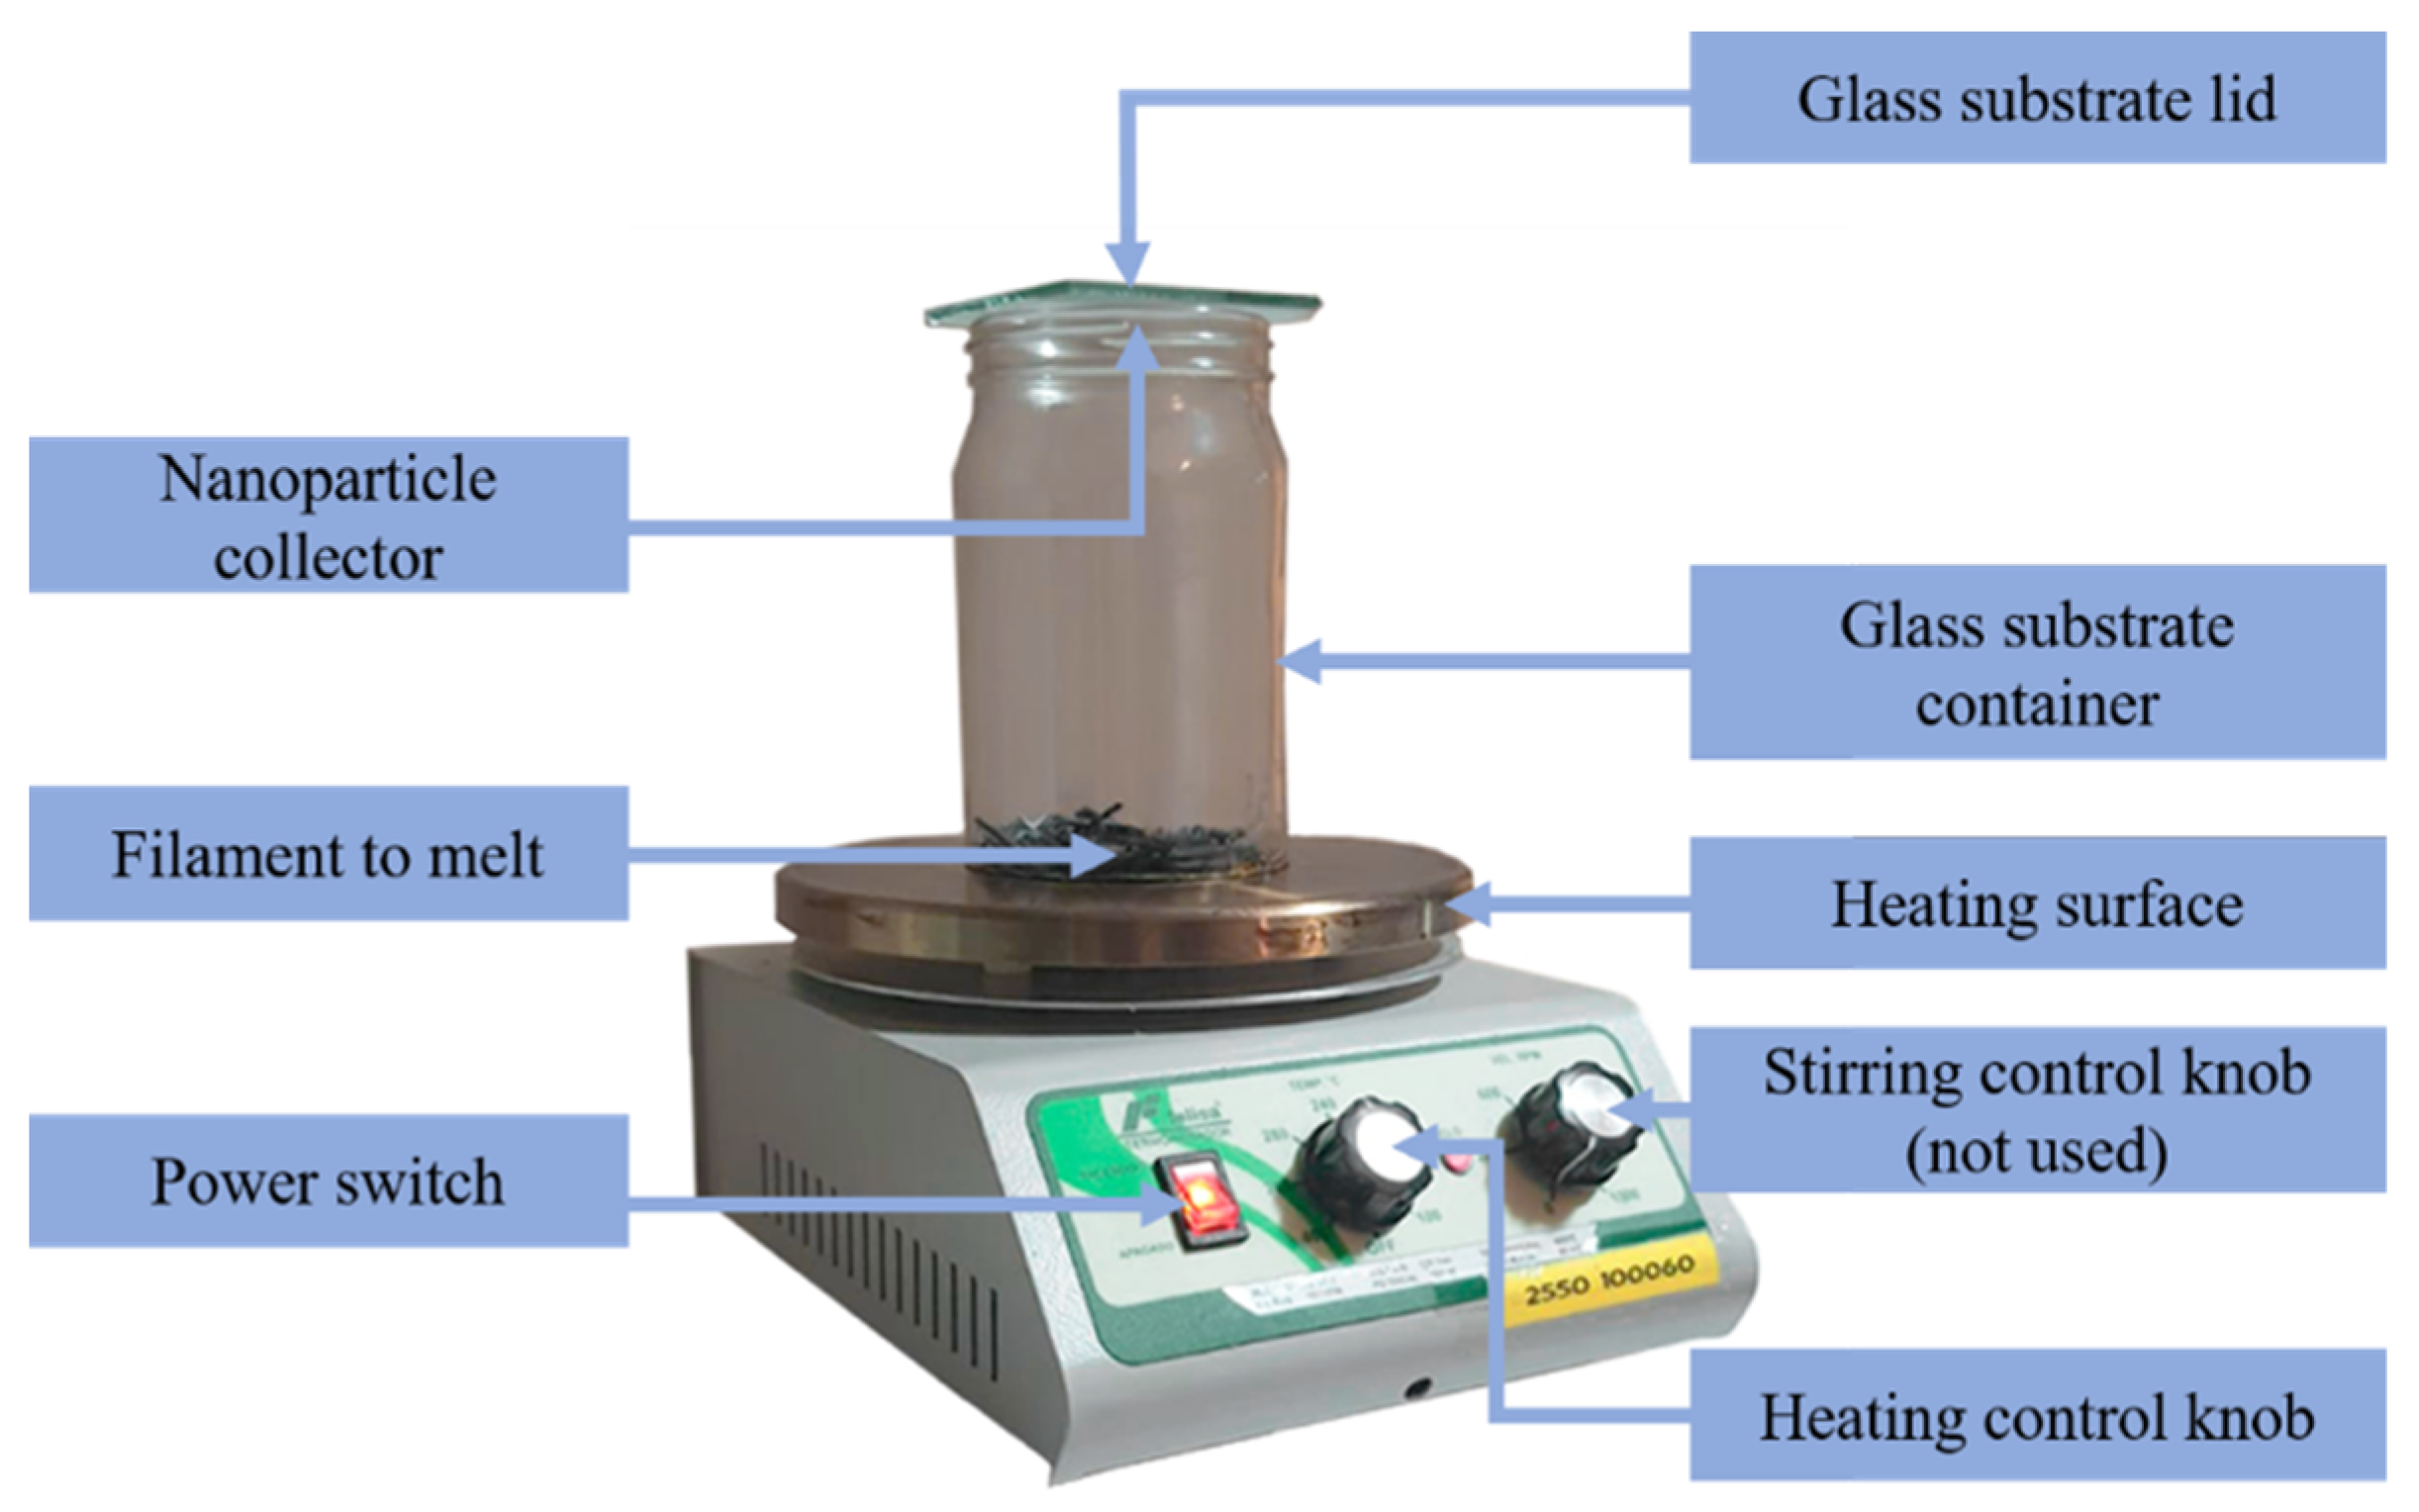
2.1. Nanoparticle Samples Collection

The methodology used to capture microparticles is an adaptation of the research carried out by Stephens et al., in their work entitled Ultrafine Particle Emissions from Desktop 3D Printers, which aims to emulate the conditions presented during the 3D printing process; taking into account important aspects such as temperature, printing time and the amount of material deposited [13]. It began with determining the amount of filament used for the emulation of the casting process present in the FDM destined for the collection of the nanoparticle samples. First, a solid with a cubic shape was manufactured using the pre-established parameters in the Ultimaker Cura 4.8.0 software for the Creality Ender-3 Pro equipment’s generic PLA material (Table 1). Then, for 30 min the fused filament was deposited in the printing area, to be weighed later. Finally, an estimate of the total deposited material for a printing period of 2 h was made with this information.
Glass substrates, 76 mm long by 26 mm wide, were adapted meant to function as microparticle collectors. For this time, each substrate was sterilized using pure acetone and alcohol. Subsequently, one of its sides was covered with adhesive tape, reserving a centric area for collection, which measures 4 mm wide by 17 mm long, vertically oriented, and subdivided into four regions located in a parallel direction (Figure 1). This tape was used for generating the different areas according with the time of exposition, avoiding at the same time the presence of residual adhesives.
Subsequently, an adaptation of the methodology proposed in the previous studies, 3D printer as a potential source of indoor air pollution [28] was carried out. We obtain three samples per material (polylactic acid, acrylonitrile butadiene styrene, carbon fiber, nylon, polyethylene terephthalate, high impact polystyrene, thermoplastic polyurethane, and polypropylene) deposited inside a container made of a glass substrate, previously sterilized with pure acetone and alcohol. The container was placed on the grill of a PRENDO AM 100 magnetic stirrer at a temperature of 250 °C. Putting in the upper mouth of the container both a nanoparticle collector and a glass substrate, 70 mm wide by 70 mm long (Figure 2). Exposure of the material was carried out for 2 h, dividing into phases of 30 min each. The layer of tape adhered in each region was systematically removed once the substrate returned to room temperature. As a result, a stepped sample of the nanoparticles was obtained.

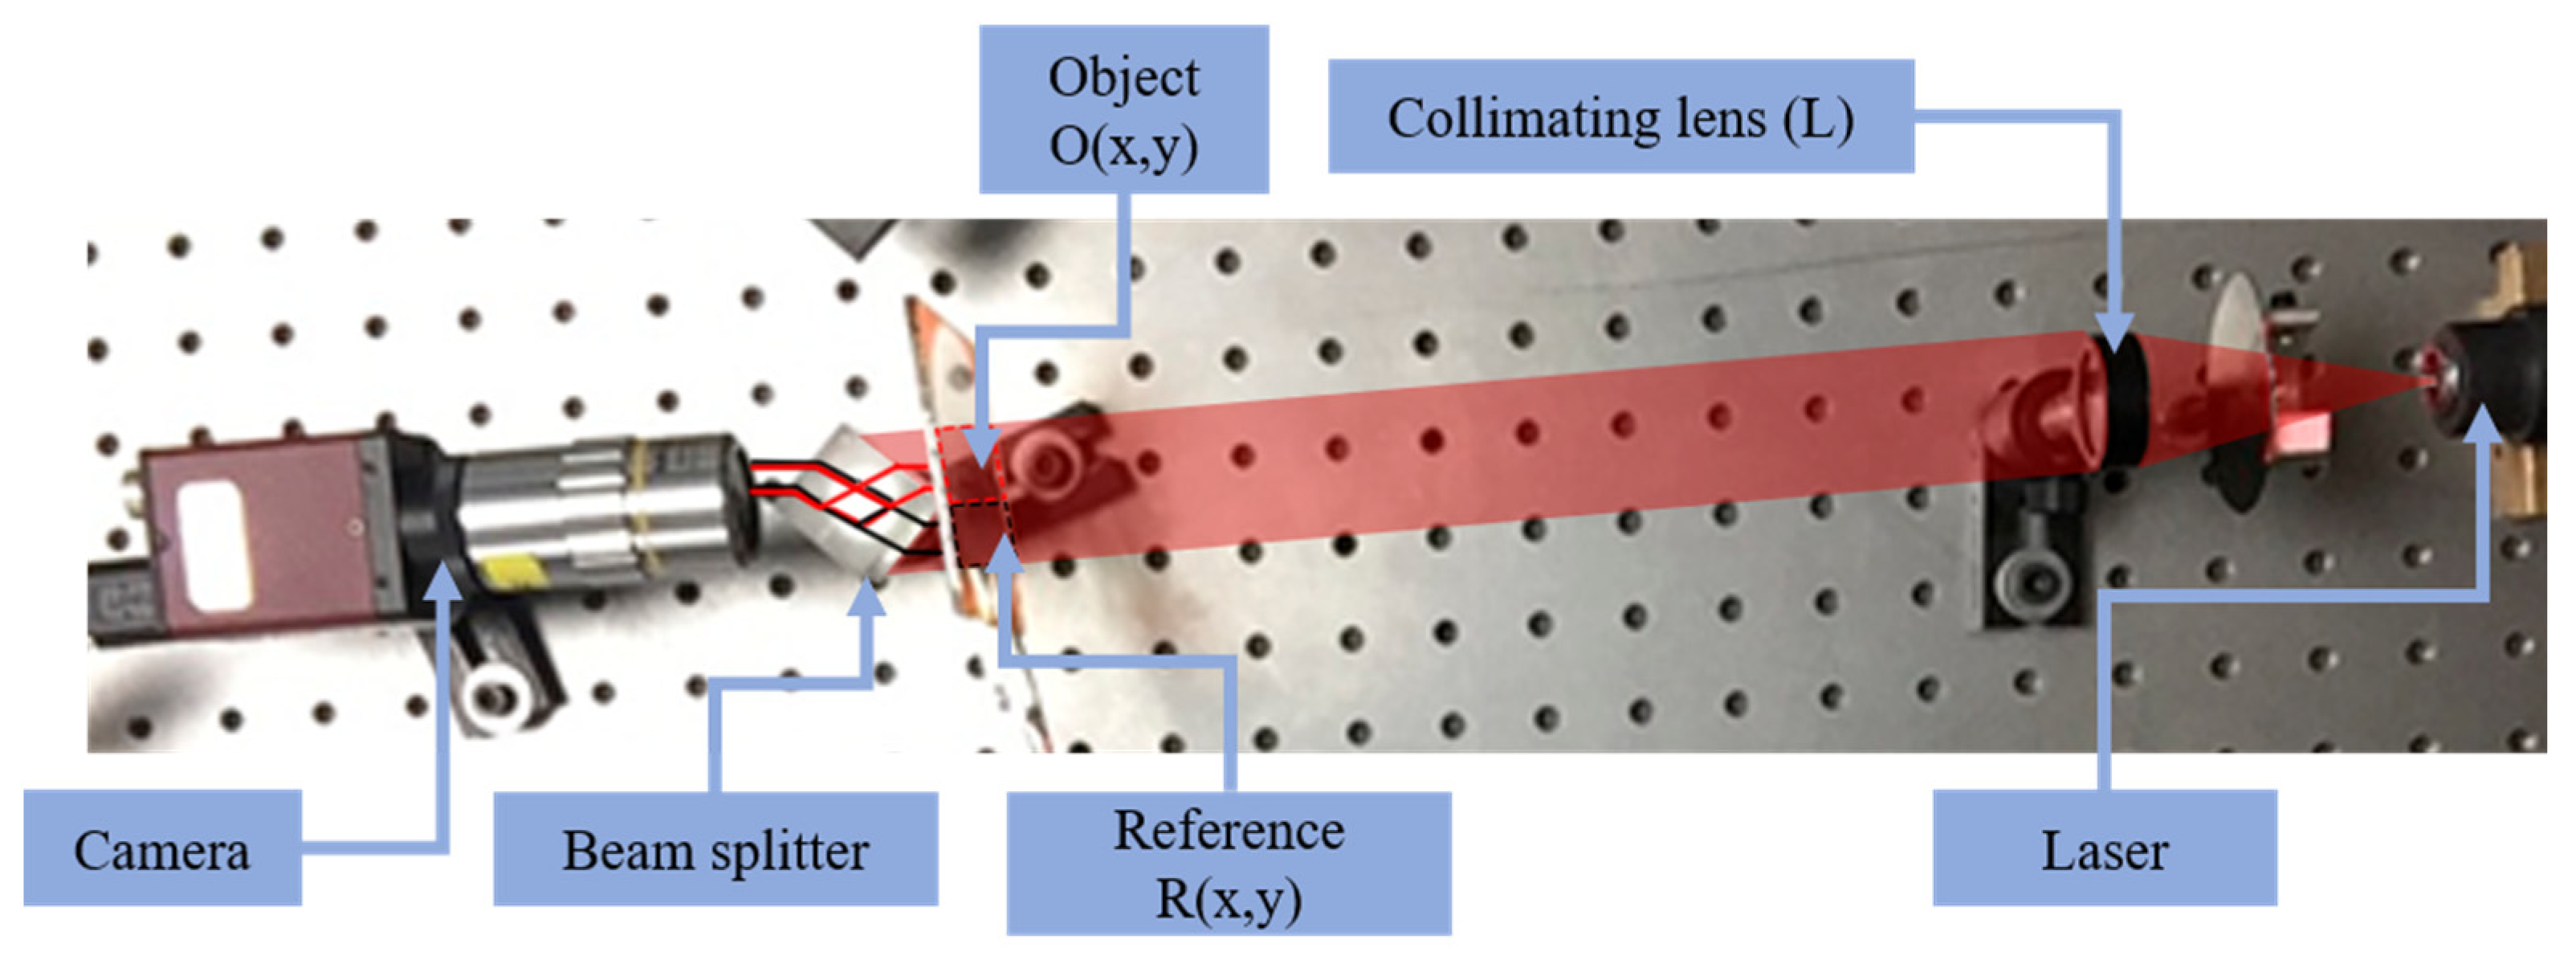
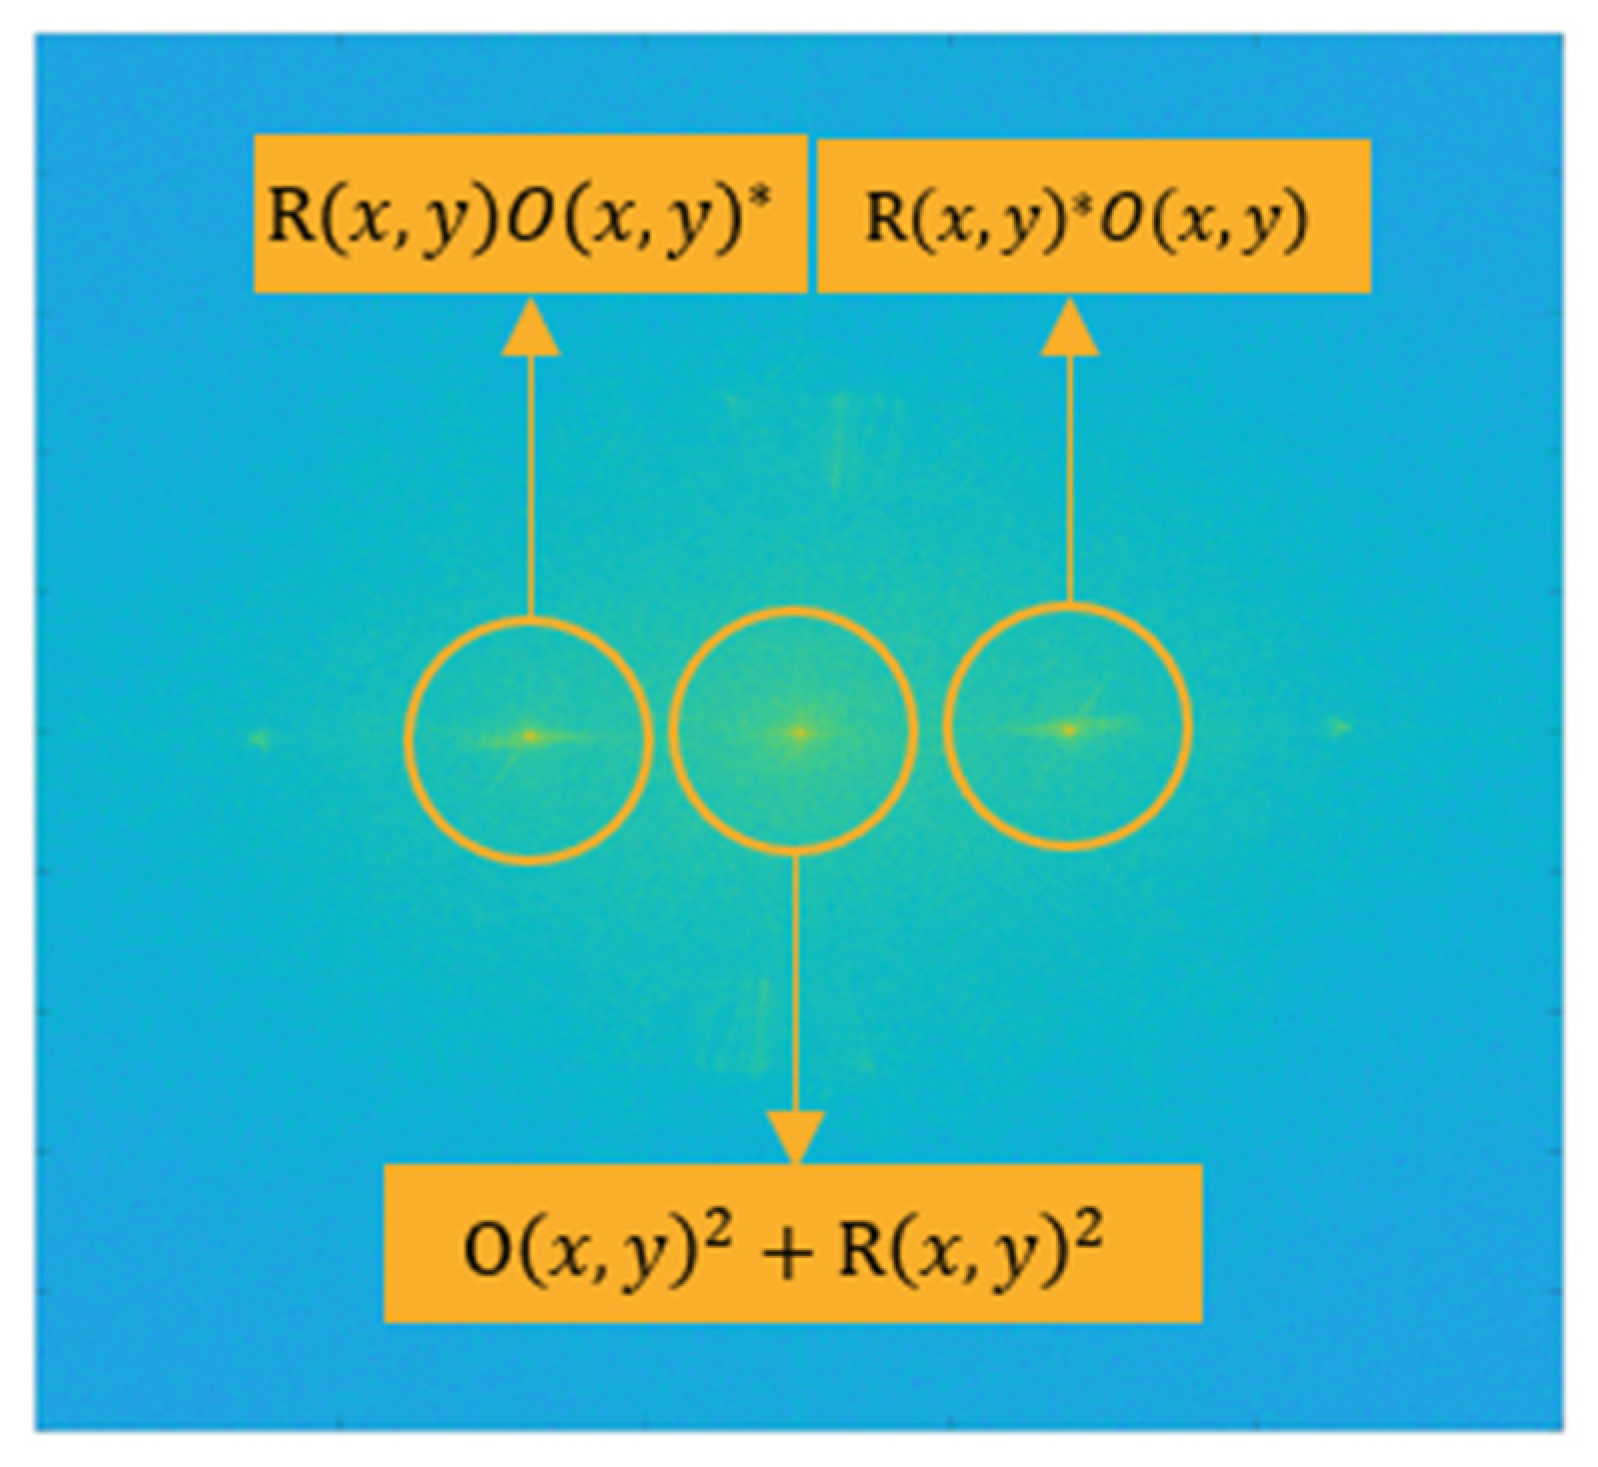
2.2. Digital Holographic Microscopy

DHM is a tool that has been gaining importance in different areas in the last three decades [28,29] due to its ability to refocus different planes with a single hologram to its high precision in the measurement of up to 4 nm in the axial direction [30] due to its interferometric nature and in the lateral direction determined by the Rayleigh diffraction limit such as any optical microscope, DHM is an ideal tool for obtaining nanometric measurements in the axial direction. This method is based on acquiring a hologram created with the interference of a light beam that is reflected or passes through an object captured with a microscope objective and with a reference beam [31]. The complex amplitude of the object is recovered when the hologram is re-illuminated by the reference light beam. In this way, we can have access to phase and magnitude images that allow us to make real physical measurements of the specimen.
The experimental optical arrangement used in this study was a Gates interferometer, as shown in Figure 3, which has previously been used in investigations by the authors [30,32,33]. A 5 mW laser diode with a wavelength (λ) of 640 nm was used as the illumination source. First, the beam of light is expanded and collimated by the lens (L). Subsequently, this beam is passed simultaneously through the sample and the substrate that does not contain deposited material (reference wave). In this manner, the object under test information is sent to the Gates interferometer through one window while the reference beam passes through the other. At the exit of the interferometer, the hologram was captured by a 10× microscope objective with a long working distance and N.A. of 0.28. On the other hand, the camera used to capture the micro-holograms was a 1024 × 1328-pixel monochrome StingrayTM with a pixel size of 6.4 μm × 6.4 μm with an 8-bit depth. For more details about how the Gates interferometer works, consult the following references [32,33].
In Figure 4a it is possible to observe a hologram captured by the system, while in Figure 4b a photograph of the sample is presented under white light illumination. In the lower part of the photograph is the nanoparticles’ deposition area. A dragonfly wing is shown in the upper part of the photograph, placed as a focus reference, clarifying that insect was found dead in the university facilities. The distance from the object to the camera plane was 38 mm, and the system configuration was devised to obtain off-axis holograms. As we can see in Figure 4a, the zoon area modulating straight vertical lines are present. In addition, it is important to mention that the maximum object dimensions that could be analyzed by the proposed equipment arrangement will depend on two factors, being the size of the beam splitter cube and the camera sensor. In other words, the larger the sensor and the beam splitter cube, the larger it would be the size of the object capable of being analyzed [33].
The Figure 4a shows an experimental digital hologram obtained by the optical setup proposed of the Figure 3. In order to obtain a digital hologram, it is essential to count with both, the object wave (red dash square) and the reference one (black dash square) (Figure 3). In addition, the illumination source must be coherent, being in this case a laser light. In contrast, to obtain a photograph, the illumination source is not required to be coherent, in this case the Figure 4b was illuminated with a simple LED and the reference wave was blocked. The Figure 4 is presented with aims of illustration.
The intensity I(x,y) registered by the camera, is the interference distribution between the object wave O(x,y) and the reference wave R(x,y) that obeys the following expression:
I ( x , y ) = | O ( x , y ) + R ( x , y ) | 2 = O ( x , y ) 2 + R ( x , y ) 2 + R ( x , y ) O ( x , y ) * + R ( x , y ) * O ( x , y )
The first terms correspond to the DC term, while the last two correspond to the virtual and real image, respectively. On the other hand, * denotes complex conjugated terms.
Regarding “off-axis” holograms, the DC term, the real and virtual images are separated according to diffraction orders. Applying the filtering process in the frequency domain, only the real image of the object can be obtained for later reconstruction. In Figure 5, the Fourier spectrum of the hologram of Figure 4a is shown, where the diffraction orders discussed above are highlighted.
Subsequently, a window function W ( f x , f y ) is used in the frequency domain to obtain the object wave R ( x , y ) * O ( x , y ) as expressed in the following mathematical expression:
O ( f x , f y ) = W ( f x , f y ) ± [ H ( x , y ) R D ( x , y ) ]
where H ( x , y ) is the digital hologram, R D ( x , y ) is the reference wave that synthetically re-illuminates the hologram and ℑ± is the inverse (+) and direct (−) Fourier transform. Taking into account the above, the reconstruction of the object O ( x , y ) is carried out by the Kirchhoff-Fresnel propagation algorithm as described below [34]:
O ( x , y , d ) = + { [ O ( f x , f y ) ] exp ( j k d ) exp [ j π λ d ] [ f x 2 + f y 2 ] }        
Based on the wavefront of the reconstructed object, the amplitude of the object A ( x , y ) = | O ( x , y , d ) | 2 and the ϕ ( x , y ) = tan 1 [ i m a g ( O ( x , y , d ) ) / r e a l ( O ( x , y , d ) ) ] are obtained. The thickness (e) corresponding to the calculated phase is obtained as follows:
e ( x , y ) = ϕ ( x , y ) / k n n 0
where n is the refractive index of the printable thermoplastic materials, and n 0 is the refractive index of air.

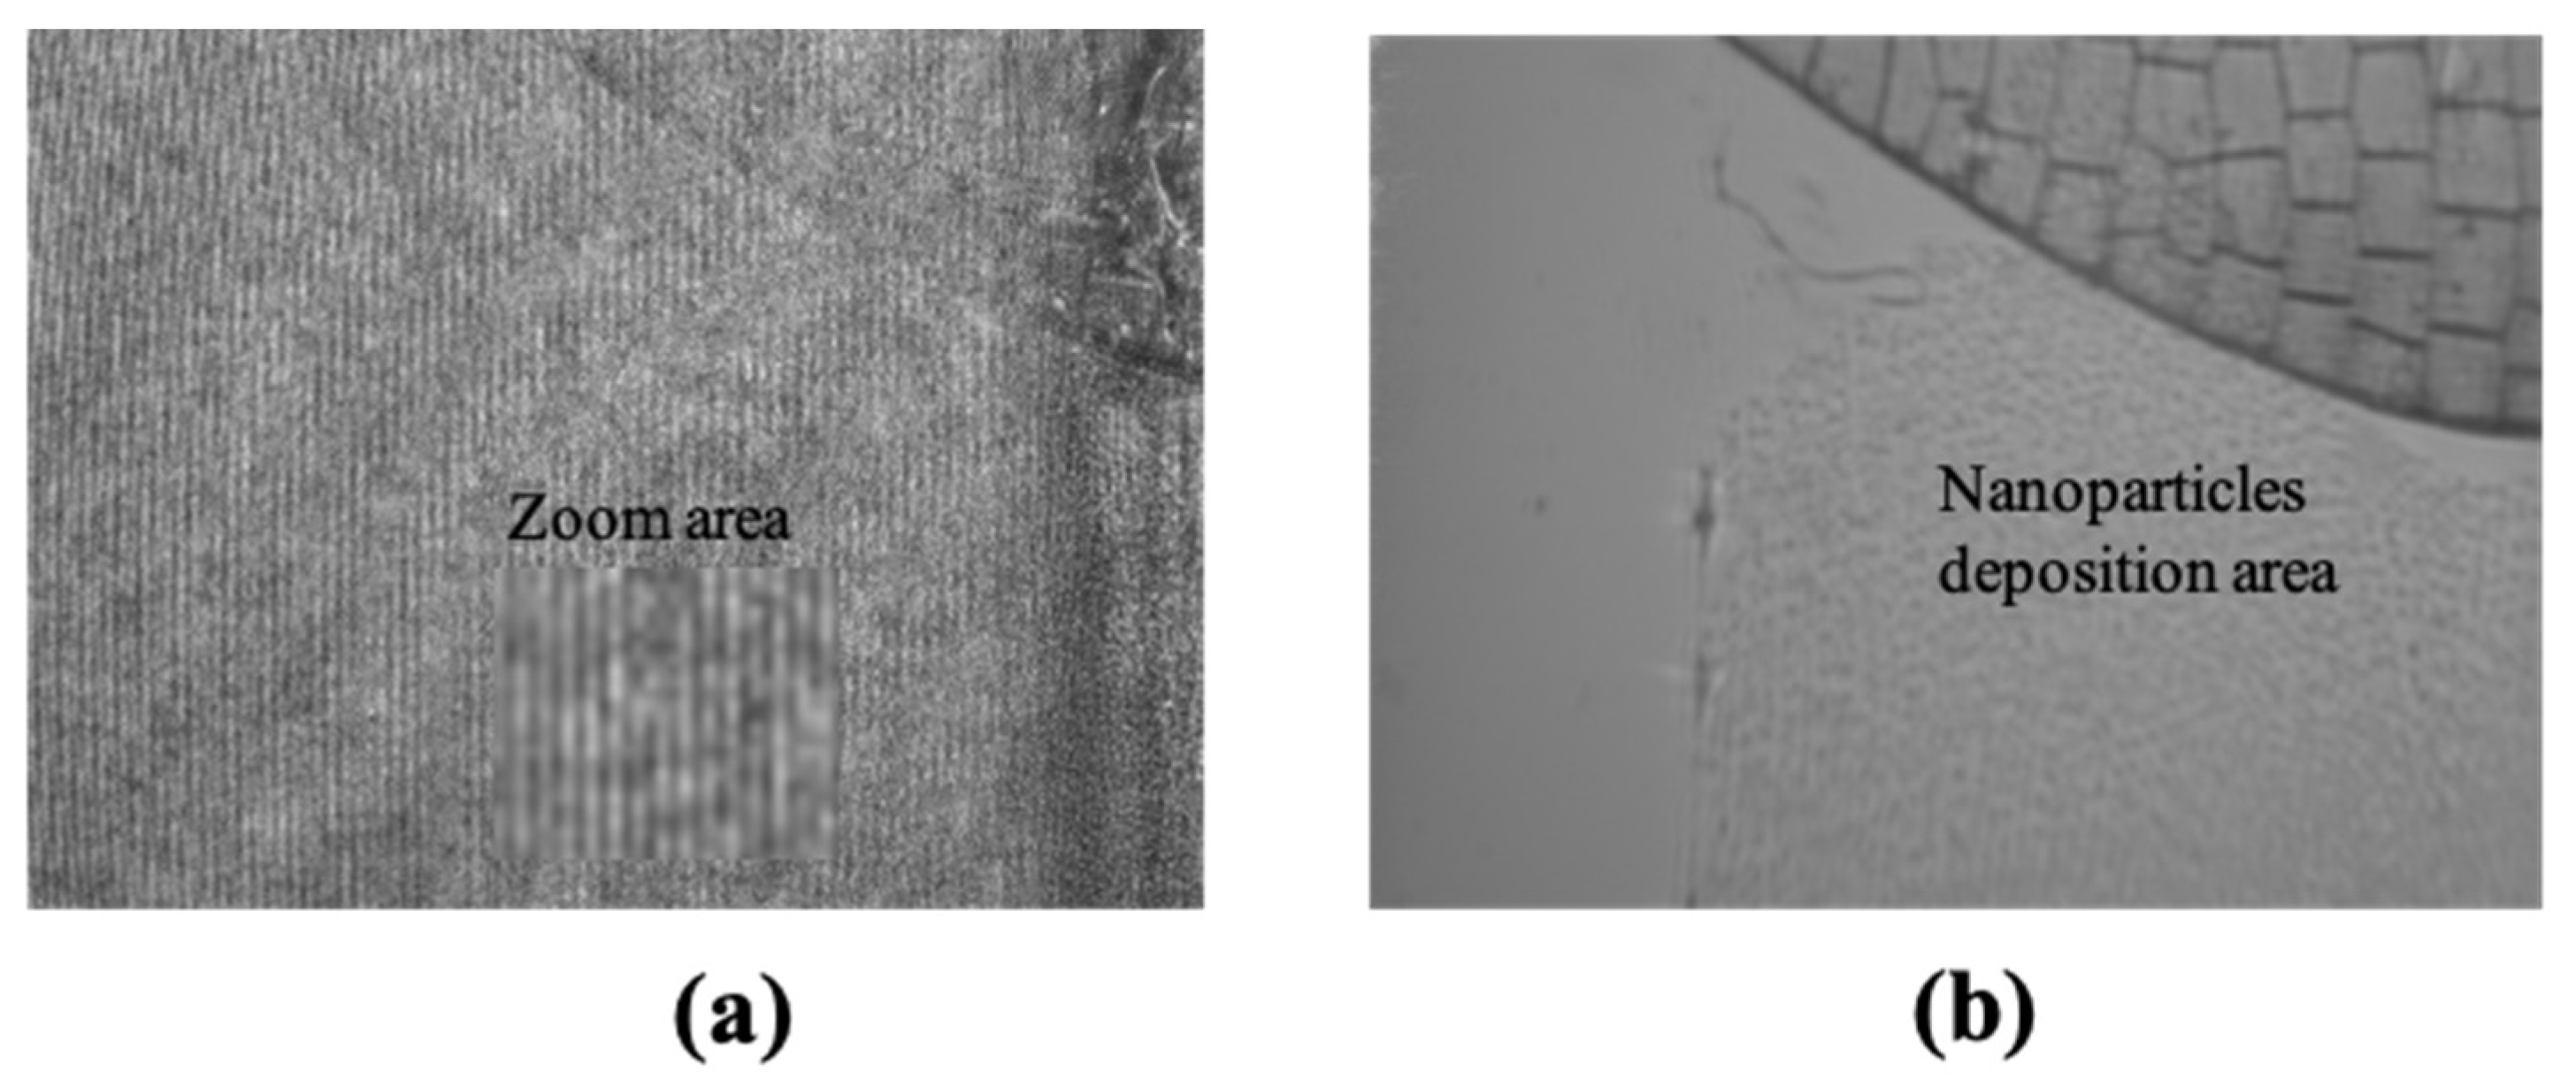
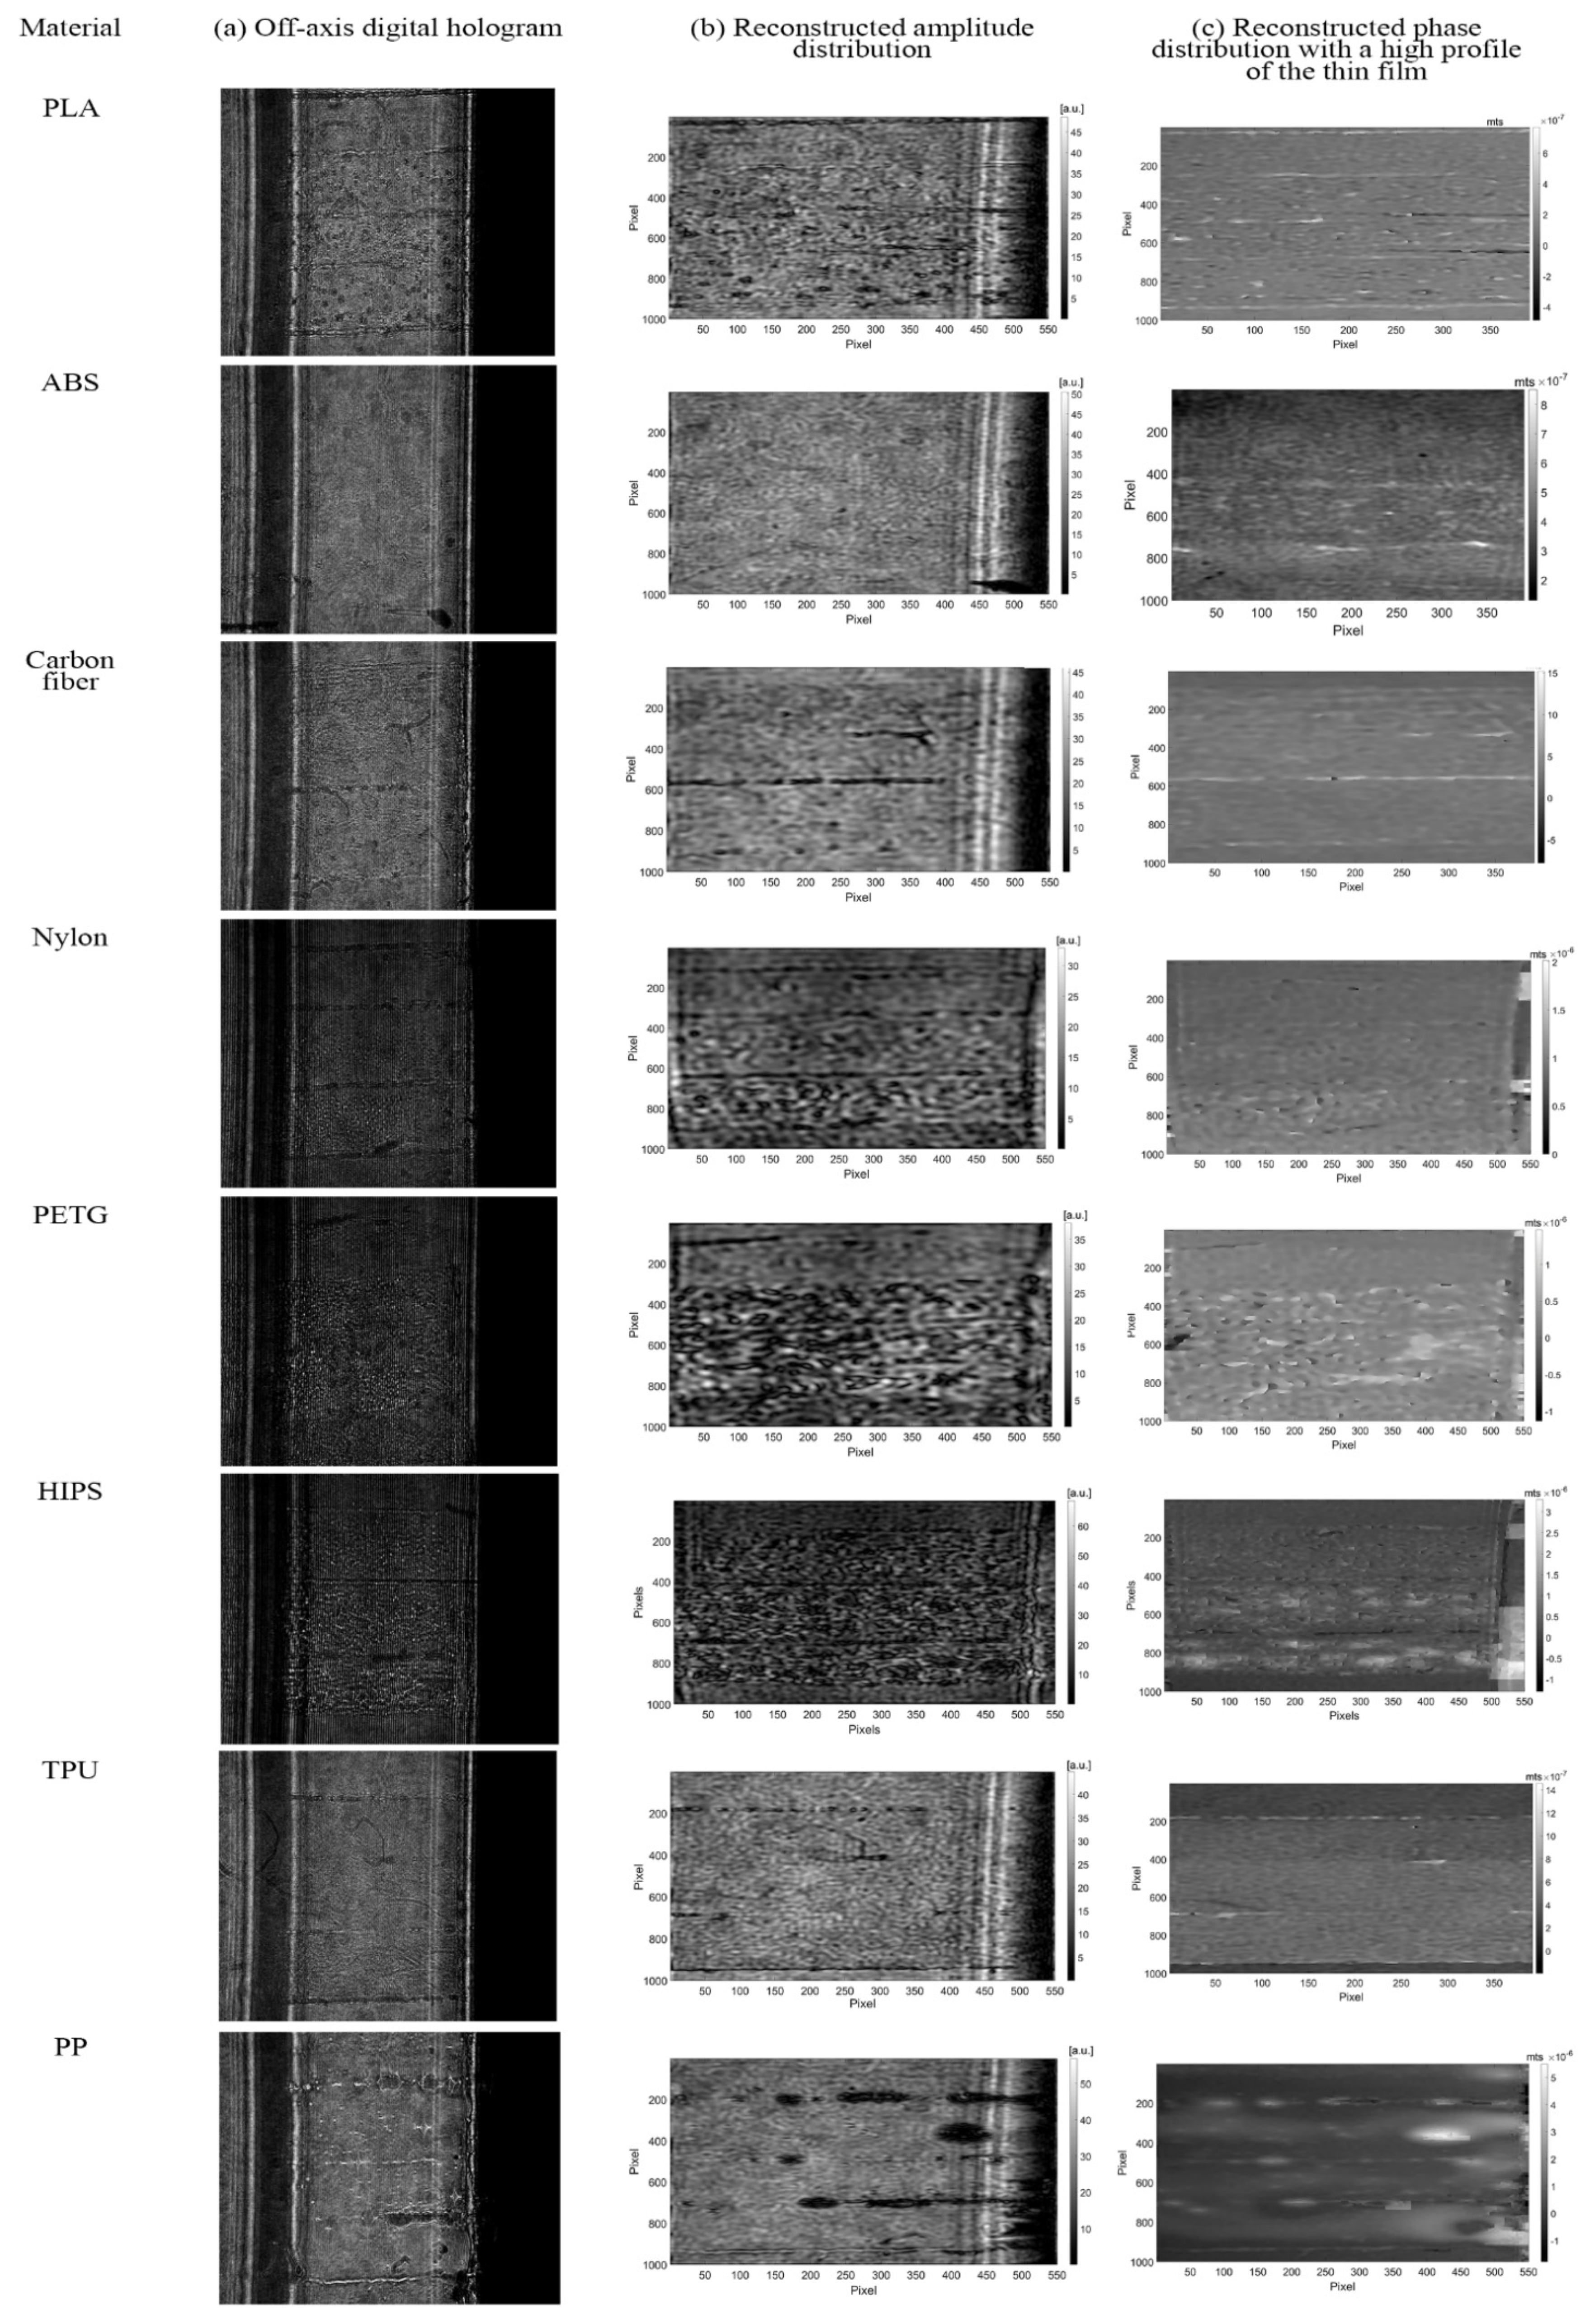
3. Results and Discussion

The experimental results obtained in this work were attained by applying DHM technique from the films generated during the nanoparticle collecting process described in the Section 2.1. Applying the proposed method to diverse thermoplastic materials such as ABS, Carbon Fiber, HIPS, Nylon, PETG, PLA, PP, and TPU, which were divided into four regions, varying the exposure time between each of them for 30 min. Having the Region 1 the shortest exposure time with only half an hour; while Region 4 counted with the longest exposure time with a period of 2 h. This with the aim of capturing films of different thicknesses, which allow analyzing the molecular ordering properties of each material through a defined time period.
The photograph of Figure 6a is the thin film of the TPU deposition by performing the procedure described in Section 2.1. Figure 6b shows a zoom area delimited by the red square of the photograph Figure 6a. At the bottom of Figure 6b we attached the profile measurement result of the thin film by DHM for identification zones.
Once, the collection of nanoparticle samples was finished (Section 2.1), a reconstruction process of the digital holograms was performed (Section 2.2), applying a reconstruction distance of d = 0.006 mm in Equation (3) for refocusing object and using a reference hologram technique to eliminate aberrations and misalignment of the system [35]. Figure 7 shows the reconstructed amplitude distribution of an Edmund NBS 1963A resolution card, where the zone of interest corresponds to 10 double lines per millimeter. From this pre-process, we attain a lateral resolution of 4 μm.
Figure 8a, Row 7, shows TPU digital hologram recorded by the optical setup described in Figure 3. The reconstruction process described in Section 2.2 was performed to obtain the measurement results by Equation (4). Next, in Figure 8b, Row 7, we show the amplitude reconstruction of the TPU particles deposition. Finally, Figure 8c, Row 7, it shows the phase reconstruction of the TPU particles deposition. Attached to this figure is the average profile of thin film thickness for a better understanding.
The graphs presented in Figure 9 show the average thickness of the films deposited in the vertical direction, as shown in the procedure in Figure 8. Additionally, the refractive index presented in Table 2 was used to realize these two-dimensional graphs [36,37,38,39].
The thermoplastic materials showed differences with the expected behavior related to their union properties during the nanoparticle deposition process on the glass substrate. While materials such as nylon and TPU showed a uniform adhesion, having a consistent relationship between the exposure time and the resultant nanoparticle film, materials such as carbon fiber and PP had an uneven adhesion behavior along the exposure regions.
Due to the properties of thermoplastic materials, their molecules present agglutination, avoiding the formation of uniform films [40]. These properties mean that plastic materials, in contrast to semiconductor materials such as silicon [41] or metallic materials as chromium [42], do not respect molecular structures in an orderly way.
The analysis of the nanoparticles was carried out collectively and focused mainly on identifying their distribution behaviors on the glass substrate used. Validating in this way, the digital holographic microscopy as an alternative methodology for the measurement and study of nanoparticles, through the comparison between the results obtained in region 1 of the PLA and ABS samples, shown in region 1 of the Figure 9f for PLA and Figure 9a for ABS; with the results reported by Stephens et al. of these specific materials. Where PLA and ABS particles films presented dimensions ranging from 11.5 nm to 116 nm, having as average measurement 47.5 nm [13]. On the other side, the results of this research about the thickness of the PLA film present a size range between 11.05–33.08 nm, while in the ABS film was 21.38–96.72 nm. Taking into account these data, the average measurement of each material was determined, being 21.55 nm for PLA and 67.23 for ABS. Once the averages of film thickness were known and using the Stephens et al. particle size average as reference measure, the relative error to know the accuracy of the data was calculated, obtaining −54.63% in the case of PLA and 41.54% in the case of ABS. In other words, although the measurements of both samples coincide with the data found by Stephens et al., the ABS sample showed greater accuracy, presenting a lower percentage of relative error concerning the reference measure.
Additionally, this research contributes significantly to the measurement of particle films captured within the first half-hour of the filament deposition process found in FDM. Analyzing a wide variety of materials not previously measured (ABS and PLA), such as carbon fiber, HIPS, nylon, PETG, PP, and TPU (Table 3). Where, materials such as TPU registered the smallest collected film thicknesses with 9.704 nm; while PP presented the largest films thicknesses, with a measurement of 771.6 nm (Table 3).

4. Conclusions

The present work shows the measurement of printable thermoplastics (PLA, ABS, Carbon fiber, Nylon, PETG, HIPS, TPU, and PP) nanoparticles distributions in the additive manufacturing process. The technique used to carry out this inspection was through DHM. Despite the lateral limitations of the microscope, the measurement of the thickness of the film deposited on a glass substrate in the case of PLA and ABS were between 11.5 nm to 96.72 nm, presenting slight variations with the results previously reported [13]; also presenting a relative error of −54.63% and 41.54%, respectively. However, it is important to mention that the differences between the results may be due to the fact that Stephens et al. perform the measurement of the dimensions of the particles in the free state, while this work focuses on the measurement of film, in which the shape of the particle was altered as a result of the adhesion process to the glass substrate. For this reason, we can conclude that the proposed procedure is reliable for the measurement of nanostructures, supporting the area of nanotechnology as an alternative measurement tool. In addition, DHM presents some advantages in comparison with the chromatography equipment [13] or scanning mobility particle sizer coupled with an optical particle spectrometer [14]. The proposal by DHM is a simpler optical setup, is cheaper implementation, and is more compact size system than used in references [13,14].
Additionally, the importance of conducting research related to nanoparticles’ presence in the FDM lies in the effects produced when they enter the human body. This is due to their ease of lodgment into the lungs, alveoli, and respiratory tract [14,15]. Thus, causing health conditions as translocation of these thin materials to the brain through the olfactory nerve, cardiorespiratory problems, cardiovascular accidents, asthma symptoms, and even death [21,43,44].
Finally, regarding the health issue, there are specific measures which can significantly mitigate the dangers derived from the exposure of nanoparticles and gases derived from thermal processing of plastics, as has been proven in industrial activities such as plastic injection. Being in the first place, the control of the temperatures for plastic handling; as well as the presence of proper ventilation in the thermal processes which materials are subjected, implementing local exhaust ventilation (LEV) for those areas where high emissions occur [43,44].

Author Contributions

Conceptualization, M.L.-R., P.Y.-C., I.M.-A. and J.A.P.-M.; formal analysis, D.A.G.-E.; investigation, M.L.-R.; methodology, D.A.G.-E., M.L.-R. and P.I.-T.; resources, P.I.-T.; software, D.A.G.-E.; supervision, M.L.-R. and I.M.-A.; validation, D.A.G.-E.; writing—original draft, D.A.G.-E.; writing—review and editing, M.L.-R., P.Y.-C., I.M.-A., J.A.P.-M., A.C.-B. and P.I.-T. All authors have read and agreed to the published version of the manuscript.

Funding

This research received no external funding.

Data Availability Statement

Data underlying the results presented in this letter are not publicly available but may be obtained from the authors upon reasonable request.

Acknowledgments

The corresponding author thanks Juan A. Rayas from the Centro de Investigaciones en Óptica A.C., León, Guanajuato, México, for the valuable suggestions and advice to this work. In addition, authors thank the PRODEP program and CONACYT for its partial support.

Conflicts of Interest

The authors declare no conflict of interest.

References

  1. Gebler, M.; Uiterkamp, A.J.M.S.; Visser, C. A global sustainability perspective on 3D printing technologies. Energy Policy 2014, 74, 158–167. [Google Scholar] [CrossRef]
  2. Buranská, E.; Buranský, I.; Morovič, L.; Líška, K. Environment and Safety Impacts of Additive Manufacturing: A Review. Res. Pap. Fac. Mater. Sci. Technol. Slovak Univ. Technol. 2019, 27, 9–20. [Google Scholar] [CrossRef] [Green Version]
  3. Chen, D.; Heyer, S.; Ibbotson, S.; Salonitis, K.; Steingrímsson, J.G.; Thiede, S. Direct digital manufacturing: Definition, evolution, and sustainability implications. J. Clean. Prod. 2015, 107, 615–625. [Google Scholar] [CrossRef]
  4. Guo, N.; Leu, M.C. Additive manufacturing: Technology, applications and research needs. Front. Mech. Eng. 2013, 8, 215–243. [Google Scholar] [CrossRef]
  5. Ford, S.; Despeisse, M. Additive manufacturing and sustainability: An exploratory study of the advantages and challenges. J. Clean. Prod. 2016, 137, 1573–1587. [Google Scholar] [CrossRef]
  6. Huang, S.H.; Liu, P.; Mokasdar, A.; Hou, L. Additive manufacturing and its societal impact: A literature review. Int. J. Adv. Manuf. Technol. 2013, 67, 1191–1203. [Google Scholar] [CrossRef]
  7. Petrick, I.J.; Simpson, T.W. 3D Printing Disrupts Manufacturing: How Economies of One Create New Rules of Competition. Res. Manag. 2013, 56, 12–16. [Google Scholar] [CrossRef]
  8. Berman, B. 3-D printing: The new industrial revolution. Bus. Horiz. 2012, 55, 155–162. [Google Scholar] [CrossRef]
  9. Petrovic, V.; Gonzalez, J.V.H.; Ferrando, O.J.; Gordillo, J.D.; Puchades, J.R.B.; Griñan, L.P. Additive layered manufacturing: Sectors of industrial application shown through case studies. Int. J. Prod. Res. 2011, 49, 1061–1079. [Google Scholar] [CrossRef]
  10. Kafle, A.; Luis, E.; Silwal, R.; Pan, H.M.; Shrestha, P.L.; Bastola, A.K. 3D/4D Printing of Polymers: Fused Deposition Modelling (FDM), Selective Laser Sintering (SLS), and Stereolithography (SLA). Polymers 2021, 13, 3101. [Google Scholar] [CrossRef] [PubMed]
  11. Prabhakar, M.M.; Saravanan, A.K.; Lenin, A.H.; Leno, I.J.; Mayandi, K.; Ramalingam, P.S. A short review on 3D printing methods, process parameters and materials. Mater. Today Proc. 2021, 45, 6108–6114. [Google Scholar] [CrossRef]
  12. Jeon, H.; Park, J.; Kim, S.; Park, K.; Yoon, C. Effect of nozzle temperature on the emission rate of ultrafine particles during 3D printing. Indoor Air 2020, 30, 306–314. [Google Scholar] [CrossRef]
  13. Stephens, B.; Azimi, P.; el Orch, Z.; Ramos, T. Ultrafine particle emissions from desktop 3D printers. Atmos. Environ. 2013, 79, 334–339. [Google Scholar] [CrossRef]
  14. Hinds, W.C. Aerosol Technology: Properties, Behavior, and Measurement of Airborne Particles; John Wiley & Sons: Hoboken, NJ, USA, 1999. [Google Scholar]
  15. Chalupa, D.C.; Morrow, P.E.; Oberdörster, G.; Utell, M.J.; Frampton, M.W. Ultrafine particle deposition in subjects with asthma. Environ. Health Perspect. 2004, 112, 879–882. [Google Scholar] [CrossRef] [PubMed] [Green Version]
  16. Peters, H.; Wichmann, E.; Tuch, T.; Heinrich, J.; Heyder, J. Respiratory effects are associated with the number of ultrafine particles. Am. J. Respir. Crit. Care Med. 1997, 155, 1376–1383. [Google Scholar] [CrossRef]
  17. Penttinen, P.; Timonen, K.L.; Tiittanen, P.; Mirme, A.; Ruuskanen, J.; Pekkanen, J. Ultrafine particles in urban air and respiratory health among adult asthmatics. Eur. Respir. J. 2001, 17, 428–435. [Google Scholar] [CrossRef] [Green Version]
  18. von Klot, S.; Wölke, G.; Tuch, T.; Heinrich, J.; Dockery, D.W.; Schwartz, J.; Kreyling, W.G.; Wichmann, H.E.; Peters, A. Increased asthma medication use in association with ambient fine and ultrafine particles. Eur. Respir. J. 2002, 20, 691–702. [Google Scholar] [CrossRef] [PubMed] [Green Version]
  19. Oberdörster, G.; Sharp, Z.; Atudorei, V.; Elder, A.; Gelein, R.; Kreyling, W.; Cox, C. Translocation of Inhaled Ultrafine Particles to the Brain. Inhal. Toxicol. 2004, 16, 437–445. [Google Scholar] [CrossRef] [PubMed]
  20. Delfino, R.J.; Sioutas, C.; Malik, S. Potential role of ultrafine particles in associations between airborne particle mass and cardiovascular health. Environ. Health Perspect. 2005, 113, 934–946. [Google Scholar] [CrossRef] [PubMed] [Green Version]
  21. Sioutas, C.; Delfino, R.J.; Singh, M. Exposure Assessment for Atmospheric Ultrafine Particles (UFPs) and Implications in Epidemiologic Research. Environ. Health Perspect. 2005, 113, 947–955. [Google Scholar] [CrossRef] [Green Version]
  22. Stölzel, M.; Breitner, S.; Cyrys, J.; Pitz, M.; Wölke, G.; Kreyling, W.; Heinrich, J.; Wichmann, H.-E.; Peters, A. Daily mortality and particulate matter in different size classes in Erfurt, Germany. J. Expo. Sci. Environ. Epidemiol. 2007, 17, 458–467. [Google Scholar] [CrossRef] [PubMed] [Green Version]
  23. Al air liquide españa s.a. Ficha de Datos de Seguridad: Monóxido de Carbono. 2010. Available online: http://www.ebd.csic.es/lie/PDF/FDS%20CO%20(6).pdf (accessed on 13 November 2021).
  24. UNAM. Hoja de Seguridad XX Cianuro de Hidrógeno y Cianuros, UNAM. 2016. Available online: https://quimica.unam.mx/wp-content/uploads/2016/12/20cianuros.pdf (accessed on 13 November 2021).
  25. Ministerio para la Transición Ecológica y el Reto Demográfico, De Compuestos Orgánicos Volátiles, Ministerio para la Transición Ecológica y el Reto Demográfico. 2003. Available online: https://www.miteco.gob.es/es/calidad-y-evaluacion-ambiental/temas/atmosfera-y-calidad-del-aire/emisiones/act-emis/compuestos_organicos_volatiles.aspx (accessed on 13 November 2021).
  26. Wojtyła, S.; Klama, P.; Śpiewak, K.; Baran, T. 3D printer as a potential source of indoor air pollution. Int. J. Environ. Sci. Technol. 2020, 17, 207–218. [Google Scholar] [CrossRef]
  27. Kim, M.K. Principles and techniques of digital holographic microscopy. SPIE Rev. 2010, 1, 018005. [Google Scholar] [CrossRef] [Green Version]
  28. Furlong, C.; Pryputniewicz, R.J. Optoelectronic characterization of shape and deformation of MEMS accelerometers used in transportation applications. Opt. Eng. 2003, 42, 1223–1231. [Google Scholar] [CrossRef]
  29. Rappaz, B.; Marquet, P.; Cuche, E.; Emery, Y.; Depeursinge, C.; Magistretti, P.J. Measurement of the integral refractive index and dynamic cell morphometry of living cells with digital holographic microscopy. Opt. Express 2005, 13, 9361–9373. [Google Scholar] [CrossRef] [PubMed] [Green Version]
  30. León-Rodríguez, M.; Rodríguez-Vera, R.; Rayas, J.A.; Calixto, S. High topographical accuracy by optical shot noise reduction in digital holographic microscopy. J. Opt. Soc. Am. A 2012, 29, 498–506. [Google Scholar] [CrossRef]
  31. Goodman, J.W.; Lawrence, R.W. Digital Image Formation from Electronically Detected Holograms. Appl. Phys. Lett. 1967, 11, 77–79. [Google Scholar] [CrossRef]
  32. León-Rodríguez, M.; Rayas, J.A.; Cordero, R.R.; Martínez-García, A.; Martínez-Gonzalez, A.; Téllez-Quiñones, A.; Yañez-Contreras, P.; Medina-Cázares, O. Dual-plane slightly off-axis digital holography based on a single cube beam splitter. Appl. Opt. 2018, 57, 2727–2735. [Google Scholar] [CrossRef]
  33. Sánchez, J.R.; Martínez-García, A.; Rayas, J.A.; León-Rodríguez, M. LED source interferometer for microscopic fringe projection profilometry using a Gates’ interferometer configuration. Lasers Eng. 2022, 149, 106822. [Google Scholar] [CrossRef]
  34. Goodman, J.W. Introduction to Fourier Optics, 2nd ed.; McGraw-Hill: New York, NY, USA, 1996. [Google Scholar]
  35. Colomb, T.; Kühn, J.; Charrière, F.; Depeursinge, C.; Marquet, P.; Aspert, N. Total aberrations compensation in digital holographic microscopy with a reference conjugated hologram. Opt. Express 2006, 14, 4300–4306. [Google Scholar] [CrossRef]
  36. Shevchik-Shekera, A.; Zabudsky, V.; Golenkov, O.; Dvoretskii, S. Designing and manufacturing aspherical polystyrene lenses for the terahertz region. Semicond. Phys. Quantum Electron. Optoelectron. 2018, 21, 83–88. [Google Scholar] [CrossRef]
  37. Ashby, M.F.; Shercliff, H.; Cebon, D. Materials: Engineering, Science, Processing and Design; Butterworth-Heinemann: Oxford, UK, 2018. [Google Scholar]
  38. Flores-Mijangos, J.; Beltrán-López, V. Far-infrared laser measurement of the refractive index of polypropylene. Appl. Opt. 2003, 42, 592–596. [Google Scholar] [CrossRef] [PubMed]
  39. Rogulska, M.; Kultys, A.; Puszka, A. New thermoplastic poly (carbonate-urethane) s based on chain extenders with sulfur atoms. Chem. Pap. 2017, 71, 1195–1204. [Google Scholar] [CrossRef] [Green Version]
  40. BÜFA Thermoplastic Composites GmbH & Co. KG. Differences in Structure: The Properties of Plastic Types. 2019. Available online: https://thermoplasticcomposites.de/en/2019/12/03/differences-in-structure-the-properties-of-plastic-types/ (accessed on 13 November 2021).
  41. Stangl, J.; Holý, V.; Bauer, G. Structural properties of self-organized semiconductor nanostructures. Rev. Mod. Phys. 2004, 76, 725–783. [Google Scholar] [CrossRef]
  42. El Radaf, I.M.; Hameed, T.A.; El Komy, G.M.; Dahy, T.M. Synthesis, structural, linear and nonlinear optical properties of chromium doped SnO2 thin films. Ceram. Int. 2019, 45, 3072–3080. [Google Scholar] [CrossRef]
  43. Unwin, J.; Coldwell, M.R.; Keen, C.; McAlinden, J.J. Airborne emissions of carcinogens and respiratory sensitizers during thermal processing of plastics. Ann. Occup. Hyg. 2013, 57, 399–406. [Google Scholar]
  44. Executive Health and Safety, Controlling Fume during Plastics Processing. 2013. Available online: https://www.hse.gov.uk/pubns/ppis13.pdf (accessed on 13 November 2021).
Figure 1. Nanoparticle collector diagram.
Applsci 12 00065 g001
Figure 2. Nanoparticles collecting setup.
Applsci 12 00065 g002
Figure 3. The optical arrangement of digital holographic microscope.
Applsci 12 00065 g003
Figure 4. PLA nanoparticles deposited on a glass substrate. (a) Digital hologram obtained with the proposed microscope and (b) photograph obtained with the same camera using white light.
Applsci 12 00065 g004
Figure 5. Fourier spectrum distribution of the captured hologram.
Applsci 12 00065 g005
Figure 6. (a) Photograph of TPU nanoparticles collected, and (b) zoom photograph of the thickness distribution of the deposited TPU film sample (Image (a)).
Applsci 12 00065 g006
Figure 7. Amplitude reconstruction of a hologram recorded of a resolution card to determine lateral resolution.
Applsci 12 00065 g007
Figure 8. Reconstruction of thermoplastics filaments deposition nanoparticles by DHM.
Applsci 12 00065 g008
Figure 9. The average thickness of the microparticle film deposited on the collecting area: (a) ABS, (b) carbon fiber, (c) HIPS, (d) Nylon, (e) PETG, (f) PLA, (g) PP, (h) TPU.
Applsci 12 00065 g009
Table 1. Printing parameters for PLA used in the software Ultimaker Cura.
ParametersPLA
Layer height0.2 mm
Initial layer height0.2 mm
Infill density100%
Infill patternLines
Printing temperature200 °C
Build plate temperature60 °C
Filament diameter1.75 mm
Print speed50.0 mm/s
Nozzle diameter0.4 mm
Table 2. Refractive index of thermoplastics materials.
MaterialRefractive Index (nd)
ABS1.57
Carbon fiber1.62
HIPS1.561
Nylon1.72
PETG1.57
PLA1.465
PP1.495
TPU1.57
Table 3. Region 1 nanoparticle film thickness.
MaterialMin. Film Height (nm)Max. Film Height (nm)
PLA11.0533.08
ABS21.3896.72
PETG105.6143
HIPS147.1330.6
Nylon26.1356.65
PP21.83771.6
Carbon Fiber98.19197.5
TPU9.704141.7
Publisher’s Note: MDPI stays neutral with regard to jurisdictional claims in published maps and institutional affiliations.

