Article

Mix Design and Engineering Properties of Fiber-Reinforced Pervious Concrete Using Lightweight Aggregates

1
Department of Civil Engineering and Geomatics, Cheng Shiu University, No. 840, Chengching Rd., Niaosong District, Kaohsiung 83347, Taiwan
2
Center for Environmental Toxin and Emerging-Contaminant Research, Cheng Shiu University, No. 840, Chengching Rd., Niaosong District, Kaohsiung 83347, Taiwan
3
Super Micro Mass Research and Technology Center, Cheng Shiu University, No. 840, Chengching Rd., Niaosong District, Kaohsiung 83347, Taiwan
4
Department of Agribusiness Management, National Pingtung University of Science & Technology, No. 1, Shuefu Rd., Neipu, Pingtung 91201, Taiwan
5
Institute of Sustainable Energy, Universiti Tenaga Nasional, Jalan IKRAM-UNITEN, 43000 Kajang, Selangor, Malaysia
*
Author to whom correspondence should be addressed.
Appl. Sci. 2022, 12(1), 524; https://doi.org/10.3390/app12010524
Submission received: 15 December 2021 / Revised: 30 December 2021 / Accepted: 3 January 2022 / Published: 5 January 2022
(This article belongs to the Special Issue Advances in High-Performance Fiber-Reinforced Concrete)

Abstract

:
The main purpose of this study was to investigate the mix design and performance of fiber-reinforced pervious concrete using lightweight coarse aggregates instead of ordinary coarse aggregates. There were two main stages in the relevant testing work. First, the properties of the matrix were tested with a rheological test and then different amounts of lightweight coarse aggregate and fine aggregate were added to the matrix to measure the properties of the obtained lightweight pervious concrete (LPC). In order to greatly reduce the experimental workload, the Taguchi experimental design method was adopted. An orthogonal array L9(34) was used, which was composed of four controllable three-level factors. There were four test parameters in this study, which were the lightweight coarse aggregate size, ordinary fine aggregate content, matrix type, and aggregate/binder ratio. The research results confirmed that the use of suitable materials and the optimal mix proportions were the key factors for improving the mechanical properties of the LPC. Due to the use of silica fume, ultrafine silica powder, and polypropylene fibers, the 28-day compressive strength, 28-day flexural strength, and 28-day split tensile strength of the LPC specimens prepared in this study were 4.80–7.78, 1.19–1.86, and 0.78–1.11 MPa, respectively. On the whole, the mechanical properties of the prepared LPC specimens were better than those of the LPC with general composition.

1. Introduction

Sponge cities have developed as a new generation of urban stormwater management [1]. It is an effective approach to solving urban water issues, particularly for waterlogging, i.e., building a permeable pavement to replace a non-permeable pavement. Therefore, in recent years, the use of pervious concrete (PC) has gradually increased. In fact, PC is a special type of concrete composed of Portland cement, coarse aggregate, little or no fine aggregates, admixture, and water [2,3]. According to the definition of PC by the National Ready Mixed Concrete Association (NRMCA) [3], its porosity is between 15% and 25%, and its water-to-binder ratio is between 0.3 and 0.34.
There are many different terms for PC, such as porous concrete, fine concrete, permeable concrete, gap grade concrete, and reinforced pore concrete [4,5,6]. However, there is a significant difference between porous concrete and pervious concrete because the pore structure of porous concrete is not connected to each other; therefore, its water permeability is not good. In contrast, PC has connected pores and its water permeability is excellent [7,8,9]. When pouring and compacting PC, the aggregates adhere tightly to each other, exhibiting interconnected pores. In the fresh plastic state, the general PC is relatively viscous and its slump is usually less than 20 mm. Since PC exhibits low workability, it is meaningless to evaluate the workability of PC. In other words, the slump of PC has nothing to do with its workability and is not suitable as an acceptance criterion [10,11]. When pouring PC on a construction site, in order to ensure sufficient working time, a retarder or hydration stabilizer is often used [10,11]. In addition, viscous agents can also be blended to avoid the paste draining down and improve the workability [10,11].
In general, the composition of PC lacks fine aggregates, which gives it a high porosity. This allows air or water to move in the concrete and gives it a lower unit weight [12]. Typical PC materials are composed of narrow gradation (homogeneous or gap-graded) coarse aggregates, no fine aggregates (or trace amounts), and insufficient amounts of cement paste so that the internal porosity of the material is high and forms a network with interconnected pores [13,14]. However, in practical applications, the design of PC as a pavement material should take into account both porosity and structural strength [15]. Overall, compared with ordinary concrete, PC has the following characteristics: low bulk density, low thermal conductivity, insignificant capillary phenomena (average pore diameter greater than 1 mm), near-zero slump, no segregation, low shrinkage, low cost, and small side pressure during molding [16].
For the hardened properties of PC, its typical density or unit weight, porosity, permeability, compressive strength, and flexural strength are shown in Table 1 [17,18,19,20,21,22,23,24,25,26,27,28,29,30,31,32,33,34,35,36,37,38,39,40]. The range of compressive strength of the PC shown in Table 1 is quite wide, about 2.6–61.2 MPa. In addition, the freeze–thaw resistance of PC in harsh environments has also attracted researchers’ attention. Research by Wang et al [41] showed that the freeze–thaw durability of PC reinforced by polypropylene fibers with various nominal lengths was significantly improved. Some researchers believe that due to the high permeability of PC, its pore structure cannot be saturated with water; therefore, freeze–thaw damage generally does not occur [42,43]. However, there have been many actual cases showing the opposite result. Due to its specific use function and service conditions, even under unsaturated or partially saturated conditions, PC in cold climates is more susceptible to freeze–thaw damage than ordinary concrete [44,45]. On the other hand, it is particularly noteworthy that the use of lightweight aggregates not only significantly reduces the unit weight of PC but also enhances its thermal insulation properties [46]. These excellent properties make PC an environmentally friendly material. Despite this, the use of lightweight aggregates has some disadvantages, such as the reduced mechanical properties of PC [46,47,48]. From the data listed in Table 2, compared with general PC, the mechanical properties of PC made of lightweight aggregates are significantly reduced. Taking the important mechanical properties of lightweight pervious concrete (LPC) as an example, the compressive strength test results are about 1.80–5.99 MPa.
Improving the mechanical properties of PC to promote its application range has been widely researched. Overall, findings consistently confirm that the use of suitable materials and proper mix proportions are critical factors [49,50,51,52]. For example, the reduction of porosity in a cement matrix by incorporating fine materials, such as fly ash, metakaolin, rice husk ash, and biomass ash, in a PC mixture can contribute to the strength development of both chemical and physical effects [19]. In view of the above, this study used silica fume and ultra-fine silica powder in fiber-reinforced LPC to explore its mix design and engineering properties. The Taguchi experimental design was utilized to determine the optimal parameters for designing LPC. This study selected four experimental factors: the coarse aggregate size, the fine aggregate content, the matrix type, and the aggregate-to-binder ratio. In addition, to understand the impact of these important factors on the performance of the tested LPC, range analysis and analysis of variance were also performed.

2. Experimental Details

2.1. Materials Properties

The materials used in this study were cement, silica fume, ultra-fine silica powder, ordinary fine aggregates, lightweight coarse aggregates, superplasticizers, a viscous agent, and polypropylene fibers. The cement used was a local Type I Portland cement with a specific gravity of 3.15 and a fineness of 3400 cm2/g. The silica fume was locally manufactured and had a specific gravity of 2.75. The ultra-fine silica powder was purchased from abroad and its specific gravity was 2.73. In the case of fine aggregates, natural river sand was used; its physical properties are shown in Table 3. As for the coarse aggregate, we used an artificial lightweight aggregate with a water absorption rate per hour of 4.3%. In order to ensure that the concrete workability, superplasticizers, and viscous agent were added to the ratio, each product was a local product and met the standards of the American Society for Testing and Materials. The fibers used to improve the toughness of the concrete were polypropylene fibers with a melting point of 160 °C to 170 °C, water absorption of 0%, and a density of 0.9 g/cm3.

2.2. Test Variables and Experimental Design

In this study, for the fiber-reinforced LPC performance test, four experimental control factors were selected, namely, the particle size of lightweight coarse aggregate, the content of ordinary fine aggregate (the percentage of fine aggregate in the total aggregate), the type of cementitious matrix, and the aggregate-to-binder ratio. Among them, there were three types of cementitious matrices composed of different proportions of cementitious materials (cement (C), silica fume (SF), and ultrafine silica fume (USP)). There were three levels of each factor, as shown in Table 4. In addition, four performance parameters for the fiber-reinforced LPC are also shown in Table 4. If the factors and their levels were large, using a full factorial design that considered various combinations of all factors resulted in a large number of experiments [53]. In contrast, the Taguchi method selected appropriate orthogonal arrays according to the design parameters (i.e., experimental control factors and their level values), supplemented by signal/noise ratio (S/N) analysis and variance analysis, so that the optimal combination of parameters could be determined using limited experimental data [54,55,56,57]. Therefore, in order to avoid the aforementioned shortcomings of a full factorial design, the experimental scheme was designed using the Taguchi method. This study used an orthogonal array L9(34) that had four controllable factors and each factor had three levels, as shown in Table 5.

2.3. Mix Proportions and Casting of Specimens

In pervious concrete, cementitious materials are mainly used to properly coat and bond aggregates. It was found that the property of the cementitious material and its coating thickness are key factors in evaluating the structural and hydrological properties of the PC [58]. In this study, three matrixes with polypropylene fibers in different mix proportions were selected, as shown in Table 6. Once the matrix was mixed, the fresh properties of the mixture were measured and recorded. Then, matrix specimens (50 × 50 × 50 mm cube) for the compressive strength test were cast from each mixture. On the other hand, Table 7 shows the mix proportions of the LPC.
Prior to mixing the fiber-reinforced LPC, the aggregates were first processed into the required saturated surface-dry condition. During the mixing process, the cementitious material and the aggregate were mixed evenly, and then the water, superplasticizers, and the viscous agent were added. After being fully mixed, the LPC specimens of each test were cast and compacted with an external vibrator. The compressive strength and elastic modulus of the concrete were tested using cylindrical specimens with a diameter of 100 mm and a height of 200 mm. The split tensile strength test of concrete used a cylindrical specimen with a diameter of 150 mm and a height of 300 mm. As for the flexural strength test of concrete, prismatic specimens (length 360 mm × width 100 mm × thickness 100 mm) were used. Immediately after casting, the specimens were covered with hessian and polyethylene sheets. After 24 h, the specimens were demolded and placed in a laboratory water bath until they were taken out the day before the mechanical test.

2.4. Test Methods and Data Analysis

The matrix rheology test was performed using a Brookfield HBDV-II+Mode viscometer (Middleboro, MA, USA) with a disk-type spindle (#HB04). The matrix fluidity test was based on ASTM C230 [59] and the matrix compressive strength test complied with ASTM C109 [60]. According to ASTM C1688, ASTM C1701, ASTM C39, ASTM C469, ASTM C496, and ASTM C78 [61,62,63,64,65,66], the void content, penetration rate, compressive strength, modulus of elasticity, split tensile strength, and flexural strength of concrete specimens were respectively measured.
In Taguchi’s experimental design method, the deviation of the experimental value from the expected value was calculated by the so-called loss function. The value of this loss function is usually converted to a signal-to-noise ratio (S/N) [67]. The signal-to-noise ratio (η) is expressed in decibels (dB) and can be defined by the logarithm of the mean square deviation (MSD) around the target value. Performance characteristics can generally be divided into three categories: higher is better, nominal is best, and lower is better. In order to obtain a lightweight PC with high strength, the observed values of various mechanical properties were set to a maximum level. The S/N ratio was calculated according to the following equation [67]:
η = 10 × log 10 ( MSD ) = 10 × log 10 ( 1 n i = 1 n 1 y i 2 )
where n is the number of repetitions or observations and yi is an observed data point.

3. Results and Discussion

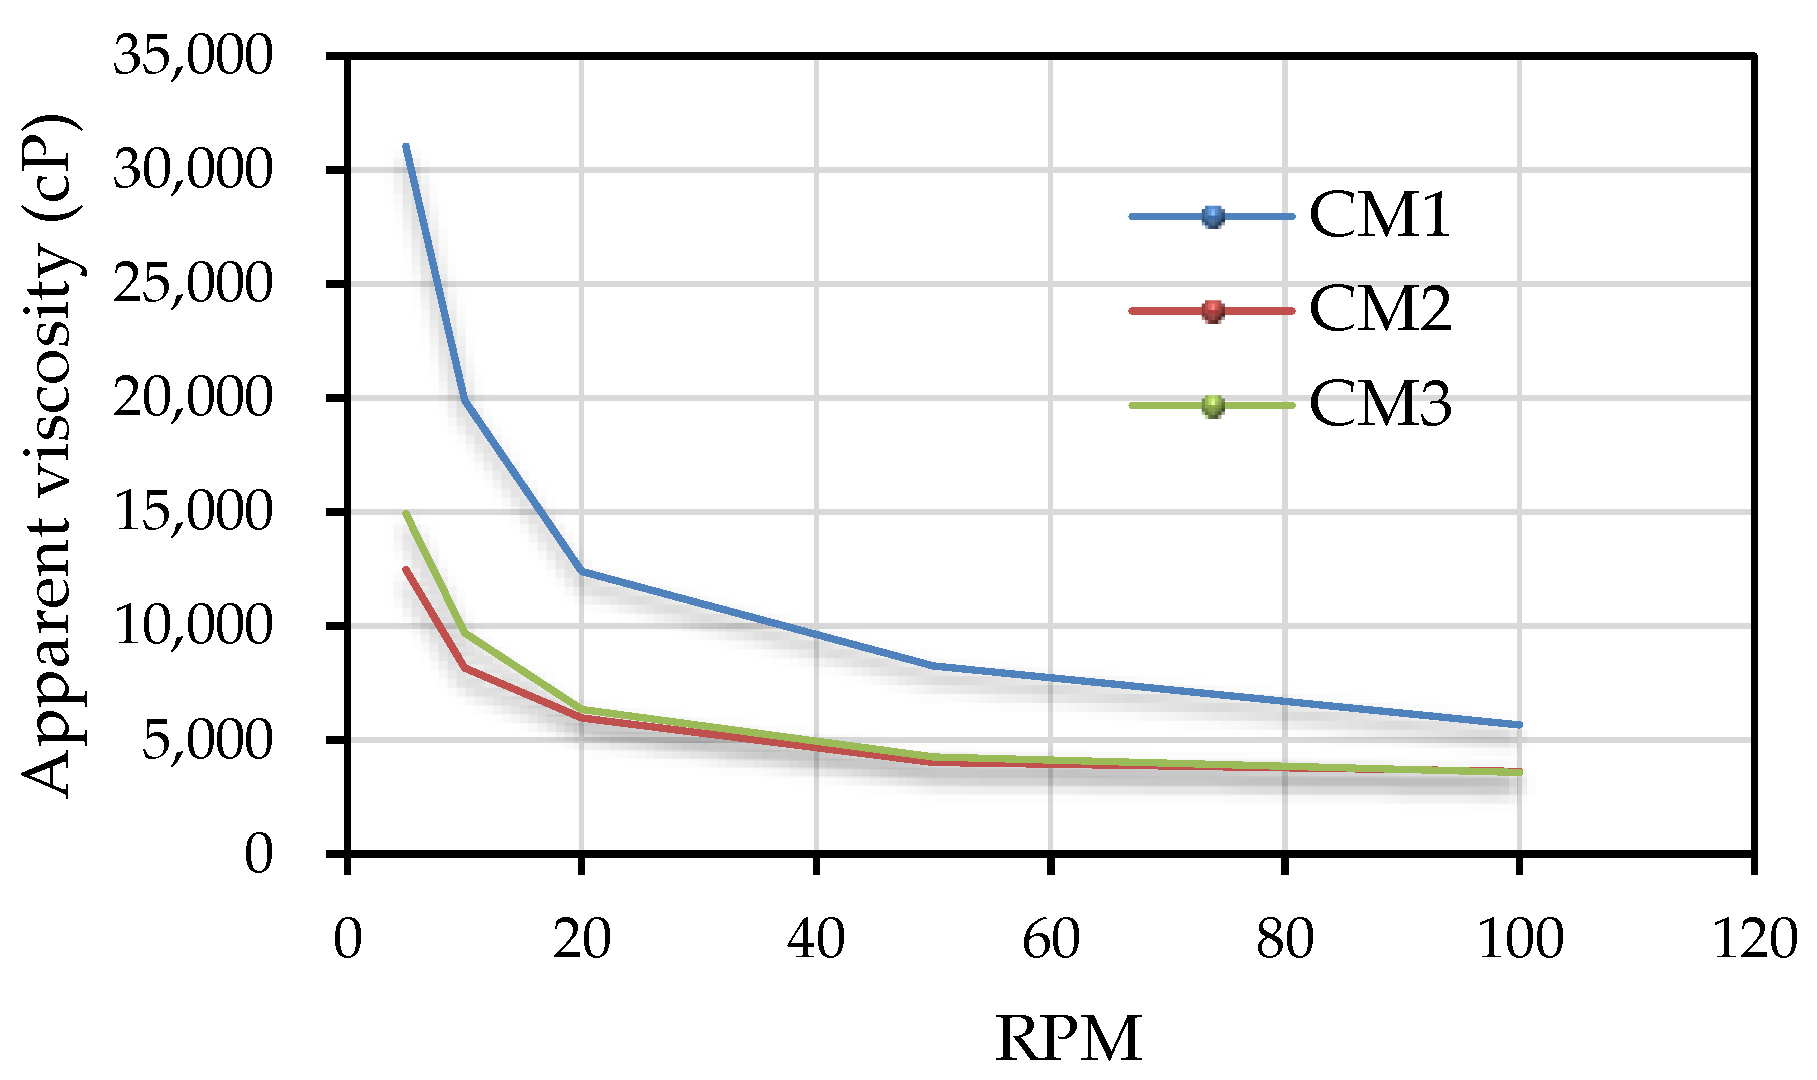
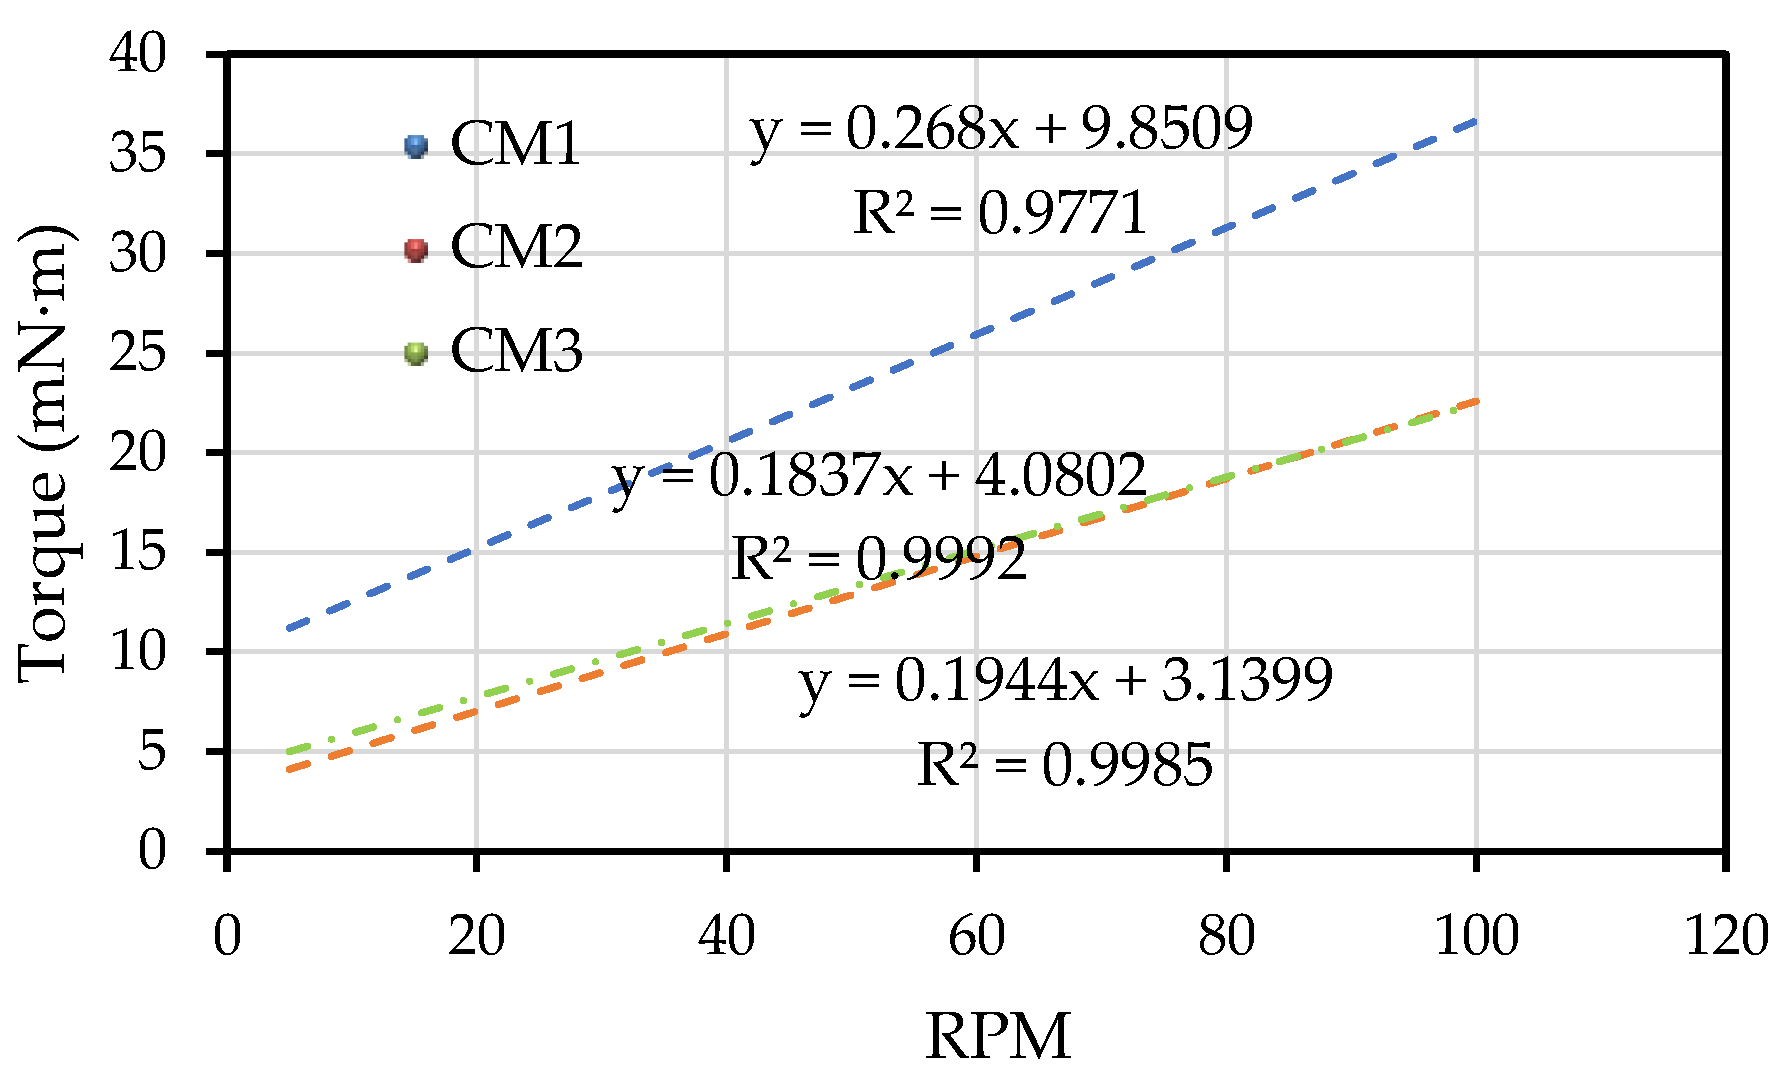
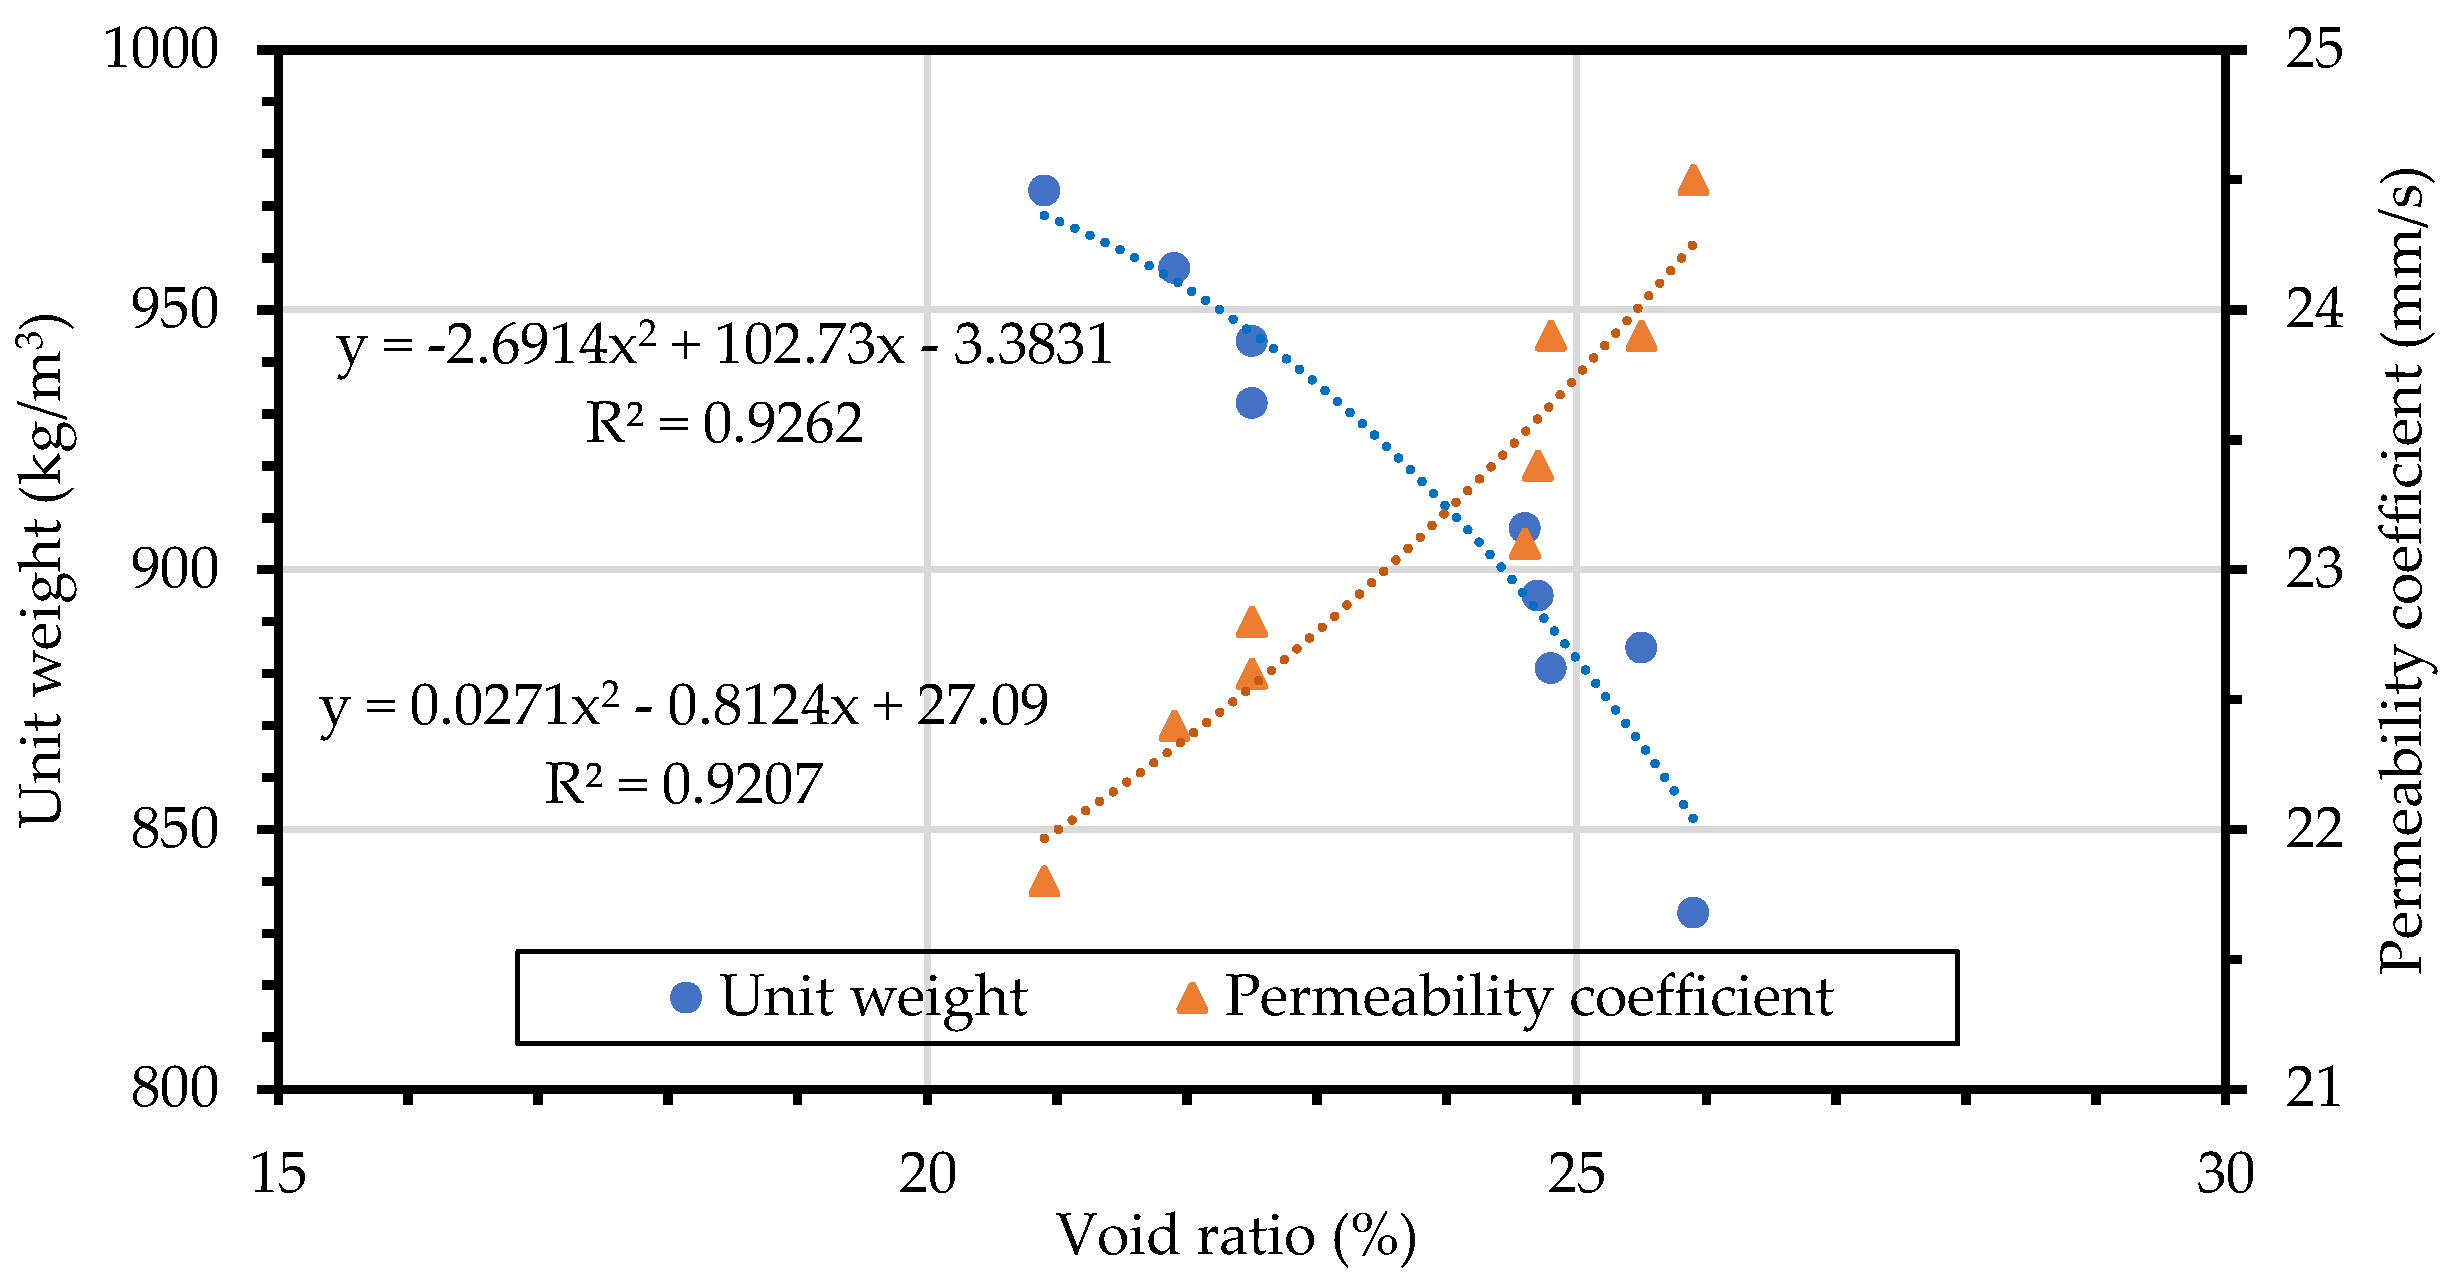
3.1. Test Results of the Matrixes

In essence, the deformation behavior of a freshly mixed matrix under stress can be explained by its rheological test results. A matrix is a non-Newtonian fluid and the relationship between shear stress and shear strain rate is not constant when subjected to shear stress. It should also be noted that the viscosity of the matrix varies with the test parameters, such as the type of viscometer, the type of spindle, and the shear strain rate, which affect the measured viscosity value. Therefore, unless the test parameters are clearly defined, the viscosity obtained via measurement is customarily referred to as the apparent viscosity to distinguish it from the viscosity of Newtonian fluids.
In this study, the rotational speed of the spindle was set to an appropriate range, that is, between 5 and 100 RPM, and the change in the rotational speed of the spindle was in a gradually decreasing manner (i.e., 100→50→20→10→5 RPM). The results of the rheological test on the matrixes are shown in Table 8. Among them, the mix proportions of the CM2 matrix were pure cement pastes, while the CM1 and CM3 matrixes were a mixture of ternary cementitious materials. Compared with the CM2 matrix of pure cement paste, the CM1 and CM3 matrices were a mixture of ternary cementitious materials whose apparent viscosity was significantly increased by the incorporation of silica fume and ultra-fine silica powder. This could ensure sufficient stability of the mixture and strengthen the bond between the hardened cement paste and the aggregate. Furthermore, as described above, the apparent viscosity of each matrix was closely related to the rotational speed of the spindle. The test results confirmed that the apparent viscosity increased as the spindle speed decreased, as shown in Figure 1. Especially at low speeds, the apparent viscosity of the CM1 matrix was more than 30,000 cP. On the other hand, there was a clear linear relationship between the torque and rotational speed of the spindle, as shown in Figure 2. This result indicated that these matrixes had appropriate rheological behavior that conformed to the Bingham model.
Table 9 shows the experimental results of the matrixes. As shown in Table 9, the flow value of each matrix ranged from 70.0 to 116.7 mm. Among them, the flow value of the CM1 matrix was the smallest (70.0 mm) and the flow value of the CM3 matrix was the highest (116.7 mm). In terms of compressive strength, the matrix’s 7-day compressive strength ranged from 69.1 to 87.3 MPa, where the CM1 matrix had the lowest compressive strength (69.1 MPa) and the CM2 matrix had the highest compressive strength (87.3 MPa). These results showed that the properties of the matrix will adhere to the surface of the coarse aggregate uniformly, thereby helping to improve the mechanical properties of the subsequently prepared LPC [31].

3.2. Test Results of the Fiber-Reinforced LPC

The test results of the physical and mechanical properties of the fiber-reinforced LPCs are shown in Table 10 and Table 11, respectively. An appropriate mixture design can balance the porosity/permeability and mechanical properties to meet the structural and hydrological performance requirements of PC. It can be seen from Table 10 that the unit weight of the produced LPC was between 834 and 973 kg/m3, which was significantly lower than that of ordinary weight PC. As can be seen from Table 10, the void ratio of the LPC was greater than 20%, mainly between 20.9% and 25.9%, which was within the range recommended by ACI 522 [12] to obtain PC with proper permeability. In addition, the permeability coefficient was between 21.8–24.5 mm/s, which met the minimum permeability coefficient (1.4 cm/s) of PC required by ACI 522 [12]. This shows that the prepared matrix had proper viscosity and its dosage was sufficient to stably adhere to the aggregate without clogging the voids of the LPC, as shown in Figure 3.
Furthermore, in order to identify the relationship between the different physical properties of the LPC specimens, a scatter plot of the test results was drawn, as shown in Figure 4. It can be clearly observed from Figure 4 that both the unit weight and permeability coefficient had a nonlinear relationship with the void ratio of the LPC. Among them, the unit weight decreased with the increase in the void ratio, while the permeability coefficient increased with the increase in the void ratio. However, the goodness of fit between the void ratio and permeability coefficient was relatively low, which was mainly due to the significant influence of other pore structure properties on the permeability. This result is consistent with the literature [68]. On the other hand, the typical failure pattern observed from the LPC specimens after the compressive strength, flexural strength, and splitting tensile strength testing are shown in Figure 5. Generally, the failure path of ordinary PC is mainly governed by the cement matrix or interfacial transition zone (ITZ). Compared with ordinary PC, because the strength of the lightweight aggregate was inferior to that of general aggregate, the failure path of the LPC specimens mainly propagated through the cement matrix and aggregate rather than the ITZ. Taking the compressive and splitting tensile strength specimens as an example, as shown in Figure 6, the fracture surfaces showed that a large area of lightweight aggregates was split and obvious cracks appeared, indicating that the specimens were destroyed.

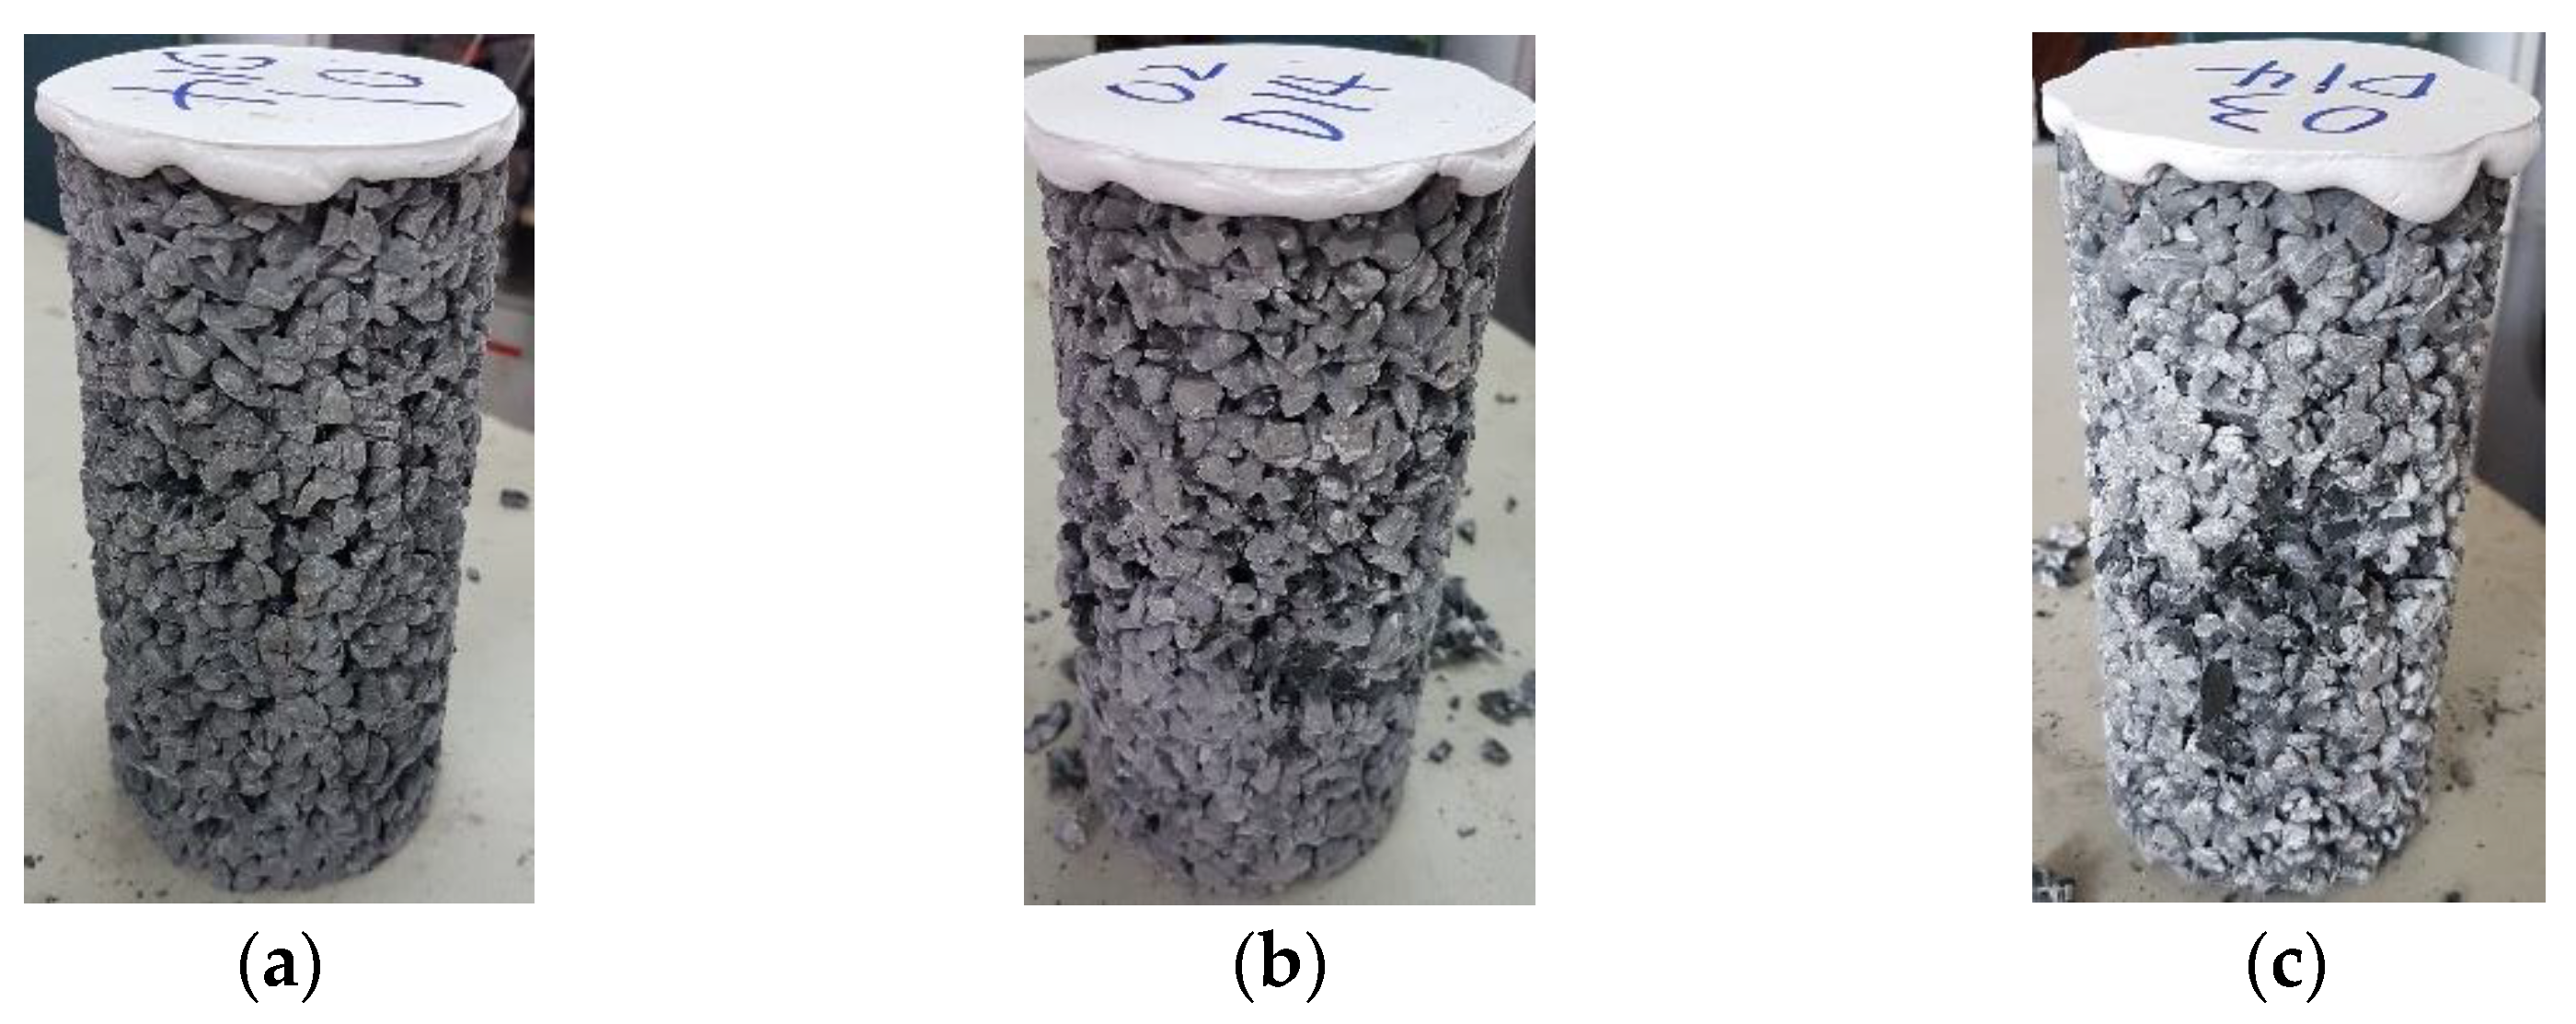
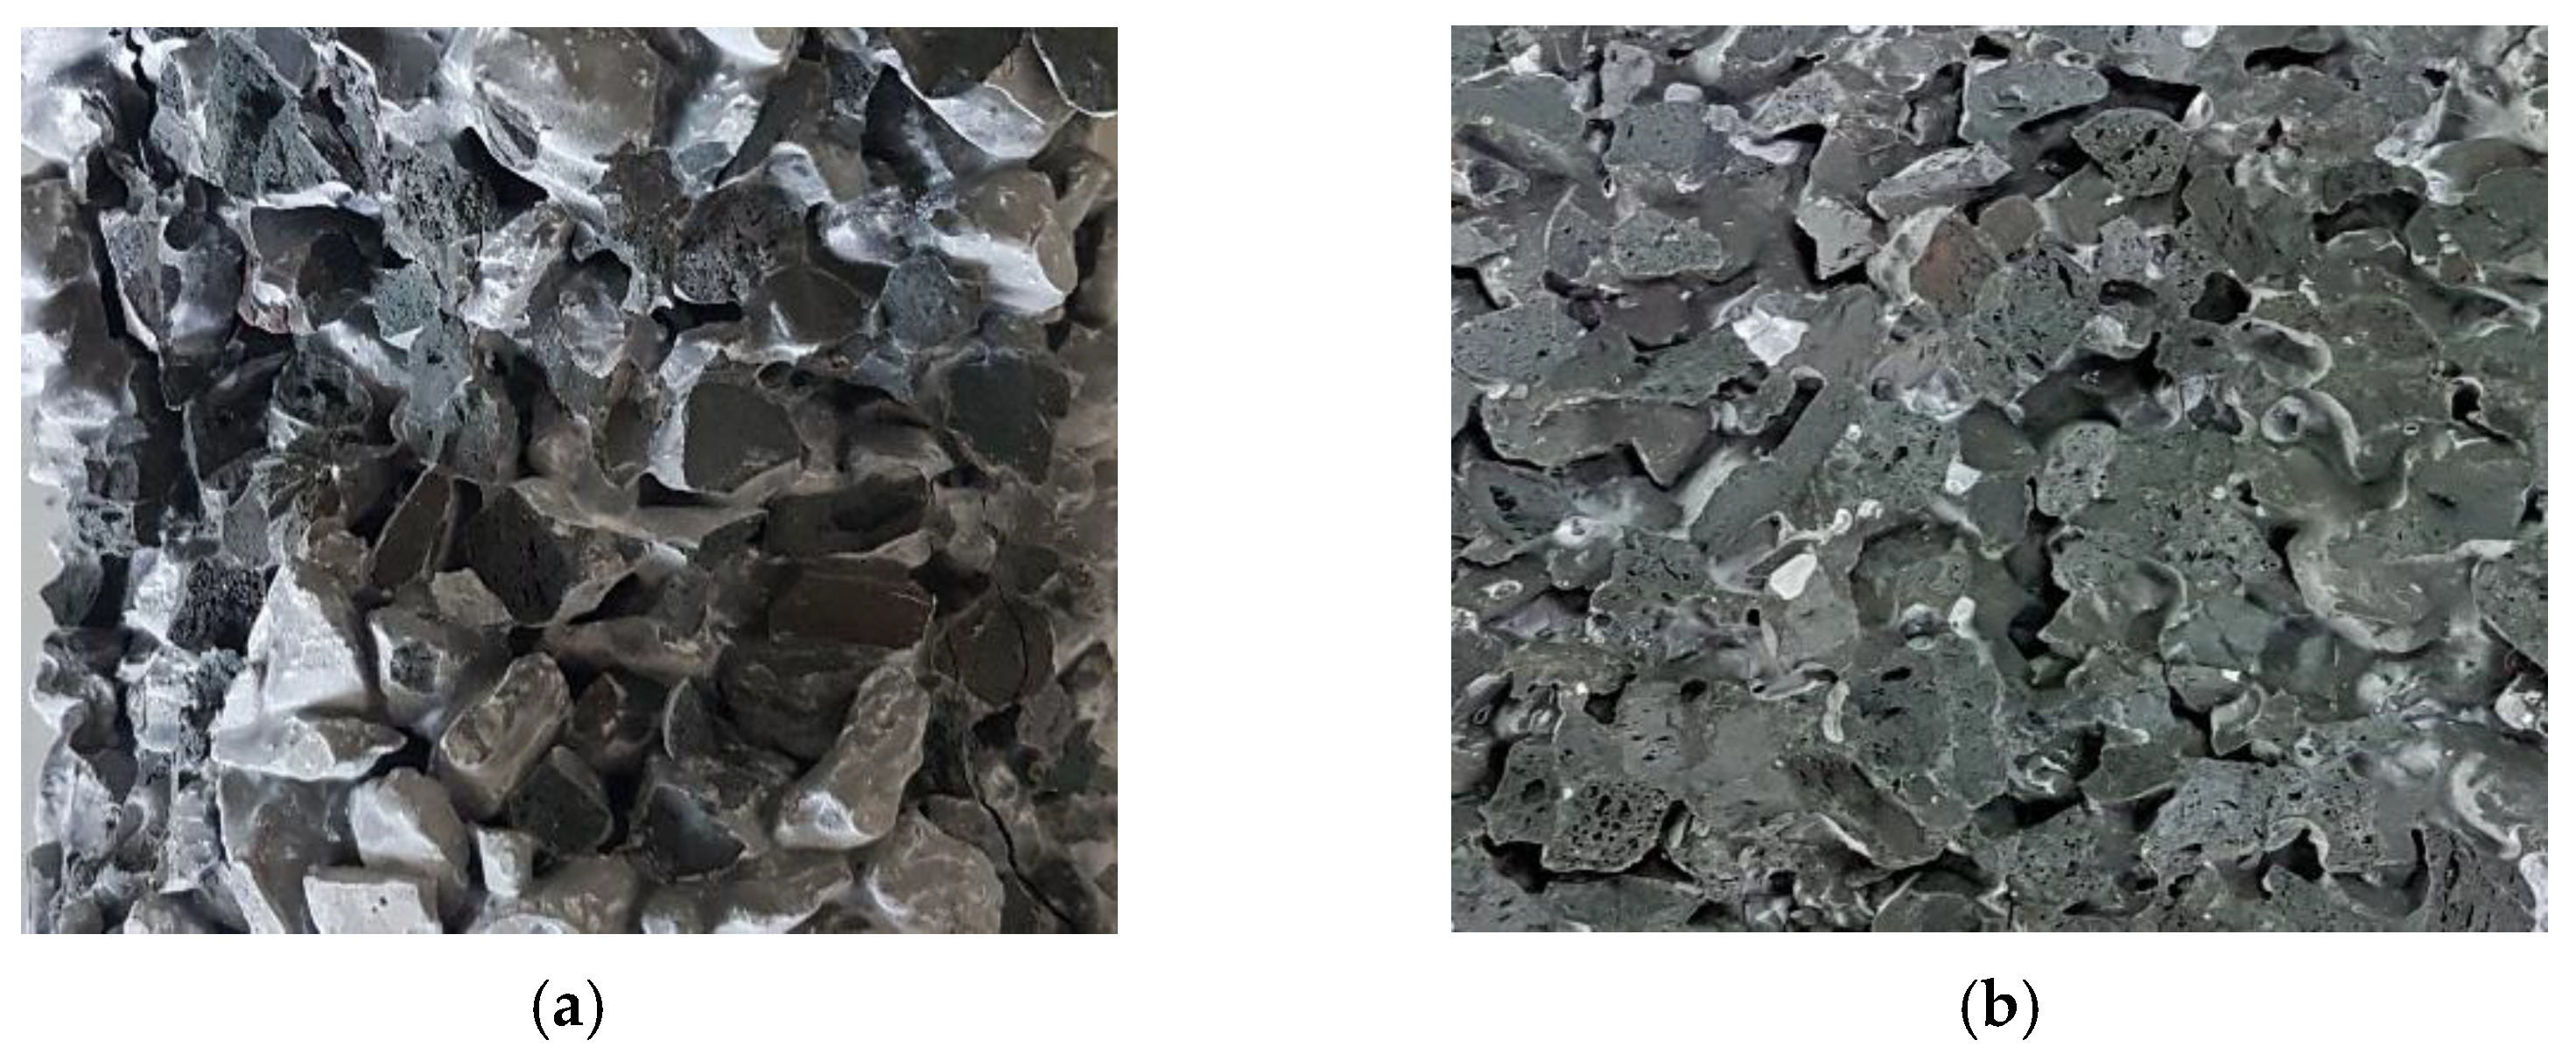
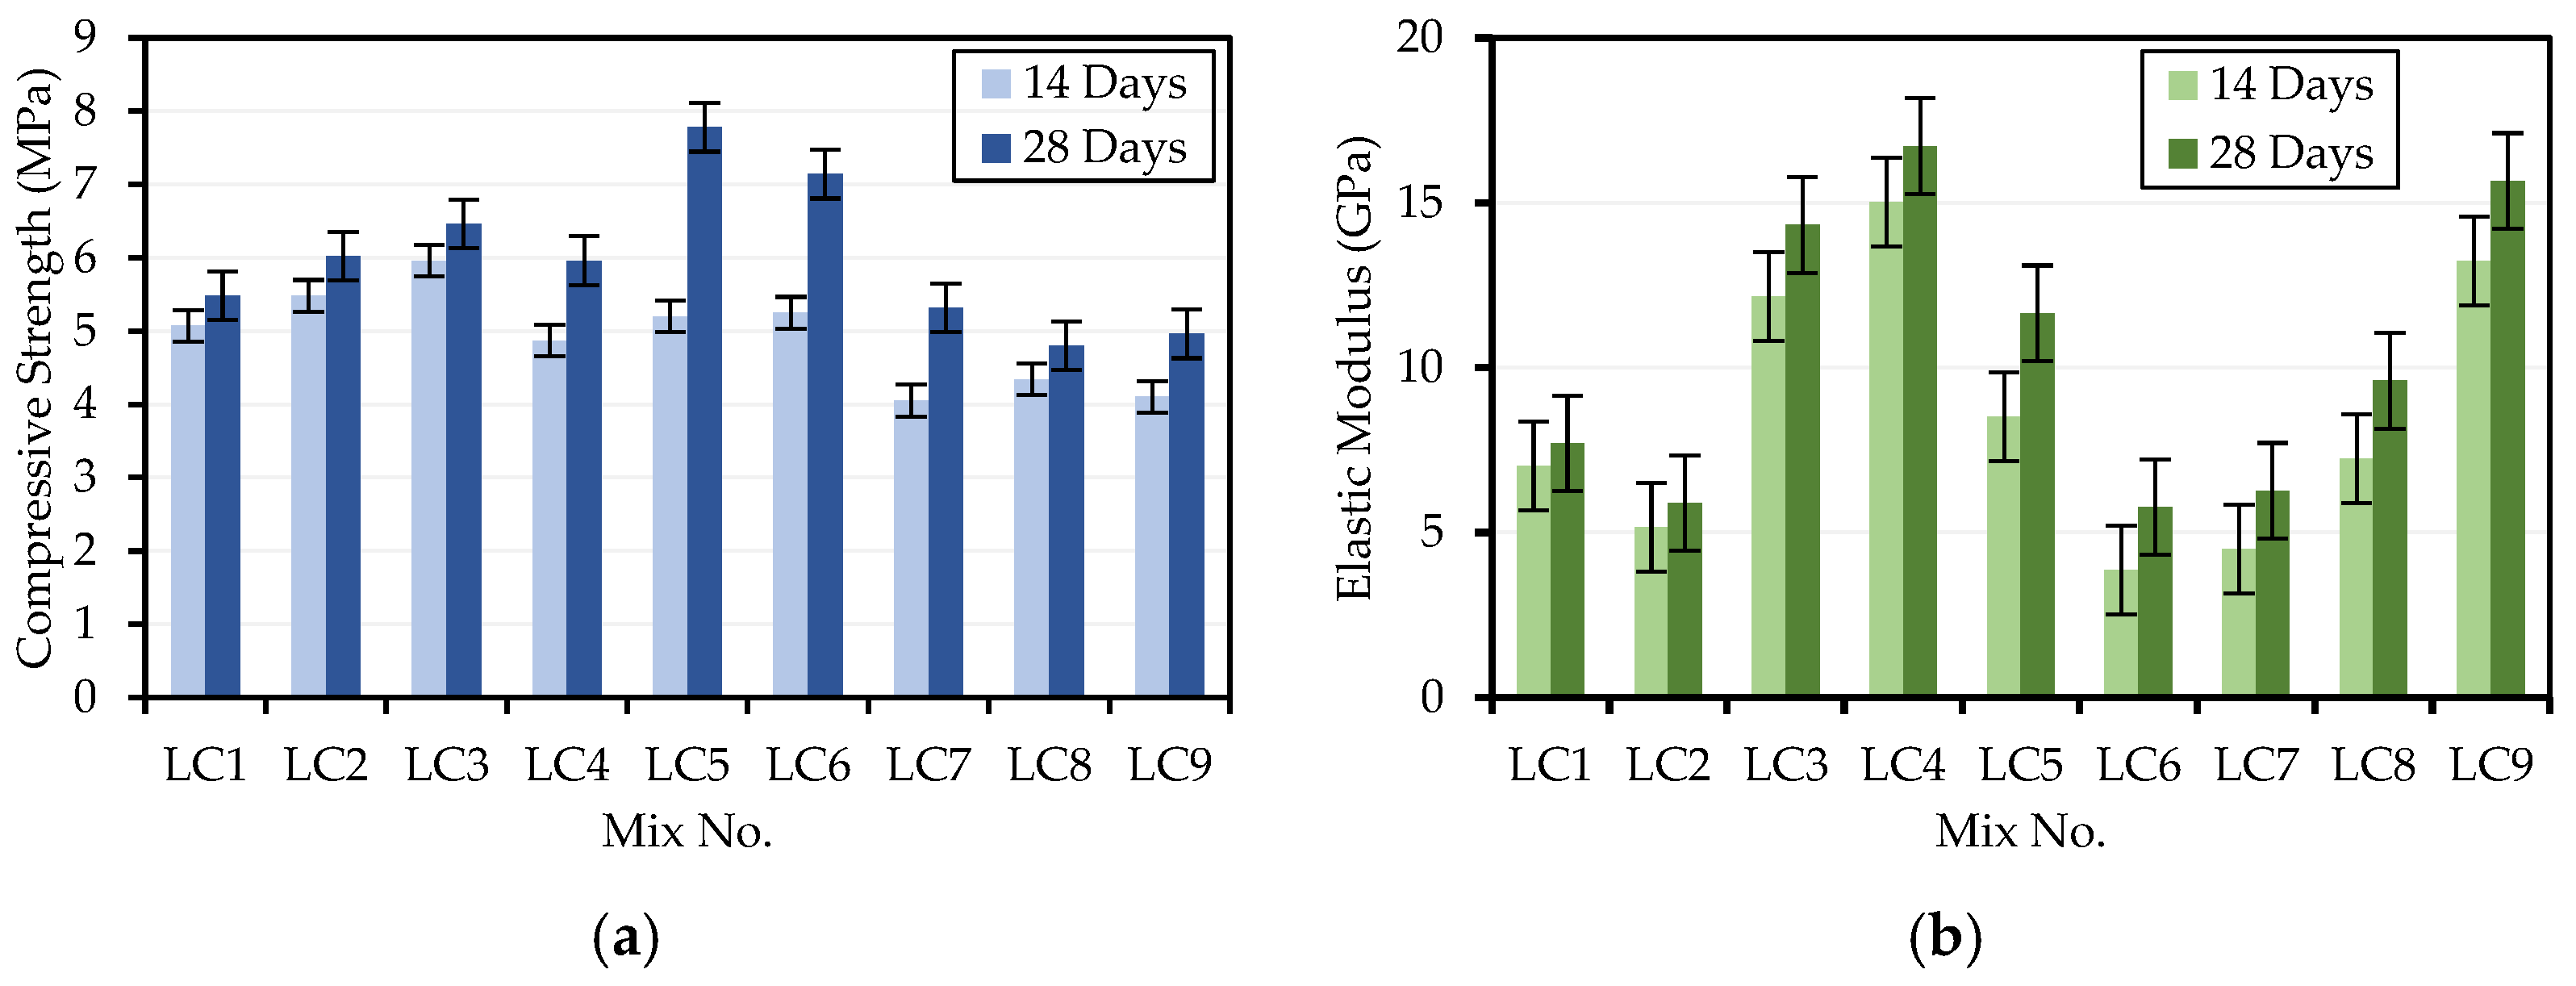
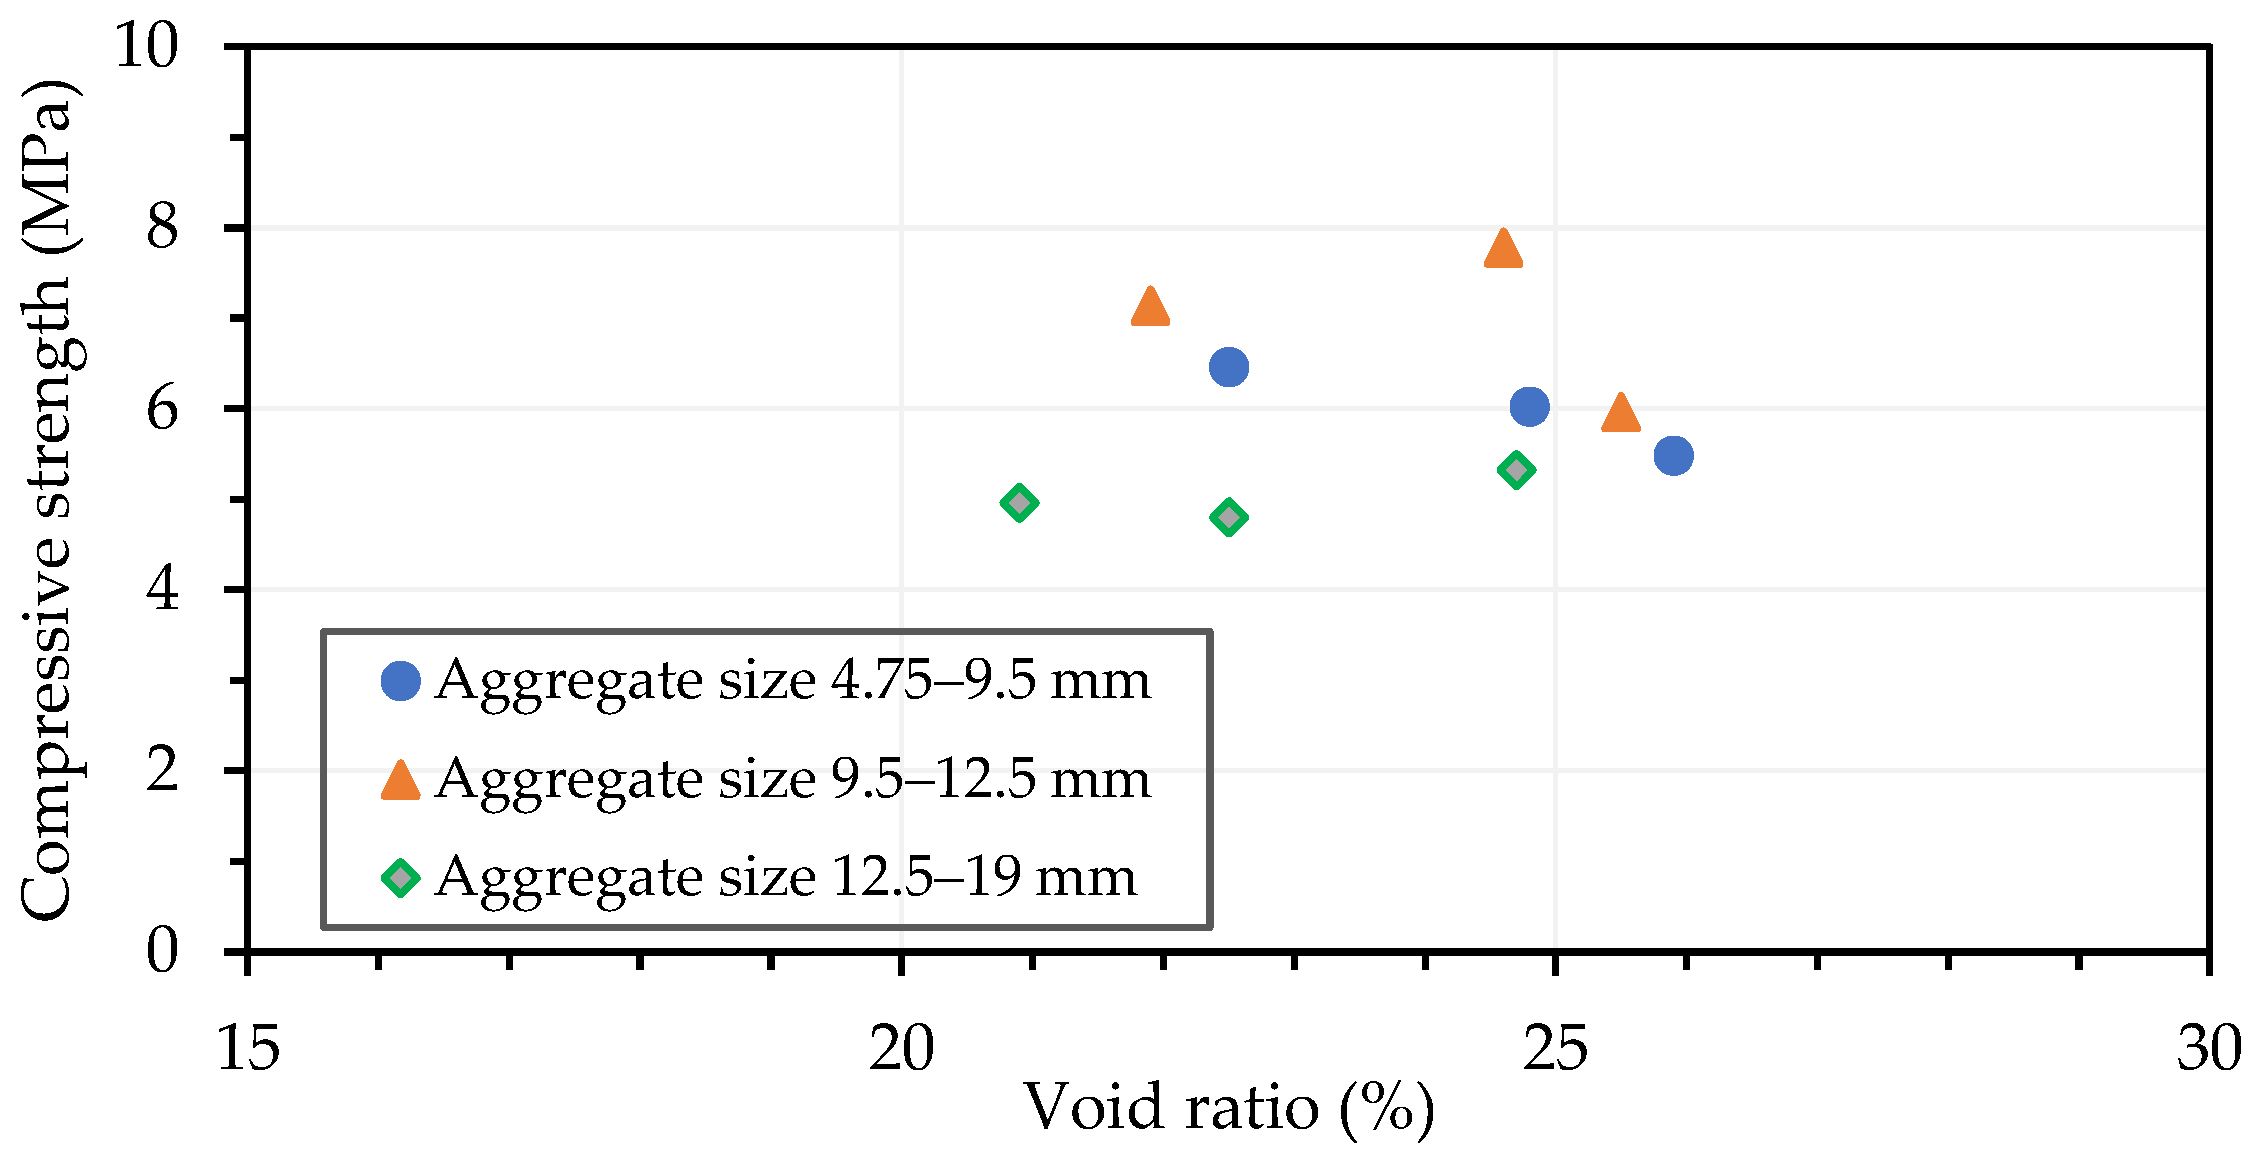
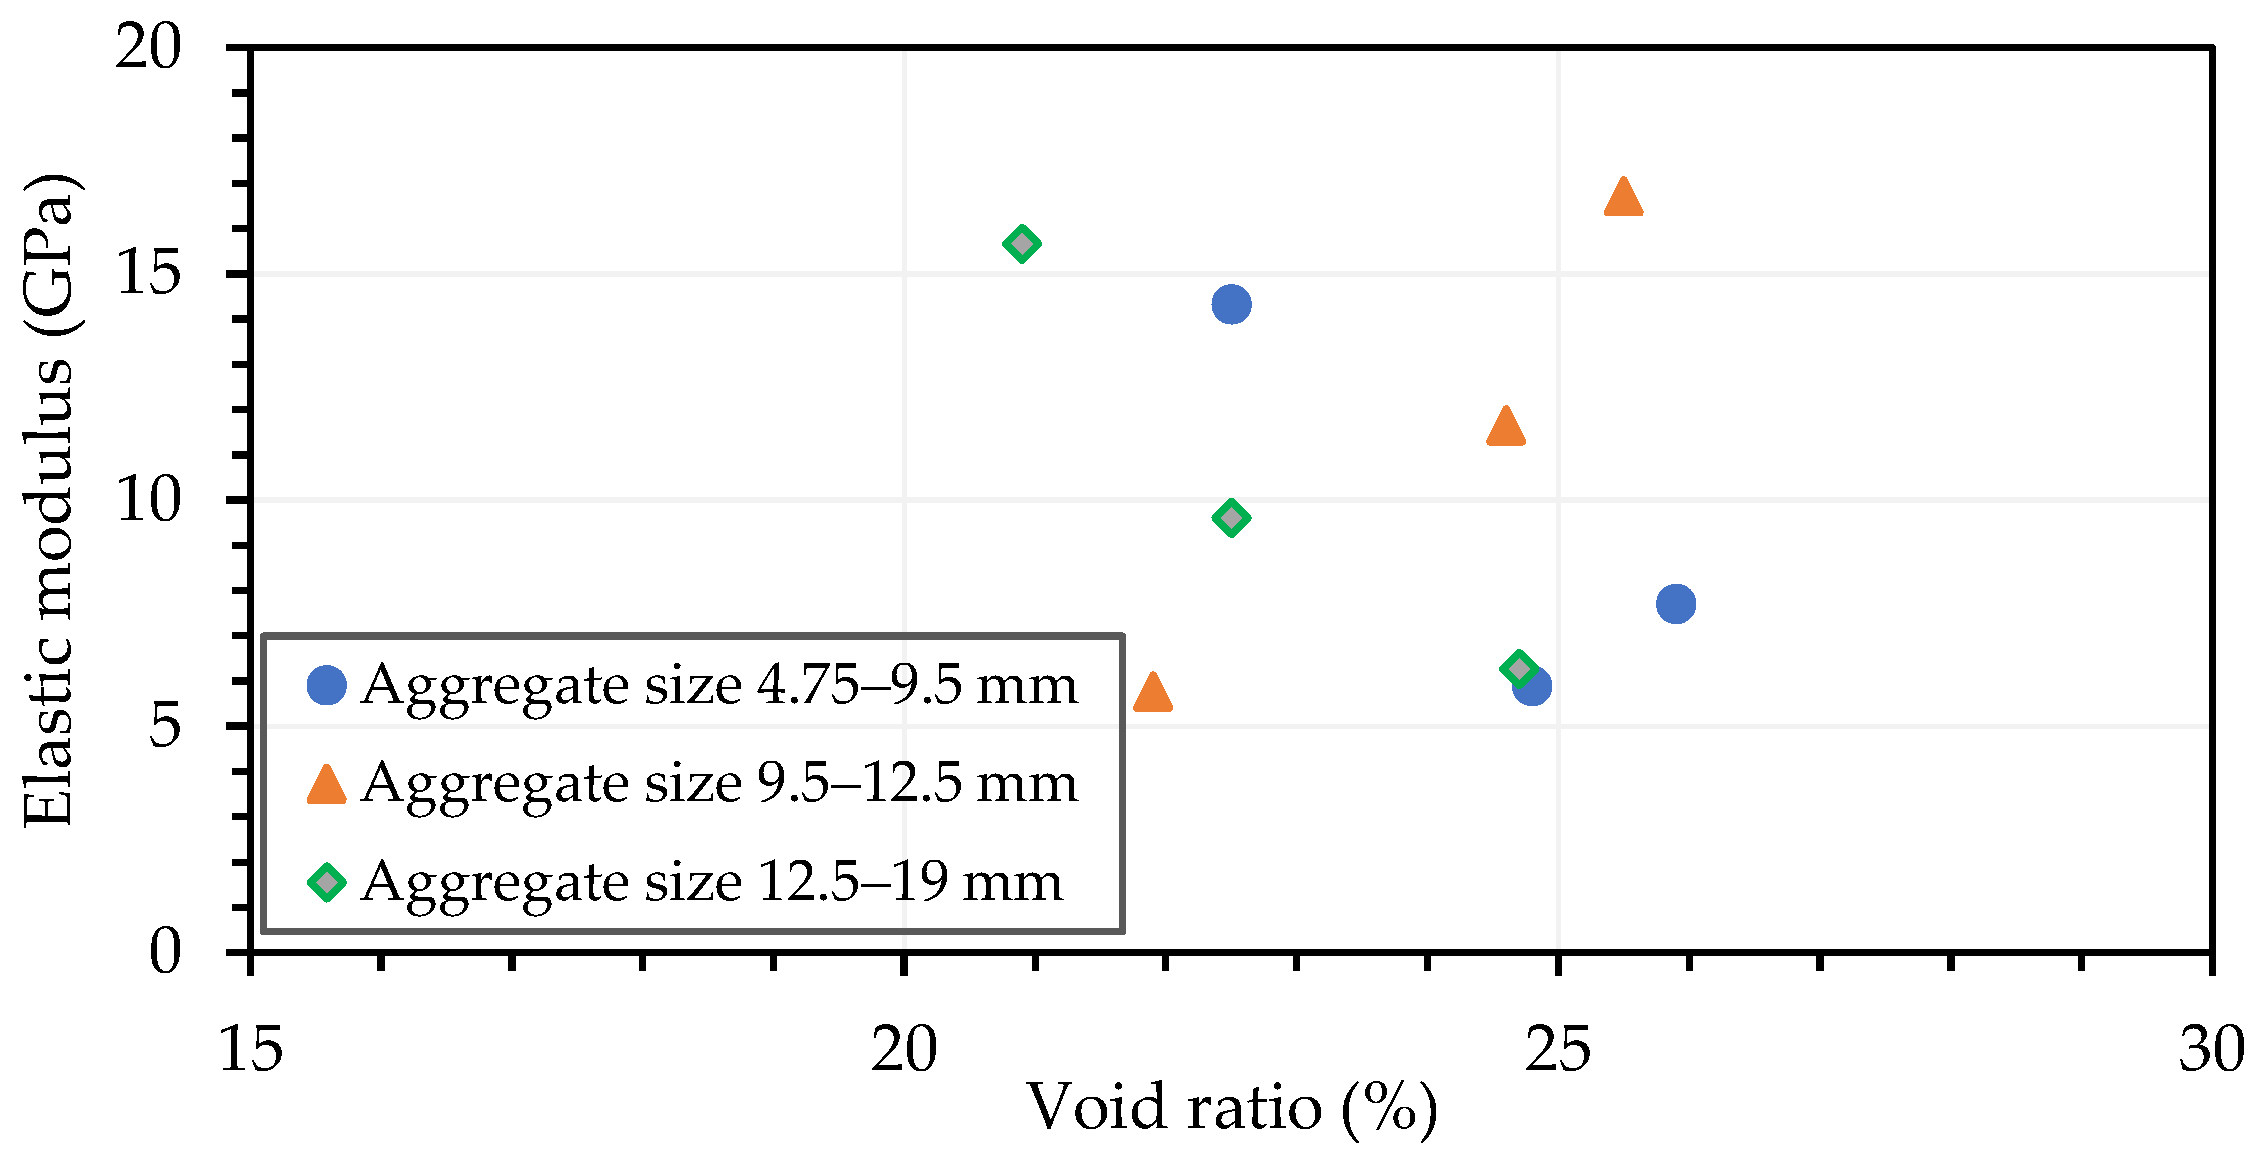
3.2.1. Compressive Strength and Elastic Modulus of the LPC

Table 11 shows that the 14-day compressive strength of each series of LPC was between 4.05 and 5.96 MPa. Among them, the LC2 mix had the lowest compressive strength (4.05 MPa) and the LC3 mix had the highest compressive strength (5.96 MPa). Overall, as the age increased, the compressive strength of each LPC also increased. The 28-day compressive strength of the LPC specimens prepared in this research was between 4.80 and 7.78 MPa, as shown in Table 11. In contrast, it can be seen from Table 2 that the 28-day compressive strength of the LPC prepared with lightweight aggregates by other researchers ranged from 1.80 to 5.99 MPa [46,47]. This result shows that the 28-day compressive strength of the LPC was superior, irrespective of the coarse aggregate size or fine aggregate content used. It can also be observed from Figure 7a that the compressive strength of the LC8 mix was the lowest (4.80 MPa), while the compressive strength of the LC5 mix was the highest (7.78 MPa). On the other hand, as can be seen from Table 11, the elastic modulus of each mixture of LPC at 14 days of age was between 3858 and 15,026 MPa. It can be clearly seen from Figure 7b that the LC6 mix and the LC4 mix had the lowest and highest elastic moduli, respectively. Similarly, as the age increased, the elastic modulus of each LPC also increased. The elastic modulus at 28 days of age was between 5.771 and 16.721 GPa. The average value was about 11.3 GPa, which was about 32% of the elastic modulus of conventional concrete (i.e., 35 GPa). The elastic modulus of the LC6 mix was the lowest (5.771 GPa) and the elastic modulus of the LC4 mix was the highest (16.721 GPa), as shown in Figure 7b. The research results of Alam and Haselbach [69] showed that for cylindrical specimens of PC with a porosity of 15–31%, the elastic modulus ranged from 1 to 16 GPa. However, the research results of Zhong and Wille [70] showed that the elastic modulus of PC with a porosity range of 17–31% was 16.2–22.3 GPa, which was significantly higher than the results of Alam and Haselbach [69].

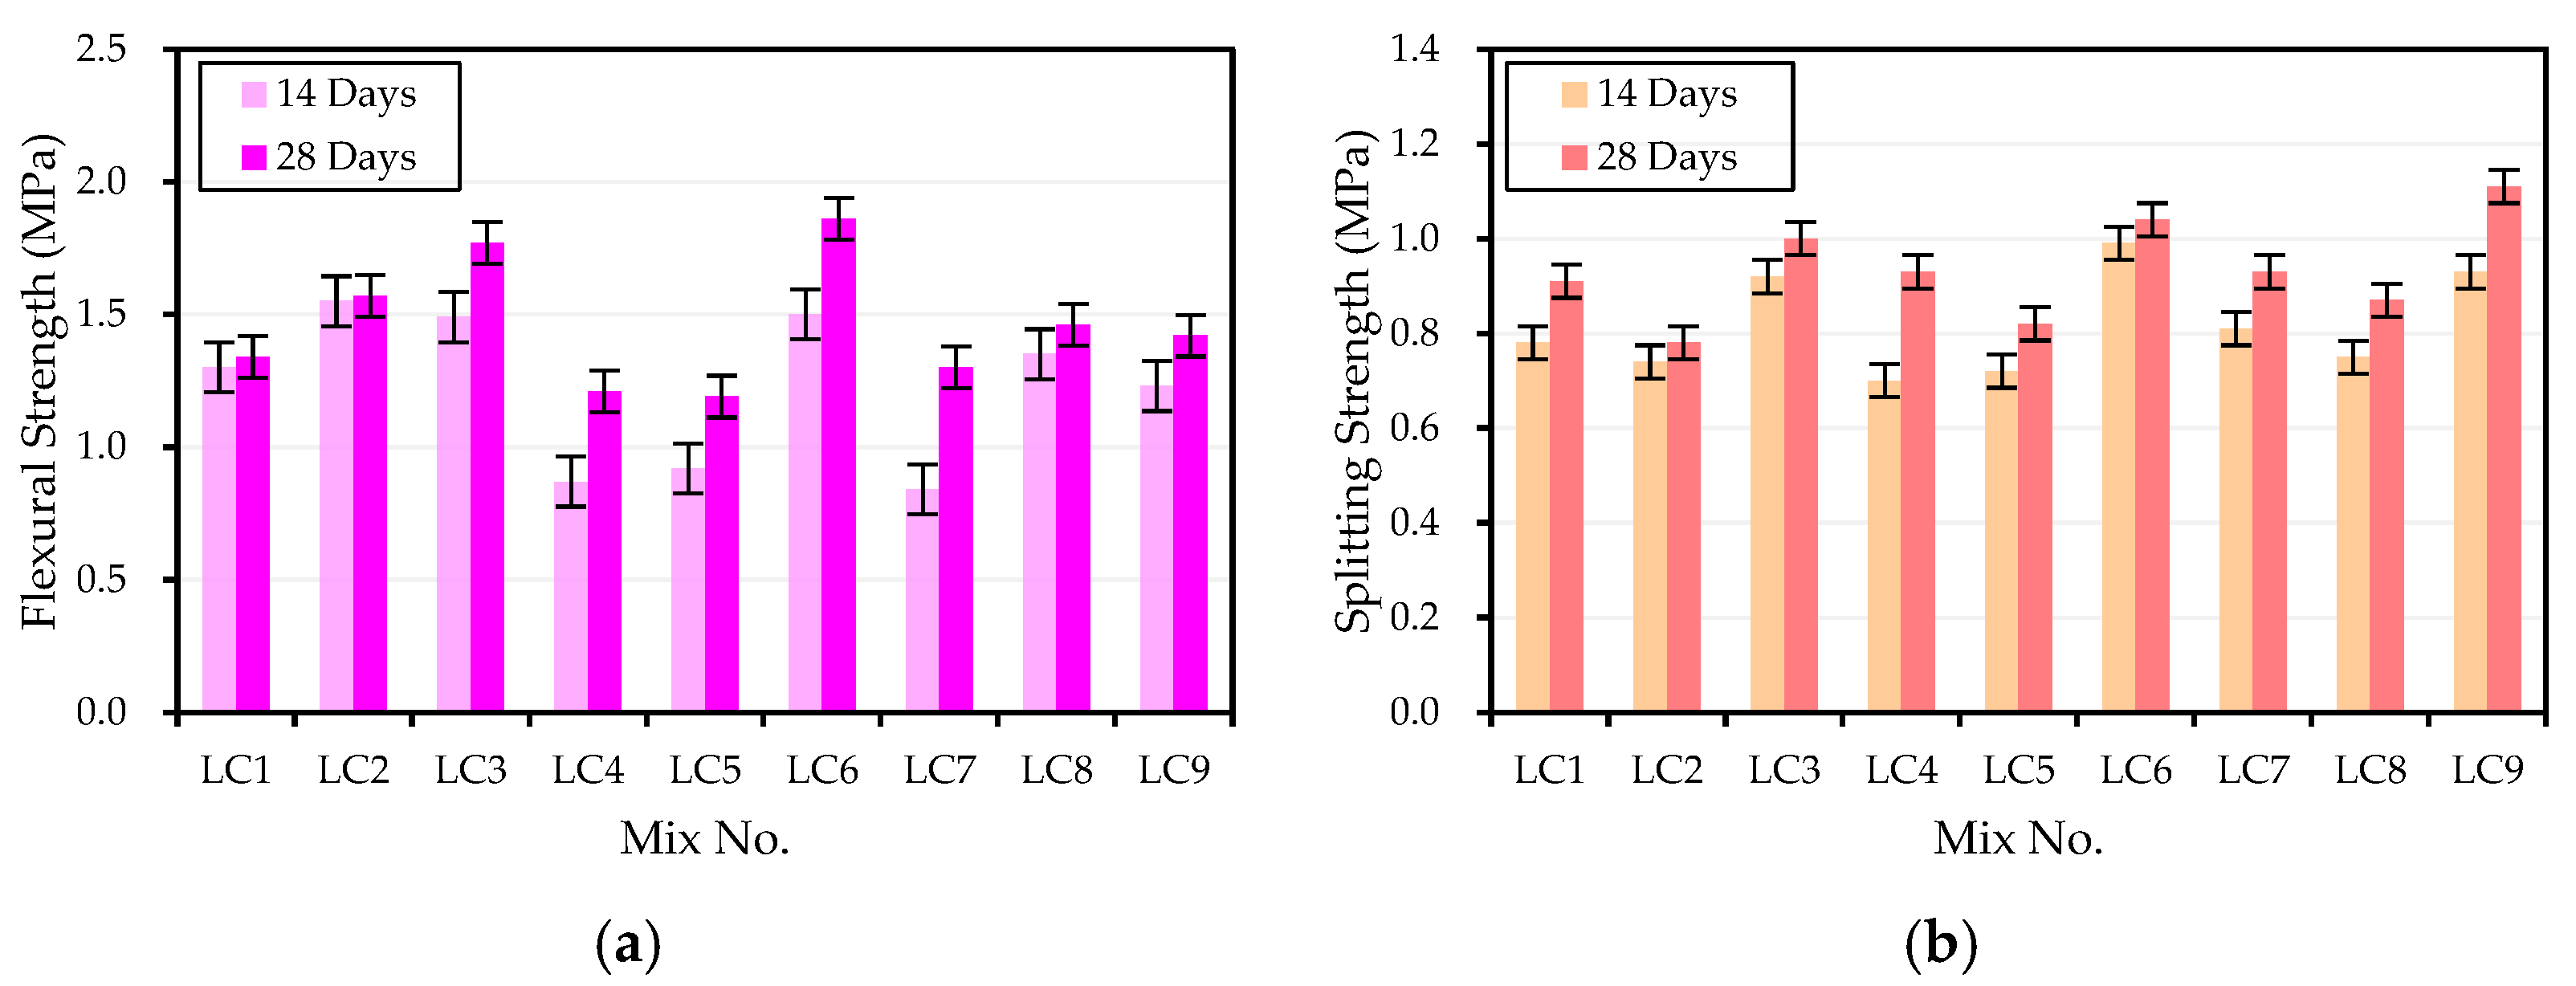
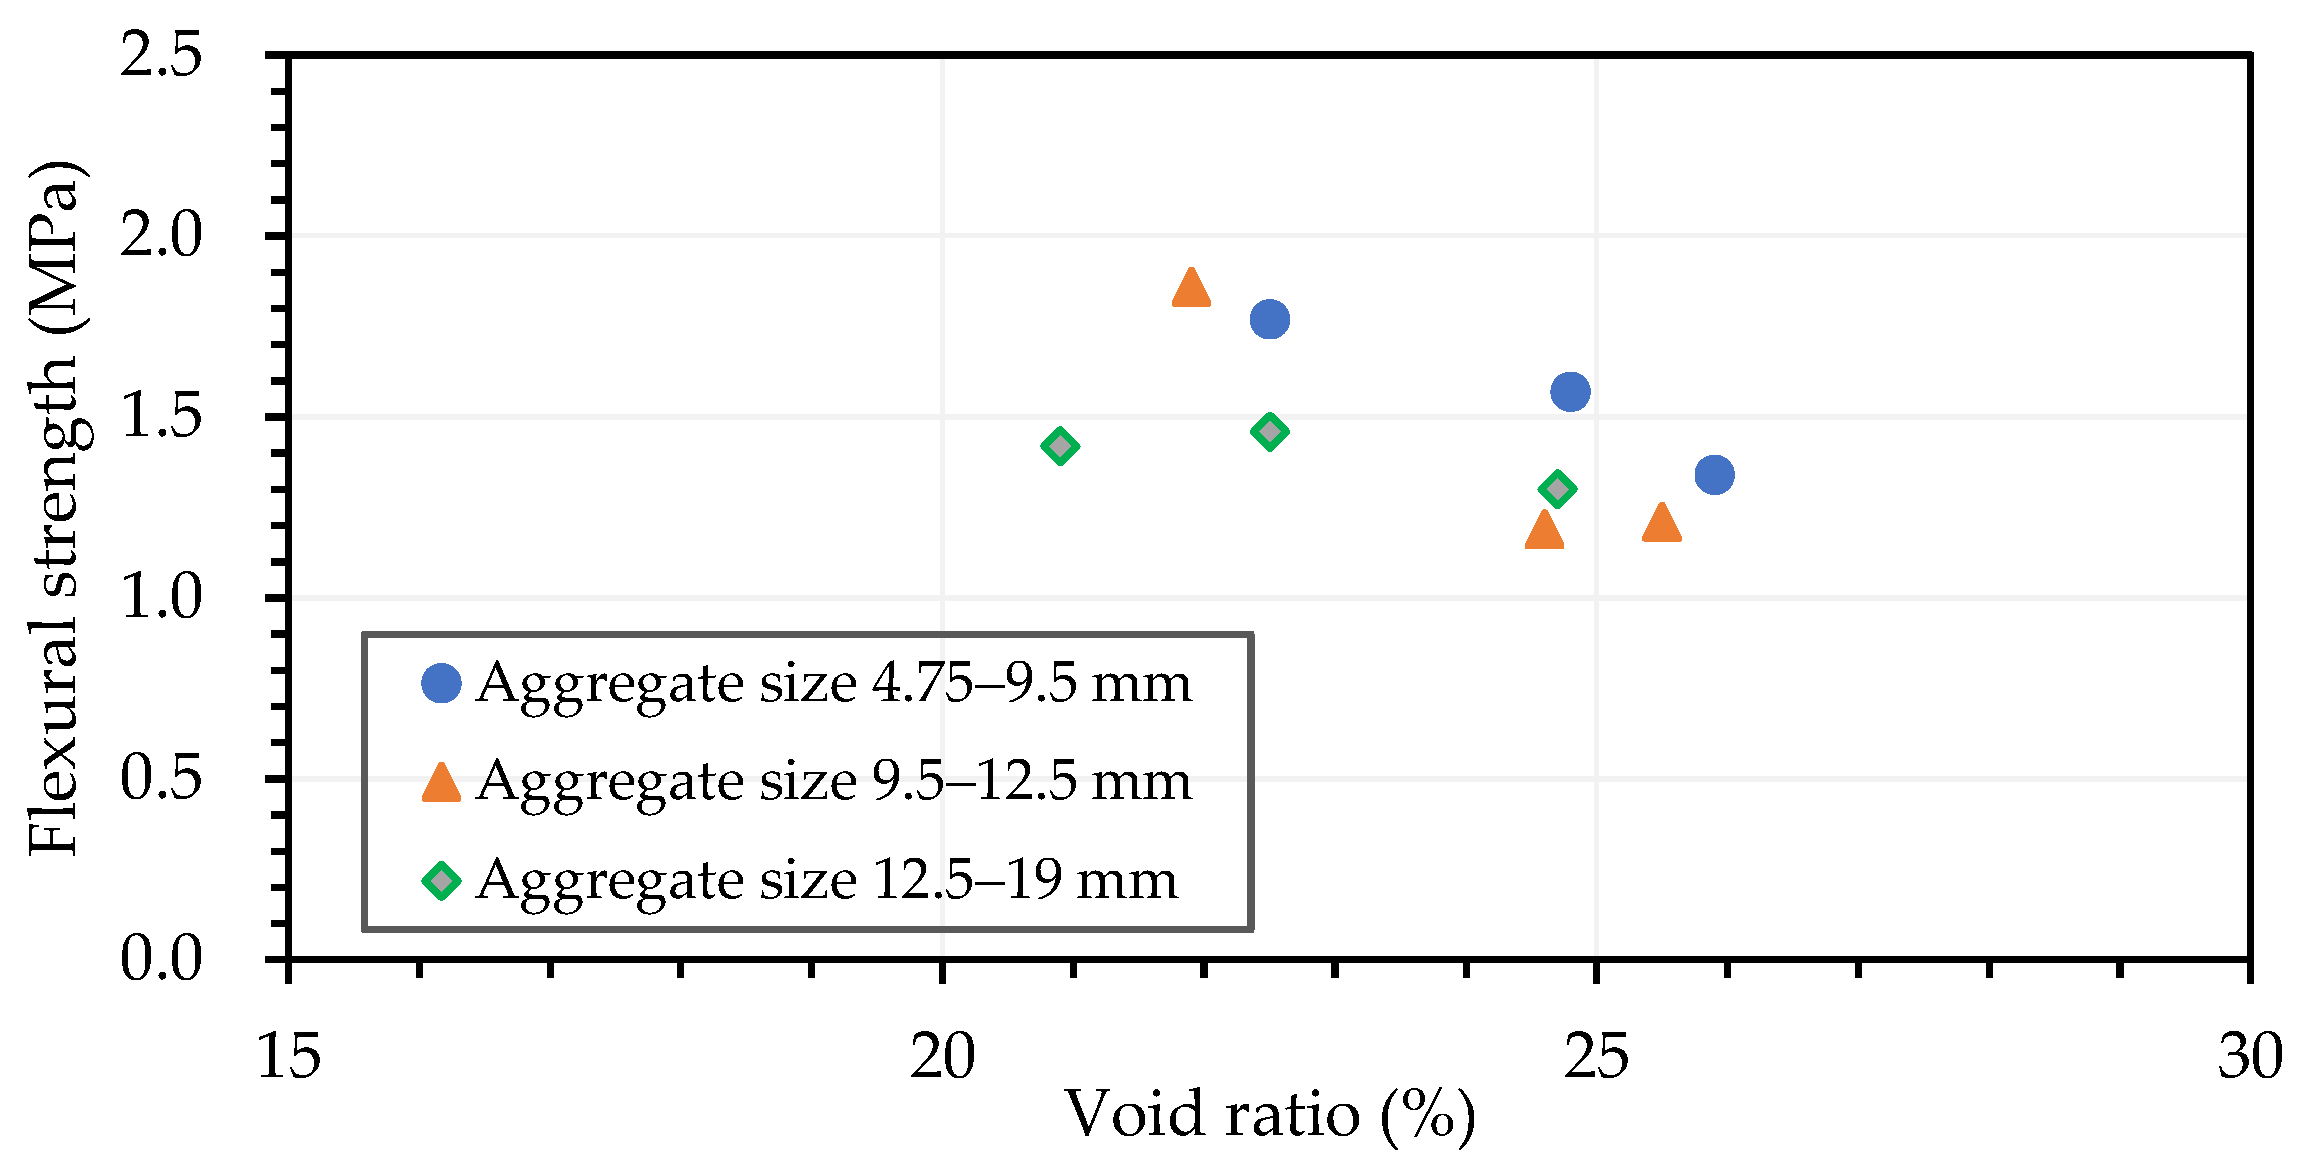
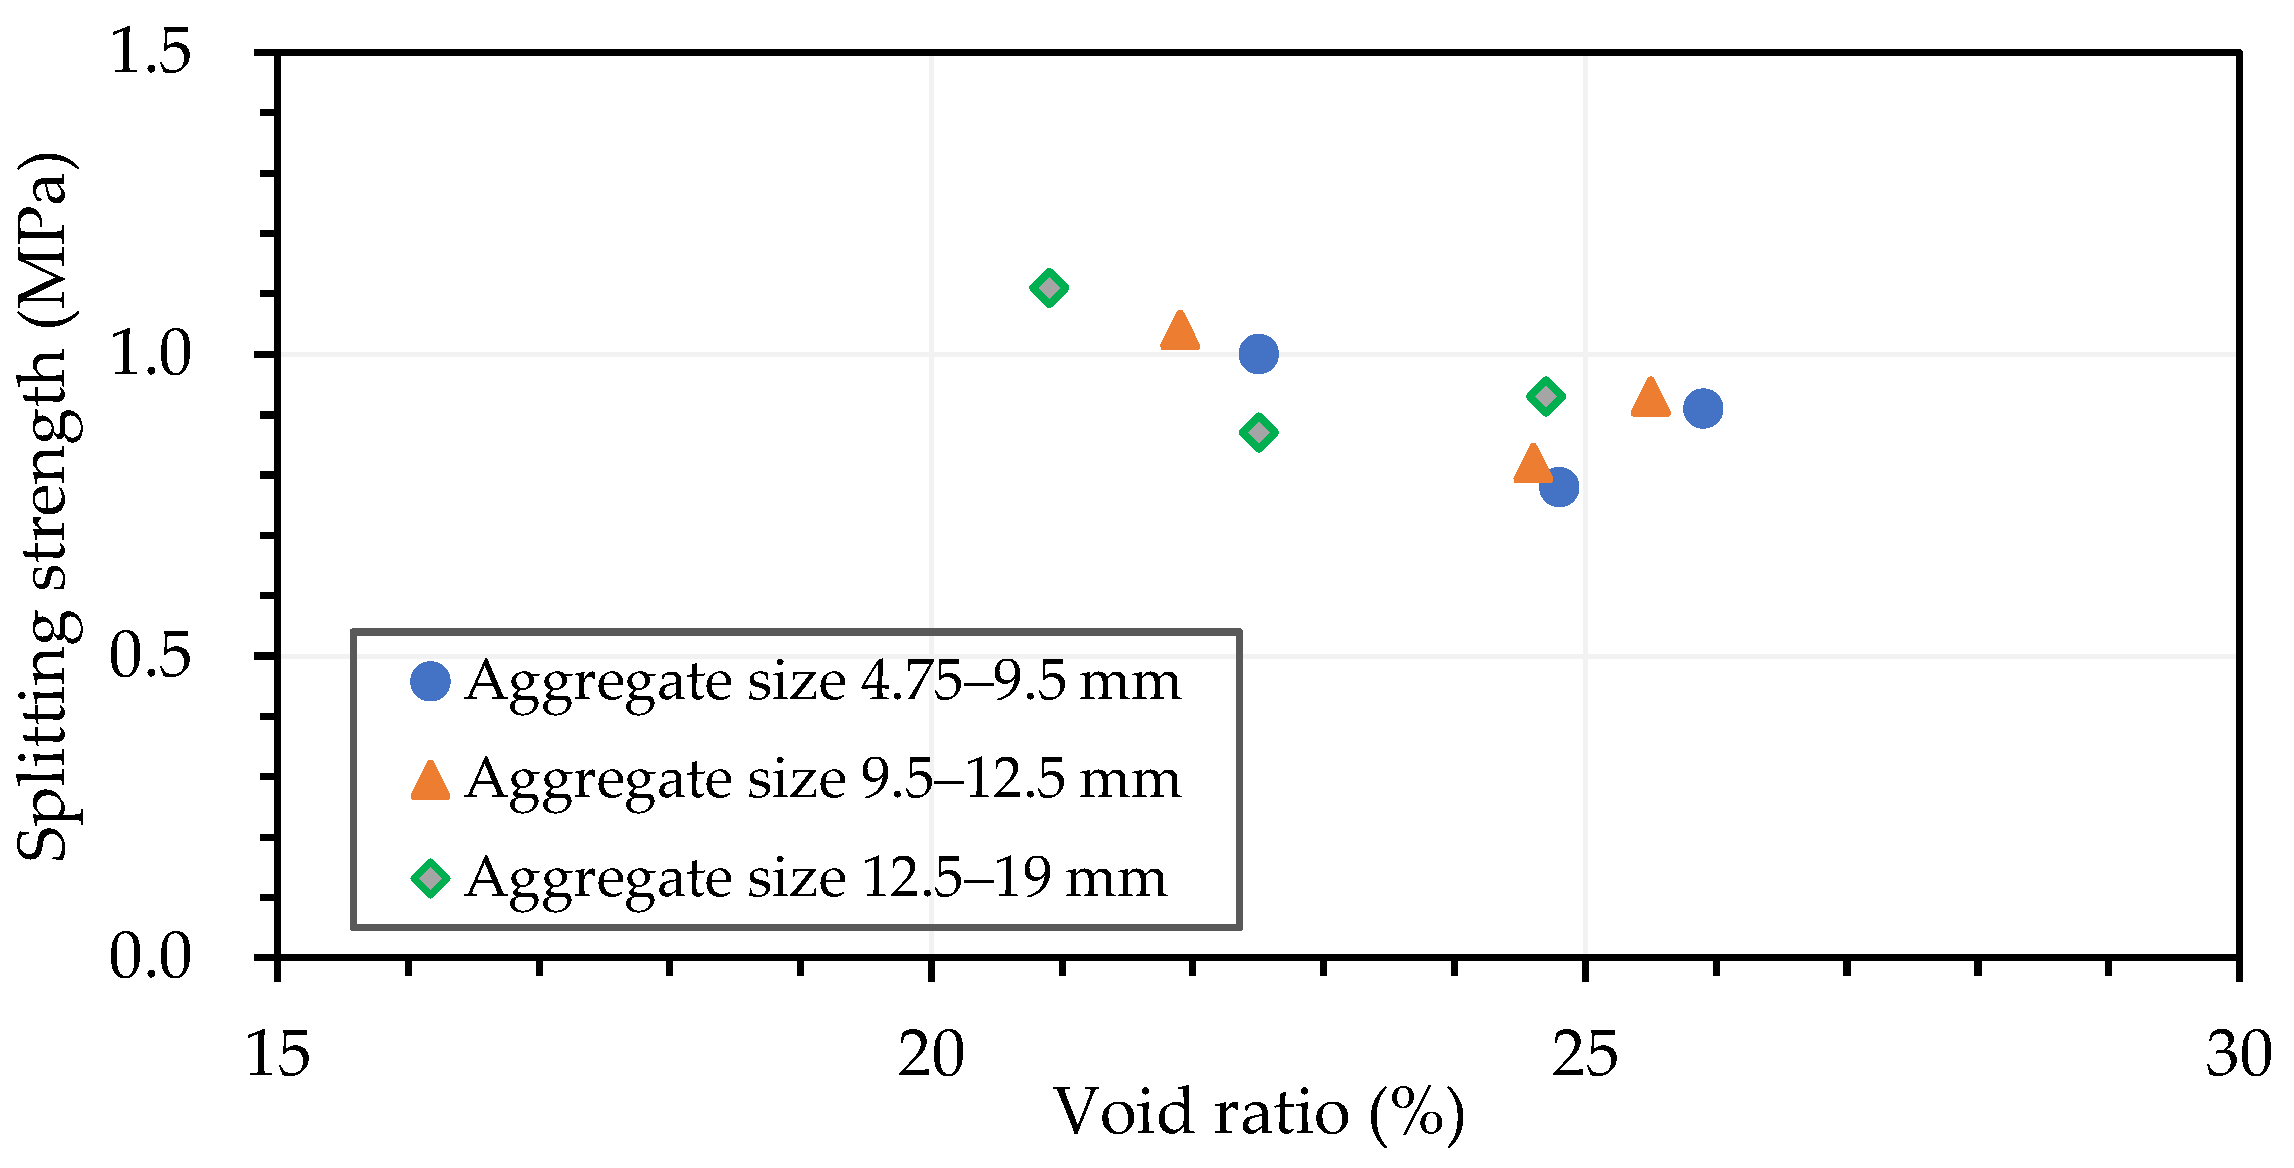
3.2.2. Flexural Strength and Splitting Tensile Strength of the LPC

Flexural strength and splitting tensile strength are commonly used to estimate the tensile strength of concrete, although their results will not be the same. This is mainly due to the different failure mechanisms of the two. Flexural strength is determined by the bending stress at the failure section. However, splitting tensile strength is determined by the pure tensile stress generated along the diameter of the specimen at the point of failure caused by the compressive load. Therefore, split tensile strength is more sensitive to microcracks in the concrete. Table 11 shows that the flexural strength of LPC at 14 days of age was between 0.84 and 1.55 MPa. As is clear from Figure 8a, the flexural strength of the LC7 mix was the lowest (0.84 MPa) and the flexural strength of the LC2 mix was the highest (1.55 MPa). As the age of the specimen increased from 14 days to 28 days, the flexural strength also increased. The flexural strength at 28 days of age was between 1.19 and 1.86 MPa, as shown in Table 11. In contrast, the 28-day flexural strength of LPC prepared by other researchers ranged from 0.5 to 1.4 MPa, as shown in Table 2 [46,47]. This result clearly shows that the 28-day flexural strength of the LPC prepared in this study was relatively good. The reason should be the polypropylene fiber used in this study. In addition, the flexural strength of the LC5 mix was the lowest (1.19 MPa) and the flexural strength of the LC6 mix was the highest (1.86 MPa), as shown in Figure 8a.
As for the splitting tensile strength, it can be seen from Table 11 that the splitting tensile strength of the concrete at 14 days of age was between 0.70 and 1.11 MPa. It is clearly seen from Figure 8b that the LC4 mix had the lowest splitting tensile strength (0.70 MPa) and the LC6 mix had the highest splitting tensile strength (0.99 MPa). Similarly, as the age of each specimen increased from 14 days to 28 days, the splitting tensile strength also increased. At 28 days of age, the splitting tensile strength was between 0.78 and 1.11 MPa, and its average value was about 64% of the average flexural strength. Similarly, compared with other researchers, the 28-day splitting tensile strength of the LPC prepared with different lightweight aggregates ranged from 0.5 to 1.4 MPa, as shown in Table 2 [46,47]. In view of this, the 28-day splitting tensile strength of the LPC prepared in this study was still relatively good due to the use of polypropylene fiber. The ratio of the 28-day splitting tensile strength to the 28-day compressive strength ranged from 11% to 22%, with an average of 16.5%. They were higher than those of the PC containing natural aggregate, which ranged from 9–14% [44]. Furthermore, the LC2 mix had the lowest splitting tensile strength (0.78 MPa) and the LC9 mix had the highest splitting tensile strength (1.11 MPa), as shown in Figure 8b.

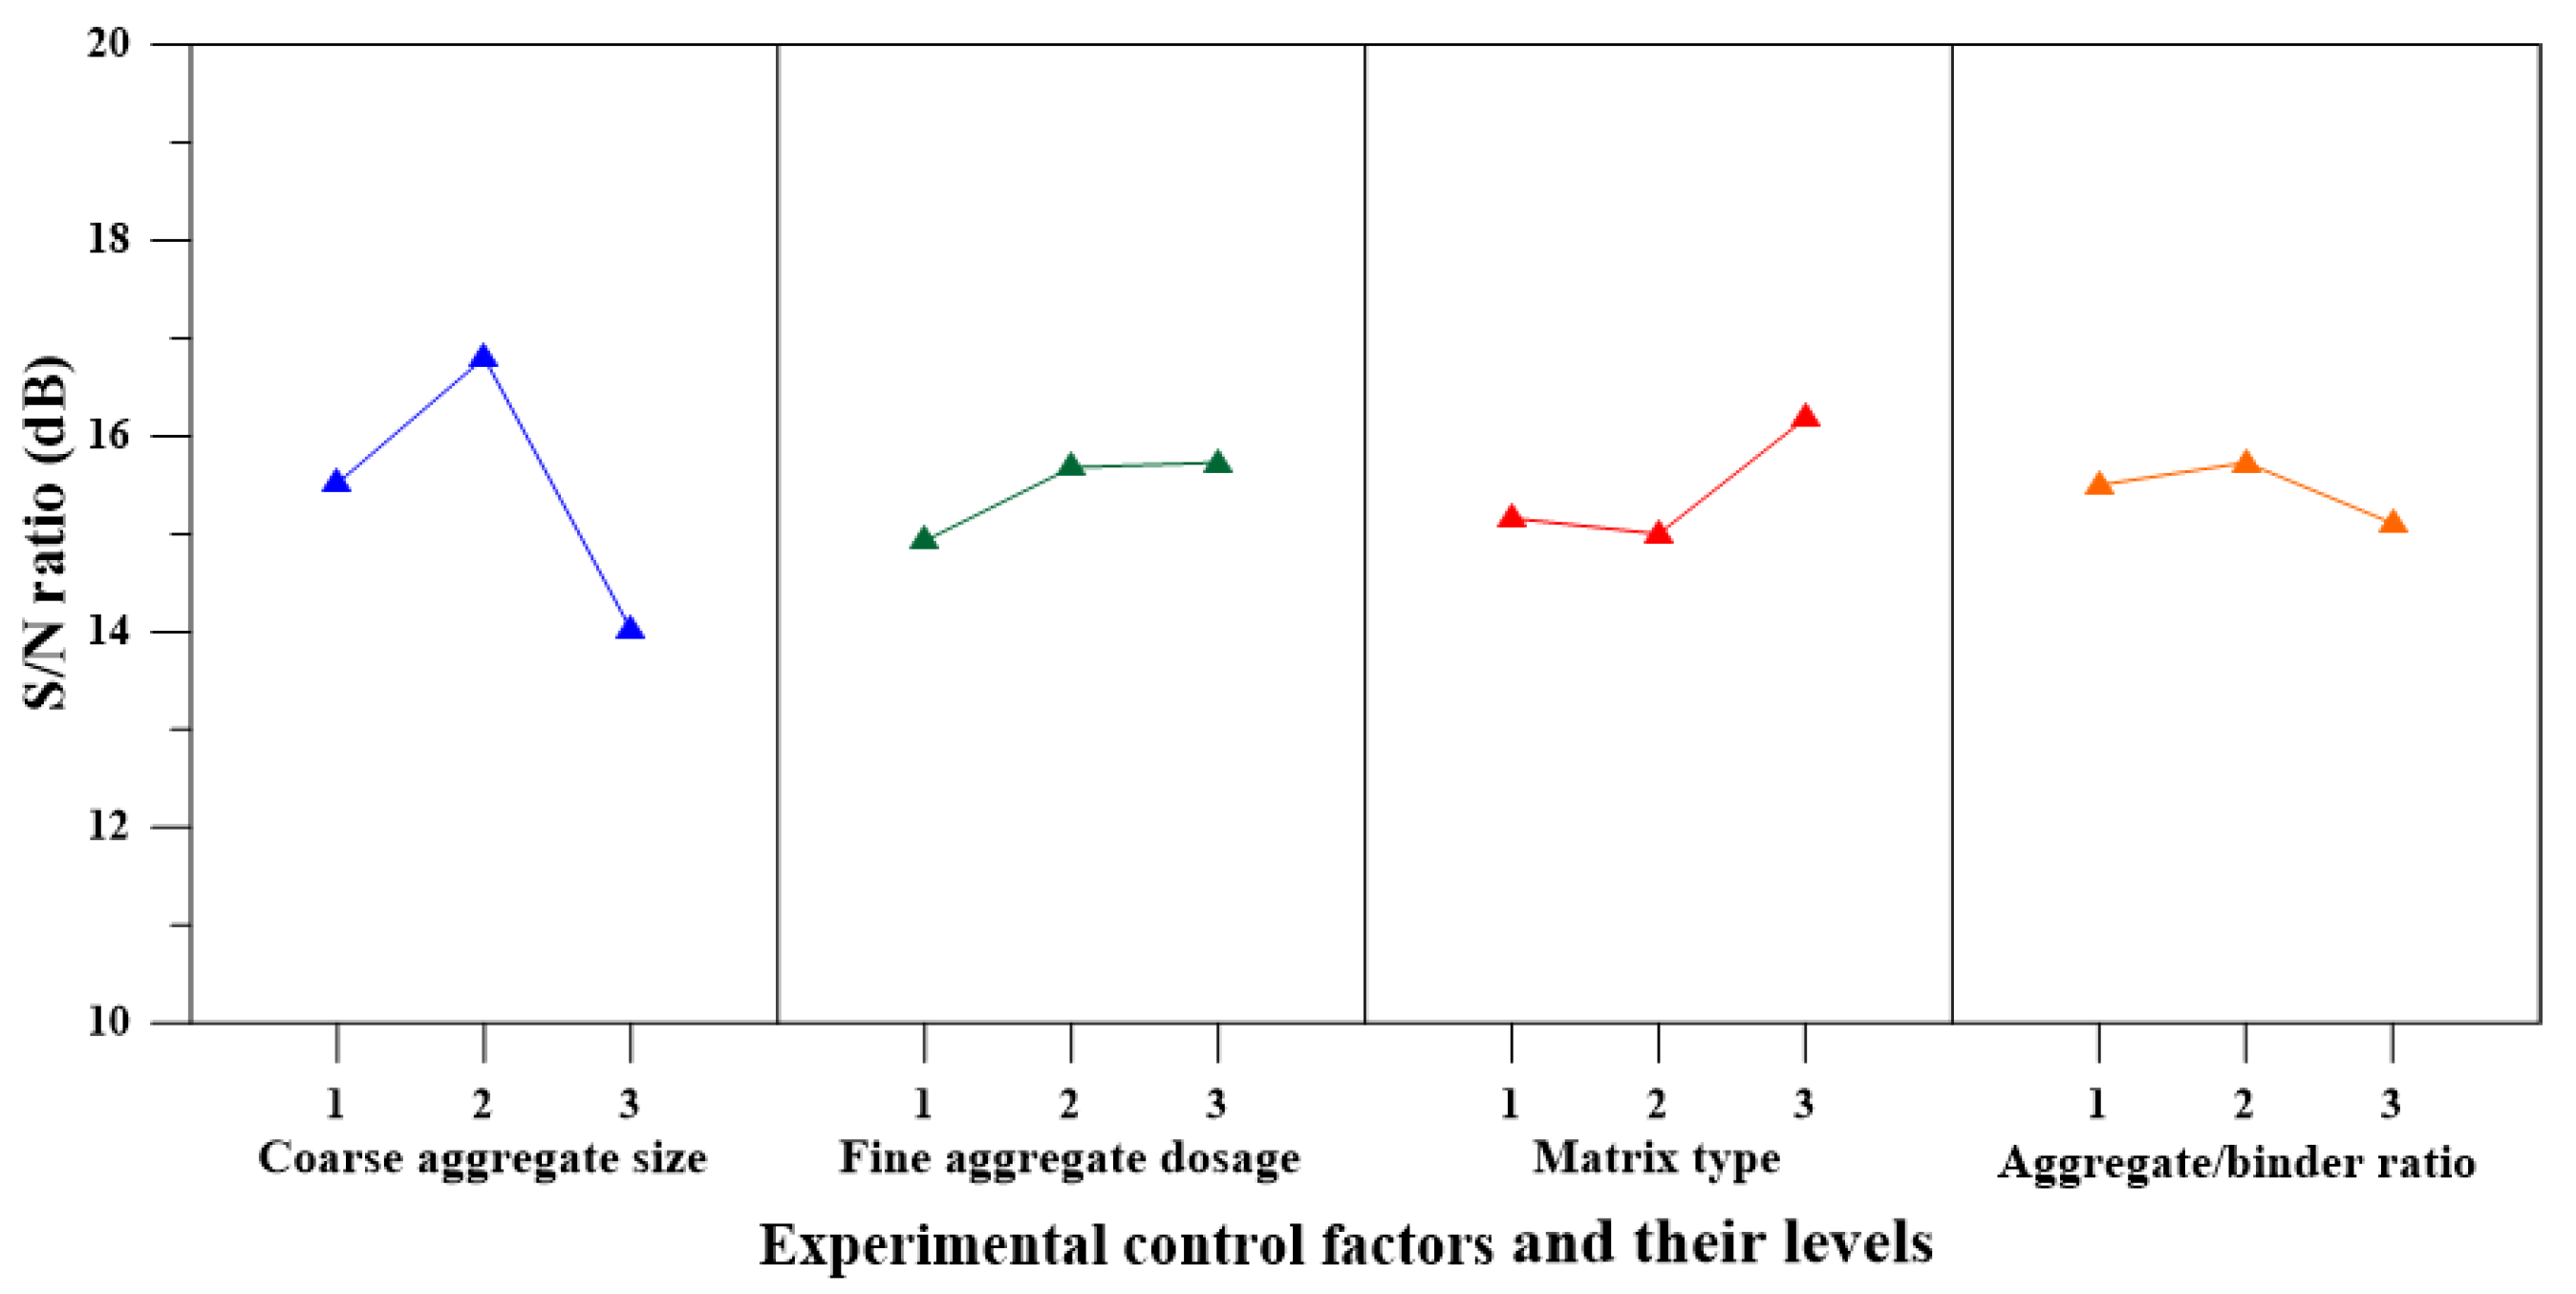
3.3. Range Analysis and Analysis of Variance

The rationale behind the experimental design mainly included two aspects: one was to emphasize the integrity and efficiency of the experimental plan (i.e., how to conduct effective and economical experiments for the purpose of the experiment), and the other was concerned with the analysis of experimental observations, mainly by analyzing the data obtained from the experiment by appropriate methods, and then judging the results. Therefore, for each experimental factor, its impact on the performance of LPC was evaluated using range analysis and analysis of variance. Basically, this was achieved by separating the total variability of the S/N ratios into contributions by each of the process parameters and the error [71]. Table 12 lists the 28-day test results of the LPC and the corresponding S/N. Furthermore, we calculated the average value of the S/N ratio of each factor at the same level and calculated the main effect value (delta) of the factor level. In this way, these data can be made into an auxiliary table, as shown in Table 13. On the other hand, the relative contribution of different control factors in describing the mechanical properties of LPC mixtures was performed using analysis of variance (ANOVA) tests [72]. In addition, the application of the statistical F test can determine which process parameters had a significant impact on performance characteristics. The results of the ANOVA and F test are represented in Table 14. Among them, the contribution of each factor was obtained by dividing the sum of the squares of each factor by the total sum of the squares.

3.3.1. Range Analysis and ANOVA of Compressive Strength

Table 13 lists the mean S/N ratio of the compressive strength factor for each level and Figure 9 shows the S/N response graph of the compressive strength. It can be seen from the delta value in Table 13 and the mean S/N ratio in Figure 9 that the coarse aggregate size was the significant factor in controlling the compressive strength. In this study, the sizes of coarse aggregates ranged from 4.76 to 19 mm, consisting of three single-sized gradations. As the coarse aggregate size increased, the compressive strength increased and then decreased. In other words, when the coarse aggregate size was the second level (9.5–12.5 mm), the value of the compressive strength was the highest.
The comparison of the compressive strength and void ratio for different aggregate gradations is presented in Figure 10. However, due to the interaction of other control factors, there was no clear relationship between the void ratio and coarse aggregate size. As a result, it can be observed from Figure 10 that the relationship between the compressive strength and void ratio was highly dispersed, irrespective of any coarse aggregate size. This correlation led to the conclusion that although the void ratio was an influencing factor, the void ratio alone was relatively insufficient to predict the compressive strength of the LPC. In fact, the influence of aggregate size on the compressive strength of PC shows great differences in the literature. Yu et al. [73] studied the compressive strength of permeable concrete prepared with eight different aggregate sizes, but their porosity was 20%. Their results showed that the compressive strength of PC with an aggregate size between 2.36 and 4.76 mm was the lowest, while the compressive strength of PC with an aggregate size between 10 and 15 mm was the highest. A study by Ćosić et al. [74] showed that under constant porosity, the compressive strength of PC with 60% 8–16 mm and 30% 4–8 mm aggregates was 21% higher than that of PC with 60% 4–8 mm and 30% 8–16 mm aggregates. Deo and Neithalath [75] tested PC specimens made of single-sized aggregates (i.e., 2.38, 4.76, and 9.51 mm). Their results showed that due to the larger number of pores, smaller aggregate sizes lead to lower strength. However, some studies showed the opposite results [76,77], that is, the use of smaller aggregate sizes leads to a decrease in porosity and an increase in compressive strength. It can be seen from the above that the influence of aggregate size on the compressive strength of PC is still inconclusive in the literature, mainly due to its influence on porosity, which is negatively correlated with strength [78]. On the other hand, the ANOVA and F test results of the compressive strength in Table 14 confirmed that the lightweight coarse aggregate size was the most important factor that affected the compressive strength of the LPC. The contribution percentages of these factors were coarse aggregate size (69.63%), matrix type (26.53%), and fine aggregate content (3.84%). From the above results of the S/N ratio and analysis of variance analyses, the optimal combination level of the experimental control factors for achieving maximum compressive strength was A2B3C3D2, i.e., the coarse aggregate size at level 2, fine aggregate content at level 3, matrix type at level 3, and aggregate to binder ratio at level 2.

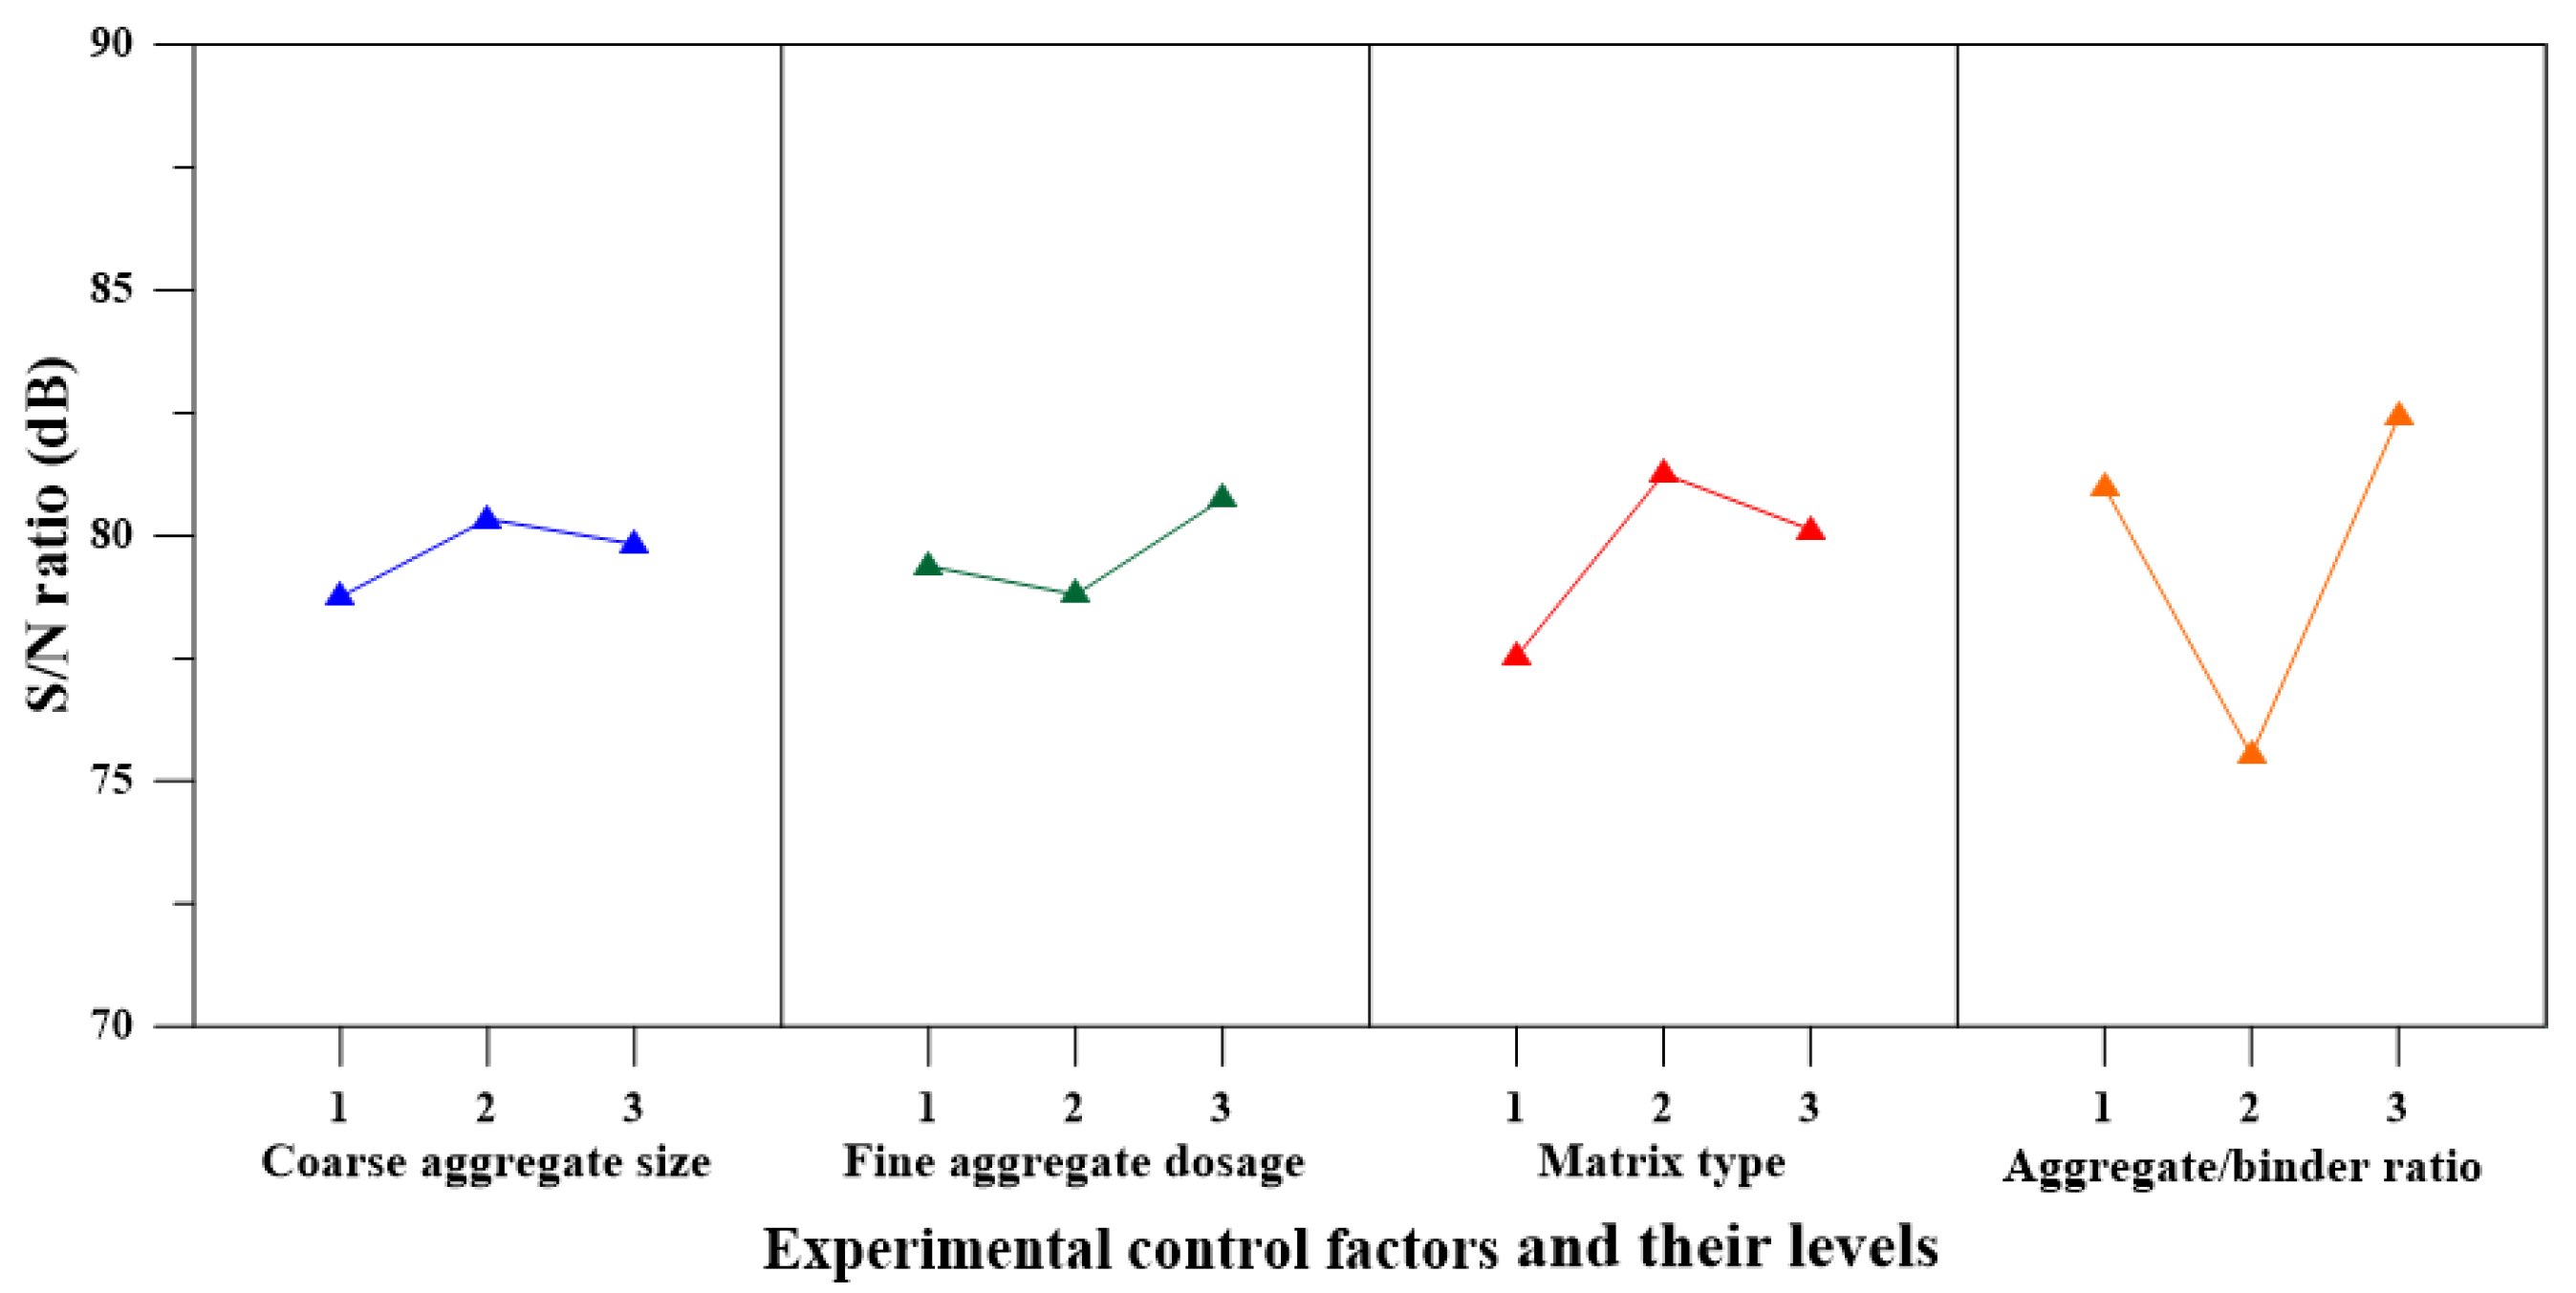
3.3.2. Range Analysis and ANOVA of Elastic Modulus

In terms of the elastic modulus of the LPCs, the mean S/N ratio for each level of the experimental control factor is listed in Table 13, and its S/N response diagram is shown in Figure 11. From Table 13 and Figure 11, it is easy to see that the aggregate-to-binder ratio was the significant factor in controlling the elastic modulus. In this study, there were three levels of the aggregate-to-binder ratio. The first level was 6.2, the second level was 5.9, and the third level was 5.6. As the aggregate to binder ratio decreased, the elastic modulus decreased and then increased. In other words, the maximum value of the elastic modulus occurred when the aggregate-to-binder ratio was at the lowest level. This was because the smaller aggregate-to-binder ratio meant that the amount of cement paste required to adequately cover the granular skeleton could be obtained. Therefore, it helped to improve the elastic modulus of the LPCs. However, it can be observed from Figure 12 that the relationship between the elastic modulus and void ratio was highly dispersed. This showed that the trend between the elastic modulus and void ratio was quite different from other measurement results. The reason was mainly due to the dispersion, irregularity, and fluctuations that occurred with the collapse of voids and the rearrangement of aggregates during the test. Thus, the elastic modulus had great variability. Furthermore, the results of the ANOVA and F test for the elastic modulus are given in Table 14. From this point of view, the ratio of aggregate to binder was the most significant factor contributing to the elastic modulus of the LPC, with a contribution percentage of 67.84%. By examining the above analysis results, it can be seen that the optimal combination level of experimental control factors to achieve the maximum elastic modulus was A2B3C2D3, i.e., the coarse aggregate size at level 2, fine aggregate content at level 3, matrix type at level 2, and aggregate to binder ratio at level 3.

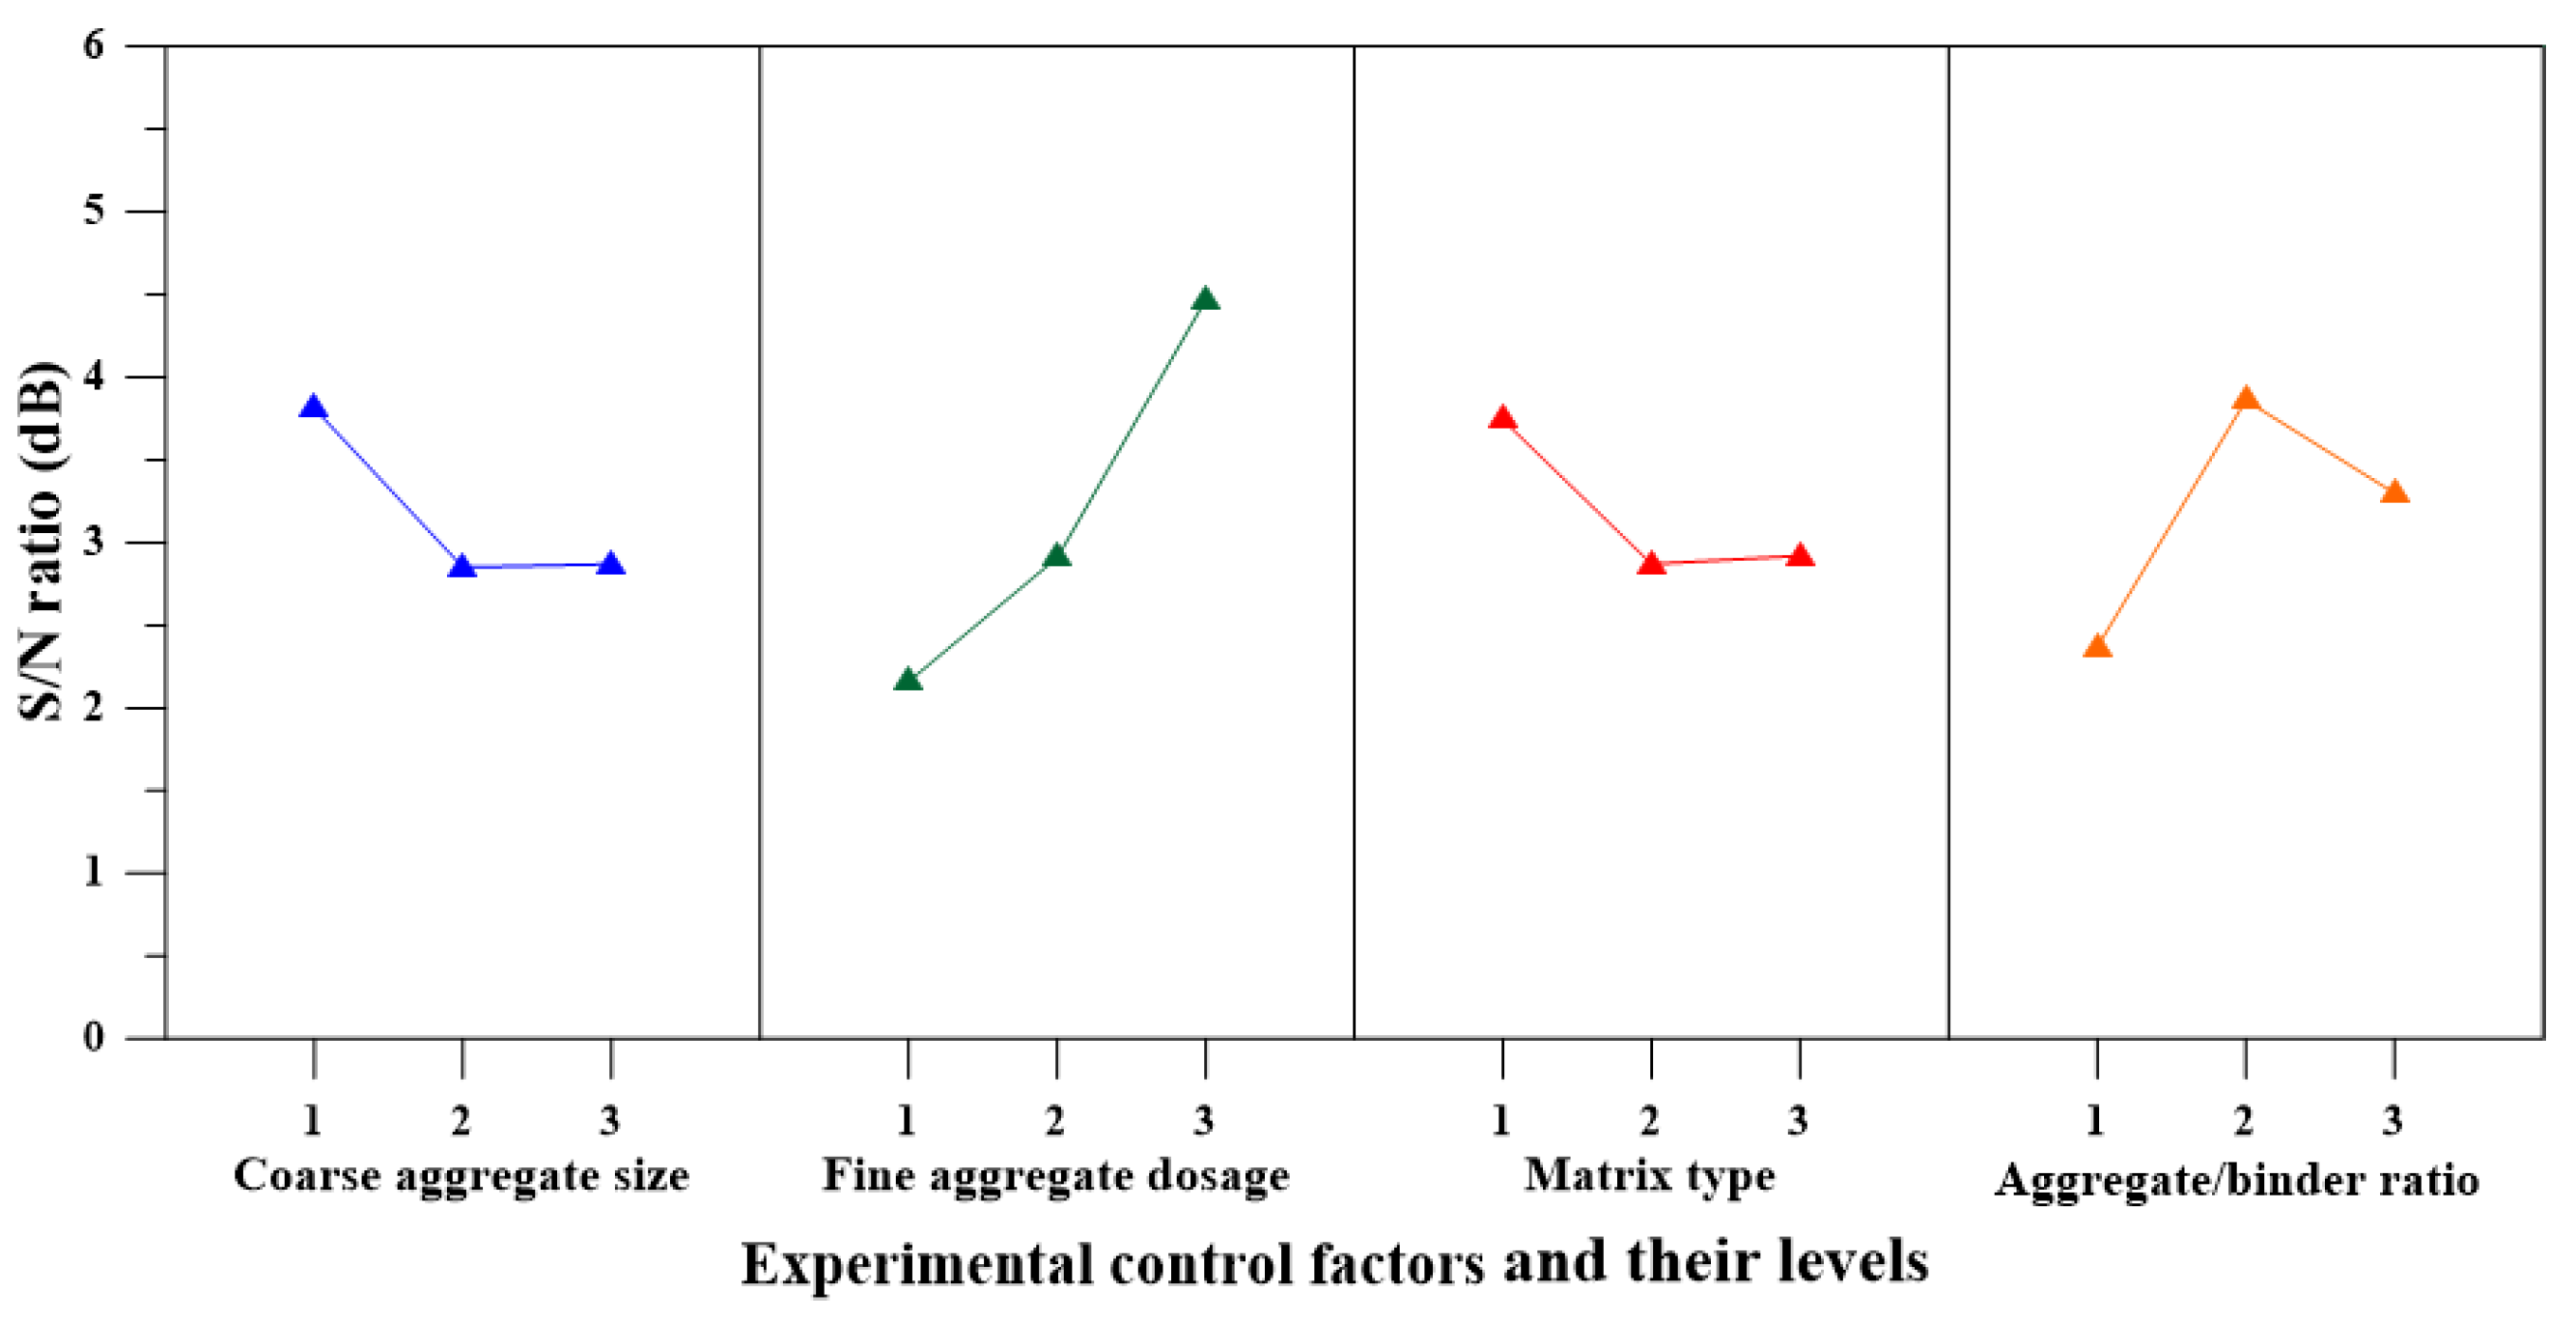
3.3.3. Range Analysis and ANOVA of Flexural Strength

Table 13 lists the mean S/N ratio at each level of the experimental control factors of the flexural strength and Figure 13 shows the S/N response graph of the flexural strength. As can be seen from Table 13 and Figure 13, the fine aggregate content was the significant factor in controlling the flexural strength, and when the fine aggregate content is 10%, the response value was the largest. It can be seen from Figure 13 that the general trend was that the flexural strength increased almost linearly with the increase in the percentage of fine aggregate.
In addition, it can be seen from Figure 14 that the relationship between the flexural strength and void ratio was roughly inversely proportional, irrespective of any coarse aggregate size. In engineering practice, fine aggregate can be added to the PC mixture, usually within 5–10% of the mass of coarse aggregate, to improve strength and durability [78]. Research by Ibrahim et al. [79] showed that adding 10% river sand to a PC mixture with a water–cement ratio of 0.3–0.4 resulted in a slight decrease in porosity (about 12%) and an increase in compressive strength by 50%. Barnhouse and Srubar [80] added 7% by mass of coarse aggregate sand to recycled aggregate and high-porosity PC (>50%) with a water-cement ratio of 0.27, resulting in a 16% reduction in porosity and a 19% increase in compressive strength. The above results show that sand can reduce the porosity, provide a thicker paste coating, and increase the contact area between the aggregates, further improving the interlocking of the aggregates, thereby increasing the strength of the PC [77]. As the compressive strength increased, the flexural strength also improved. In addition, the ANOVA and F test results in Table 14 show that the fine aggregate content had the maximum contribution to the LPC mixture toward the flexural strength. The contribution percentage of fine aggregate content with respect to the flexural strength of the LPC mixture was 46.00%, which was the maximum among all the factors, followed by the matrix type (38.28%), and then by the aggregate-to-binder ratio (13.35%). According to the above results, the optimal combination level of the experimental control factors for achieving the maximum flexural strength was A1B3C1D2, i.e., the coarse aggregate size at level 1, fine aggregate content at level 3, matrix type at level 1, and aggregate to binder ratio at level 2.

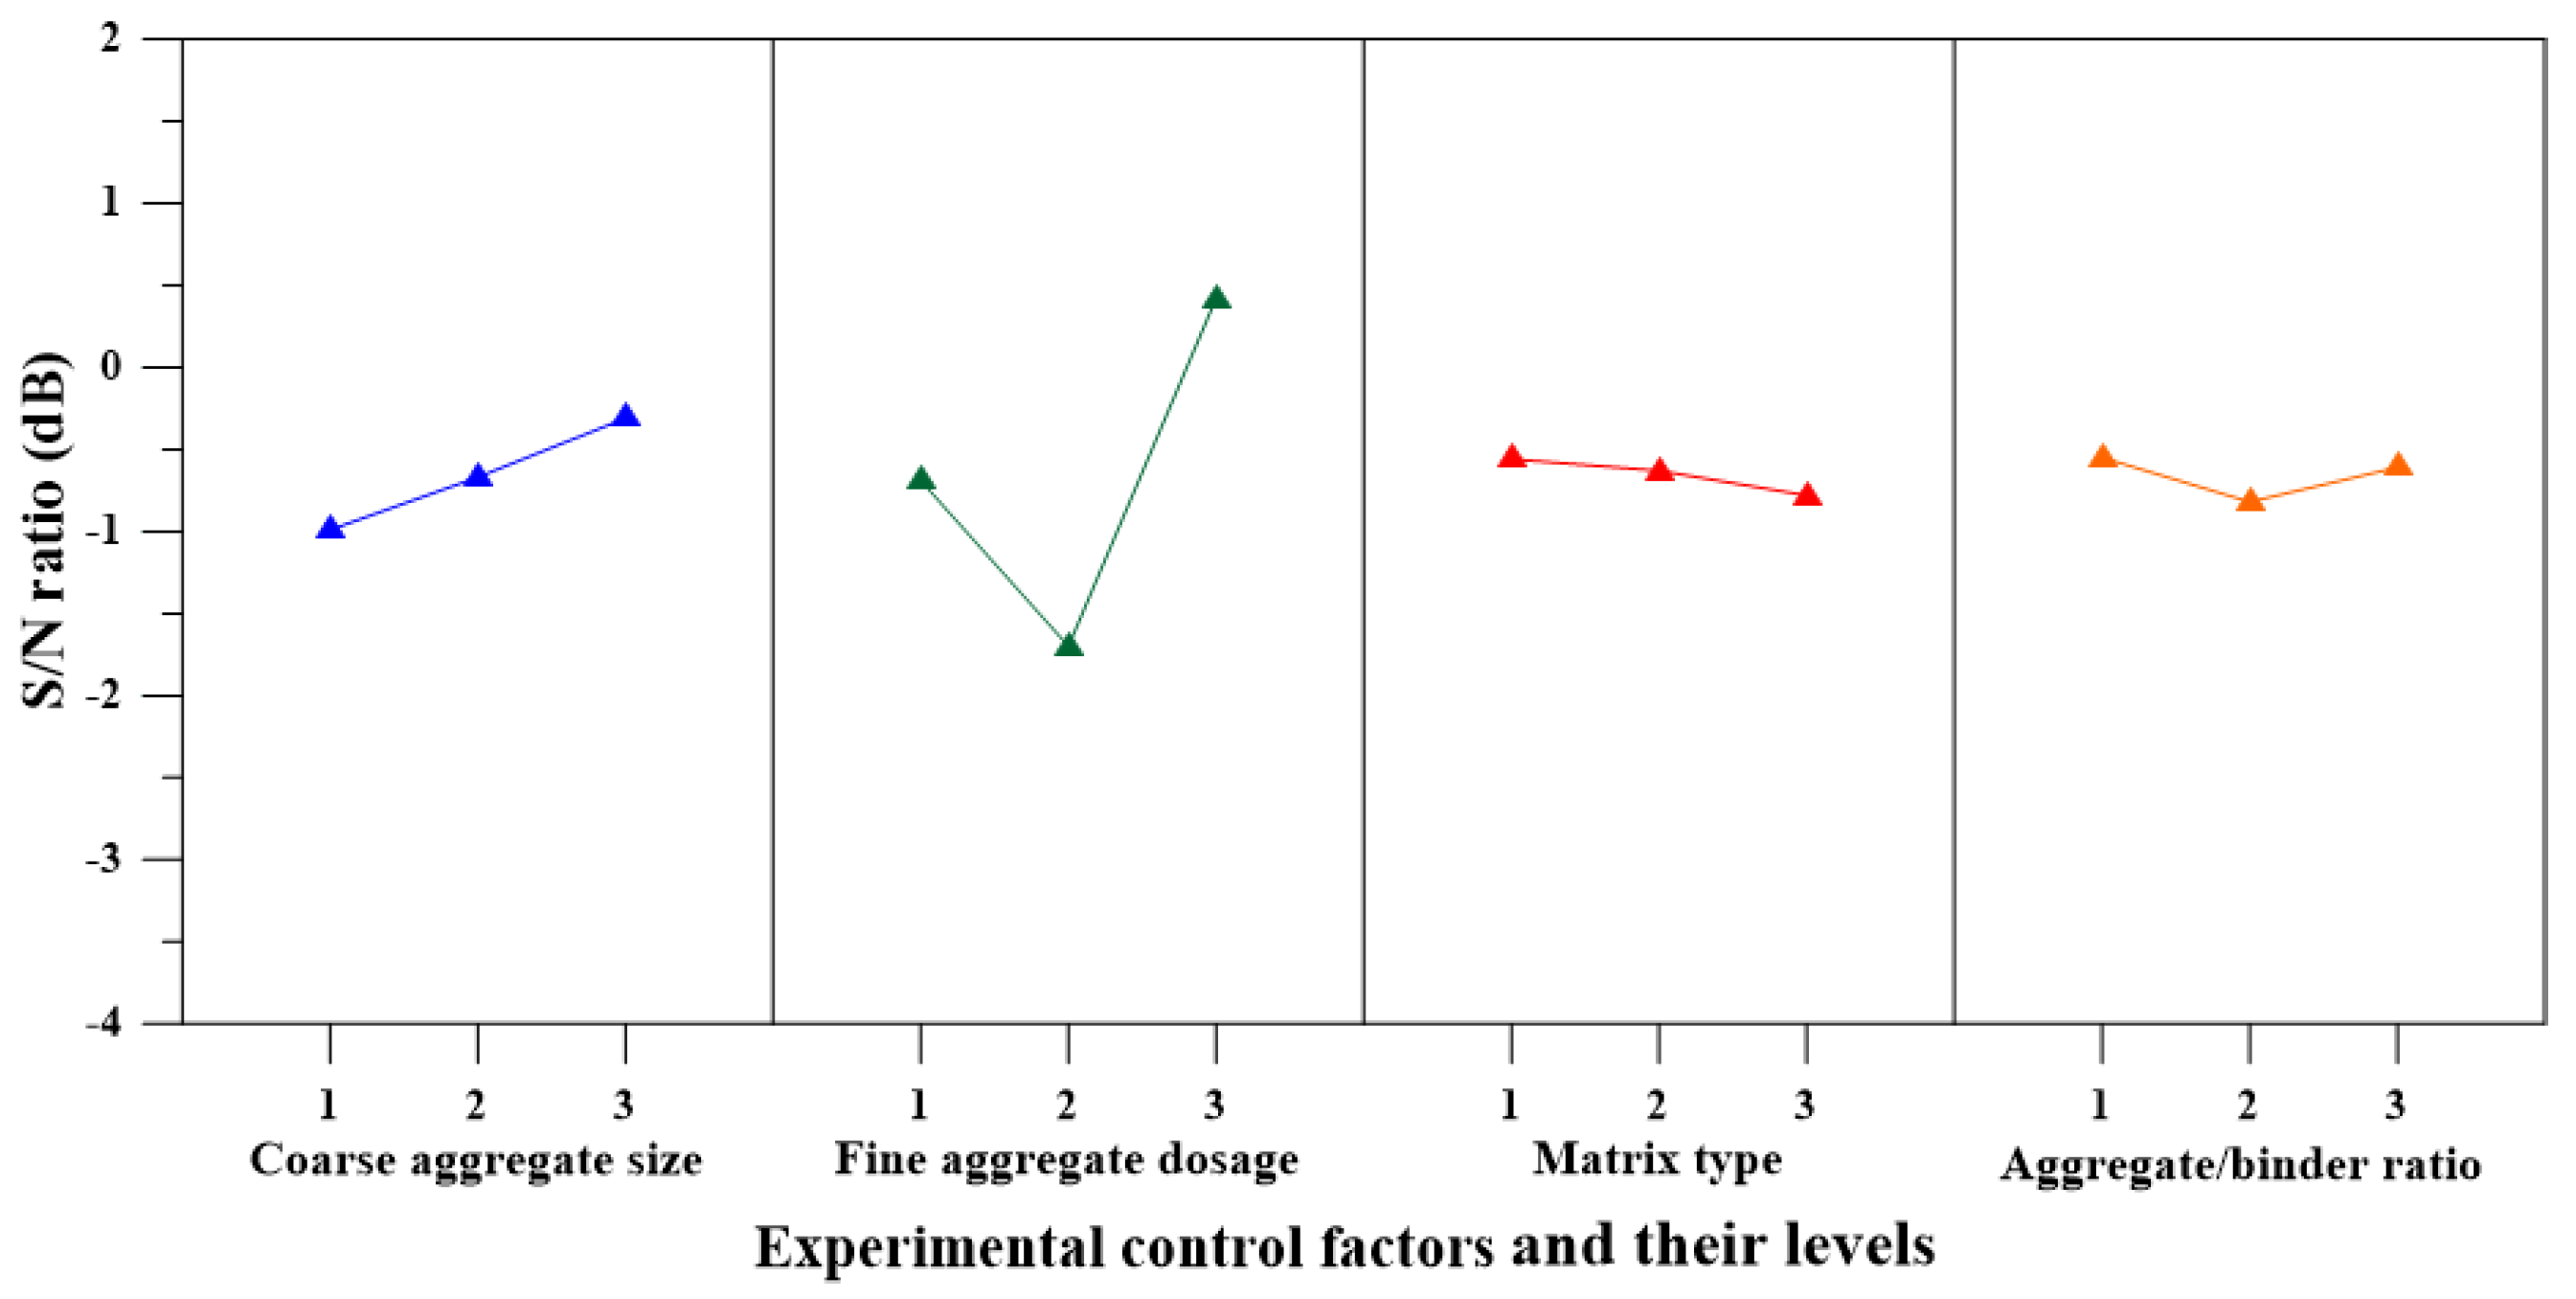
3.3.4. Range Analysis and ANOVA of Splitting Tensile Strength

The mean S/N ratio at each level of the factor for the splitting tensile strength is shown in Table 13, while the S/N response plot for the splitting tensile strength is shown in Figure 15. It can be seen from the analysis results of Table 13 and Figure 15 that the fine aggregate content was the most important factor that affected the splitting tensile strength. The splitting tensile strength first decreased and then increased with an increase in the fine aggregate content. When the fine aggregate content was 10%, the value of splitting tensile strength was the largest. The use of fine aggregates in a PC mixture can be regarded as a part of aggregate gradation. In particular, the presence of fine aggregates can provide a better degree of packing and a good interlocking between aggregates, which increases the structural capacity of the mixture. As a result, the splitting tensile strength of the LPC mixture can be improved. The study by Kevin et al. [81] showed that when sand (7% of the mass of coarse aggregate) and fiber (0–0.1% of the concrete volume) were added to the PC mixture, the tensile strength increased by 24% and the porosity decreased by 4%. In addition, it can be seen from Figure 16 that the relationship between the splitting tensile strength and void ratio was roughly inversely proportional. From this point of view, using only the void ratio as a parameter was not enough to accurately predict the splitting tensile strength of the LPC mixture, although it was an influencing factor.
Moreover, the ANOVA and F test results in Table 14 also confirmed that the fine aggregate content was the most important factor affecting the splitting tensile strength of the LPC. The contribution percentages of these factors were fine aggregate content (87.20%), coarse aggregate size (8.15%), and matrix type (4.12%). According to the results of the S/N ratio and the analysis of variance, the optimal combination level of the experimental control factors for achieving maximum splitting tensile strength was A3B3C1D1, i.e., the coarse aggregate size at level 3, fine aggregate content at level 3, matrix type at level 1, and aggregate to binder ratio at level 1.

3.3.5. Validation Tests

This study performed verification tests because the optimal combination of parameters and their levels did not correspond to any experiments in the orthogonal array. It can be seen from Table 15 that the optimal combination of experimental control factors proposed by the Taguchi method could obtain the maximum test result for each performance parameter. From this point of view, the validation test results showed that the Taguchi method was an effective method to obtain the mix design of fiber-reinforced LPC.

4. Conclusions

In this study, silica fume, ultra-fine silica powder, polypropylene fiber, and lightweight coarse aggregate were used to explore the mix design and engineering properties of PC. The Taguchi method was used to evaluate the optimal design parameters of the fiber-reinforced LPC, and the research results showed that it was an effective method. From the results of the range analysis and variance analysis, it can be seen that due to different failure mechanisms, the influencing factors of various mechanical properties were also different. As far as the compressive strength of the LPC was concerned, the size of the lightweight coarse aggregate was the most important factor. As for the flexural strength and splitting tensile strength of the LPC, the fine aggregate content was the most important factor. It is worth noting that the failure of the LPC specimens was mainly caused by the rupture of the lightweight aggregate. The research results also confirmed that the use of suitable materials and the optimal mix proportions were the key factors for improving the mechanical properties of the LPC. Due to the use of silica fume, ultrafine silica powder, and polypropylene fibers, the 28-day compressive strength, 28-day flexural strength, and 28-day split tensile strength of the LPC specimens prepared in this study were 4.80–7.78, 1.19–1.86, and 0.78–1.11 MPa, respectively. On the whole, the mechanical properties of the prepared LPC specimens were better than those of the LPC with a general composition.

Author Contributions

Conceptualization, C.-W.T.; methodology, C.-W.T. and L.-W.E.; software, C.-K.C.; validation, C.-W.T. and C.-K.C.; formal analysis, C.-W.T.; investigation, C.-W.T. and C.-K.C.; resources, C.-W.T.; data curation, C.-W.T. and C.-K.C.; writing—original draft preparation, C.-W.T. and L.-W.E.; writing—review and editing, C.-W.T. and L.-W.E.; visualization, C.-W.T.; supervision, C.-W.T. and C.-K.C.; project administration, C.-W.T.; funding acquisition, C.-W.T. All authors have read and agreed to the published version of the manuscript.

Funding

This research was funded by the Ministry of Science and Technology of Taiwan, grant number MOST 105-2221-E-230-002.

Institutional Review Board Statement

Not applicable.

Informed Consent Statement

Not applicable.

Data Availability Statement

The data presented in this study are available on request from the corresponding author.

Acknowledgments

The authors are grateful to the Department of Civil Engineering of National Chung-Hsing University for providing experimental equipment and technical support.

Conflicts of Interest

The authors declare no conflict of interest.

References

  1. Xia, J.; Zhang, Y.Y.; XIong, L.H.; He, S.; Wang, L.F.; Yu, Z.B. Opportunities and challenges of the Sponge City construction related to urban water issues in China. Sci. China Earth Sci. 2017, 60, 652–658. [Google Scholar] [CrossRef]
  2. Chandrappa, A.K.; Biligiri, K.P. Pervious concrete as a sustainable pavement material—Research findings and future prospects: A state-of-the-art review. Construct. Build. Mater. 2016, 111, 262–274. [Google Scholar] [CrossRef]
  3. CIP 38-Pervious Concrete, Concrete in Practice; National Ready Mixed Concrete Association: Alexandria, VA, USA, 2004; Available online: https://www.nrmca.org/wp-content/uploads/2021/01/38pr.pdf (accessed on 25 May 2021).
  4. Ho, H.L.; Huang, R.; Hwang, L.C.; Lin, W.T.; Hsu, H.M. Waste-Based Pervious Concrete for Climate-Resilient Pavements. Materials 2018, 11, 900. [Google Scholar] [CrossRef] [Green Version]
  5. Sonebia, M.; Bassuonib, M.; Yahia, A. Pervious Concrete: Mix Design, Properties and Applications. RILEM Tech. Lett. 2016, 1, 109–115. [Google Scholar] [CrossRef]
  6. Bean, E.Z.; Hunt, W.F.; Bidelspach, D.A. A field survey of permeable pavement surface infiltration rates. ASCE J. Irrig. Drain. Eng. 2007, 133, 249–255. [Google Scholar] [CrossRef]
  7. Ghafoori, N.; Dutta, S. Building and nonpavement applications of no-fines concrete. J. Mater. Civ. Eng. 1995, 7, 286–289. [Google Scholar] [CrossRef]
  8. Obla, K.H. Pervious concrete—An overview. Indian Concr. J. 2010, 84, 9. [Google Scholar]
  9. Rehder, B.; Banh, K.; Neithalath, N. Fracture behavior of pervious concretes: The effects of pore structure and fibers. Eng. Fract. Mech. 2014, 118, 1–16. [Google Scholar] [CrossRef]
  10. Bonicelli, A.; Giustozzi, F.; Crispino, M. Experimental study on the effects of fine sand addition on differentially compacted pervious concrete. Construct. Build. Mater. 2015, 91, 102–110. [Google Scholar] [CrossRef]
  11. Yang, J.; Jiang, G. Experimental study on properties of pervious concrete pavement materials. Cem. Concr. Res. 2003, 33, 381–386. [Google Scholar] [CrossRef]
  12. ACI Committee, 522. Report on Pervious Concrete, Chapter 6—Pervious Concrete Mixture Proportioning; American Concrete Institute: Farmington Hills, MI, USA, 2010; p. 38. [Google Scholar]
  13. Neithalath, N.; Sumanasooriya, M.S.; Deo, O. Characterizing pore volume, sizes, and connectivity in pervious concretes for permeability prediction. Mater. Charact. 2010, 61, 802–813. [Google Scholar] [CrossRef]
  14. Singh, A.; Sampath, P.V.; Biligiri, K.P. A review of sustainable pervious concrete systems: Emphasis on clogging, material characterization, and environmental aspects. Construct. Build. Mater. 2020, 261, 120491. [Google Scholar] [CrossRef]
  15. Nguyen, D.H.; Sebaibi, N.; Boutouil, M.; Leleyter, L.; Baraud, F. A modified method for the design of pervious concrete mix. Construct. Build. Mater. 2014, 73, 271–282. [Google Scholar] [CrossRef]
  16. Barrett, M.E., Jr.; Malina, J.F.; Charbeneau, R.J. Characterization of Highway Runoff in Austin, Texas, Area. J. Environ. Eng. 1998, 124, 131–139. [Google Scholar] [CrossRef] [Green Version]
  17. Olek, J.; Weiss, W.J.; Neithalath, N.; Marolf, A.; Sell, E.; Thornton, W.D. Development of Quiet and Durable Porous Portland Cement Concrete Paving Materials; Final Report SQDH 2003-5; Purdue University: West Lafayette, IN, USA, 2003. [Google Scholar]
  18. Mix Design Development for Pervious Concrete in Cold Weather Climates; Final Report February 2006; National Concrete Pavement Technology Center: Ames, IA, USA, 2006.
  19. Zhong, R.; Wille, K. Compression response of normal and high strength pervious concrete. Construct. Build. Mater. 2016, 109, 177–187. [Google Scholar] [CrossRef]
  20. Beeldens, A.; Gemert, D.V.; Caestecker, C. Porous Concrete: Laboratory versus Field Experience. In Proceedings of the 9th International Symposium on Concrete Roads, Istanbul, Turkey, 4 April–7 April 2003. [Google Scholar]
  21. Beeldens, A. Behavior of Porous PCC under Freeze-Thaw Cycling. Presented at the Tenth International Congress on Polymers in Concrete, Honolulu, HI, USA, 21–24 May 2001. [Google Scholar]
  22. Kajio, S.; Tanaka, S.; Tomita, R.; Noda, E.; Hashimoto, S. Properties of Porous Concrete with High Strength. In Proceedings of the 8th International Symposium on Concrete Roads, Lisbon, Portugal, 13–16 September 1988; pp. 171–177. [Google Scholar]
  23. Park, S.; Tia, M. An Experimental Study on the Water-Purification Properties of Porous Concrete. Cem. Concr. Res. 2004, 34, 177–184. [Google Scholar] [CrossRef]
  24. Tamai, M.; Yoshida, M. Durability of Porous Concrete; Concrete Institute: Thessaloniki, Greece, 2003. [Google Scholar]
  25. Tennis, P.D.; Leming, M.L.; Akers, D.J. Pervious Concrete Pavements; Special Publication by the Portland Cement Association and the National Ready Mixed Concrete Association: Skokie, IL, USA, 2004. [Google Scholar]
  26. Mahalingam, R.; Mahalingam, S.V. Analysis of pervious concrete properties. Građevinar 2016, 68, 493–501. [Google Scholar]
  27. Kovč, M.; Sičáková, A. Pervious Concrete as an Environmental Solution for Pavements: Focus on Key Properties. Environments 2018, 5, 11. [Google Scholar] [CrossRef] [Green Version]
  28. Sharif, A.A.M.; Shahidan, S.; Koh, H.B.; Kandash, A.; Zuki, S.S.M. Strength development of pervious concrete containing engineered biomass aggregate. Mater. Sci. Eng. 2017, 271, 012002. [Google Scholar] [CrossRef]
  29. Aoki, Y.; Ravindrarajah, R.S.; Khabbaz, H. Properties of pervious concrete containing fly ash. Road Mater. Pavement Des. 2012, 13, 1–11. [Google Scholar] [CrossRef]
  30. Hamdulay, H.N.; John, R.J.; Suroshe, D.R. Effect of Aggregate Grading and Cementitious Byproduct on Performance of Pervious Concrete. Int. J. Innov. Res. Sci. Eng. Technol. 2015, 4, 6890–6897. [Google Scholar]
  31. Shen, P.; Lu, J.-X.; Zheng, H.; Liu, S.; Poon, C.S. Conceptual design and performance evaluation of high strength pervious concrete. Construct. Build. Mater. 2021, 269, 121342. [Google Scholar] [CrossRef]
  32. Lo, F.-C.; Lee, M.-G.; Lo, S.-L. Effect of coal ash and rice husk ash partial replacement in ordinary Portland cement on pervious concrete. Construct. Build. Mater. 2021, 286, 122947. [Google Scholar] [CrossRef]
  33. Chaitanya, M.; Ramakrishna, G. Enhancing the mechanical properties of pervious recycled aggregate concrete using silicafumes. Mater. Today Proc. 2021, 46, 634–637. [Google Scholar] [CrossRef]
  34. Huang, J.; Zhang, Y.; Sun, Y.; Ren, J.; Zhao, Z.; Zhang, J. Evaluation of pore size distribution and permeability reduction behavior in pervious concrete. Construct. Build. Mater. 2021, 290, 123228. [Google Scholar] [CrossRef]
  35. Xie, C.; Yuan, L.; Tan, H.; Zhang, Y.; Zhao, M.; Jia, Y. Experimental study on the water purification performance of biochar-modified pervious concrete. Construct. Build. Mater. 2021, 285, 122767. [Google Scholar] [CrossRef]
  36. Geng, H.; Xu, Q.; Duraman, S.B.; Li, Q. Effect of Rheology of Fresh Paste on the Pore Structure and Properties of Pervious Concrete Based on the High Fluidity Alkali-Activated Slag. Crystals 2021, 11, 593. [Google Scholar] [CrossRef]
  37. Gao, L.; Lai, Y.; Islam Pramanic, M.R.; Zhang, W. Deterioration of Portland Cement Pervious Concrete in Sponge Cities Subjected to Acid Rain. Materials 2021, 14, 2670. [Google Scholar] [CrossRef]
  38. Meng, X.; Jiang, Q.; Liu, R. Flexural Performance and Toughness Characteristics of Geogrid-Reinforced Pervious Concrete with Different Aggregate Sizes. Materials 2021, 14, 2295. [Google Scholar] [CrossRef]
  39. Paula Junior, A.C.; Jacinto, C.; Oliveira, T.M.; Polisseni, A.E.; Brum, F.M.; Teixeira, E.R.; Mateus, R. Characterisation and Life Cycle Assessment of Pervious Concrete with Recycled Concrete Aggregates. Crystals 2021, 11, 209. [Google Scholar] [CrossRef]
  40. Hung, V.V.; Seo, S.-Y.; Kim, H.-W.; Lee, G.-C. Permeability and Strength of Pervious Concrete According to Aggregate Size and Blocking Material. Sustainability 2021, 13, 426. [Google Scholar] [CrossRef]
  41. Wang, D.; Zhao, Q.; Yang, C.; Chi, Y.; Qi, W.; Teng, Z. Study on frost resistance and vegetation performance of seashell waste pervious concrete in cold area. Construct. Build. Mater. 2020, 265, 120758. [Google Scholar] [CrossRef]
  42. Taheri, B.M.; Ramezanianpour, A.M.; Sabokpa, S.; Gapele, M. Experimental evaluation of freeze-thaw durability of pervious concrete. J. Build. Eng. 2021, 33, 101617. [Google Scholar] [CrossRef]
  43. Wu, H.; Liu, Z.; Sun, B.; Yin, J. Experimental investigation on freeze–thaw durability of Portland cement pervious concrete (PCPC). Construct. Build. Mater. 2016, 117, 63–71. [Google Scholar] [CrossRef]
  44. Kevern, J.T.; Wang, K.; Schaefer, V.R. Effect of coarse aggregate on the freeze-thaw durability of pervious concrete. J. Mater. Civ. Eng. 2010, 22, 469–475. [Google Scholar] [CrossRef]
  45. Henderson, V.; Tighe, S. Evaluation of pervious concrete pavement performance in cold weather climates. Int. J. Pavement Eng. 2012, 13, 197–208. [Google Scholar] [CrossRef]
  46. Zaetang, Y.; Wongsa, A.; Sata, V.; Chindaprasirt, P. Use of lightweight aggregates in pervious concrete. Construct. Build. Mater. 2013, 48, 585–591. [Google Scholar] [CrossRef]
  47. Khare, A.; Shijagurumayum, C.; Sahoo, S. Development of pervious concrete using different types of aggregates. Int. J. Eng. Technol. Manag. Appl. Sci. 2017, 5, 330–334. [Google Scholar]
  48. Shijagurumayum, C.; Khare, A.; Sahoo, S. A study on pervious concrete using pumice and electric arc air cooled blast furnace slag aggregates. Int. J. Sci. Technol. Eng. 2017, 3, 83–86. [Google Scholar]
  49. Peng, H.; Yin, J.; Song, W. Mechanical and Hydraulic Behaviors of Eco-Friendly Pervious Concrete Incorporating Fly Ash and Blast Furnace Slag. Appl. Sci. 2018, 8, 859. [Google Scholar] [CrossRef] [Green Version]
  50. Chen, Y.; Wang, K.; Wang, X.; Zhou, W. Strength, fracture and fatigue of pervious concrete. Constr. Build. Mater. 2013, 42, 97–104. [Google Scholar] [CrossRef]
  51. Huang, B.; Wu, H.; Shu, X.; Burdette, E.G. Laboratory evaluation of permeability and strength of polymer-modified pervious concrete. Constr. Build. Mater. 2010, 24, 818–823. [Google Scholar] [CrossRef]
  52. Hesami, S.; Ahmadi, S.; Nematzadeh, M. Effects of rice husk ash and fiber on mechanical properties of pervious concrete pavement. Construct. Build. Mater. 2014, 53, 680–691. [Google Scholar] [CrossRef]
  53. Fisher, R.A. Statistical Methods for Research Workers; Oliver & Boyd: London, UK, 1925. [Google Scholar]
  54. Taguchi, G. Introduction to Quality Engineering: Designing Quality into Products and Processes; Asian Productivity Organization: Tokyo, Japan, 1987. [Google Scholar]
  55. Roy, R.K. A Primer on the Taguchi Method, Competitive Manufacturing Series; Van Nostrand Reinhold: New York, NY, USA, 1990. [Google Scholar]
  56. Phadke, M.S. Quality Engineering Using Robust Design; Prentice Hall: Englewood Cliffs, NJ, USA, 1989. [Google Scholar]
  57. Montgomery, D.C. Design and Analysis of Experiments; Wiley: New York, NY, USA, 2005. [Google Scholar]
  58. Torres, A.; Hu, J.; Ramos, A. The effect of the cementitious paste thickness on the performance of pervious concrete. Construct. Build. Mater. 2015, 95, 850–859. [Google Scholar] [CrossRef]
  59. ASTM. C230/C230M-14 Standard Specification for Flow Table for Use in Tests of Hydraulic Cement; ASTM International: West Conshohocken, PA, USA, 2014. [Google Scholar]
  60. ASTM. C109/C109M-13e1 Standard Test Method for Compressive Strength of Hydraulic Cement Mortars (Using 2-in. or [50-mm] Cube Specimens); ASTM International: West Conshohocken, PA, USA, 2013. [Google Scholar]
  61. ASTM. C1688/C1688M-14a Standard Test Method for Density and Void Content of Freshly Mixed Pervious Concrete; ASTM International: West Conshohocken, PA, USA, 2014; Available online: https://www.astm.org (accessed on 25 May 2021).
  62. ASTM. C1701/C1701M-17a Standard Test Method for Infiltration Rate of In Place Pervious Concrete; ASTM International: West Conshohocken, PA, USA, 2017; Available online: https://www.astm.org (accessed on 25 May 2021).
  63. ASTM. C39/C39M-18 Standard Test Method for Compressive Strength of Cylindrical Concrete Specimens; ASTM International: West Conshohocken, PA, USA, 2018; Available online: https://www.astm.org (accessed on 25 May 2021).
  64. ASTM. C469/C469M-14 Standard Test Method for Static Modulus of Elasticity and Poisson’s Ratio of Concrete in Compression; ASTM International: West Conshohocken, PA, USA, 2014. [Google Scholar]
  65. ASTM. C496/C496M-11 Standard Test Method for Splitting Tensile Strength of Cylindrical Concrete Specimens; ASTM International: West Conshohocken, PA, USA, 2004. [Google Scholar]
  66. ASTM. C78/C78M-18 Standard Test Method for Flexural Strength of Concrete (Using Simple Beam with Third-Point Loading); ASTM International: West Conshohocken, PA, USA, 2018; Available online: https://www.astm.org (accessed on 25 May 2021).
  67. Neville, A.M. Properties of Concrete; Longman: Harlow, UK, 1994. [Google Scholar]
  68. Saboo, N.; Shivhare, S.; Kori, K.K.; Chandrappa, A.K. Effect of fly ash and metakaolin on pervious concrete properties. Construct. Build. Mater. 2019, 223, 322–328. [Google Scholar] [CrossRef]
  69. Alam, A.; Haselbach, L. Estimating the modulus of elasticity of pervious concrete based on porosity. Adv. Civ. Eng. Mater. 2014, 3, 256–269. [Google Scholar] [CrossRef]
  70. Zhong, R.; Wille, K. Material design and characterization of high performance pervious concrete. Construct. Build. Mater. 2015, 98, 51–60. [Google Scholar] [CrossRef]
  71. Tang, C.W.; Cheng, C.K.; Tsai, C.Y. Mix Design and Mechanical Properties of High-Performance Pervious Concrete. Materials 2019, 12, 2577. [Google Scholar] [CrossRef] [PubMed] [Green Version]
  72. Chen, H.-J.; Lin, H.-C.; Tang, C.-W. Application of the Taguchi Method for Optimizing the Process Parameters of Producing Controlled Low-Strength Materials by Using Dimension Stone Sludge and Lightweight Aggregates. Sustainability 2021, 13, 5576. [Google Scholar] [CrossRef]
  73. Yu, F.; Sun, D.; Wang, J.; Hu, M. Influence of aggregate size on compressive strength of pervious concrete. Construct. Build. Mater. 2019, 209, 463–475. [Google Scholar] [CrossRef]
  74. Ćosić, K.; Korat, L.; Ducman, V.; Netinger, I. Influence of aggregate type and size on properties of pervious concrete. Construct. Build. Mater. 2015, 78, 69–76. [Google Scholar] [CrossRef]
  75. Deo, O.; Neithalath, N. Compressive behavior of pervious concretes and a quantification of the influence of random pore structure features. Mater. Sci. Eng. 2010, 528, 402–412. [Google Scholar] [CrossRef]
  76. Elango, K.S.; Revathi, V. Fal-G binder pervious concrete. Construct. Build. Mater. 2017, 140, 91–99. [Google Scholar] [CrossRef]
  77. Sun, Z.; Lin, X.; Vollpracht, A. Pervious concrete made of alkali activated slag and geopolymers. Construct. Build. Mater. 2018, 189, 797–803. [Google Scholar] [CrossRef]
  78. AlShareedah, O.; Nassiri, S. Pervious concrete mixture optimization, physical, and mechanical properties and pavement design: A review. J. Clean. Prod. 2021, 288, 125095. [Google Scholar] [CrossRef]
  79. Ibrahim, H.; Goh, Y.; Ann, Z.; Poh, S.; Hung, K.; Wah, C.; Abutaha, F. Hydraulic and strength characteristics of pervious concrete containing a high volume of construction and demolition waste as aggregates. Construct. Build. Mater. 2020, 253, 119251. [Google Scholar] [CrossRef]
  80. Barnhouse, P.W.; Srubar, W., III. Material characterization and hydraulic conductivity modeling of macroporous recycled-aggregate pervious concrete. Construct. Build. Mater. 2016, 110, 89e97. [Google Scholar] [CrossRef]
  81. Kevern, J.T.; Schaefer, V.R.; Wang, K.; Suleiman, M.T. Pervious Concrete Mixture Proportions for Improved Freeze-Thaw Durability. J. ASTM Int. 2008, 5, 101320. [Google Scholar] [CrossRef]
Figure 1. The relationship between the apparent viscosity and spindle speed.
Applsci 12 00524 g001
Figure 2. The relationship between the torque and spindle speed.
Applsci 12 00524 g002
Figure 3. The appearance of the LPC specimen: (a) LC1, (b) LC2, and (c) LC3.
Applsci 12 00524 g003
Figure 4. Unit weight and permeability coefficient versus void ratio.
Applsci 12 00524 g004
Figure 5. The typical failure of the LPC specimens: (a) compressive strength test, (b) flexural strength test, and (c) splitting tensile strength test.
Applsci 12 00524 g005
Figure 6. The fracture surface of the LPC specimens: (a) compressive strength test and (b) splitting tensile strength test.
Applsci 12 00524 g006
Figure 7. The test results of LPC: (a) compressive strength and (b) elastic modulus.
Applsci 12 00524 g007
Figure 8. The test results of LPC: (a) flexural strength and (b) splitting tensile strength.
Applsci 12 00524 g008
Figure 9. The S/N response graph for the compressive strength of the LPC.
Applsci 12 00524 g009
Figure 10. Relationship between compressive strength and void ratio.
Applsci 12 00524 g010
Figure 11. The S/N response graph for the elastic modulus of the LPC.
Applsci 12 00524 g011
Figure 12. Relationship between the elastic modulus and void ratio.
Applsci 12 00524 g012
Figure 13. The S/N response graph for the flexural strength of the LPC.
Applsci 12 00524 g013
Figure 14. Relationship between the flexural strength and void ratio.
Applsci 12 00524 g014
Figure 15. The S/N response graph for the splitting tensile strength of the LPC.
Applsci 12 00524 g015
Figure 16. Relationship between the splitting tensile strength and void ratio.
Applsci 12 00524 g016
Table 1. The properties of typical PC.
Void Ratio (%)Unit Weight (kg/m3)Permeability
(mm/s)
Compressive Strength (MPa)Flexural Strength (MPa)Reference
15–371602–22840.25–252.6–61.21.0–7.5[17,18,19,20,21,22,23,24,25,26,27,28,29,30,31,32,33,34,35,36,37,38,39,40]
Table 2. The properties of PC containing lightweight aggregates.
Type of Lightweight AggregateCompressive Strength (MPa)Flexural Strength
(MPa)
Splitting Tensile Strength
(MPa)
Reference
Diatomite aggregate3.20–5.99-0.57–0.93[46]
Pumice aggregate2.47–4.30-0.47–0.99[46]
Recycled aggregate from autoclaved aerated concrete2.62–4.45-0.58–0.93[46]
Pumice aggregate2.74–2.891.00–1.400.84–1.13[47]
Pumice aggregate1.80–2.560.50–1.400.56–0.84[48]
Table 3. The physical property of the fine aggregates.
Specific Gravity (SSD) *Water Absorption (%) (SSD)FM
2.571.452.7
Notes: * SSD, saturated surface-dry condition; FM, fineness modulus.
Table 4. The parameters and design levels for the LPC.
Experimental Control FactorLevels of Experimental Control FactorPerformance
Parameter
123
Coarse aggregate size, A (mm)4.75–9.59.5–12.512.5–19.0Compressive strength (MPa)
Fine aggregate content, B (%)0510Elastic modulus (MPa)
Matrix type, CCM1CM2CM3Flexural strength (MPa)
Aggregate-to-binder ratio, DHighMediumLowSplitting tensile strength (MPa)
Notes: CM1, C:SF:USP = 8.8:0.6:0.6; CM2, C:SF:USP = 10:0:0; CM3, C:SF:USP = 9.2:0.4:0.4.
Table 5. The L9(34) orthogonal array for the LPC.
DesignationExperimental Control Factor (Level)
Coarse Aggregate Size (mm)Fine Aggregate Content (%)Matrix TypeAggregate-to-Binder Ratio (Weight Ratio)
LC14.75–9.5 (1)0 (1)C:SF:USP = 8.8:0.6:0.6 (1)6.2 (1)
LC24.75–9.5 (1)5 (2)C:SF:USP = 10:0:0 (2)5.9 (2)
LC34.75–9.5 (1)10 (3)C:SF:USP = 9.2:0.4:0.4 (3)5.6 (3)
LC49.5–12.5 (2)0 (1)C:SF:USP = 10:0:0 (2)5.6 (3)
LC59.5–12.5 (2)5 (2)C:SF:USP = 9.2:0.4:0.4 (3)6.2 (1)
LC69.5–12.5 (2)10 (3)C:SF:USP = 8.8:0.6:0.6 (1)5.9 (2)
LC712.5–19 (3)0 (1)C:SF:USP = 9.2:0.4:0.4 (3)5.9 (2)
LC812.5–19 (3)5 (2)C:SF:SFP = 8.8:0.6:0.6 (1)5.6 (3)
LC912.5–19 (3)10 (3)C:SF:USP = 10:0:0 (2)6.2 (1)
Note: The numbers in parentheses indicate the level of the factor.
Table 6. The mix proportions of the matrix.
DesignationW/BW
(kg/m3)
C
(kg/m3)
SF
(kg/m3)
USP
(kg/m3)
SP
(kg/m3)
VA
(kg/m3)
PP
(kg/m3)
CM10.28425.991459.3799.5099.5031.706.650.90
CM20.28450.241673.750.000.0016.741.670.23
CM30.31459.291457.6563.3863.3830.281.590.45
Notes: W/B, water-to-binder ratio; W, water; C, cement; SF, silica fume; USP, ultra-fine silica powder; SP, superplasticizers; VA, viscous agent; PP, polypropylene fiber.
Table 7. The mix proportions of the fiber-reinforced LPC.
DesignationW/BW
(kg/m3)
C
(kg/m3)
SF
(kg/m3)
USP
(kg/m3)
SP
(kg/m3)
VA
(kg/m3)
PP
(kg/m3)
LCA
(kg/m3)
FA
(kg/m3)
LC10.2851.76177.3211.9611.963.850.810.11576.330.00
LC20.2859.24220.230.000.002.200.220.03569.3329.96
LC30.3169.38220.199.579.574.570.240.07556.4661.83
LC40.2860.35224.360.000.002.240.220.03597.480.00
LC50.3161.82196.188.538.534.080.210.06597.2831.44
LC60.2860.25206.4214.0714.074.480.940.13592.3065.81
LC70.3162.57198.598.638.634.130.220.06612.180.00
LC80.2861.03209.0814.2614.264.540.950.13607.5631.98
LC90.2861.42228.340.000.002.280.230.03612.4568.05
Notes: W/B, water-to-binder ratio; W, water; C, cement; SF, silica fume; USP, ultra-fine silica powder; SP, superplasticizers; VA, viscous agent; PP, polypropylene fiber; LCA, lightweight coarse aggregate; FA, fine aggregate.
Table 8. The results of the apparent viscosity of the matrixes.
DesignationW/BProportion of Cementitious MaterialsApparent Viscosity (Centipoise, cP)
Rotational Speed of Spindle (RPM)
1005020105
CM10.28C:SF:USP = 8.8:0.6:0.65664825612,40019,89331,040
CM20.28C:SF:USP = 10:0:0362740115973816012,480
CM30.31C:SF:USP = 9.2:0.4:0.4358042676347970714,933
Table 9. The flow value and compressive strength of the matrixes.
Designation Flow Value (mm)Compressive Strength (MPa)
CM170.069.1
CM297.387.3
CM3116.776.5
Table 10. The physical properties of the fiber-reinforced LPC.
DesignationUnit Weight (kg/m3)Void Ratio (%)Permeability Coefficient (mm/s)
LC183425.9 24.5
LC288124.8 23.9
LC393222.5 22.8
LC488525.5 23.9
LC590824.6 23.1
LC695821.9 22.4
LC789524.7 23.4
LC894422.5 22.6
LC997320.9 21.8
Table 11. The mechanical properties of the fiber-reinforced LPC (unit: MPa).
DesignationCompressive StrengthElastic ModulusFlexural StrengthSplitting Tensile Strength
14 days28 days14 days28 days14 days28 days14 days28 days
LC15.075.48702677041.301.340.780.91
LC25.486.02516358991.551.570.740.78
LC35.966.4612159143271.491.770.921.00
LC44.875.9615026167210.871.210.700.93
LC55.207.788509116490.921.190.720.82
LC65.257.14385857711.501.860.991.04
LC74.055.32450162680.841.300.810.93
LC84.344.80724396031.351.460.750.87
LC94.104.9613235156611.231.420.931.11
Table 12. The experimental results and corresponding S/N ratio of the fiber-reinforced LPC.
DesignationExperimental Results (MPa)S/N Ratio (dB)
fcEcfrfsfcEcfrfs
LC15.4877041.340.9114.7877.73 2.54−0.82
LC26.0258991.570.7815.5975.42 3.92−2.16
LC36.4614,3271.771.0016.2083.12 4.960.00
LC45.9616,7211.210.9315.5084.47 1.66−0.63
LC57.7811,6491.190.8217.8281.33 1.51−1.72
LC67.1457711.861.0417.0775.23 5.390.34
LC75.3262681.300.9314.5275.94 2.28−0.63
LC84.8096031.460.8713.6279.65 3.29−1.21
LC94.9615,6611.421.1113.9183.90 3.050.91
Note: fc′, compressive strength; Ec, elastic modulus; fr, flexural strength; fs, splitting tensile strength.
Table 13. The auxiliary table of the fiber-reinforced LPC.
Performance ParameterExperimental Control FactorMean S/N Ratio (η, Unit: dB)Delta
(Max. η − Min. η)
Rank
Level 1Level 2Level 3
Compressive strengthCoarse aggregate size, A15.5216.8014.022.7821
Fine aggregate content, B14.9315.6815.730.7963
Matrix type, C15.1615.0016.181.1792
Aggregate-to-binder ratio, D15.5015.7315.110.6174
Elastic
modulus
Coarse aggregate size A78.7680.3479.831.5814
Fine aggregate content, B79.3878.8080.751.9523
Matrix type, C77.5481.2680.133.7232
Aggregate-to-binder ratio, D80.9975.5382.416.8841
Flexural strengthCoarse aggregate size, A3.812.852.870.9543
Fine aggregate content, B2.162.914.472.3061
Matrix type, C3.742.872.920.8674
Aggregate-to-binder ratio, D2.373.863.301.4962
Splitting tensile strengthCoarse aggregate size, A−0.99−0.67−0.310.6812
Fine aggregate content, B−0.69−1.700.422.1131
Matrix type, C−0.56−0.63−0.780.2224
Aggregate-to-binder ratio, D−0.55−0.82−0.610.2703
Table 14. The analysis of variance and F test of the fiber-reinforced LPC.
Performance ParameterExperimental Control FactorSSZDOFMSZFZPZ
Compressive strengthCoarse aggregate size, A11.6433.8819.9469.63
Fine aggregate content, B1.1930.402.043.84
Matrix type, C2.4630.824.2126.53
Aggregate-to-binder ratio, D0.5830.191.000.00
All other/error0.5830.19
Total15.87125.29 100.00
Elastic modulusCoarse aggregate size, A3.9131.301.000.00
Fine aggregate content, B6.0232.011.541.90
Matrix type, C21.8737.295.6030.26
Aggregate-to-binder ratio, D79.22326.4120.2867.84
All other/error3.9131.30
Total111.011237.00 100.00
Flexural strengthCoarse aggregate size, A1.7930.601.252.38
Fine aggregate content, B8.3132.775.8146.00
Matrix type, C1.4330.481.0038.28
Aggregate-to-binder ratio, D3.4331.142.3913.35
All other/error1.4330.48
Total14.95124.98 100.00
Splitting tensile strengthCoarse aggregate size, A0.7030.238.918.15
Fine aggregate content, B6.7032.2385.6987.20
Matrix type, C0.0830.031.004.12
Aggregate-to-binder ratio, D0.1230.041.520.53
All other/error0.0830.03
Total7.60122.53 100.00
Notes: SSZ, sum of the squares; DOF, degree of freedom; MSZ, variance; FZ, F value; PZ, percentage of contribution.
Table 15. The results of the validation tests.
Performance ParameterInitial CombinationTest Results
(MPa)
Optimal CombinationTest Results
(MPa)
Compressive strengthA2B2C3D17.78A2B3C3D27.82
Elastic modulusA2B1C2D316721A2B3C2D317315
Flexural strengthA2B3C1D21.86A1B3C1D21.91
Splitting tensile strengthA3B3C2D11.11A3B3C1D11.22
Publisher’s Note: MDPI stays neutral with regard to jurisdictional claims in published maps and institutional affiliations.

