
Automatic Classification of Fatty Liver Disease Based on Supervised Learning and Genetic Algorithm


Abstract
:1. Introduction
2. Background
3. Materials and Methods
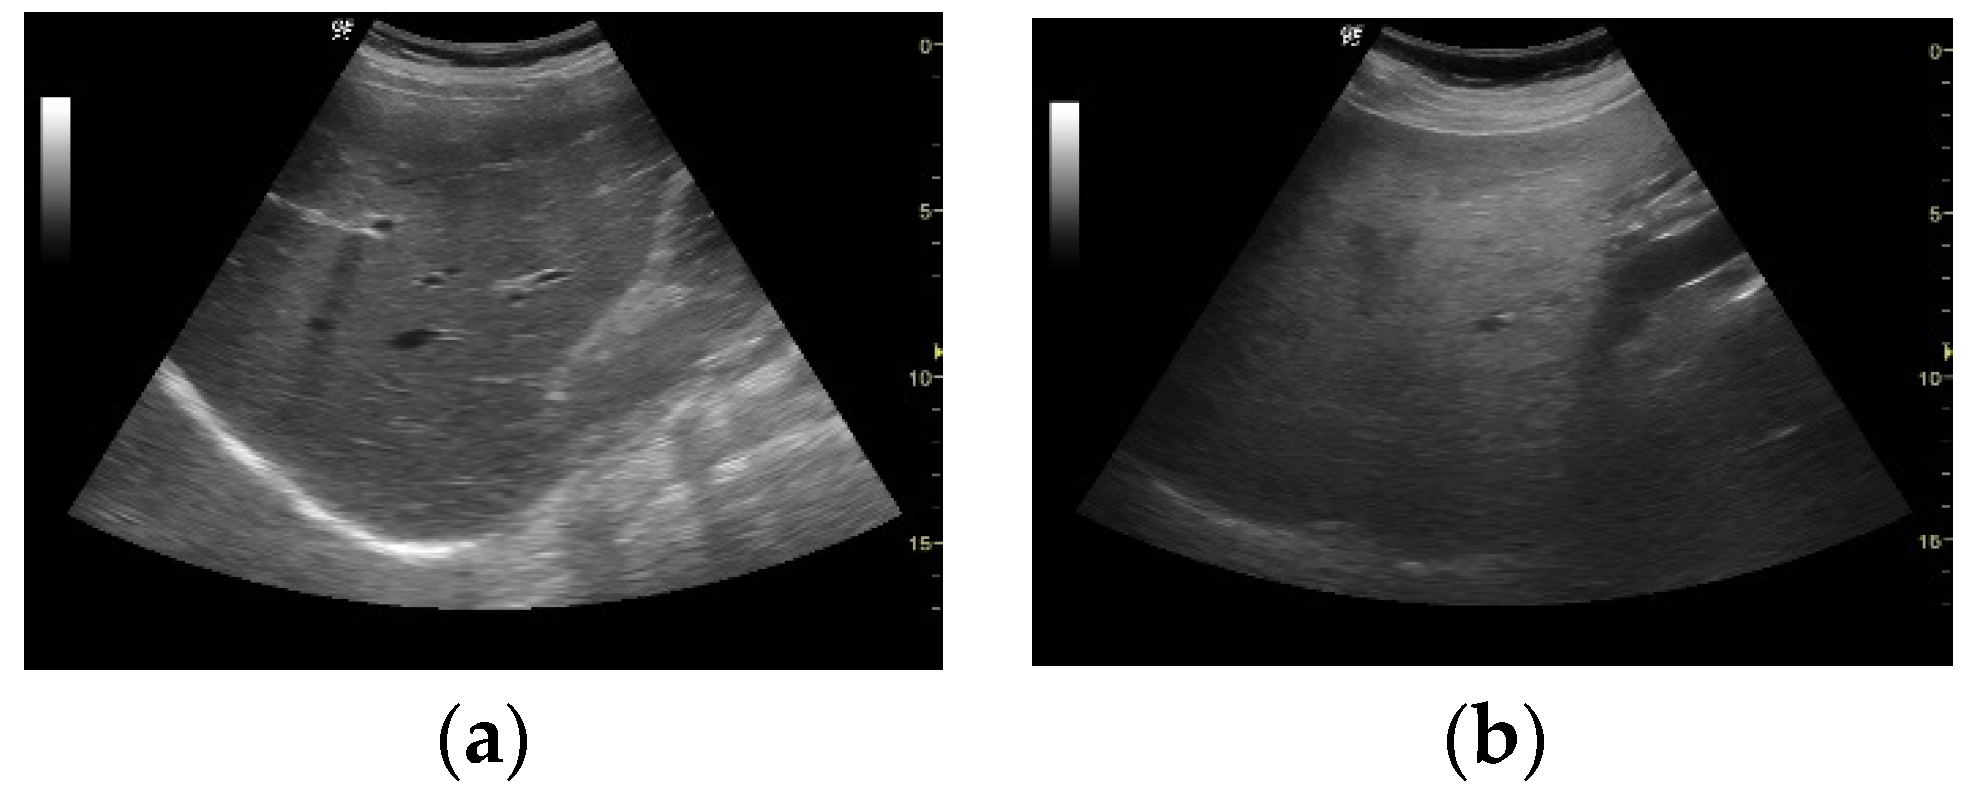
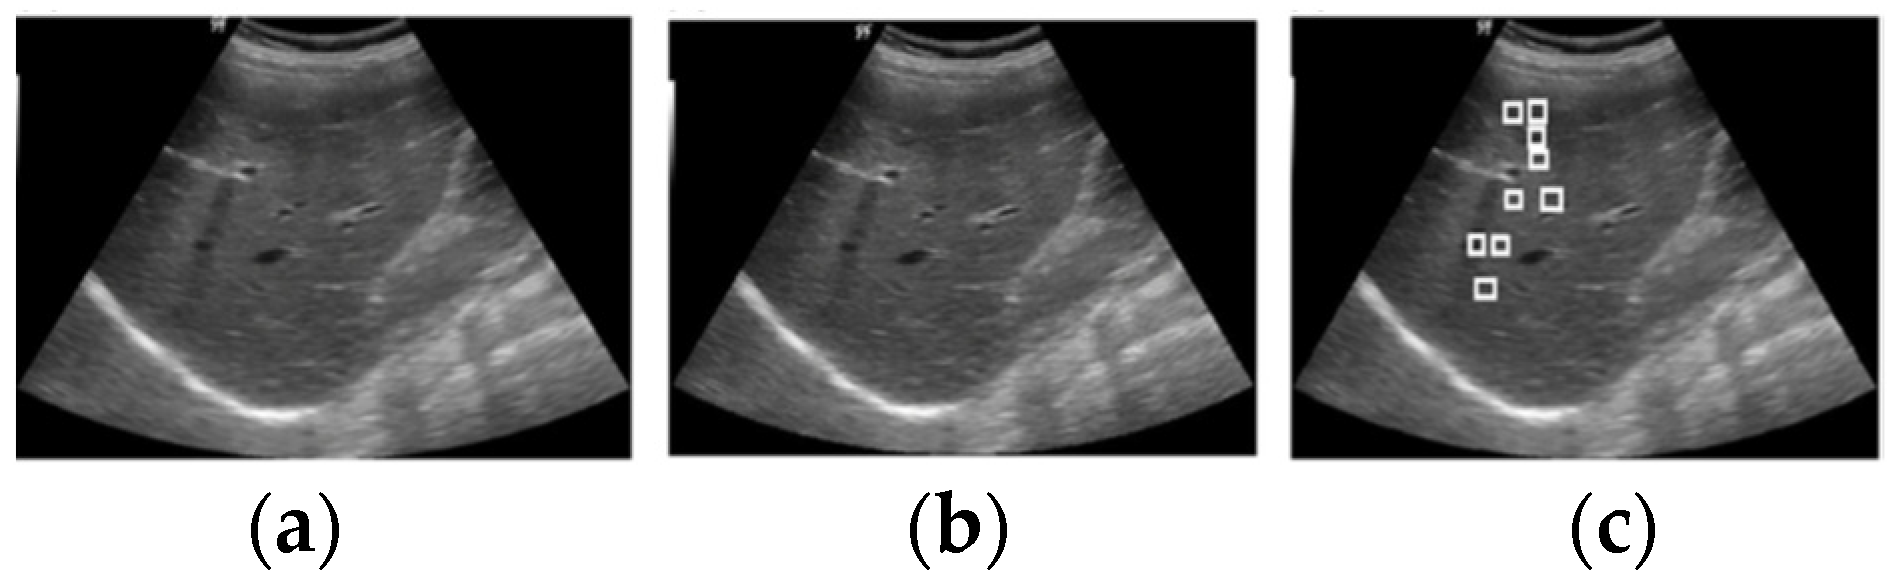
3.1. Image Acquisition
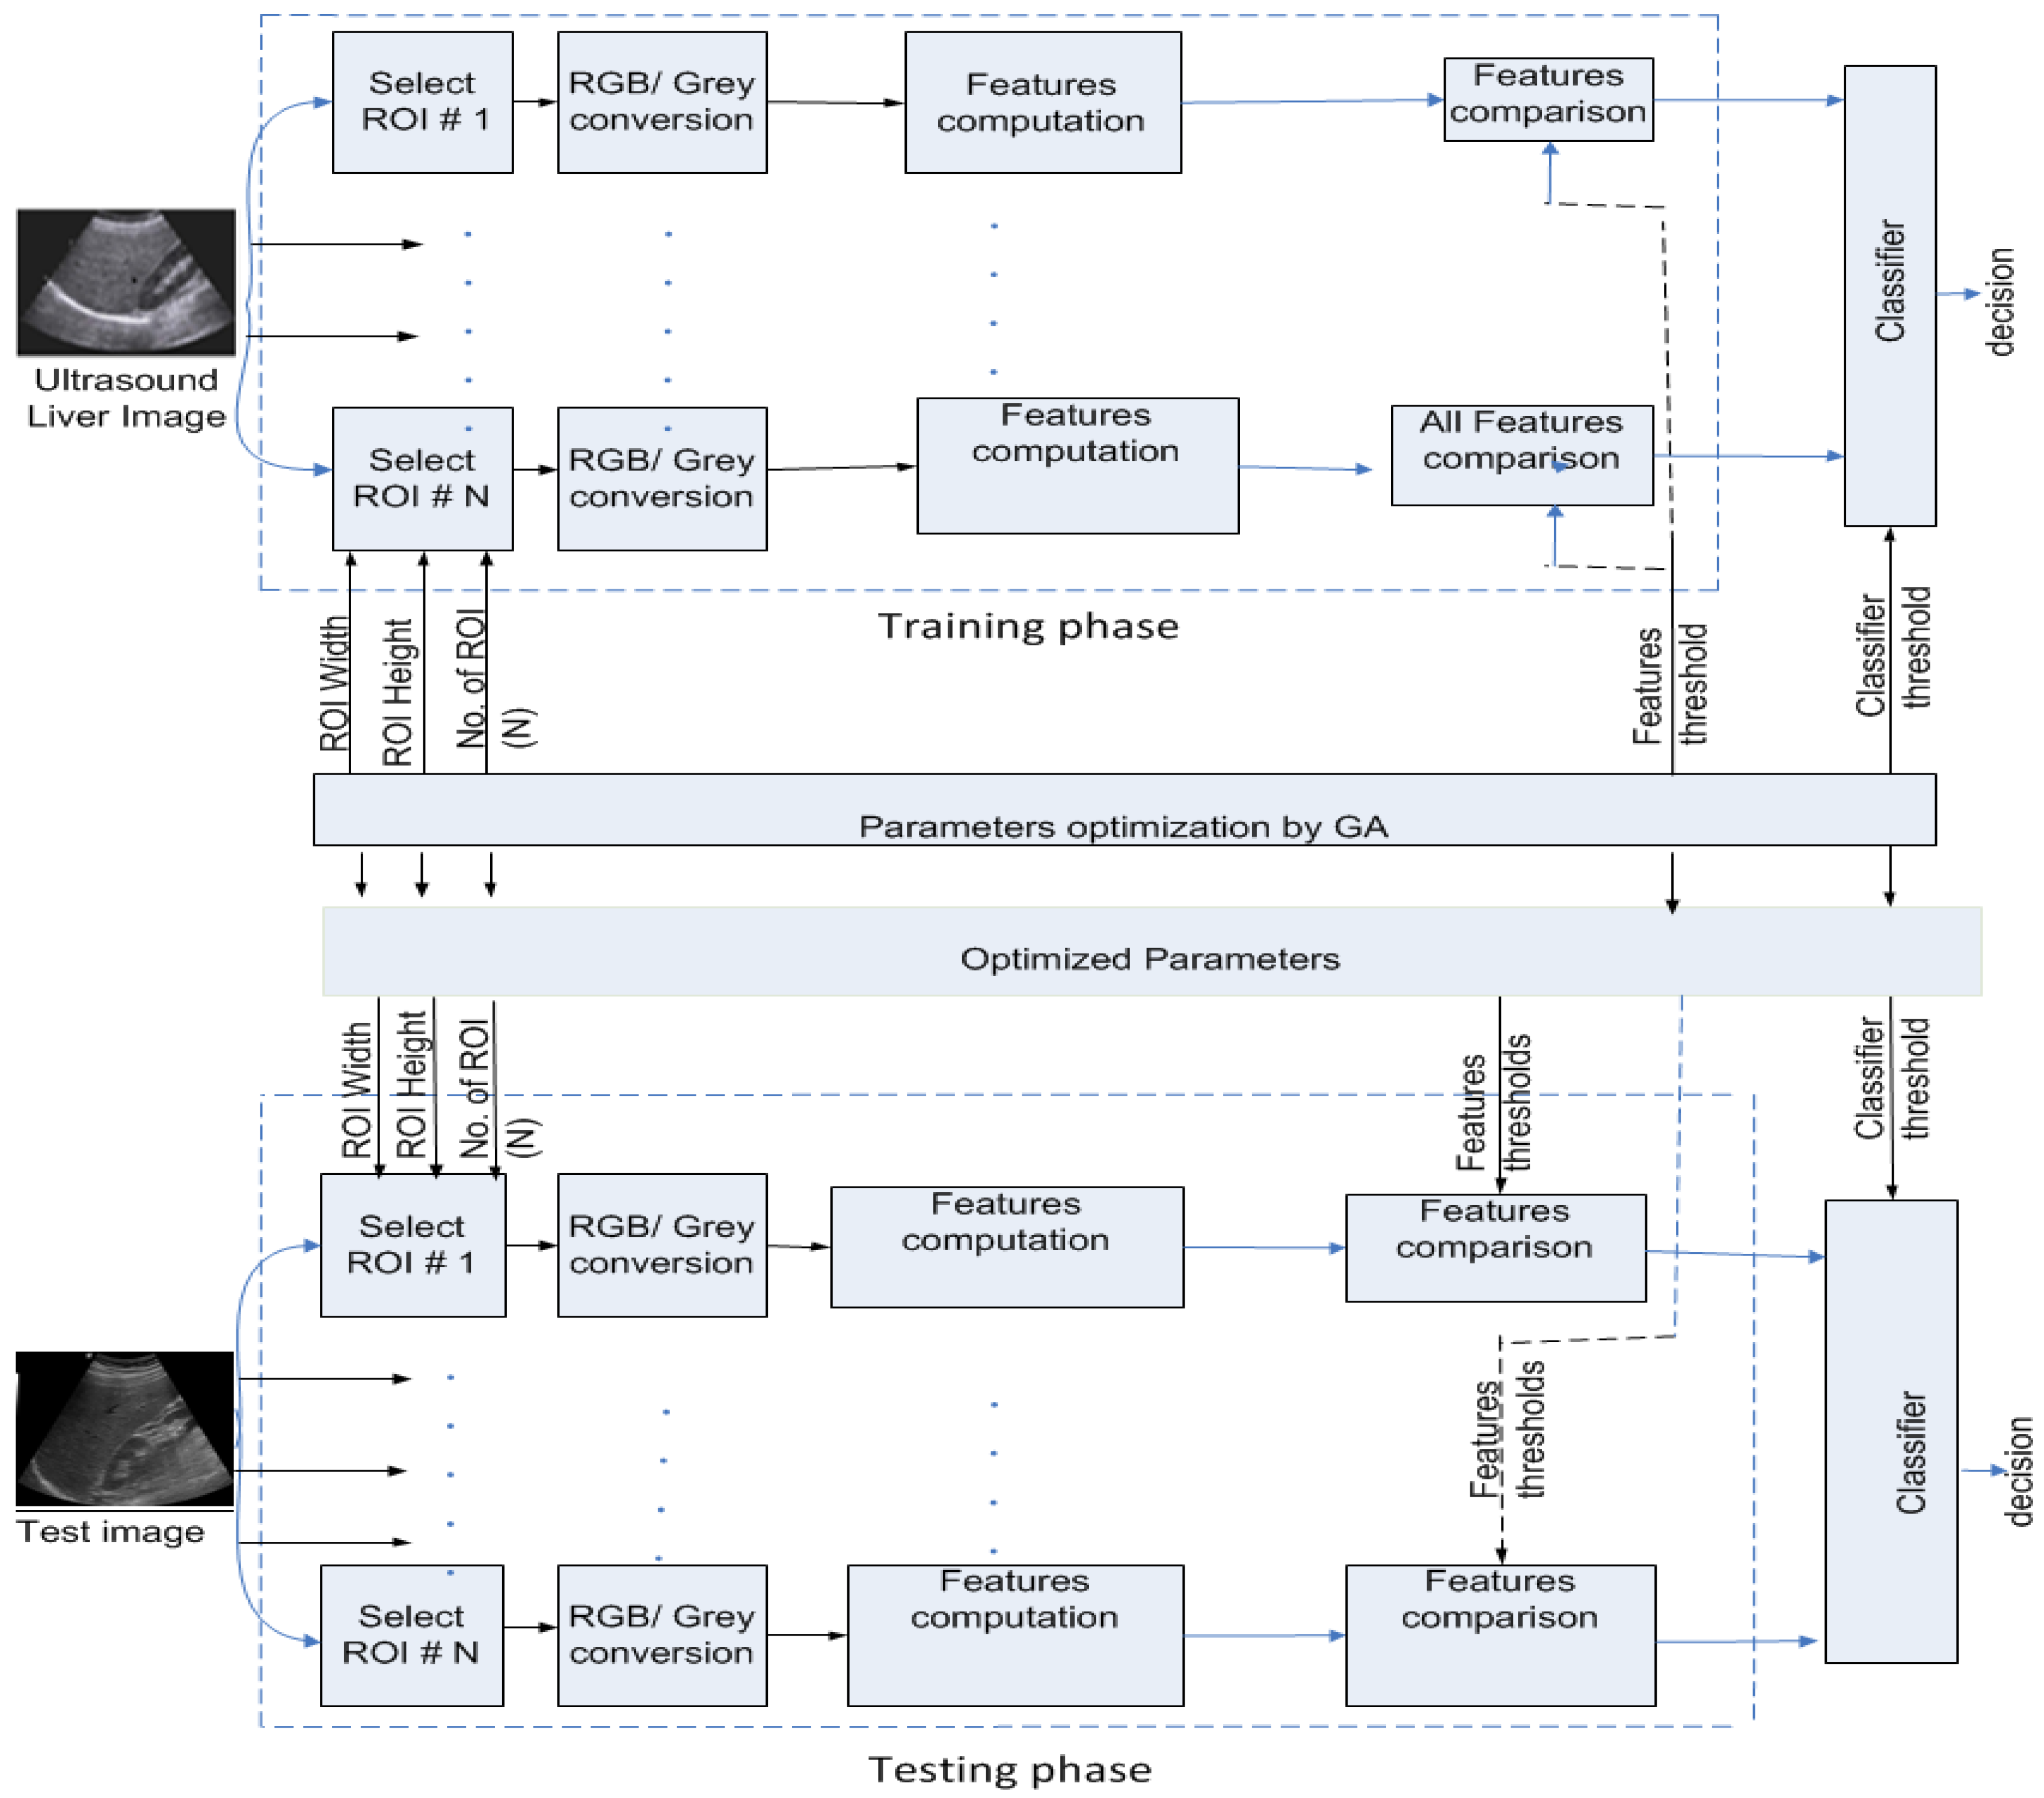
3.2. Methodology
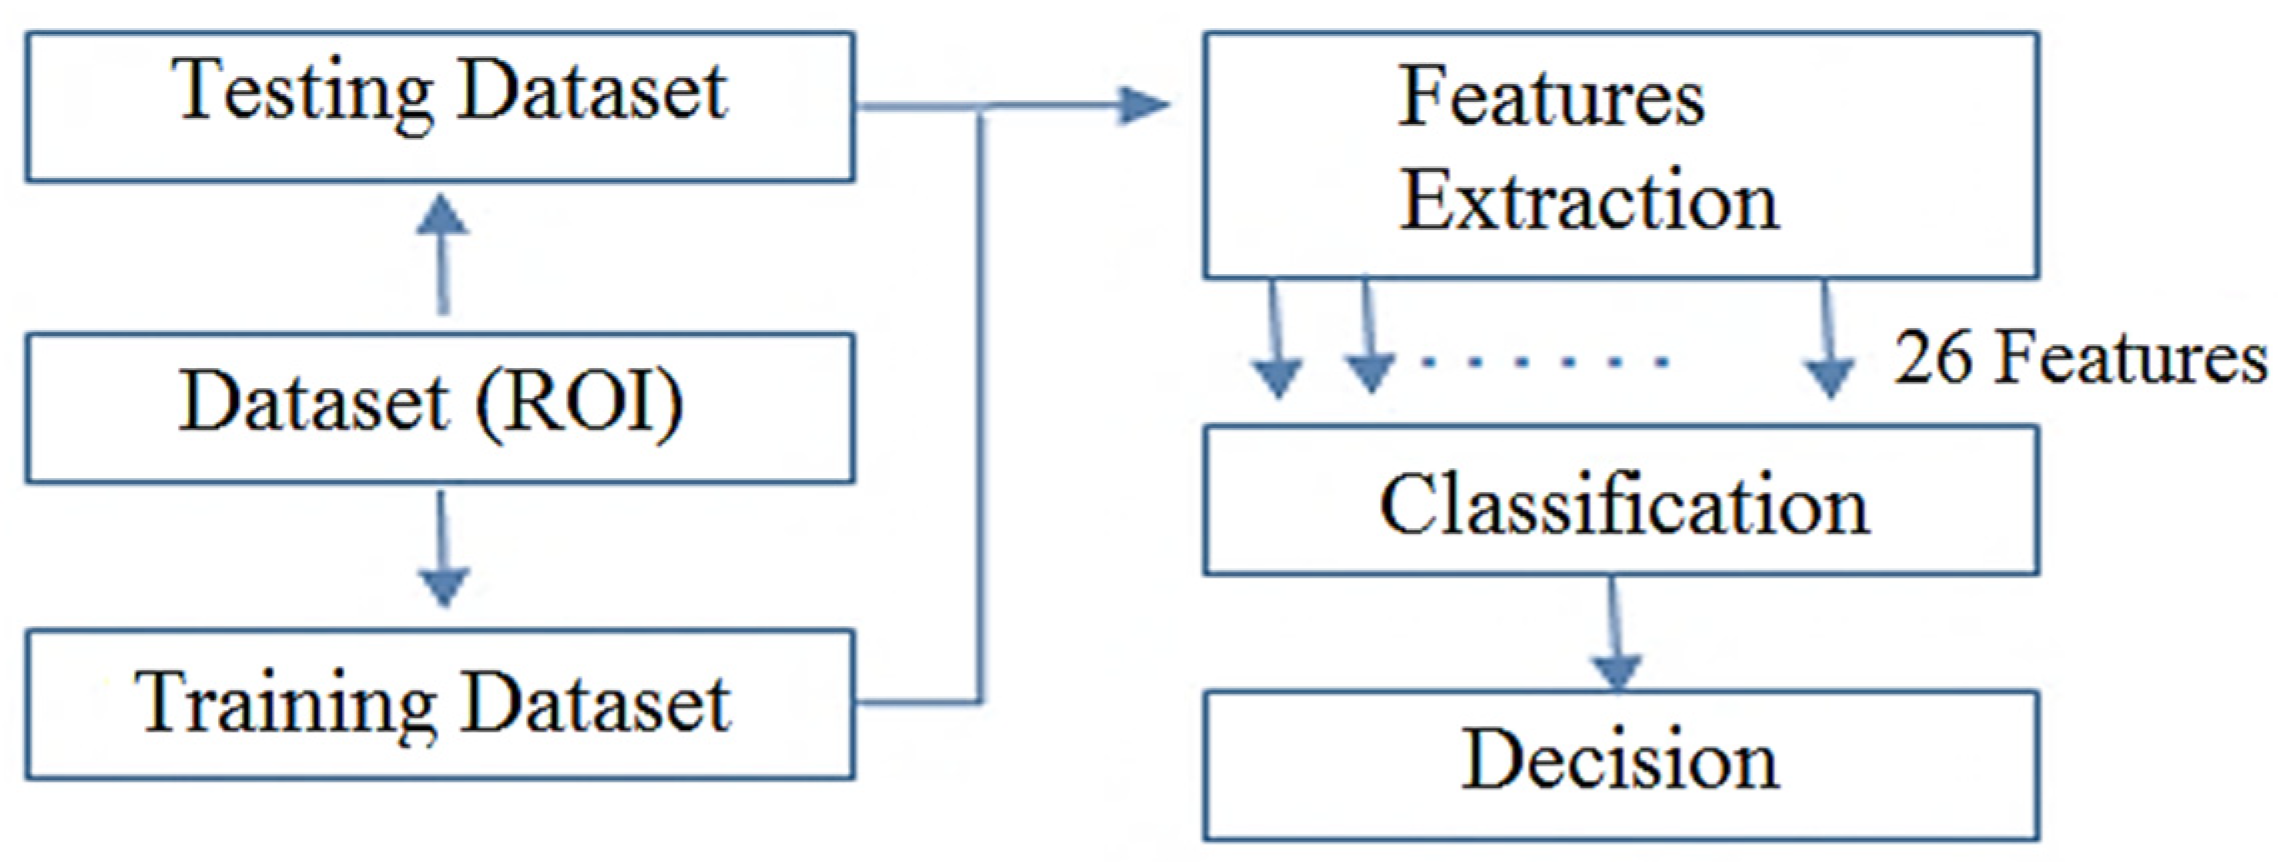
3.2.1. Feature Extraction
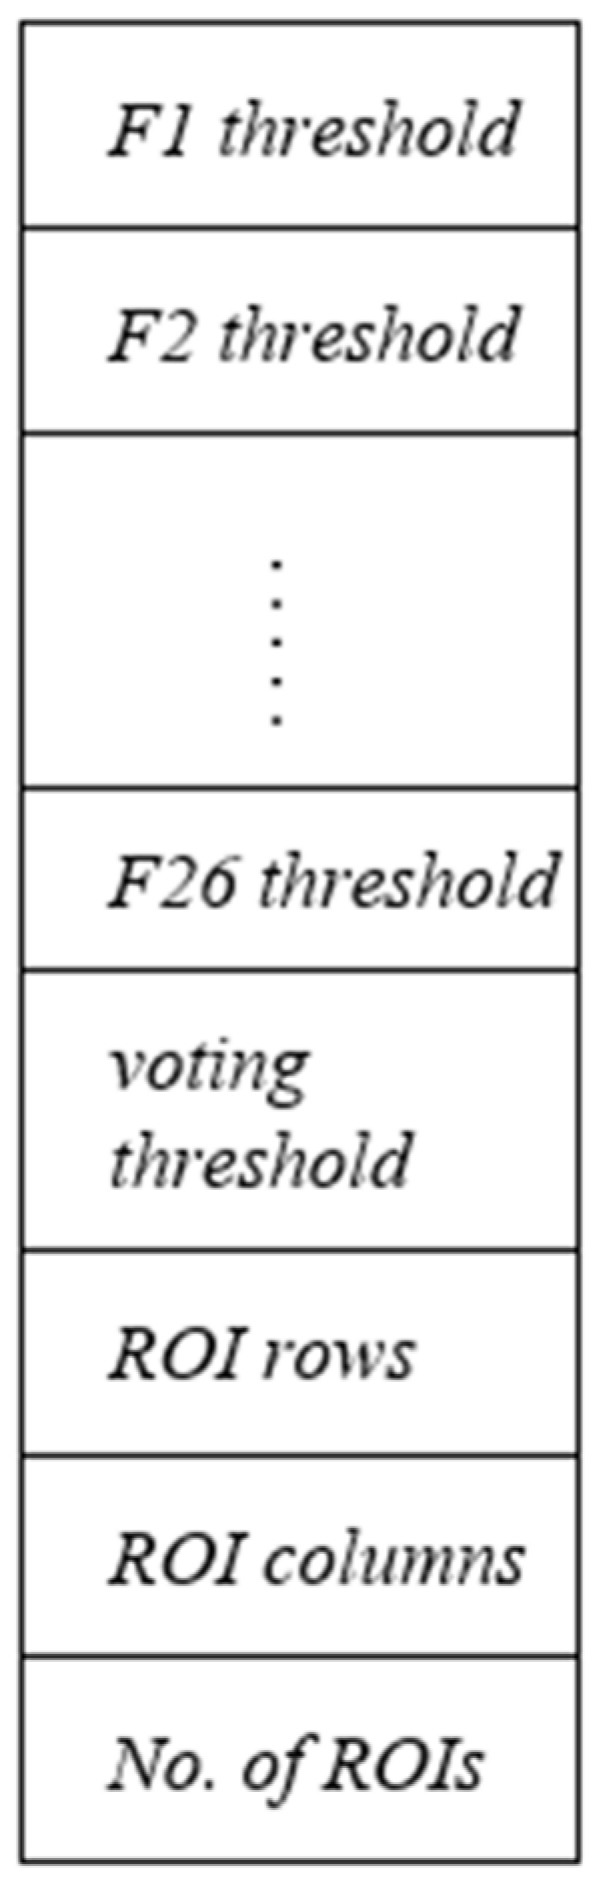
3.2.2. Classification
| Algorithm 1: Optimization of the number of ROIs, ROI size selection, and voting threshold. |
| 1. For iteration number = 1, 2, 3,……, number of iteration do |
| 2. For every chromosome do |
| Number of incorrectly classified images = 0 |
| For every training image do |
| voting = 0 |
| For every ROI of size, m x n do |
| Convert ROI into gray level using the equation: |
| Compute all 26 features |
| End for |
| If voting > voting_threshold |
| If training image = abnormal |
| Number of incorrectly classified image +1→ |
| Number of incorrectly classified image |
| End if |
| Else |
| If training image = normal |
| Number of incorrectly classified image +1→ |
| Number of incorrectly classified image |
| End if |
| End if |
| End for |
| Assign fitness score to the chromosome |
| End for |
| End for |
| 3. For every testing image do |
| voting = 0 |
| For every ROI do |
| Convert ROI into gray level |
| Compute all 26 features |
| 4. If voting > voting_threshold |
| Liver case = normal |
| Else |
| Liver case = Abnormal |
| End if |
| End for |
4. Results
4.1. Genetic Algorithm
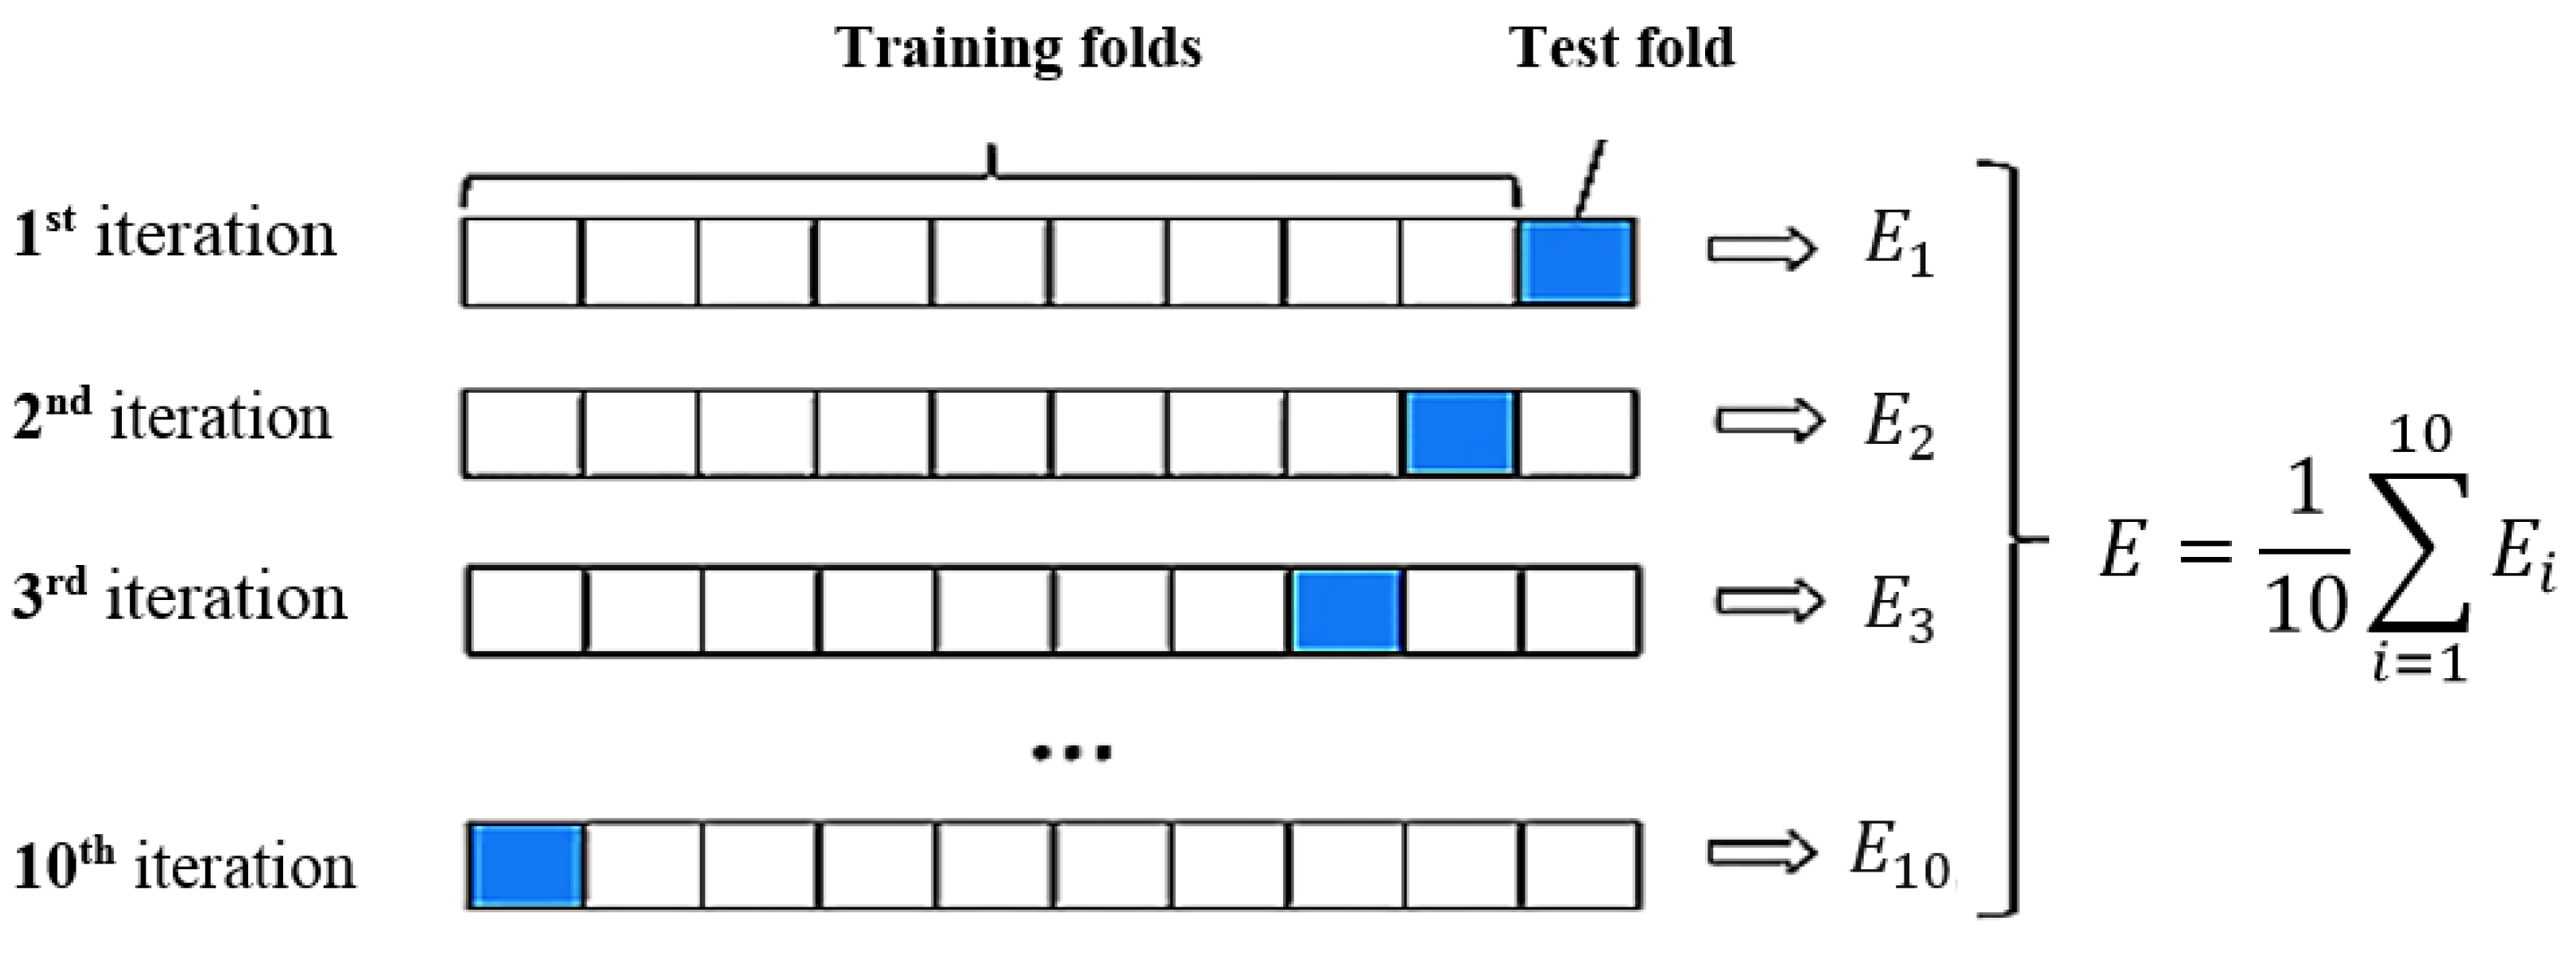
4.2. Performance Evaluation Metrics
4.3. Machine Learning Algorithms
5. Conclusions
Author Contributions
Funding
Institutional Review Board Statement
Informed Consent Statement
Data Availability Statement
Acknowledgments
Conflicts of Interest
References
- Marcellin, P.; Kutala, B.K. Liver diseases: A major, neglected global public health problem requiring urgent actions and large-scale screening. Liver Int. 2018, 38, 2–6. [Google Scholar] [CrossRef] [PubMed] [Green Version]
- Cotter, T.G.; Rinella, M. Nonalcoholic fatty liver disease 2020: The state of the disease. Gastroenterology 2020, 158, 1851–1864. [Google Scholar] [CrossRef] [PubMed]
- Stepanova, M.; De Avila, L.; Afendy, M.; Younossi, I.; Pham, H.; Cable, R.; Younossi, Z.M. Direct and indirect economic burden of chronic liver disease in the United States. Clin. Gastroenterol. Hepatol. 2017, 15, 759–766. [Google Scholar] [CrossRef]
- Kelly, N.; Wattacheril, J. Nonalcoholic fatty liver disease: Evidence-based management and early recognition of nonalcoholic steatohepatitis. J. Nurse Pract. 2019, 15, 622–626. [Google Scholar] [CrossRef] [Green Version]
- Duseja, A. Nonalcoholic fatty liver disease in India–a lot done, yet more required! Indian J. Gastroenterol. 2010, 29, 217–225. [Google Scholar] [CrossRef] [PubMed]
- Acharya, U.R.; Raghavendra, U.; Fujita, H.; Hagiwara, Y.; Koh, J.E.; Hong, T.J.; Ng, K.H. Automated characterization of fatty liver disease and cirrhosis using curvelet transform and entropy features extracted from ultrasound images. Comput. Biol. Med. 2016, 79, 250–258. [Google Scholar] [CrossRef] [PubMed]
- Sumida, Y.; Nakajima, A.; Itoh, Y. Limitations of liver biopsy and non-invasive diagnostic tests for the diagnosis of nonalcoholic fatty liver disease/nonalcoholic steatohepatitis. World J. Gastroenterol. WJG 2014, 20, 475. [Google Scholar] [CrossRef] [PubMed]
- Nalbantoglu, I.; Brunt, E.M. Role of liver biopsy in nonalcoholic fatty liver disease. World J. Gastroenterol. WJG 2014, 20, 9026. [Google Scholar]
- Tapper, E.B.; Lok, A.S.F. Use of liver imaging and biopsy in clinical practice. N. Engl. J. Med. 2017, 377, 756–768. [Google Scholar] [CrossRef]
- Castera, L. Non-invasive assessment of liver fibrosis in chronic hepatitis C. Hepatol. Int. 2011, 5, 625–634. [Google Scholar] [CrossRef] [Green Version]
- Sanchez, L.E.; Rundo, L.; Gill, A.B.; Hoare, M.; Serrao, E.M.; Sala, E. Robustness of radiomic features in CT images with different slice thickness, comparing liver tumour and muscle. Sci. Rep. 2021, 11, 8262. [Google Scholar] [CrossRef]
- Shafiq-ul-Hassan, M.; Latifi, K.; Zhang, G.; Ullah, G.; Gillies, R.; Moros, E. Voxel size and gray level normalization of CT radiomic features in lung cancer. Sci. Rep. 2018, 8, 8262. [Google Scholar] [CrossRef]
- Van Beers, B.E.; Daire, J.L.; Garteiser, P. New imaging techniques for liver diseases. J. Hepatol. 2015, 62, 690–700. [Google Scholar] [CrossRef] [Green Version]
- Shahbazi, H.; Taban, M.R.; Abouei, J. A new approach to design sensing matrix based on the sparsity constant with applications to computed tomography. IEEE Access 2019, 7, 175396–175410. [Google Scholar] [CrossRef]
- Zhang, Y.D.; Zhang, Y.; Dong, Z.; Yuan, T.F.; Han, L.; Yang, M.; Lu, H. IEEE Access Special Section Editorial: Advanced Signal Processing Methods In Medical Imaging. IEEE Access 2018, 6, 61812–61818. [Google Scholar] [CrossRef]
- Sharma, V.; Juglan, K.C. Automated classification of fatty and normal liver ultrasound images based on mutual information feature selection. IRBM 2018, 39, 313–323. [Google Scholar] [CrossRef]
- Ahmad, O.F.; Soares, A.S.; Mazomenos, E.; Brandao, P.; Vega, R.; Seward, E.; Lovat, L.B. Artificial intelligence and computer-aided diagnosis in colonoscopy: Current evidence and future directions. Lancet Gastroenterol. Hepatol. 2019, 4, 71–80. [Google Scholar] [CrossRef] [Green Version]
- Andrade, A.; Silva, J.S.; Santos, J.; Belo-Soares, P. Classifier approaches for liver steatosis using ultrasound images. Procedia Technol. 2012, 5, 763–770. [Google Scholar] [CrossRef] [Green Version]
- Singh, M.; Singh, S.; Gupta, S. An information fusion based method for liver classification using texture analysis of ultrasound images. Inf. Fusion 2014, 19, 91–96. [Google Scholar] [CrossRef]
- Yeh, W.C.; Jeng, Y.M.; Li, C.H.; Lee, P.H.; Li, P.C. Liver steatosis classification using high-frequency ultrasound. Ultrasound Med. Biol. 2005, 31, 599–605. [Google Scholar] [CrossRef]
- Ribeiro, R.; Sanches, J. Fatty liver characterization and classification by ultrasound. In Iberian Conference on Pattern Recognition and Image Analysis; Springer: Berlin/Heidelberg, Germany, 2009; pp. 354–361. [Google Scholar]
- Mittal, D.; Kumar, V.; Saxena, S.C.; Khandelwal, N.; Kalra, N. Neural network based focal liver lesion diagnosis using ultrasound images. Comput. Med. Imaging Gr. 2011, 35, 315–323. [Google Scholar] [CrossRef]
- Acharya, U.R.; Sree, S.V.; Ribeiro, R.; Krishnamurthi, G.; Marinho, R.T.; Sanches, J.; Suri, J.S. Data mining framework for fatty liver disease classification in ultrasound: A hybrid feature extraction paradigm. Med. Phys. 2012, 39, 4255–4264. [Google Scholar] [CrossRef] [Green Version]
- Ribeiro, R.; Marinho, R.T.; Sanches, J.M. Global and local detection of liver steatosis from ultrasound. In Proceedings of the 2012 Annual International Conference of the IEEE Engineering in Medicine and Biology Society, San Diego, CA, USA, 28 August–1 September 2012; IEEE: Piscataway, NY, USA, 2012; pp. 6547–6550. [Google Scholar]
- Li, G.; Luo, Y.; Deng, W.; Xu, X.; Liu, A.; Song, E. Computer aided diagnosis of fatty liver ultrasonic images based on support vector machine. In Proceedings of the 2008 30th Annual International Conference of the IEEE Engineering in Medicine and Biology Society, Vancouver, BC, Canada, 20–24 August 2008; IEEE: Piscataway, NY, USA, 2008; pp. 4768–4771. [Google Scholar]
- Kalyan, K.; Jakhia, B.; Lele, R.D.; Joshi, M.; Chowdhary, A. Artificial neural network application in the diagnosis of disease conditions with liver ultrasound images. Adv. Bioinform. 2014, 2014, 708279. [Google Scholar] [CrossRef] [Green Version]
- Rong, H.; Wang, H.M.; Liu, J.; Xian, M. Privacy-preserving k-nearest neighbor computation in multiple cloud environments. IEEE Access 2016, 4, 9589–9603. [Google Scholar] [CrossRef]
- Meejaroen, K.; Chaweechan, C.; Khodsiri, W.; Khu-Smith, V.; Watchareeruetai, U.; Sornmagura, P.; Kittiyakara, T. Detection of fibrosis in liver biopsy images by using Bayesian classifier. In Proceedings of the 2015 7th International Conference on Knowledge and Smart Technology (KST), Chon Buri, Thailand, 28–31 January 2015; IEEE: Piscataway, NY, USA, 2015; pp. 184–189. [Google Scholar]
- Abdelaal, H.M.; Elemary, B.R.; Youness, H.A. Classification of hadith according to its content based on supervised learning algorithms. IEEE Access 2019, 7, 152379–152387. [Google Scholar] [CrossRef]
- He, Q.; Xu, Z.; Li, S.; Li, R.; Zhang, S.; Wang, N.; Chen, W. Novel entropy and rotation forest-based credal decision tree classifier for landslide susceptibility modeling. Entropy 2019, 21, 106. [Google Scholar] [CrossRef] [Green Version]
- Ibrahim, A.; Tharwat, A.; Gaber, T.; Hassanien, A.E. Optimized superpixel and AdaBoost classifier for human thermal face recognition. Signal Image Video Processing 2018, 12, 711–719. [Google Scholar] [CrossRef]
- Di Ruberto, C.; Loddo, A.; Putzu, L. A multiple classifier learning by sampling system for white blood cells segmentation. In Proceedings of the International Conference on Computer Analysis of Images and Patterns, Valletta, Malta, 2–4 September 2015; Springer: Cham, Switzerland, 2015; pp. 415–425. [Google Scholar]
- Chlebus, G.; Meine, H.; Moltz, J.H.; Schenk, A. Neural network-based automatic liver tumor segmentation with random forest-based candidate filtering. arXiv 2017, arXiv:1706.00842. [Google Scholar]
- Wu, C.C.; Yeh, W.C.; Hsu, W.D.; Islam, M.M.; Nguyen, P.A.A.; Poly, T.N.; Wang, Y.C.; Yang, H.C.; Li, Y.C.J. Prediction of fatty liver disease using machine learning algorithms. Comput. Methods Programs Biomed. 2019, 170, 23–29. [Google Scholar] [CrossRef]
- Das, A.; Das, P.; Panda, S.S.; Sabut, S. Adaptive fuzzy clustering-based texture analysis for classifying liver cancer in abdominal CT images. Int. J. Comput. Biol. Drug Des. 2018, 11, 192–208. [Google Scholar] [CrossRef]
- Ma, J.; Li, Y.; Wu, Y.; Zhang, M.; He, J.; Qiu, Y.; Yang, X. Automatic Liver Tumor Segmentation Based on Random Forest and Fuzzy Clustering. In International Conference on Sensing and Imaging; Springer: Cham, Switzerland, 2017; pp. 403–410. [Google Scholar]
- Muthuswamy, J. Extraction and Classification of Liver Abnormality Based on Neutrosophic and SVM Classifier. In Progress in Advanced Computing and Intelligent Engineering; Springer: Singapore, 2019; pp. 269–279. [Google Scholar]
- Bhardwaj, R.; Mehta, R.; Ramani, P. A Comparative Study of Classification Algorithms for Predicting Liver Disorders. In Intelligent Computing Techniques for Smart Energy Systems; Springer: Singapore, 2020; pp. 753–760. [Google Scholar]
- Zhu, Y.; Gao, W.; Guo, Z.; Zhou, Y.; Zhou, Y. Liver tissue classification of en face images by fractal dimension-based support vector machine. J. Biophotonics 2020, 13, e201960154. [Google Scholar] [CrossRef]
- Cao, Y.; Hu, Z.D.; Liu, X.F.; Deng, A.M.; Hu, C.J. An MLP classifier for prediction of HBV-induced liver cirrhosis using routinely available clinical parameters. Dis. Markers 2013, 35, 653–660. [Google Scholar] [CrossRef] [Green Version]
- Wu, S.G.; Bao, F.S.; Xu, E.Y.; Wang, Y.X.; Chang, Y.F.; Xiang, Q.L. A leaf recognition algorithm for plant classification using probabilistic neural network. In Proceedings of the 2007 IEEE International Symposium on Signal Processing and Information Technology, Giza, Egypt, 15–18 December 2007; IEEE: Piscataway, NY, USA, 2007; pp. 11–16. [Google Scholar]
- Castiglioni, I.; Rundo, L.; Codari, M.; Di Leo, G.; Salvatore, C.; Interlenghi, M.; Sardanelli, F. AI applications to medical images: From machine learning to deep learning. Phys. Med. 2021, 83, 9–24. [Google Scholar] [CrossRef]
- Riquelme, D.; Akhloufi, M.A. Deep learning for lung cancer nodules detection and classification in CT scans. AI 2020, 1, 28–67. [Google Scholar] [CrossRef] [Green Version]
- Reddy, D.S.; Bharath, R.; Rajalakshmi, P. A novel computer-aided diagnosis framework using deep learning for classification of fatty liver disease in ultrasound imaging. In Proceedings of the 2018 IEEE 20th International Conference on e-Health Networking, Applications and Services (Healthcom), Ostrava, Czech Republic, 17–20 September 2018; IEEE: Piscataway, NY, USA, 2018; pp. 1–5. [Google Scholar]
- GE Healthcare LOGIQ P5 User Manual. Available online: https://www.manualsdir.com/manuals/254628/ge-healthcare-logiq-p5.html?download (accessed on 8 January 2021).
- Gaber, A.; Attiya, G.; Hamdy, A.; Elsayed, T. Recognition of diffuse liver cirrhosis based on image analysis. Imaging Sci. J. 2016, 64, 152–159. [Google Scholar] [CrossRef]
- Cao, J.; Lin, Z.; Huang, G.B.; Liu, N. Voting based extreme learning machine. Inf. Sci. 2012, 185, 66–77. [Google Scholar] [CrossRef]
- Abdelaal, H.M.; Ahmed, A.M.; Ghribi, W.; Alansary, H.A.Y. Knowledge Discovery in the Hadith According to the Reliability and Memory of the Reporters Using Machine Learning Techniques. IEEE Access 2019, 7, 157741–157755. [Google Scholar] [CrossRef]
- Mabrouk, A.G.; Hamdy, A.; Abdelaal, H.M.; Elkattan, A.G.; Elshourbagy, M.M.; Youness, H.A. Automatic Classification Algorithm for Diffused Liver Diseases Based on Ultrasound Images. IEEE Access 2021, 9, 5760–5768. [Google Scholar] [CrossRef]
- Santos, J.; Silva, J.S.; Santos, A.A.; Belo-Soares, P. Detection of pathologic liver using ultrasound images. Biomed Signal Process Control. 2014, 14, 248–255. [Google Scholar] [CrossRef]
- Rundo, L.; Tangherloni, A.; Galimberti, S.; Cazzaniga, P.; Woitek, R.; Sala, E.; Nobile, M.S.; Mauri, G. HaraliCU: GPU-powered Haralick feature extraction on medical images exploiting the full dynamics of gray-scale levels. In International Conference on Parallel Computing Technologies; Springer: Cham, Switzerland, 2019; pp. 304–318. [Google Scholar] [CrossRef]
- Tsai, H.Y.; Zhang, H.; Hung, C.L.; Min, G. GPU-accelerated features extraction from magnetic resonance images. IEEE Access 2017, 5, 22634–22646. [Google Scholar] [CrossRef]


| Diseases | Causes | Ultrasound Findings |
|---|---|---|
| Fatty liver | Drug misuse, contaminants, metabolic illness, and obesity | Fine parenchymal texture, decreased number of vessels, hepatomegaly, and increased echogenicity |
| Hepatitis | Infections from viruses/bacteria or parasites. | Diffusely decreased echogenicity and hepatomegaly |
| Fibrosis | Hepatic venous obstruction, chronic hepatitis, metabolic disorder, prolonged cholestasis, and immune disorder | Healthy appearance of liver, a slight increase in echogenicity, and coarse echo-texture |
| Cirrhosis | Cystic fibrosis, hepatitis, Wilson’s disease, alpha 1-antitrypsin deficiency, and immune disorder | Shrunken liver, rounded contours, small right lobe with enlarged left and caudate lobes, (volume redistribution), regenerative nodules, and nodularity resulted in portal hypertension manifestations of surface irregularity. Decreased number of vessels. |
| Diagnosis Methods | Weaknesses and Drawbacks of These Methods | Drawbacks of Those Methods |
|---|---|---|
| Liver Biopsy | Examination with prognostic value. Links with the level of liver injury. | It is a technique of invasiveness. Complications such as bleeding and discomfort are likely. Operator dependent. |
| Blood tests | The leading supporter in the assessment of essential liver function. High sensitivity with improved standards of ALT and AST. | Low specificity. No relationship with the level of diffused liver tissue injury. |
| MRI | Possibility of analysis of spectroscopy. Proper quantification of the fat content of the human liver. | The high expense of the test. The fat quantification mistakes (or inaccuracies) in the presence of high iron concentration. Unsuitable for patients with planted electronic devices, for example, pacemakers. |
| CT | Characterize fatty or (steatosis) by the lower liver intensity. Quantitative measurement. | Low sensitivity for early-stage fatty (or steatosis). Use of ionizing radiation. Interequipment variability. |
| Ultrasound | Advised for initial diagnosis. The high specificity of fat. Accumulation is greater than 33%. Effective, low cost, and noninvasive. | Inappropriate for cases with high Body Mass Index (BMI). Intraoperator variability. Operator dependent. |
| (a) Classification percentages for the training images. | |||
| Case | True Images | False Images | Total |
| Training images | 228 | 2 | 230 |
| Accuracy | 99.13% | 0.87% | 100% |
| (b) Classification calculations for the testing US images. | |||
| Case | True Images | False Images | Total |
| Testing images | 67 | 3 | 70 |
| Accuracy | 95.71% | 4.29% | 100% |
| Case: Normal/Fatty (70 Test Images) 35 Normal and 35 Fatty | |
|---|---|
| TP | 33 (94.28%) |
| TN | 34 (97.14%) |
| FP | 2 (5.71%) |
| FN | 1 (2.85%) |
| Total | 70 |
| Performance Metrics | Percentage |
|---|---|
| Accuracy | 95.71% |
| Precision | 94.28% |
| Sensitivity | 97.05% |
| Specificity | 94.44% |
| F1-score | 95.64% |
| Authors | Classes (No. of Patients) | Features/Classifier | Performance |
|---|---|---|---|
| Acharya et al. [23] | 42 Natural, 58 Fatty | Texture, wavelet transform, and DT/HOS and FSC | An accuracy: 93.3% |
| Andrade et al. [18] | Natural, Fatty. 177 echographic ultrasonic images were acquired from 36 patients | GLRLM, law’s texture energy, FOS, GLCM, and fractal dimension/ANN, SVM&KNN | 76.92% 79.77% 74.05% respectively |
| Kalyan et al. [26] | Natural (30), Fatty (10), Cirrhotic (10), Hep. (10) | GLRLM, Invariant moments, Intensity histogram, GLCM/BPNN | 92.5% |
| Santos et al. [50] | Natural (68), Fatty (52) | FOS, GLCM, GLRLM, Gabor filter, Laws’ filter, lacunarity, fractal dimension, hepatorenal coefficient, attenuation/ ANN, SVM, k-NN, Bayes, DT | classifiers fusion:79% |
| Sharma et al. [16] | 45 Natural, 45 Fatty | FOS, GLCM, GLRLM, Law’s TEM, FPS, Fractal | Accuracy: 95.55%, |
| The current work | Natural (155), Fatty (145) | 26 features/Voting Function | Accuracy: 95.71% |
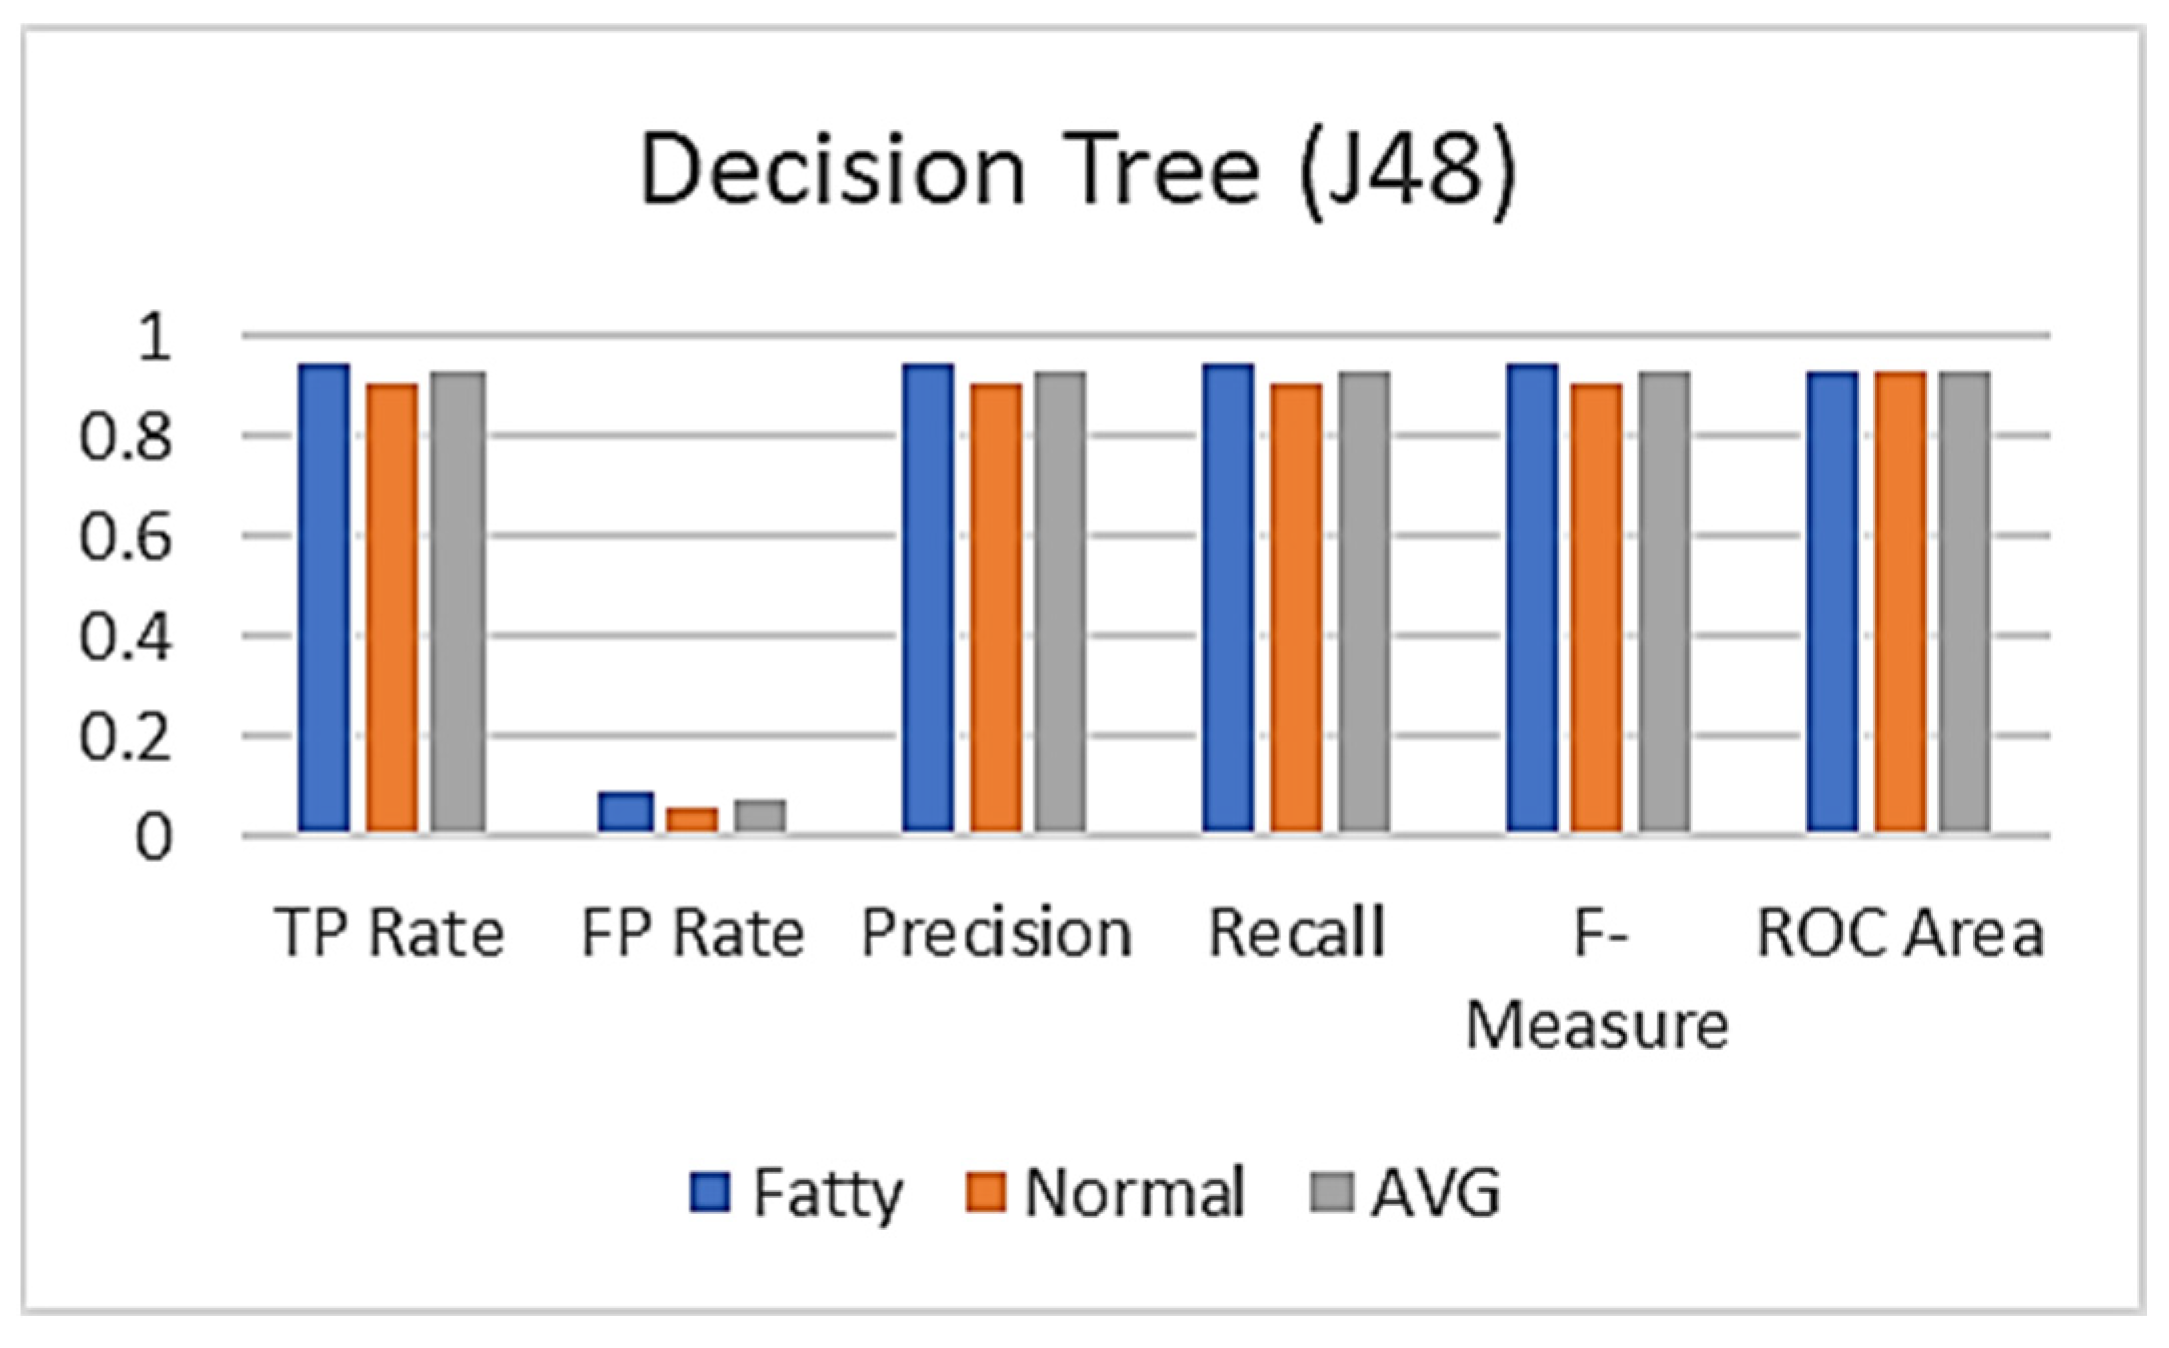
| Decision Tree (J48) | ||||||
|---|---|---|---|---|---|---|
| Class | TP Rate | FP Rate | Precision | Recall | F-Measure | ROC Area |
| Fatty | 0.944 | 0.091 | 0.944 | 0.944 | 0.944 | 0.927 |
| Normal | 0.909 | 0.056 | 0.909 | 0.909 | 0.909 | 0.927 |
| AVG | 0.931 | 0.077 | 0.931 | 0.931 | 0.931 | 0.927 |
Publisher’s Note: MDPI stays neutral with regard to jurisdictional claims in published maps and institutional affiliations. |
© 2022 by the authors. Licensee MDPI, Basel, Switzerland. This article is an open access article distributed under the terms and conditions of the Creative Commons Attribution (CC BY) license (https://creativecommons.org/licenses/by/4.0/).
Share and Cite
Gaber, A.; Youness, H.A.; Hamdy, A.; Abdelaal, H.M.; Hassan, A.M. Automatic Classification of Fatty Liver Disease Based on Supervised Learning and Genetic Algorithm. Appl. Sci. 2022, 12, 521. https://doi.org/10.3390/app12010521
Gaber A, Youness HA, Hamdy A, Abdelaal HM, Hassan AM. Automatic Classification of Fatty Liver Disease Based on Supervised Learning and Genetic Algorithm. Applied Sciences. 2022; 12(1):521. https://doi.org/10.3390/app12010521
Chicago/Turabian StyleGaber, Ahmed, Hassan A. Youness, Alaa Hamdy, Hammam M. Abdelaal, and Ammar M. Hassan. 2022. "Automatic Classification of Fatty Liver Disease Based on Supervised Learning and Genetic Algorithm" Applied Sciences 12, no. 1: 521. https://doi.org/10.3390/app12010521
APA StyleGaber, A., Youness, H. A., Hamdy, A., Abdelaal, H. M., & Hassan, A. M. (2022). Automatic Classification of Fatty Liver Disease Based on Supervised Learning and Genetic Algorithm. Applied Sciences, 12(1), 521. https://doi.org/10.3390/app12010521