Article

Design Proposal for Masonry Infill Walls Subject to Seismic Actions

ISISE, Department of Civil Engineering, University of Minho, 4800 Guimarães, Portugal
*
Author to whom correspondence should be addressed.
Appl. Sci. 2022, 12(1), 503; https://doi.org/10.3390/app12010503
Submission received: 14 December 2021 / Revised: 30 December 2021 / Accepted: 3 January 2022 / Published: 5 January 2022
(This article belongs to the Special Issue Advanced Seismic Evaluation of Relevant Architectures)

Abstract

:
Several factors influence the behaviour of masonry infilled frames, which have been the subject of previous research with moderate success. The new generation of European design standards imposes the need to prevent the brittle collapse of infills and makes the structural engineer accountable for this requirement, yet it fails to provide sufficient information for masonry infill design. The present study aimed to compare experimental results with the provisions of the standard for the computation of the demand and capacity of infilled frames. Three reinforced concrete buildings with different infill solutions were constructed at a 1:1.5 scale. The infill walls were tested until collapse, or severe damage, using the shake table of the National Laboratory for Civil Engineering, Portugal, and their response was measured using accelerometers attached to the walls. The European normative standard provides results close to the experimental ones as far as demand and capacity are concerned. Based on the experiments, two design proposals for infill walls are presented here, one for the definition of the natural frequency of the infills, and another for a reduction factor to account for the presence of openings in the out-of-plane capacity of infills.

1. Introduction

Even though the study of masonry infilled frames started several decades ago, there remain many factors that influence their behaviour, such as mechanical properties of the materials, aspect ratio, boundary conditions, the presence of reinforcement or the presence of openings. The role of infill walls in the global performance of frame structures subjected to seismic action is well known, see e.g., [1], as well as the requirements to ensure that the influence of the infill is either positive or neutral [2]. The demonstration that more studies are needed is revealed by the behaviour observed during recent earthquakes, which can be analysed from a lifesaving (Ultimate Limit State), or economic perspective (Serviceability Limit State). Infill walls often collapse out-of-plane, see Figure 1, even for structures designed using the recent design codes, and up to 80% of the full cost of buildings can be needed to reconstruct non-structural elements [3].
The present study compares experimental results from shake table tests on reinforced and unreinforced clay brick masonry infills, built within reinforced concrete frames, using the provisions of design standards and reference literature. For that purpose, three buildings were tested on the shake table of the National Laboratory for Civil Engineering, Portugal, at a scale of 1:1.5. The specimens were subjected to increasing levels of horizontal accelerations in the two orthogonal main directions. The experimental demand and capacity were computed using accelerometers bolted to the infill walls.

2. Out-of-Plane Behaviour of Masonry Infill Walls

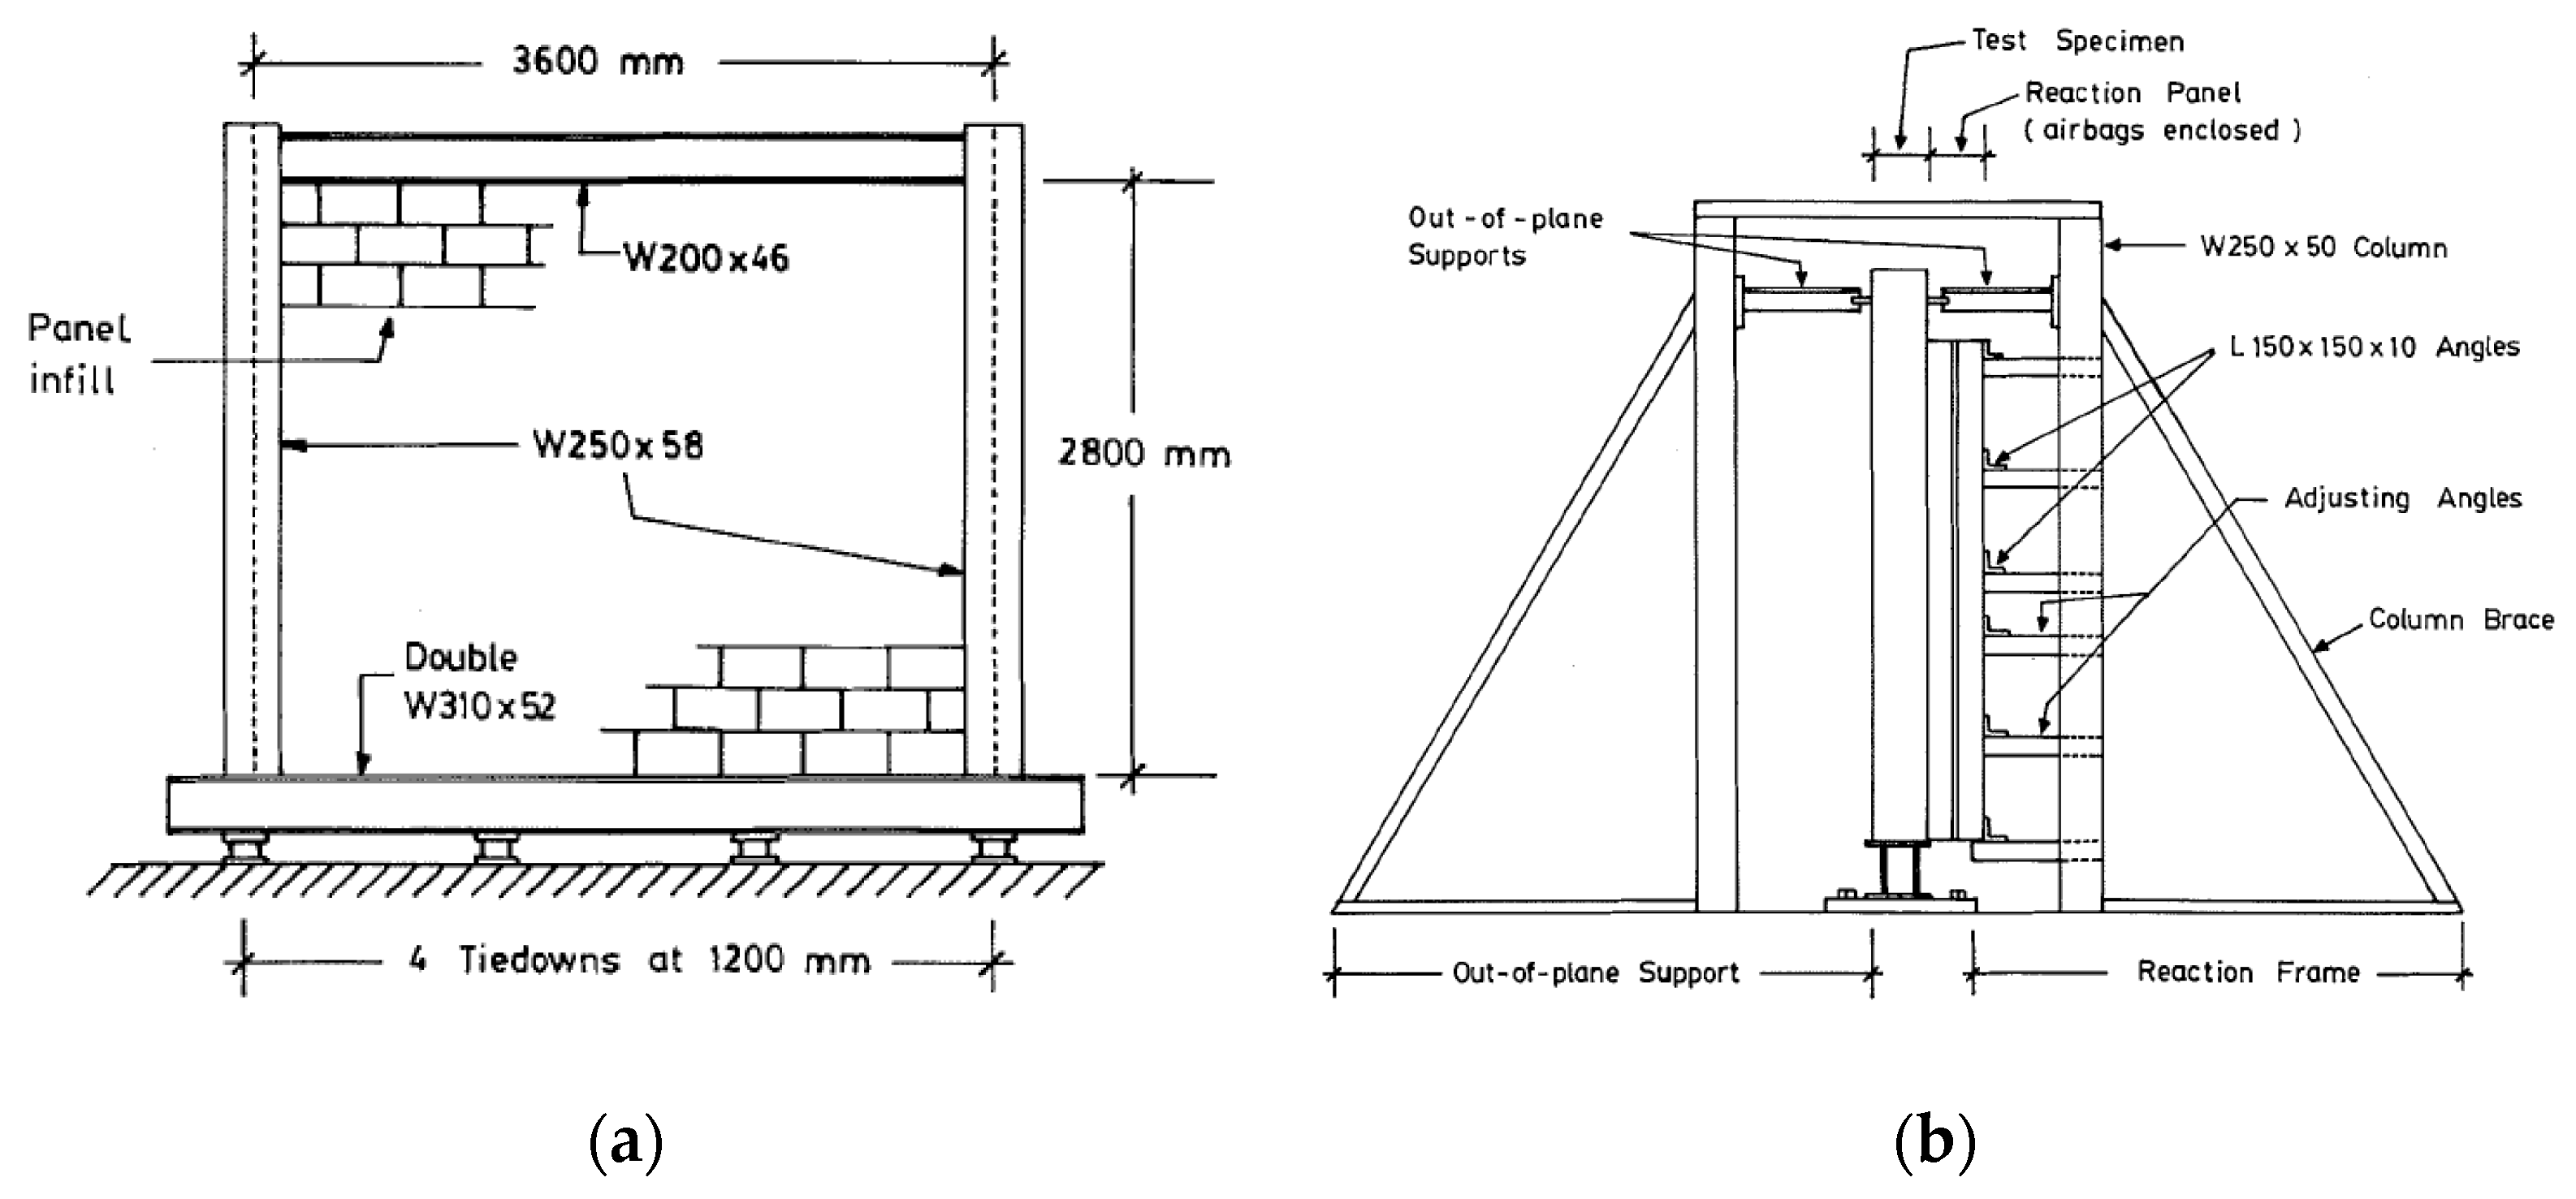
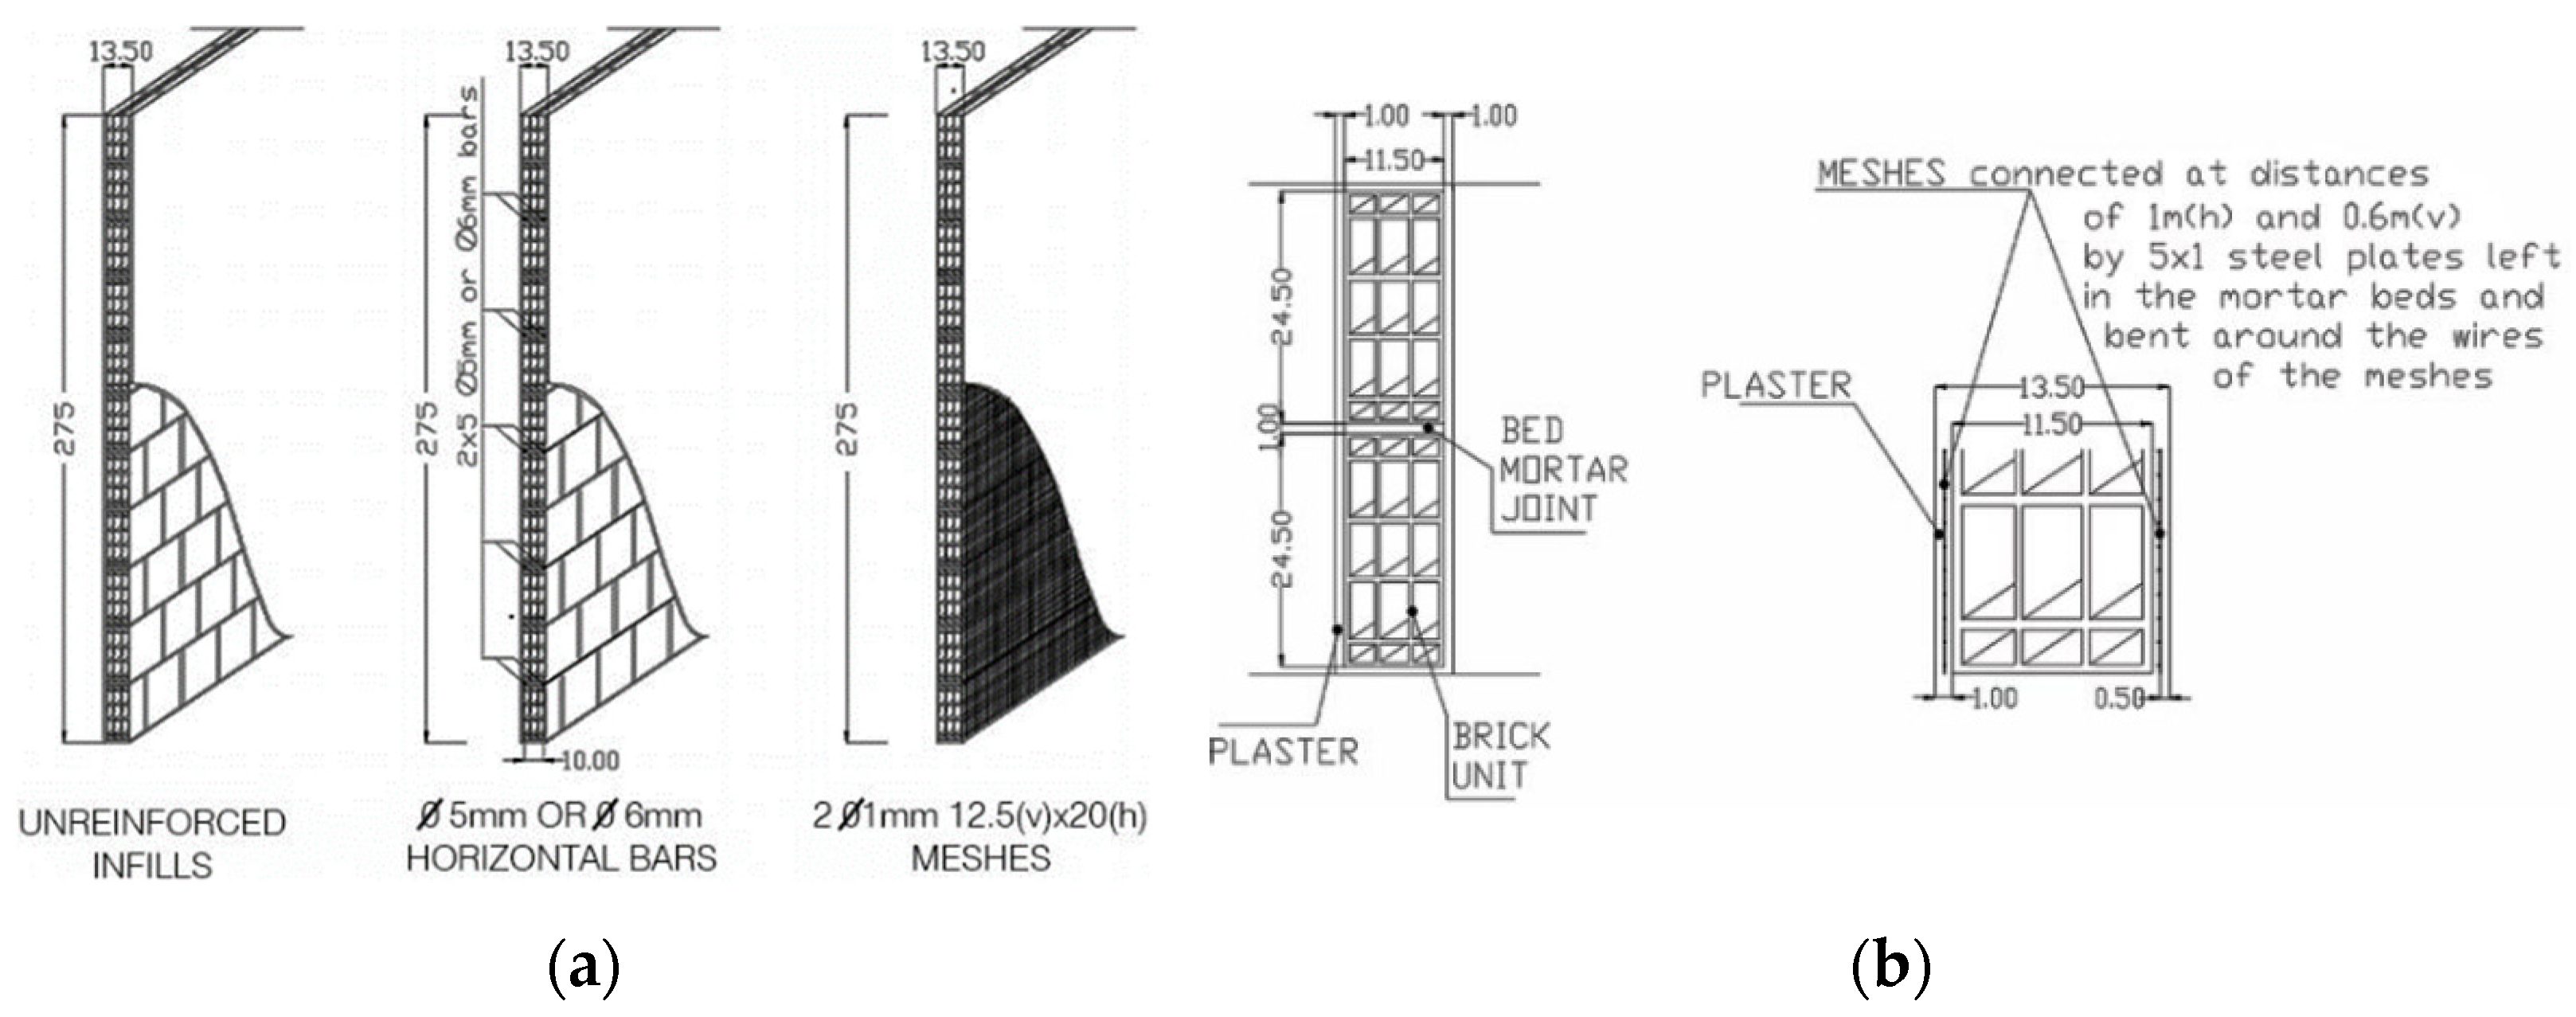
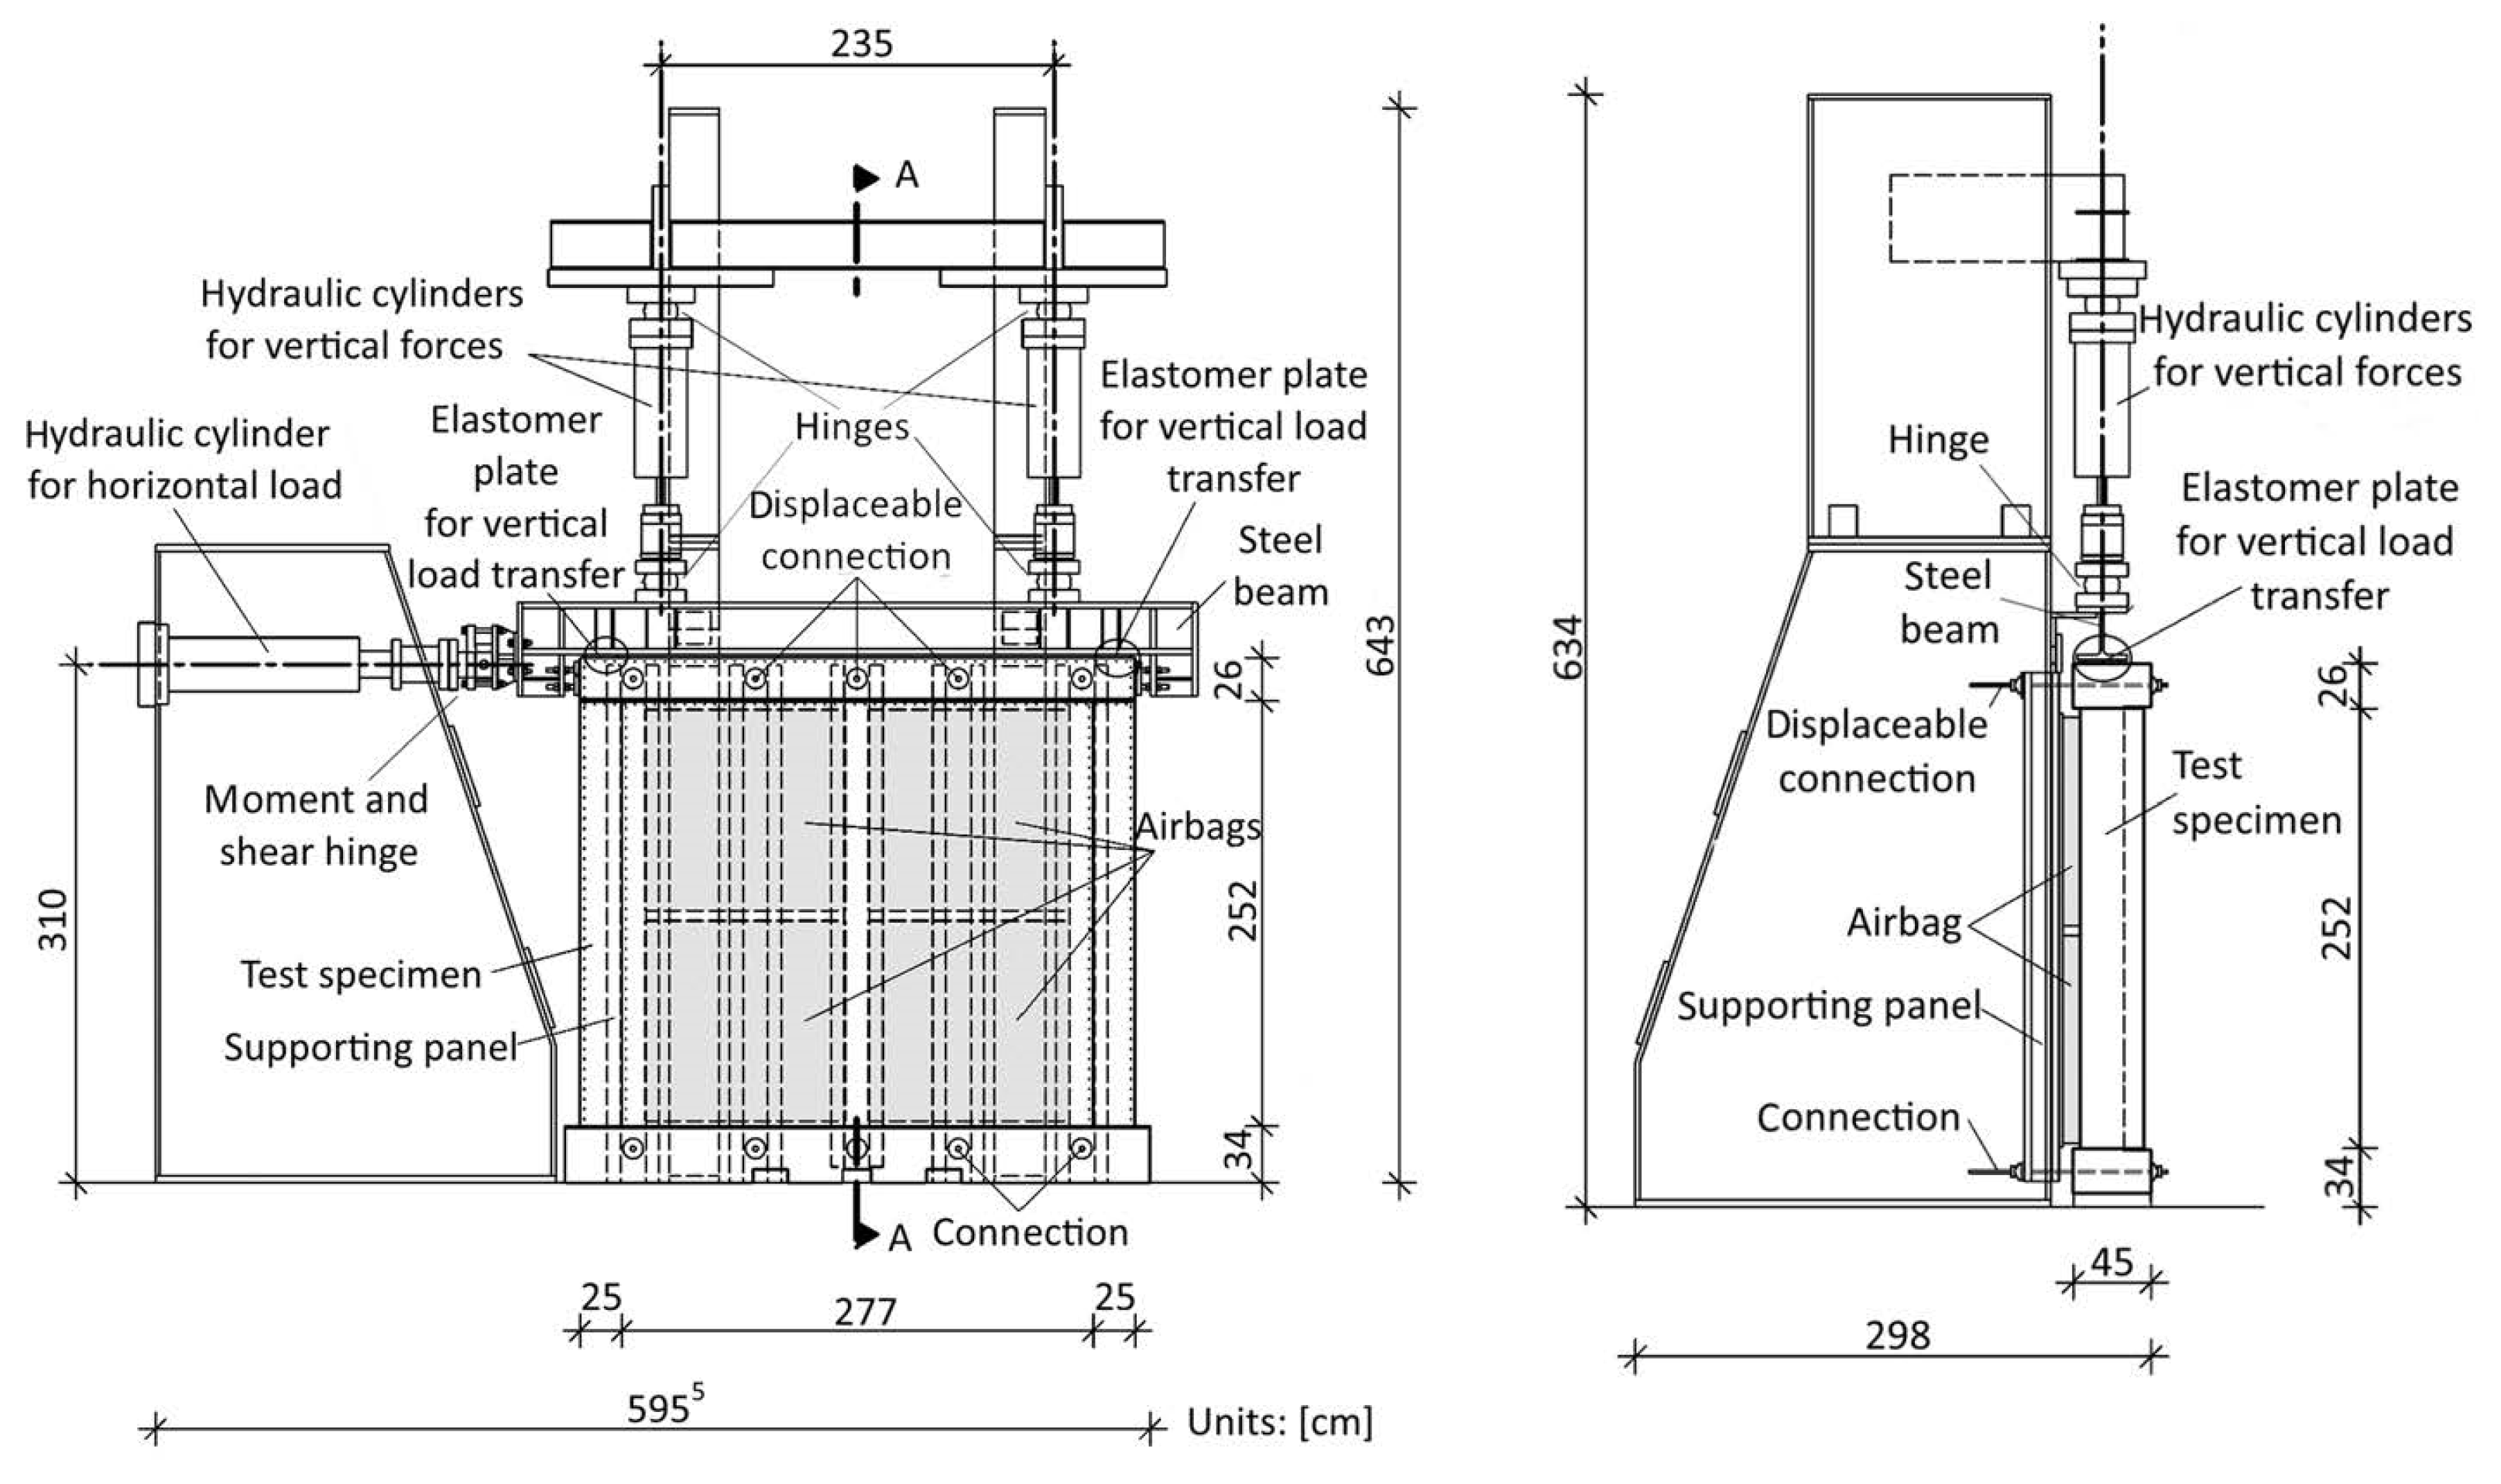
2.1. Experimental Research Studies

The out-of-plane behaviour of an infill wall is highly dependent on the arching effect [4,5,6], due to the confinement provided by the frame. Hence, the out-of-plane capacity is greatly affected by the compressive strength of masonry and the stiffness of the RC elements. The first analytical models calculated the out-of-plane capacity of infill walls [5,6] and only considered this effect in one of the main directions. This might not be realistic as infill walls can be connected to the frame on all four sides and, in this case, the arch effect can develop in two directions. Given this, Dawe and Seah [7] proposed an analytical solution to compute the out-of-plane capacity of infill walls that assumed a bi-directional arch effect. Their tests included nine frames with concrete blocks, subjected to a uniform load on the surface of the infills using airbags, see Figure 2, with the objective of understanding the out-of-plane behaviour and the maximum load capacity of the infill walls. The authors concluded that the out-of-plane behaviour could be divided into four stages: (i) linear elastic until the first crack; (ii) propagation of cracks and definition of a failure line; (iii) increment in the load capacity due to the arch effect; (iv) crushing of masonry, due to compression and collapse. The authors proposed that the out-of-plane capacity that the panel can withstand, in the case of a panel supported on four sides, is given by q (in kN/m2) as:
q = 4.50 f m 0.75 t 2 ( α l 2.5 + β h 2.5 )
= 1 h ( E I c h 2 + G s J c t h ) 0.25 < 50
β = 1 l ( E I b l 2 + G s J b t l ) 0.25 < 50
where, f m is the compressive strength of masonry (in kN/m2), t , h and l are the thickness, height and length of the infill wall, respectively (all in mm), E is the elasticity modulus of concrete (N/mm2), I c and I b are the inertia moments of the column and beam sections (mm4), respectively, and J c and J b are the torsion constants of the columns and beams (mm4), respectively.
In a later study, Flanagan and Bennett [8,9] proposed changing the value 4.50 in Equation (1) to 4.10, and eliminating the term related to torsion in Equations (2) and (3), due to its low influence and unnecessary complexity.
The in-plane damage has a considerable influence on the out-of-plane resistance of an infill wall, as shown by Angel [10], who tested eight full scale, one storey, one bay, RC frames, with brick and concrete masonry, first in-plane and then out-of-plane, see Figure 3. The in-plane test consisted of the application of load, monotonically, until a displacement value, equal to twice the value needed for the first crack to appear, was achieved. Then, the walls were loaded out-of-plane using airbags until the collapse of the specimen. The conclusions were: (i) the out-of-plane capacity depends on the slenderness and compressive strength of masonry; (ii) the in-plane damage does not affect the out-of-plane cracking pattern; (iii) for high slenderness infills, in-plane cracks lower the maximum out-of-plane capacity; (iv) vertical loading increases the stiffness but does not affect the out-of-plane capacity.
Angel [10] also proposed an analytical solution for the out-of-plane capacity of infills q, see Equation (4), with or without in-plane damage. The reduction of the out-of-plane capacity is made using a parameter, R 1 , which can be obtained by, see [10]: (i) estimating the in-plane displacement due to cracking, using the uncracked stiffness of the system; (ii) visual inspection and classification of the damage in the infill. If the infill wall is undamaged, R 1 assumes a unitary value. The value of R 2 is related to the stiffness EI of the most flexible frame element, see Equation (5), and λ depends on the height h to thickness t ratio of the infill wall, see Equation (6).
q = 2 f m ( h t ) R 1 R 2 λ
R 2 = 0.357 + 2.49 × 10 14 E I 1.0
λ = 0.154 e 0.0985 h t
Another analytical solution, based on the bi-directional arch effect allowed by the surrounding frame, was proposed by Klingner et al. [11]. This is in fact an extension of the analytical solution by Cohen and Laing [12], which considered only the arch effect in one of the main directions of the frame as:
q = 8 h 2 l { M y v [ ( l h ) + h l n ( 2 ) ] + M y h ( x y v x y h ) l n ( l l h 2 ) l }
M y v = 0.85 f m 4 ( t x y v ) 2
x y v = t f m 1.000 E [ 1 h 2 ( h 2 ) 2 + t 2 ]
Here, x y v is the maximum displacement of the infill wall in the vertical direction and M y h is obtained by replacing x y v by x y h in Equation (8) and l by h in Equation (9).
With the objective of comparing the influence of reinforcement in the in-plane damage of masonry infill walls and their out-of-plane-capacity, after initial in-plane damage, Calvi et al. [13] and Penna et al. [14] tested three full-scale RC frames with different infills, see Figure 4: (i) unreinforced; (ii) with bed joint reinforcement; (iii) with reinforced plaster. The frames were subjected to an in-plane cyclic load with a constant vertical load, and then subjected to out-of-plane loads applied on four points of the infill wall.
The conclusions were that: (i) the presence of reinforcement lowers the damage in the infill wall but only the reinforced plaster infill increases the in-plane stiffness, energy dissipation capacity and maximum load; (ii) the in-plane damage drastically reduces the acceleration needed for the out-of-plane collapse; (iii) both reinforced solutions improve the out-of-plane behaviour of the infill walls, to the greatest extent in the reinforced plaster one. The authors also proposed analytical solutions to calculate the out-of-plane fundamental vibration period of the infill wall, see Equation (10), and the in-plane capacity of infill masonry walls reinforced with bed joint reinforcement, see Equation (11).
T p = 2 π ( 1 l 2 + 1 h 2 ) E t 3 12 m
V R = V R , M + V R , H = f v l t + f y A s h d s f v l t
Here, m and f v are the specific mass and shear resistance of masonry, respectively, l is the length of the compressed zone of the wall, f y is the yield strength of steel, A s h is the area of reinforcement applied in the bed joint, s is the horizontal spacing of the reinforcement and d is the lowest between l and h .
An extensive study on the out-of-plane behaviour of reinforced and unreinforced infill walls, with previous in-plane damage, see Figure 5, was also performed by Pereira [15]. He compared experimental results with available analytical solutions and codes, and concluded that the analytical proposal for the out-of-plane capacity of Angel [10] was the most adequate, if modified as shown in Equation (12).
q = f m ( h t w ) R 1 R 2 λ [ 0.77 C f ( h l ) + 0.34 C f ]
C f = f x 1 i f x 1
Here, f x 1 i is the flexural strength in the direction parallel to the bed joints and f x 1 is the flexural strength in the direction parallel to the bed joints for the unreinforced solution.
Butenweg et al. [16] carried out an experimental study on the behaviour of reinforced concrete frames filled with high thermal insulating clay bricks, applying cyclic in-plane and out-of-plane loading based on the three following methodologies: (1) application of only one type of loading; (2) both types of loading sequentially applied; (3) both types of loading sequentially in combination. In this experimental study, four specimens were tested: (1) a reinforced concrete frame without infill under in-plane loading); (2) an infilled frame with a small gap between the infill and a column under out-of-plane loading; (3) an infilled frame under sequential in-plane and out-of-plane loading; (4) an infilled frame under combined in-plane and out-of-plane loading. In these tests, two vertical hydraulic cylinders for application of the forces from higher storeys, one hydraulic cylinder for application of the in-plane loading and airbags for the application of the out-of-plane loading were used (Figure 6).
From the results of the tests, it was concluded that boundary conditions at the connection area between the masonry infill and the reinforced concrete frame are a crucial aspect for the out-of-plane behaviour. Moreover, the infilled frame with a small gap between the infill and a column under out-of-plane loading presented an out-of-plane capacity q in agreement with the analytical approach proposed by Dawe and Seah [7] for a panel supported on three sides:
q = 4.50 f m 0.75 t 2 β h 2.5
where, f m is the compressive strength of masonry, t and h are the thickness and the height of the infill wall, respectively.
For more information on experimental studies on the out-of-plane behaviour of masonry infill walls, see [17,18,19].

2.2. Code Proposals

In North America, Annex B of M.S.J.C. [20] determines that for the out-of-plane design of participating infill walls, the use of connectors spaced at a maximum of 1.22 m along the supported perimeter of the infill is mandatory, and the out-of-plane capacity of the walls have to be computed using Equation (1) [7]. FEMA 273 [21] defines the maximum slenderness values in Table 1, while the capacity should be computed using Equation (15), if the arch effect can be taken into account, otherwise the out-of-plane capacity is assumed as the maximum flexural capacity of the wall.
q = 0.7 f m λ 2 ( h t ) × 144
FEMA 306 [22] does not impose a limit drift. Nonetheless, it mentions that the limit is about 1.5% for clay brick masonry, and assumes the analytical proposal of [10,23], see Equation (4), for the out-of-plane capacity of the infills.
Regarding the seismic loads to be used in the out-of-plane design, which cannot be higher than the capacity computed using the methods mentioned, FEMA 302 [24] prescribes Equation (16) in the case of new buildings with rigid diaphragms, within the limits obtained by Equations (17) and (18):
F p = 0.4 a p S D S W p R p I p ( 1 + 2 z h )
F p < 1.6 S D S I p W p
F p > 0.3 S D S I p W p
Here, a p is the amplification factor, S D S is the spectral acceleration, W p is the weight of the wall, z is the height of the highest point of the infill wall, h is the height of the building, R p is the response modification factor and I p is the importance factor.
Another proposal is made by FEMA 356 [25], see Equation (19), in which the performance level is taken into consideration through a specific parameter that varies according to the desired performance level (Table 2). Here, S X S is the spectral acceleration and W is the weight of the wall.
F p = χ S X S W
The NZS 1170.5 [26] standard provides a design methodology for infill masonry walls identical to the North American code. Infill walls have a considerable contribution to the lateral load resistant structure, except in situations when the infill wall is separated from the frame, the infill wall is constructed with a flexible and light material, or it has a fragile behaviour such that it will collapse in the event of a very low seismic action. The out-of-plane capacity follows FEMA 306 [22]. The seismic force to be used in the seismic design of infill walls should be computed using Equation (20), which includes the influence of the vertical position of the element in the structure as well as an amplification of the acceleration, when compared to the maximum acceleration at the floor height:
F p h = C p ( T p ) C p h R p W p < 3.6 W p
C p ( T p ) = C ( 0 ) C H i C i ( T p )
C H i = { ( 1 + h i 6 ) ,                       h i 12 m ( 1 + 10 h i h n ) ,                   h i < 0.5 h n         3.0 ,                                                   h i 0.2 h n    
C i ( T p ) = { 2.0 ,                                                                     h i 12 m 0.5 ,                                                                             h i < 0.5 h n         2.0   ( 1.75 T p )                               h i 0.2 h n    
Here, C p ( T p ) is the horizontal load design coefficient, R p is the risk factor, W p is the weight of the element, C ( 0 ) is the site hazard coefficient for T = 0 , C H i is the floor height coefficient for level i , T p is the period of the element, C i ( T p ) is the spectral shape factor at level i , h i is the height of the element and h n is the height from the base of the structure to the uppermost seismic weight or mass.
For the European regulations EC8 [27], the infill walls have to be considered if their presence influences the lateral stiffness of the structure. Independently of their influence on the lateral resistance system, appropriate measures should be taken to avoid brittle failure and premature disintegration of the infill walls, and their partial or total out-of-plane collapse. The out-of-plane design load is given by:
F a = S a W a γ a q a
S a =   S [ 3 ( 1 + z H ) 1 + ( 1 T a T 1 ) 2 0.5 ]
where S a is the seismic coefficient applicable to non-structural elements, W a is the weight of the element, γ a is the importance factor of the element, q a is the behaviour factor, is the ratio of the design ground acceleration on type A ground, a g is the acceleration of gravity, S is the soil factor, T a is the fundamental vibration period of the non-structural element, T 1 is the fundamental vibration period of the building in the relevant direction, z is the height of the non-structural element above the level of application of the seismic action and H is the building height measured from the foundation or from the top of a rigid basement. EC8 [27] does not provide any analytical solution for the fundamental vibration period of an infill wall.
EC6 [28] proposes two methods for the design of masonry walls subjected to out-of-plane loads, based on: (i) the assumption that the wall is supported along the boundaries; (ii) the arch effect between the supports. The first method considers that the wall is supported along three or four edges, and assumes that failure can occur parallel to the bed joints, see Equation (26), or perpendicular to the bed joints, see Equation (27):
M E d 1 = 1 W E d l 2
M E d 2 = 2 W E d l 2
where 1 and 2 are bending moment coefficients accounting for the degree of fixity at the edges of the walls, the height to length ratio values of the walls, as described in Annex E [28], l is the length of the wall and W E d is the design lateral load per unit area. The load needs to be equal to or smaller than the capacity of the wall, which is computed using:
M R d = f x d Z
where f x d is the flexural capacity of the infill wall in the desired direction and Z is the flexural modulus of the wall. The second method is applicable when the wall is constructed between supports capable of inducing an arch effect horizontally or vertically when the wall is subjected to out-of-plane loads. The capacity of the infill is then computed as:
q l a t , d = f d ( t l a ) 2
Here, f d is the design compressive strength of the masonry in the direction of the arch thrust, t is the thickness of the wall and l a is the length or height of the wall between supports capable of resisting the arch thrust.

3. Shake Table Tests

3.1. Building Models

Three different models were idealized at a scale of 1:1.5 (Figure 7 and Table 3), with dimensions of 4.30 × 3.80 × 4.00 m. See [29] for details. Model 1 represents the built heritage of the last three decades in Portugal, while models 2 and 3 represent likely future solutions. The chosen class for concrete and rebar reflects this distinction, as lower classes were used in model 1 (C20/25 and S400) and higher classes in models 2 and 3 (C30/37 and S500). The mortar used for the bed joints and plaster was pre-batched (M5 class). Further details on mechanical properties can be found in [15]. The loads were reduced using the similitude law relations.
The infills of model 1 were unreinforced double-leaf clay brick walls with a cavity. Horizontally perforated units were used, and the outer leaf was partially hanging the RC frame. The inner leaf had a gypsum plaster, while the outer leaf had a mortar rendering. The infills of model 2 were a single leaf clay brick wall with a bed joint reinforcement every second bed joint. The leaf was completely within the RC frame plane (as an external thermal insulation system will be required) with an internal gypsum plaster and an external mortar rendering. Again, horizontally perforated units were used. The bed joint reinforcement was a truss Bekaert Murfor RND.4/100, with 4 mm diameter longitudinal bars 100 mm apart. The bed joint reinforcement was connected to the RC frame through steel bars at both ends. The infills of model 3 were similar to those of model 2 but a reinforced plaster was used on both wall faces, with a grid Bekaert Armanet ϕ1.05 mm 12.7 × 12.7 mm attached to the RC frame using Hilti X-M8H10-37-P8 nails.

3.2. Shake Table Input and Acquisition Setup

Eight artificial accelerograms were generated using a LNEC-SPA [30] to obtain the four stages of the shake table tests, with increasing amplitude, see Table 4. The accelerograms of the first three stages were adapted to the response spectra (damping ratio equal to 5%) of each damage limit state that was defined in part 3 of EC8, see Figure 8 Damage Limitation (DL 225 YRP); Significant Damage (SD 475 YRP); Near Collapse (NC 2475 YRP): here, YRP equals Years of the Return Period. A last stage was defined as the maximum capacity of the table in terms of velocity, given the size and mass of the model, and it corresponds to 4574 YRP.
One signal was introduced for each horizontal direction for the shake table, namely North-South (N-S), or longitudinal, and East-West (E-W), or transversal. Before the first stage and after each stage, the model was subjected to two white-noise small amplitude inputs, again orthogonal, horizontal, and uncorrelated, specifically generated to obtain the dynamic properties of the model (natural frequencies, mode shapes and damping ratios) and their evolution during the experiment.
The out-of-plane behaviours of the infill walls were captured by a set of accelerometers (ACC) distributed on the surface of the walls, see Figure 9. In the solid walls of the South façade, three ACC were placed at mid-height, one in the centre and the other two at half the distance to the RC columns. The West facade had one ACC in each infill of the lower storey, under the midpoint of the opening. The same occurred in the lower storey of the East facade. The North facade had three ACC in each infill, below the openings at the centre. In model 1, due to the existence of two leaves, the ACC had to be placed in the inner and outer leaves at the same position. This scheme can be seen in the outer leaf and was repeated in the inner leaf at the same position, totalling thirty-eight ACC. Models 2 and 3 followed a similar scheme, which did not repeat itself on the inside, as these models had single leaf infill walls. Except for the infill wall on the upper storey of the North facade, all the positions for the ACC in the outer leaf of model 1 were repeated in models 2 and 3. The ACC that were not used inside the model were applied outside, increasing the number of measurement points considerably. Each solid wall on the South facade received two extra rows of ACC, directly above and below the ones in model 1, at the upper and lower third of the height. The West facade had the same setup in all three models and the East facade received four extra ACC. The lower infill of the North facade received two extra ACC, totalling thirty-four ACC on the infill walls.

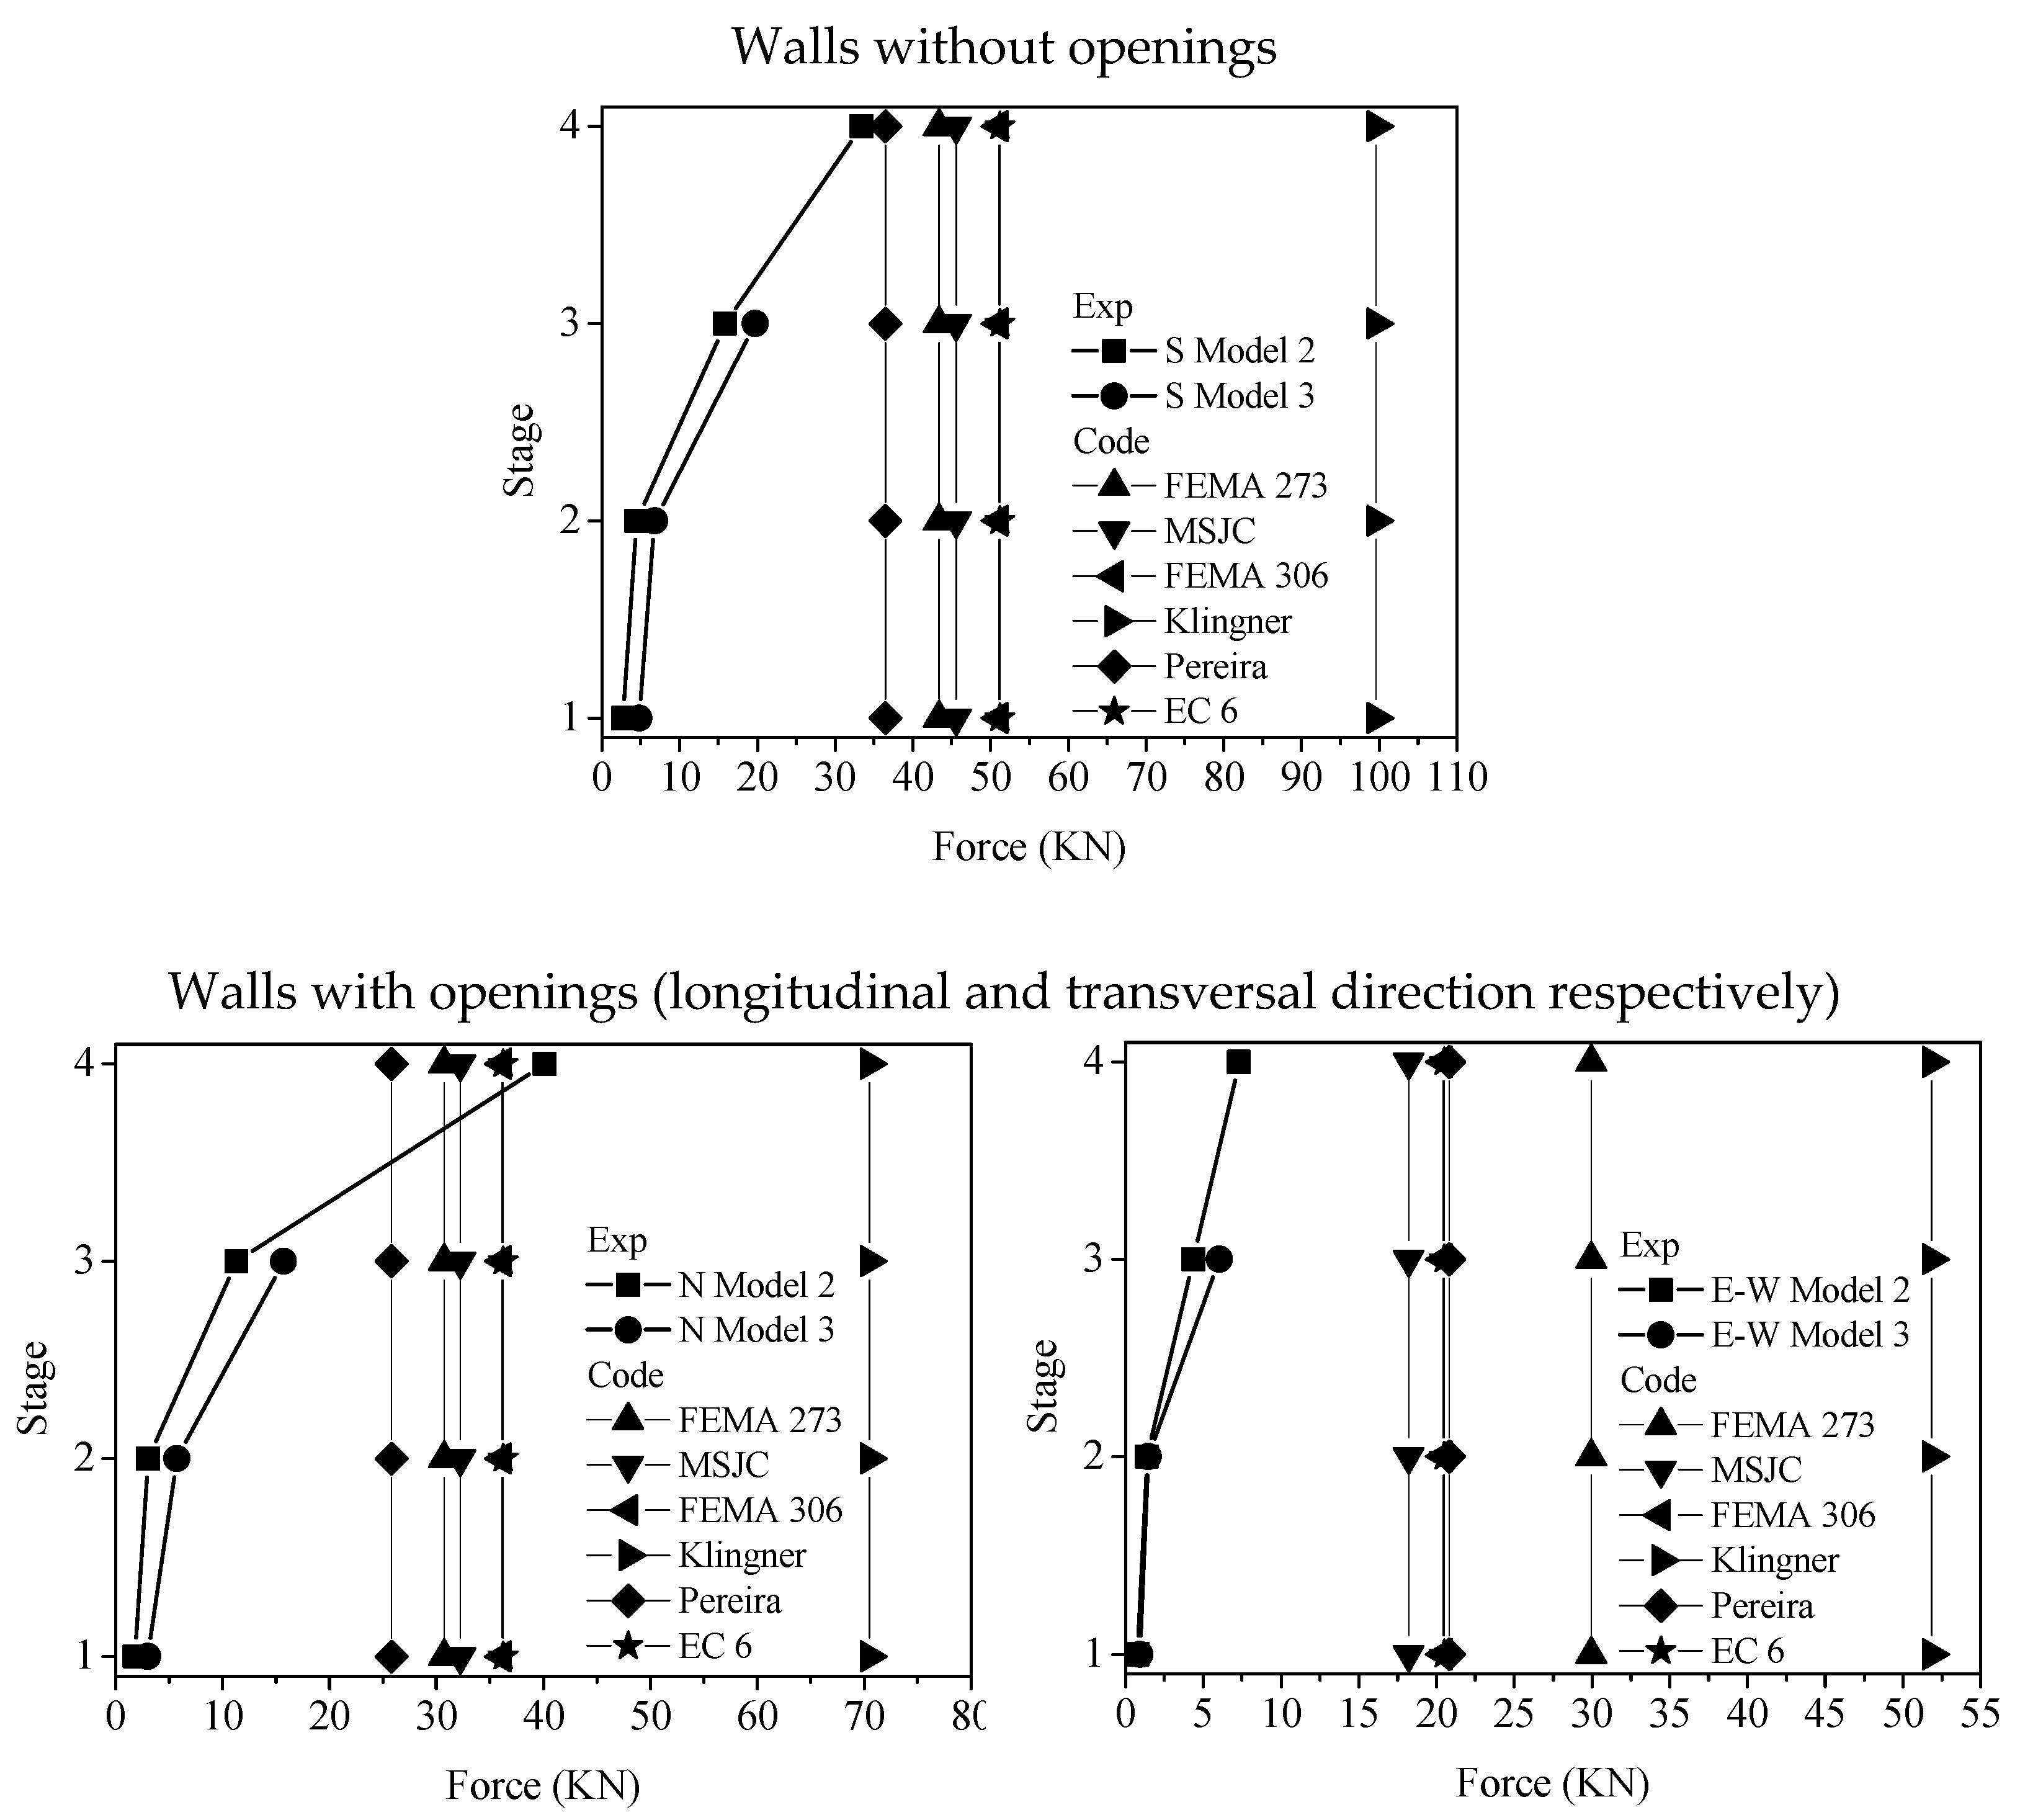
4. Comparison of the Experimental Results with Design Standards

Next, comparisons between the experimental results and different design standard provisions are presented, based on two parameters: (i) the out-of-plane demand to which the infill walls were subjected; (ii) the out-of-plane capacity of the infill walls.

4.1. Demand

In order to compute the design out-of-plane load according to the standards in Table 5 the maximum seismic input acceleration that is associated with the infill location on the structure must be considered, among other parameters. Given the fact that the PGA varied during the test, the PGA was not the same for each tested model, and that the measurements for the reinforced plaster infill seem to be unreliable, the value used in the equations proposed by each standard, see Table 5, was the maximum recorded acceleration at the foundation, for each tested model and each stage. This might not be necessarily the case for taller buildings, where more research seems to be needed. The out-of-plane design load variation, for each standard, was then plotted against the values recorded experimentally in each stage of the tested models, see Figure 10, Figure 11 and Figure 12.
As far as model 1 is concerned, see Figure 10, FEMA 302 [24], 306 [22] and 356 [25] presented a lower load than the experimental values during all the stages. FEMA 302 [24] and 306 [22] presented a load 46% and 60% lower on average, than the experimental values for the longitudinal and transversal infill walls, respectively, and FEMA 356 [25] presented design loads 48% and 62% lower in the same situation. As for NZS 1170.5 [26], in the longitudinal direction and until the second stage, the standard presented loads slightly higher than the experimental values for the exterior walls and lower values for the interior ones. In the last two stages, the standard presented loads 12% lower, on average for all infills, than the experimental values. In the transversal direction, the standard loads were lower in all stages, and 38% lower on average for all infills, in the last stage. EC8 [27], in the longitudinal direction presented design loads always higher than the experimental ones for the infill walls on the second floor (30% on stage 4) and always lower for the ground floor (20% on stage 4). In the transversal direction, the design loads were the same, on average, for all the infill walls on the second floor and always lower for the ground floor (46% on stage 4).
As for model 1, FEMA 302 [24], 306 [22] and 356 [25] presented the highest differences in model 2, see Figure 11. In the longitudinal direction, FEMA 302 [24] and 306 [22] presented a load, on average (for all infills), 50% lower than the experimental results, in stage 3 and 267% lower in stage 4, while FEMA 356 [25] presented loads 74% lower in stage 3 and 87% lower in stage 4.
A similar situation was found in the transversal direction. NZS 1170.5 [26] presented very good results until the third stage, with load 14% and 9% lower in the longitudinal and transversal direction, respectively, but in stage 4, the load proposed by this standard is low, 57% and 23% for the longitudinal and transversal direction, respectively. This may be due to the nonlinear evolution of the experimental load due to damage accumulation in the infill walls and RC structure. As for the EC8 [27], until the third stage the differences between the demand and experimental load was negligible (3% and 6% for the longitudinal and transversal directions, respectively, in stage 3), but in the last stage the load was 57% and 23% lower.
The results of the design standards were not as good as for the previous models in the case of model 3, possibly due to the separation of the plaster from the walls, particularly on the transversal direction where higher experimental loads were recorded. The attaching technique used for the accelerometers, bolted to the plaster and not directly to the infill wall, might have led to less reliable results.
Nonetheless, a comparison is made in Figure 12, and FEMA 302 [24] and 306 [22] presented loads 79% and 65% lower in the longitudinal direction than the experimental values for stages 2 and 3, respectively, and 63% and 57% lower in the transversal direction for stage 2 and 3, respectively. As for FEMA 356 [25], a similar situation was found with loads 85% and 66% lower, for stages 2 and 3 respectively, in the longitudinal direction and 64% and 55% lower, for stage 2 and 3 respectively. NZS 1170.5 [26], unlike models 1 and 2, did not present a good agreement with the experimental values, proposing loads 63% and 43% lower, for stages 2 and 3 respectively, in the longitudinal direction and 27% and 25% lower, for stages 2 and 3 respectively, in the transversal direction, even though the results were better than the ones obtained using the North American standards. EC8 [27] also presented results with a poor agreement with the experimental values, in contrast to the very good results in the two previous models, with design loads 59% and 43% lower, for stages 2 and 3 respectively, in the longitudinal direction and 25% and 59% lower, for stage 2 and 3, respectively, in the transversal direction. Still, and overall, EC8 [27] presented the best results, when compared to the other design standards.

4.2. Capacity

Table 6 shows analytical solutions that compute the out-of-plane capacity of infill walls. In Figure 13 and Figure 14, these solutions are compared with the experimental results obtained using the three tested models. The reinforcement in the infills of model 2 (bed joint) and model 3 (plaster) were not taken into consideration because their percentage was very low and defined only for crack control. The infill walls were separated into walls without openings (South infill walls in the longitudinal direction) and walls with openings (North walls in the longitudinal direction, and East and West walls in the transversal direction), but the walls with openings were computed as if they were solid, considering their actual weight. The load obtained experimentally, for each wall during the four stages of the tests, was calculated by adding the product of the acceleration in each accelerometer and the mass associated with it, and then plotted against the analytical values for that set.
It was considered that the maximum load value obtained experimentally was the capacity of the wall, as all the infill walls of the ground floor in model 1 collapsed during the last stage, and the infill walls of model 2 were damaged beyond repair and were unable to sustain any more load. In model 3, the experimental load curve is only presented until stage 3 for the sake of comparison with the other two models, as the model had to be re-tested due to technical problems [29]. It is important to keep in mind that the out-of-plane capacity is influenced by other parameters, such as the in-plane displacements and subsequent damage, vertical loads and even the presence of reinforcement, and that infill walls have damage accumulation from one stage to the next. The infill walls with openings in the longitudinal direction presented the highest experimental force value during stage 3, which is associated with damage and loss of connection between the wall and the surrounding RC frame.
Walls of higher slenderness, as the interior leaves of model 1 (thickness/height equal to 24.3), do not seem to be affected by the presence of openings, and EC6 [24] provided a very good agreement for the estimate of capacity, with only 7% error on average for all interior leaves, with and without openings. As for the exterior leaves (thickness/height equal to 18.9), EC6 [28] overestimated the capacity of the infills, on average by 46% and, as with the interior leaves, the presence of openings did not seem to affect the results. FEMA 273 (1997) presented an average error of 17% for the interior leaves and 52% for the exterior ones, while FEMA 306 (1998) presented an error of 40% and 11% for the interior and exterior leaves, respectively.
All other analytical solutions presented out-of-plane capacity values with higher differences than the experimental values. Regarding the solid infill walls, MSJC [20] presented the highest values, with an error of 70% and 58% for the interior and exterior walls, respectively. The analytical solution proposed by Klingner et al. [11] also overestimated the experimental values by 37% and 138% for the interior and exterior infills, respectively. The recommendations from Pereira [15] were acceptable in the case of exterior infills, underestimating the capacity by 17%, but considerably underestimating the capacity by 56% in the case of the interior infill walls. Regarding the infill walls with openings, MSJC [20] presented the highest overestimation, 150% and 199% for interior and exterior infill walls, respectively, followed by Klingner et al. [11] with 47% and 171% for the interior and exterior infills walls, respectively. Pereira [15] presented the lowest underestimations for the interior infill walls, with an error of 51%, and a good correlation for the exterior ones, underestimating the capacity by 16%.
Figure 14 presents the results of models 2 and 3, as the parameters used in the analytical solutions (thickness/height of 11.3, geometry, type of units and mortar, position, etc.) are the same for both models. Even though the results for model 3 are only presented until stage 3, the path followed by the two models was similar. Model 3 was able to withstand higher out-of-plane forces, and it was assumed that the maximum force recorded during the last stage of model 2 was the capacity for both bed joint reinforced and plaster reinforced infill walls.
Analytical solutions overestimated the out-of-plane capacity of the solid infill walls for models 2 and 3. One justification might be that the assumption that these walls were imminently in danger of collapse was incorrect, and the recorded out-of-plane load did not correspond to the experimental capacity of the infill. The standards that presented the best results for model 1, which were FEMA 273 [21], FEMA 306 [22] and EC6 [28], overestimated the capacity of the solid infill wall by 30%, 53% and 53%, respectively. Pereira [15], the MSJC [20] and Klingner et al. [11] overestimated the results by 9%, 36% and 198%.
Contrary to what was observed in model 1, the presence of openings, in the transversal direction, had a clear influence on the out-of-plane capacity of the infill walls. Therefore, all the standards overestimated the out-of-plane capacity of infill walls in that same direction, ranging from 149% to 609%. In the longitudinal direction, the presence of openings did not affect the results, and except for Klingner et al. [11], which overestimated the capacity by 175%, other analytical solutions underestimated the experimental results, with EC6 [28] and FEMA 306 [22] providing the best results by underestimating the capacity by 10%.
It should be noted that the maximum out-of-plane load recorded on the longitudinal walls with openings was higher than the load recorded for the solid infill walls of the same direction and, particularly in model 2, the ground floor infill walls with openings were on the verge of collapsing, while the solid walls had less damage. This might lead to the assumption that the recorded values for the longitudinal infill walls with openings were in fact the maximum capacity, while the solid walls could endure a higher out-of-plane load, hence the underestimation by most analytical solutions. Other aspects that might contribute to these discrepancies are the in-plane damage and the possible effect of the restraint of boundary conditions and arch effect, due to the slenderness and openings.

5. Design Proposal

Next, design proposals are presented for the natural frequency of infill walls and the reduction of the out-of-plane capacity of the infill walls caused by the presence of openings.

5.1. Out-Of-Plane Modal Frequency

When computing the out-of-plane load using EC8 [27], it is necessary to know the out-of-plane natural frequency of the wall and this standard does not provide any analytical solution. Calvi et al. [14] proposed an analytical solution to compute this parameter, which is also prescribed by the Italian standard [31], given by Equation (30).
T p = 2 π ( 1 l 2 + 1 h 2 ) E t 3 12 m
Here, l , h and t are the length, height and thickness of the infill wall, E is the elasticity modulus and m is the specific mass of the infill.
To compare the experimental and the analytical design out-of-plane loads, when using EC8 [27], the frequencies obtained experimentally were used here instead of those from the above equation, as the analytical solution considerably under-estimated values relative to the experimental values, see Table 7. The average error for model 1 was about 80%, while in models 2 and 3 the error was about 90%. These high errors were caused by the formula, which assumes that the infill wall behaves dynamically as a panel simply supported by cylindrical hinges at the side columns. The much higher experimental frequencies obtained show that this simplification is not correct and relates to the wall being connected to the other sides of the frame. In addition, as the infill wall is mostly within the frame (model 1), or completely within the frame (models 2 and 3), the connection of the infill wall to the frame may also have a considerable restraint effect.
It would be expected that the infill walls of model 1 presented lower natural frequencies than for models 2 and 3, as the main difference between them was the thickness of the wall. A possible justification for the expectedly high values of model 1 may relate to the boundary conditions of the infills, due to the execution process.
In order to better understand the influence of the boundary conditions, and to confirm the above-mentioned assumptions, a simple numerical model of the infill wall was constructed using DIANA [32], based on shell elements. In the case of model 1, the exterior and interior leaves were modelled separately with 8.5 cm and 10.5 cm, respectively, taking the plaster into consideration. As for models 2 and 3, a single 18 cm leaf was modelled. The results, see Table 8 and Table 9, show it is possible for different boundary conditions to lead to natural frequencies ranging from 4.4 Hz to 56.0 Hz in model 1 and 9.3 Hz to 91.8 Hz in models 2 and 3. It should be noted that the material characterization of the masonry was that done by Pereira [15], and different elasticity moduli were computed for the three types of masonry used in the present study (unreinforced, bed joint reinforced, and reinforced plaster). This is not in agreement with the experimental frequencies, which exhibit similar results. Therefore, during the present computations, the adopted value for the elasticity modulus was 3.43 GPa, which corresponds to the average of the three masonry types [15].
Using the same elasticity modulus for all models will not provide the best results, as the infill walls of model 1 presented similar frequency values for a lower thickness. Nonetheless, and analysing the results for models 2 and 3, to achieve higher experimental values, the infill wall needs to be connected to the frame on all four borders, with a flexible connection intermediate between a simply supported and a fully constrained option.
For design purposes and standard provisions, analytical solutions should be simple, and not difficult to quantify the parameters (as a rotational stiffness). By considering all boundaries to be constrained (rotationally fixed), it is possible to use the formula from Szilard [33] for the computation of the first mode frequency, and taking into consideration the boundary conditions using the formula from Bares [34], as:
f = c l 2 φ
c = E t 3 12 ( 1 υ 2 ) × g m
φ = 1.57 5.14 + 3.13 μ 2 + 5.14 μ 4
μ = l h
Here, g is the gravitational acceleration and υ is the Poisson’s ratio.
The results of the application of this formula to the infill walls (Table 10) are considerably better for models 2 and 3, as model 1 presented frequencies close to the other two models, whereas they should be rather different if the interior and exterior infills behaved independently. In the proposed formula, thickness is elevated to the power of three, while mass varies linearly, which of course makes the results rather sensitive to the thickness parameter. If the walls are considered constrained on four sides, the walls with openings presented values on average 30% lower, and walls without openings, values 37% lower. In the case of models 2 and 3, the formula overestimated the frequency, with values on average 43% and 23% higher in the walls with and without openings, respectively. Still, the new analytical results are, on average, much closer to the experimental measured values.

5.2. Out-of-Plane Capacity Reduction

In models 2 and 3, openings of the infills in a transversal direction had a higher influence than openings in a longitudinal direction, even though the percentage of the opening was similar (27% and 30% for longitudinal and transversal ones, respectively). This was associated with the arrangements of the openings, which for infills in a transversal direction did not allow an arching mechanism over the height of the wall. Given that height is usually smaller than length, the vertical arching mechanism has a higher contribution to the out-of-plane capacity of the wall, if the wall is connected to the four sides. This can be confirmed by the analytical solution of EC6 [28], which takes the arching mechanism into consideration in only one direction. Here, the vertical direction is considered, as it provides a better correlation with the experimental results, and it is the shortest span.
If the central part of the infill wall is not altered by openings, enabling a vertical arch effect during out-of-plane loading, the out-of-plane capacity of the wall does not seem to be affected and the analytical solutions available in the standards have a similar reliability to the computation of solid infill walls. If the vertical arch effect is not enabled, the out-of-plane capacity of the infill wall has to be reduced. The reduction of the in-plane capacity of masonry infill walls can be factored by reducing the capacity of the solid wall using a reduction factor. When following the prescriptions of NZS 1170.5 [26], the reduction is achieved using a parameter proposed by [7]. In a similar procedure, a reduction factor is proposed for the out-of-plane capacity of masonry infill walls with openings, see Equation (35), when the distribution of the openings does not enable a vertical arch effect mechanism, see Figure 15.
λ o u t o f p l a n e = 1 A r e a   o p e n i n g   ( % )
For the infill wall with the transversal direction of models 2 and 3, the reduction factor would be equal to 0.3, meaning the capacity was reduced by 70%, and the results of the reduction of the out-of-plane capacity computed using the analytical solutions can be found in Table 11 and Figure 16. Pereira [15], FEMA 306 [22] and EC6 [28] provided the best results, underestimating the capacity by 15% and 16%. FEMA 273 [21] also provided a good estimation, 23% above the experimental value, while Klingner et al. [11] highly overestimated the out-of-plane capacity by 114%.
It should be noted that the reduced out-of-plane capacity obtained was dependent on the value for the reference solid wall, hence if the initial estimation was already excessively high or low, the estimation of the out-of-plane capacity of the wall with openings will be excessively high or low, respectively. Still, EC6 (2006) and FEMA 306 [22] continued to provide the best estimations for the out-of-plane capacity of the infill walls.

6. Conclusions

The shake table tests led to the conclusion that the adopted reinforcement solutions for infill walls influence the results but a global trend that highlights the better performance of one solution relative to the others does not exist. Model 1, designed using an older generation of Portuguese standards (REBAP 1983, RSA 1983) and with unreinforced double-leaf infill walls, had an undesirable seismic performance by collapsing (soft-storey collapse mechanism); the models designed by the Eurocodes (Eurocode 2, Eurocode 8) did not, but during the test, the amount of damage and their global behaviour were similar. This was due to the same geometry of the reinforced concrete structure and infill walls, which are the parameters that most influence the structural behaviour, given that the strength of the reinforced concrete frame used was not significantly different. The detailing of the reinforced concrete frame based on the Eurocode 2 led to a higher ductility in models 2 (bed joint reinforced infill walls) and 3 (plaster reinforced infill walls) than the detailing of model 1 using REBAP. The use of reinforcement in the infill walls attached to the reinforced concrete frame prevented an out-of-plane collapse, and possibly the collapse of the reinforced concrete structure as well but did not lead to less damage during the tests relative to the unreinforced solution.
The comparison of the experimental results with the design standards was done through the out-of-plane load and capacity, with two objectives: (i) understanding their accuracy and choosing the most suitable analytical solution within the wide range of possibilities in the literature; (ii) understanding the influence of the presence of openings in the out-of-plane capacity of the infill walls. It was concluded that the formula proposed by Eurocode 8 presented acceptable results for the estimation of out-of-plane loads for most of the infill walls used in this study. As for capacity, Eurocode 6 and FEMA 306, which adopted the analytical solution from Angel [10], provided acceptable results. As for the influence of openings, it was concluded that if the vertical arch effect is not eliminated, then capacity is not reduced, for openings having areas up to about 30% of the infill area.
Two proposals associated with the design of the infill walls are made here. The first one computes the natural frequency of the infill walls, a parameter needed in the computation of the out-of-plane design load when using Eurocode 8, as the standard does not provide any formula. The proposal is based on the dynamics of plates and it gave a reasonable correlation with the experimental data. The second design proposal is a reduction factor for the out-of-plane capacity of infill walls when the openings prevent the vertical arch effect; it is based on a prescription from NZS 1170.5 for the reduction of the in-plane capacity of infill walls with openings. This proposal also correlated reasonably well with the experimental results.

Author Contributions

Conceptualization, J.L., P.B.L. and N.M.; methodology, J.L. and P.B.L.; software, J.L. and N.M; validation, J.L. and P.B.L.; formal analysis, J.L. and P.B.L.; investigation, J.L., P.B.L. and N.M.; writing—original draft preparation, J.L.; writing—review and editing, P.B.L. and N.M.; supervision, P.B.L.; project administration, P.B.L.; funding acquisition, P.B.L. All authors have read and agreed to the published version of the manuscript.

Funding

This research received no external funding.

Institutional Review Board Statement

Not applicable.

Informed Consent Statement

Not applicable.

Conflicts of Interest

The authors declare no conflict of interest.

References

  1. Mehrabi, A.B.; Shing, P.B.; Schuller, M.P.; Noland, J.L. Performance of Masonry-Infilled R/C Frames under In-Plane Lateral Loads; Report No. CU/SR-94-6; University of Colorado: Boulder, CO, USA, 1994. [Google Scholar]
  2. El-Dakhakhni, W.; Elgaaly, M.; Hamid, A. Three-Strut Model for Concrete Masonry-Infilled Steel Frames. J. Struct. Eng. 2003, 129, 177–185. [Google Scholar] [CrossRef]
  3. Tiedemann, H. A statistical evaluation of the importance of non-structural damage to buildings. In Proceedings of the 7th WCEE, Istanbul, Turkey, 8–13 September 1980; pp. 617–624. [Google Scholar]
  4. McDowell, E.L.; McKee, K.E.; Sevis, E. Arching action theory of masonry walls. J. Struct. Div. 1956, 82, 915-1. [Google Scholar] [CrossRef]
  5. Hendry, A.W. The lateral strength of unreinforced brickwork. Struct. Eng. 1973, 51, 43–50. [Google Scholar]
  6. Anderson, C. Arching action in transverse laterally loaded masonry wall panels. Struct. Eng. B 1984, 62, 12–23. [Google Scholar]
  7. Dawe, J.L.; Seah, C.K. Out-of-plane resistance of concrete masonry infilled panels. Can. J. Civ. Eng. 1989, 16, 854–864. [Google Scholar] [CrossRef]
  8. Flanagan, R.D.; Bennett, R.M. Arching of masonry infilled frames: Comparison of analytical methods. Pract. Period. Struct. Des. Constr. 1999, 4, 105–110. [Google Scholar] [CrossRef]
  9. Flanagan, R.D.; Bennett, R.M. Bidirectional behaviour of structural clay tile infilled frames. J. Struct. Eng. 1999, 125, 236–244. [Google Scholar] [CrossRef]
  10. Angel, R. Behavior of Reinforced Concrete Frames with Masonry Infills; Department of Civil Engineering, Illinois at Urbana-Champaign: Champaign, IL, USA, 1994. [Google Scholar]
  11. Klingner, R.E.; Rubiano, N.R.; Bashandy, T.R.; Sweeney, S. Evaluation and analytical verification of shaking table data from infilled frames. Part 1: In-plane behaviour. In Proceedings of the 7th North American Masonry Conference, South Bend, IN, USA, 2–5 June 1996. [Google Scholar]
  12. Cohen, E.; Laing, E. Discussion to “arching action theory of masonry wall”. J. Struct. Div. 1956, 82, 1067. [Google Scholar]
  13. Calvi, G.M.; Bolognini, D.; Penna, A. Seismic performance of masonry-infilled r.c. frames: Benefits of slight reinforcements. In Proceedings of the 6th Congresso Nacional de Sismologia e Engenharia Sísmica, Guimarães, Portugal, 14–15 April 2004. [Google Scholar]
  14. Penna, A.; Calvi, G.M.; Bolognini, D. Design of masonry structures with bed joint reinforcement. In Seminário Sobre Paredes De Alvenaria; Lourenço, P.B., Ed.; Universidade Nova: Lisboa, Portugal, 2007. [Google Scholar]
  15. Pereira, M.F.P. Avaliação do desempenho das envolventes dos edifícios face à acção dos sismos. Ph.D. Thesis, Department of Civil Engineering, University of Minho, Braga, Portugal, 2013. (In Portuguese). [Google Scholar]
  16. Butenweg, C.; Marinkovic, M.; Salatic, R. Experimental results of reinforced concrete frames with masonry infills under combined quasi-static in-plane and out-of-plane seismic loading. Bull. Earthq. Eng. 2019, 17, 3397–3422. [Google Scholar] [CrossRef]
  17. Tu, Y.; Chuang, T.; Liu, P.; Yang, Y. Out-of-plane shaking table tests on unreinforced masonry panels in RC frames. Eng. Struct. 2010, 32, 3925–3935. [Google Scholar] [CrossRef]
  18. Ricci, P.; Domenico, M.; Verderame, G.M. Experimental assessment of the in-plane/out-of-plane interaction in unreinforced masonry infill walls. Eng. Struct. 2018, 173, 960–978. [Google Scholar] [CrossRef]
  19. Anic, F.; Penava, D.; Guljaš, I.; Sarhosis, V.; Abrahamczyk, L. Out-of-plane cyclic response of masonry infilled RC frames: An experimental study. Eng. Struct. 2021, 238, 112258. [Google Scholar] [CrossRef]
  20. Masonry Standard Joint Committee. Specification for Masonry Structures (ACI 530.1/ASCE 6/TMS 602); Manual of Concrete Practice; ACI: Miami, FL, USA, 2011. [Google Scholar]
  21. FEMA 273Guidelines for the Seismic Rehabilitation of Buildings, Applied Technology Council (ATC-43 Project) and Federal Emergency Management Agency, Federal Emergency Management Agency: Washington, DC, USA, 1997.
  22. FEMA 306Evaluation of Earthquake Damaged Concrete and Masonry Wall Buildings, Applied Technology Council (ATC-43 Project) and Federal Emergency Management Agency, Federal Emergency Management Agency: Washington, DC, USA, 1998.
  23. Angel, R.; Abrams, D. Out-of-plane strength evaluation of URM infill panels. In Proceedings of the of the NCEER Workshop on Seismic Response of Masonry Infills, San Francisco, CA, USA, 4–5 February 1994. [Google Scholar]
  24. FEMA 302NEHRP Recommended Provisions for Seismic Regulations for New Buildings and Other Structures—Part 1: Provisions, Building Seismic Safety Council and Federal Emergency Management Agency: Washington, DC, USA, 1997.
  25. FEMA 356Prestandard and Commentary for the Seismic Rehabilitation of Buildings, Federal Emergency Management Agency and American Society of Civil Engineers: Washington, DC, USA, 2000.
  26. NZS 1170.5Structural Design Actions—Part 5: Earthquake Actions—New Zealand, Standards New Zealand: Wellington, New Zealand, 2004.
  27. EN 1998-1Eurocode 8: Design of Structures for Earthquake Resistance—Part 1: General Rules, Seismic Actions and Rules for Buildings, European Committee of Standardization: Brussels, Belgium, 2004.
  28. EN 1996-1-1Eurocode 6: Design of Masonry Structures—Part 1-1: General Rules for Reinforced and Unreinforced Masonry Structures, European Committee of Standardization: Brussels, Belgium, 2006.
  29. Leite, J.M. Seismic Behaviour of Masonry Infill Walls: Test and Design. Ph.D. Thesis, Department of Civil Engineering, University of Minho, Braga, Portugal, 2014. [Google Scholar]
  30. Mendes, L. LNEC-SPA: Signal Processing and Analysis Tools for Civil Engineers; Earthquake Engineering and Structural Dynamics Division, National Laboratory for Civil Engineering: Lisbon, Portugal, 2008. [Google Scholar]
  31. Ordinanza, P.C.M. 3431/2003 Norme Tecniche per il Progetto, la Valutazione e L’Adeguamento Sismico Degli Edifici; Gazzetta Ufficiale della Repubblica italiana: Roma, Italy, 2003. [Google Scholar]
  32. DIANA 9.4. Displacement Method Analyser, Release 9.4, User’s Manual; TNO DIANA Bv, DIANA FEA BV: Delft, The Netherlands, 2012. [Google Scholar]
  33. Szilard, R. Theory and Analysis of Plates-Classical and Numerical Methods; Prentice-Hall, Inc.: Hoboken, NJ, USA, 1974. [Google Scholar]
  34. Bares, R. Tables for the Analysis of Plates, Slabs and Diaphragms Based on the Elastic Theory; Bauverlag GmbH: Gütersloh, Germany, 1971. [Google Scholar]
Figure 1. Partial and complete out-of-plane collapses of infilled walls during the L’Aquila earthquake (2009), Italy.
Applsci 12 00503 g001
Figure 2. Experimental design [7]: (a) geometry of tested frames; (b) test setup.
Applsci 12 00503 g002
Figure 3. Testing setup [10]: (a) in-plane test; (b) out-of-plane test.
Applsci 12 00503 g003
Figure 4. Models [13,14]: (a) infill walls; (b) detail of the reinforcement at the infills.
Applsci 12 00503 g004
Figure 5. Out-of-plane test setup [15].
Applsci 12 00503 g005
Figure 6. Test setup for the in-plane and out-of-plane tests carried out by Butenweg et al. [16].
Applsci 12 00503 g006
Figure 7. Geometry of the openings in each facade: (a) North; (b) West; (c) East; (d) South.
Applsci 12 00503 g007
Figure 8. Comparison between the pseudo-acceleration response spectra of the accelerograms generated and the response spectra obtained from EC8 (scaled).
Applsci 12 00503 g008
Figure 9. Model 1: (a) construction of the RC structure; (b) model on the shake table; (c) accelerometers setup.
Applsci 12 00503 g009aApplsci 12 00503 g009b
Figure 10. Standard and experimental out-of-plane load comparison for model 1.
Applsci 12 00503 g010
Figure 11. Standard and experimental out-of-plane load comparison for model 2.
Applsci 12 00503 g011
Figure 12. Standard and experimental out-of-plane load comparison for model 3.
Applsci 12 00503 g012
Figure 13. Standard and experimental out-of-plane capacity comparison for model 1.
Applsci 12 00503 g013
Figure 14. Standard and experimental out-of-plane capacity comparison for models 2 and 3.
Applsci 12 00503 g014
Figure 15. Influence of the distribution of the openings in the formation of a vertical arch effect in the tested models: (a) possible vertical arch mechanism in the longitudinal infill walls; (b) absence of a vertical arch mechanism in the transversal infill walls (horizontal arching mechanism possible).
Applsci 12 00503 g015
Figure 16. Standard and experimental out-of-plane capacity comparison for transversal infill walls of models 2 and 3 after the reduction of analytical values using [7].
Applsci 12 00503 g016
Table 1. λ 2 values for the computation of the out-of-plane capacity of infill walls (FEMA 273 [21]).
Slenderness λ 2
50.129
100.030
150.034
350.013
Table 2. Coefficient   χ 1 for calculation of the out-of-plane all forces.
Structural Performance LevelFlexible DiaphragmsOther Diaphragms
Collapse prevention 0.9 0.3
Life safety 1.2 0.4
Immediate occupancy 1.8 0.6
1 Values of χ for flexible diaphragms need not be applied to out-of-plane strength of walls in Sections 2.6.7.2 of the FEMA 356 [25].
Table 3. Description of the tested models.
Model NumberDesign StandardsConcrete ClassRebar ClassInfill Solution
1RSA/REBAPC20/25S400Double leaf clay brick unreinforced wall
2EC2/EC8C30/37S500Single leaf clay brick wall with bed joint reinforcement every two joints
3EC2/EC8C30/37S500Single leaf clay brick wall with reinforced plaster on both sides
Table 4. Adopted shake table test sequence of inputs.
StageIdentificationDescription
1DI 0Initial dynamic identification test
DLSeismic test based on Damage Limitation—225 YRP
DI 1Dynamic identification test after the first stage
2SDSeismic test based on Significant Damage—475 YRP
DI 2Dynamic identification test after the second stage
3NCSeismic test based on Near Collapse—2475 YRP
DI 3Dynamic identification test after the third stage
41.5xNCSeismic test with an amplitude of 1.5 times the previous stage—4574 YRP
DI 4Dynamic identification test after the fourth stage
Table 5. Analytical solutions used to compute the out-of-plane demand of the infill walls.
StandardAnalytical Solution
FEMA 302 [24] and 306 [22] F p = 0.4 a p S D S W p R p I p ( 1 + 2 z h )
EC8 [27] F a = S a W a γ a q a
FEMA 356 [25] F p = χ S X S W
NZS 1170.5 [26] F p h = C p ( T p ) C p h R p W p < 3.6 W p
Table 6. Analytical solutions used to compute the out-of-plane capacity of the infill walls.
StandardAnalytical Solution
FEMA 273 [21] q i n = 0.7 f m λ 2 ( h i n f t i n f ) × 144
MSJC [20]/Seah and Dawe [7] q = 4.50 f m 0.75 t 2 ( α l 2.5 + β h 2.5 )
FEMA 306 [22] and Angel [10] q = 2 f m ( h t ) R 1 R 2 λ
Klingner et al. [11] q = 8 h 2 l { M y v [ ( l h ) + h l n ( 2 ) ] + M y h ( x y v x y h ) l n ( l l h 2 ) l }
Pereira [15] q = f c m w ( h t w ) R 1 R 2 λ [ 0.77 C f ( h l ) + 0.34 C f ]
EC6 [28] q l a t , d = f d ( t l a ) 2
Table 7. Comparison between experimental frequencies and analytical proposal from [14].
WallTypeExperimental Frequency (Hz)Analytical (Hz)Error (%)
Model 1P1 exterior leafWith openings60.511.0−81.8
P1 interior leafWith openings57.516.1−72.1
P2 exterior leafWith openings66.711.0−83.5
P2 interior leafWith openings59.516.1−73.0
P1 exterior leafSolid69.411.0−84.1
P1 interior leafSolid62.816.1−74.4
P2 exterior leafSolid70.711.0−84.4
P2 interior leafSolid67.116.1−76.1
Model 2P1 NorthWith openings56.95.1−91.0
P1 SouthSolid67.0−92.4
P2 SouthSolid65.0−92.1
Model 3P1 NorthWith openings56.35.1−90.9
P1 SouthSolid64.1−92.0
P2 SouthSolid66.7−92.3
Table 8. Numerical frequencies of the solid wall (interior and exterior leaves) of model 1 (South facade) for different support conditions.
FixedSimply Supported
Connected to the beams Applsci 12 00503 i001 Applsci 12 00503 i002
Interior: 42.0 Hz
Exterior: 51.4 Hz
Interior: 18.7 Hz
Exterior: 23.0 Hz
Connected to the columns Applsci 12 00503 i003 Applsci 12 00503 i004
Interior: 10.0 Hz
Exterior: 12.3 Hz
Interior: 4.4 Hz
Exterior: 5.4 Hz
Connected to the columns and lower beam Applsci 12 00503 i005 Applsci 12 00503 i006
Interior: 14.7 Hz
Exterior: 18.0 Hz
Interior: 7.7 Hz
Exterior: 9.5 Hz
Connected to the beams and columns Applsci 12 00503 i007 Applsci 12 00503 i008
Interior: 45.7 Hz
Exterior: 56.0 Hz
Interior: 22.8 Hz
Exterior: 28.1 Hz
Table 9. Numerical frequencies of the solid wall of models 2 and 3 (South facade) for different support conditions.
FixedSimply Supported
Connected to the beams Applsci 12 00503 i009 Applsci 12 00503 i010
84.5 Hz39.6 Hz
Connected to the columns Applsci 12 00503 i011 Applsci 12 00503 i012
20.9 Hz9.3 Hz
Connected to the columns and lower beam Applsci 12 00503 i013 Applsci 12 00503 i014
30.3 Hz15.8 Hz
Connected to the beams and columns Applsci 12 00503 i015 Applsci 12 00503 i016
91.8 Hz47.0 Hz
Table 10. Comparison between experimental frequencies and the analytical proposal from Equation (31).
New Proposal
WallTypeExperimental Frequency (Hz)Constrained on
4 Sides (Hz)
Error (%)
Model 1P1 exterior leafWith openings60.548.4−20.1
P1 interior leafWith openings57.537.6−36.4
P2 exterior leafWith openings66.748.4−27.5
P2 interior leafWith openings59.537.6−36.8
P1 exterior leafSolid69.448.4−30.3
P1 interior leafSolid62.837.6−40.1
P2 exterior leafSolid70.748.4−31.6
P2 interior leafSolid67.137.6−43.9
Model 2P1 NorthWith openings56.980.641.7
P1 SouthSolid67.020.3
P2 SouthSolid65.024.0
Model 3P1 NorthWith openings56.380.643.2
P1 SouthSolid64.125.8
P2 SouthSolid66.720.9
Table 11. Comparison of the experimental and analytical out-of-plane capacity values of the infill walls with openings on the transversal direction of models 2 and 3 after their reduction using the geometrical factor.
Analytical
Value (KN)
Experimental
Value (KN)
Reduced
Analytical Value (KN)
Error (%)
FEMA 273 [21]30.07.3923.3
MSJC [20]18.25.5−38.9
FEMA 306 [22]20.46.1−16.2
Klingner et al. [11]51.815.4114.2
Pereira [15]20.86.2−14.5
EC6 [28]20.56.2−15.8
Publisher’s Note: MDPI stays neutral with regard to jurisdictional claims in published maps and institutional affiliations.

