1. Introduction
Patellar tendinopathy, also known as “jumper’s knee”, is a chronic overuse injury of the patellar tendon which is characterized by activity-related anterior knee pain [
1]. Most injuries develop gradually over time, with no identifiable event responsible for their occurrence. The development of patellar tendinopathy is believed to result from the combination of mechanical overload applied to the tendon and the repetition of this load [
2]. This explains its prevalence in sports involving repeated jumping and landing [
3]. The prevalence of patellar tendinopathy is 44.6% in elite volleyball players and 31.9% in elite basketball players [
3]. Prevention of patellar tendinopathy is important as this injury causes long-lasting symptoms that can lead to the end of a sports career [
4].
Many risk factors for patellar tendinopathy have been suggested in the scientific literature. The prevalence of this injury is higher among male compared to female athletes and higher among highly skilled compared to less skilled athletes [
3,
5]. Lack of quadriceps and hamstring muscles flexibility and quadriceps strength have been suggested to be associated with patellar tendinopathy [
6,
7]. Lower flexibility and greater muscle strength may increase tendon strain, transmit greater forces through the patellar tendon, and thus lead to tendon overload. Therefore, high patellar tendon force (PTF) associated with high loading rate of this force are thought to be the primary causative factors of patellar tendinopathy in sports that involve repeated jumping and landing [
8,
9,
10].
The landing phase of a jump-landing maneuver induced a large eccentric load on the knee extensor muscles between the time of the touchdown and the time the center of mass reached its lowest position [
11]. During this phase, eccentric quadriceps muscle contraction can load the patellar tendon beyond its inherent capacity and may cause microtrauma of tendon fibers [
12]. Therefore, the eccentric phase of landing is thought to be responsible for patellar tendinopathy [
13]. As this knee extensor mechanism is mainly involved in the development of patellar tendinopathy, focusing on the landing phase of a jump-landing task seems relevant in investigating this injury [
1]. A recent systematic review reported that a greater knee flexion angle at initial contact followed by hip extension rather than hip flexion during a horizontal landing were the only two variables associated with asymptomatic patellar tendinopathy that could be replicated between studies [
14]. In this study, asymptomatic patellar tendinopathy was characterized by the presence of an ultrasound abnormality. Moreover, this review identified conflicting results due to the different jump-landing tasks used in the scientific literature. Each jump-landing task induced different mechanical demands and elicited different biomechanical responses [
15].
During sports activities such as volleyball and basketball, athletes perform jumps not only with a vertical component but also in various horizontal directions. A previous study compared two phases of a single stop-jump task: the horizontal landing during the approach phase (before jumping) and the vertical landing of the stop-jump [
8]. The landing of the approach phase was called a horizontal landing because this movement referred to the braking phase where the participants decelerated their center of mass-horizontal velocity after the first acceleration steps. After the braking phase, participants performed a vertical propulsion followed by a landing which was called the vertical landing. Their results revealed higher PTF during the horizontal landing phase compared to the vertical landing phase of the stop-jump. This first evidence seemed to show that the additional forward deceleration of the center of mass during landing induced greater patellar tendon loading compared to landing with a vertical velocity only. Based on this finding, a systematic review suggested that the forward velocity component of the horizontal landing phase of a stop-jump may be considered as a threat in the development of patellar tendinopathy [
13]. However, no study has yet confirmed this observation when landing from a forward jump with a controlled vertical jump height.
As the measure of muscle and tendon forces during jumping and landing is not feasible in vivo, numerous studies have used numerical methods to estimate PTF [
8,
9,
16,
17]. Among these studies, two types of estimation methods were used. The first method, which will be called the inverse dynamic method, depends on the inverse dynamics, and does not consider muscle co-contraction. The second method, which will be called the static optimization method, relies on a static optimization procedure applied on a musculoskeletal model and considers muscle co-contraction. Although these two methods have been used in numerous studies, the effects of their different calculation procedures on the estimated PTF during jump-landing maneuvers remain unknown.
Sports activities require jumping not only with a vertical component but also mainly in the forward direction. However, it is yet unknown how the forward direction component during the jumping phase may affect the PTF when landing. Therefore, the main purpose of the present study was to compare PTF between landings preceded by a vertical jump and a forward jump in volleyball players. Based on the findings of a previous systematic review, we hypothesized that the forward jump-landing will generate higher PTF peaks and higher PTF loading rates compared to the vertical jump-landing [
13]. Additional kinetic and kinematic variables were also observed to better understand how jump-landing tasks may have influenced the PTF. The second purpose of this study was to compare two estimation methods of PTF. During a human movement, any flexor moment produced by the hamstrings or gastrocnemius must be compensated by higher knee extensor moments [
18]. As the inverse dynamic method does not consider muscle co-contractions, we supposed that the estimation of PTF will be lower for the inverse dynamic method compared to the static optimization method [
19].
2. Materials and Methods
2.1. Participants
Fifteen male volleyball players (age: 28.7 ± 7.1 years; height: 183.4 ± 8.4 cm; mass: 80.5 ± 8.5 kg; body mass index: 23.9 ± 1.7) participated in this study. Participants practiced at least two training sessions per week and had a minimum of three years of volleyball competitive playing experience at regional or national level. All participants indicated that they had no history of lower-limb injuries 6 months prior to the experiment. Written informed consent was obtained from each participant before data collection, all methods were carried out following the rules of the Declaration of Helsinki of 1975 and all the procedures were approved by the Aix-Marseille University ethics committee.
2.2. Experimental Protocol
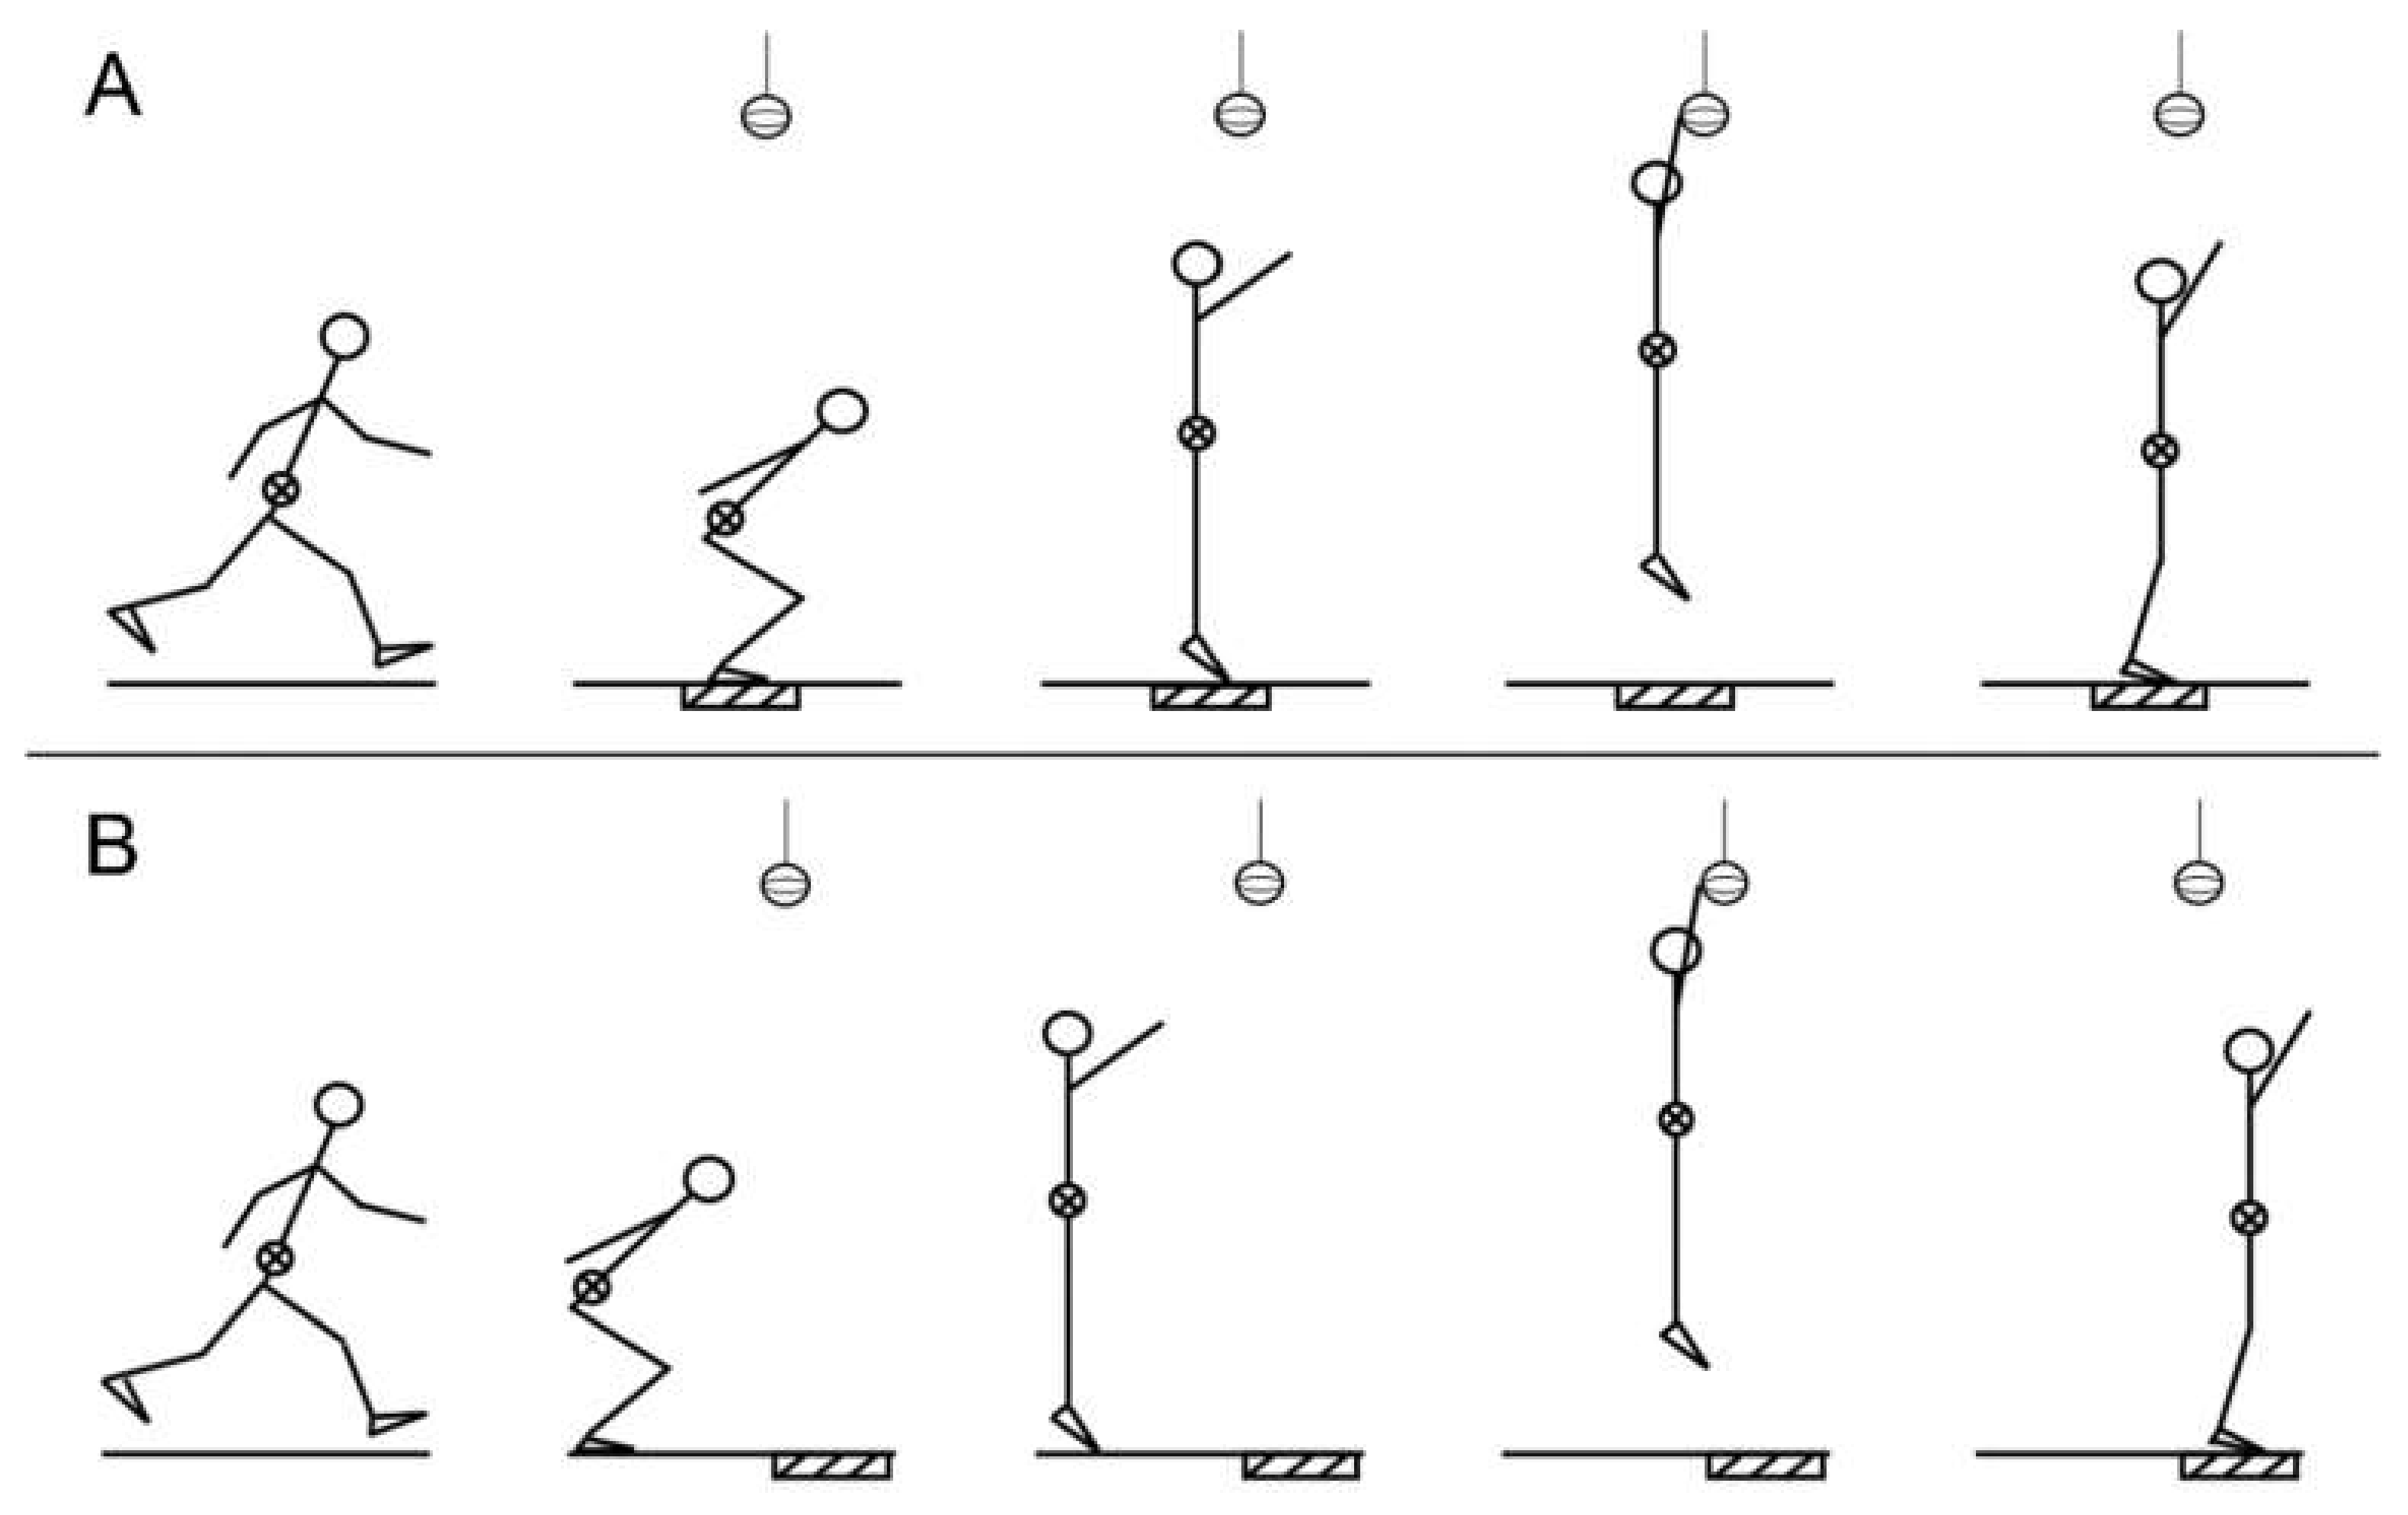
After completing a self-selected warm-up of 5 min followed by a tasks’ familiarization period, each participant performed vertical jump-landing (VJL) and vertical jump-landing with forward component (FJL) tasks. Both tasks consisted of a three-step approach followed by a two-legged take-off [
20]. During the take-off phase, participants were asked to align their feet in the sagittal plane to control feet position for both types of jumps. For the VJL, participants had to take-off and land in the same area by performing a vertical jump (
Figure 1A). For the FJL, after take-off participants had to land in an area ahead of them by performing a vertical jump-landing with forward component (
Figure 1B).
For both VJL and FJL tasks, after the take-off, participants were asked to reach, with their hand, for a target located at 85% of their maximal jump height to avoid potential fatigue effects [
21]. The maximum jump height of two maximal effort VJL trials was used to set the target height before the test. The target was a real ball suspended from the ceiling to simulate volleyball jumps as realistically as possible. Landing areas were composed of two force plates of dimensions 60 × 40 cm for the VJL and two 90 × 60 cm force plates for the FJL. For both tasks, participants were instructed to land on their both feet, right foot on the right force plate, left foot on the left force plate. This type of landing was chosen because most volleyball landings are performed with both feet [
22]. After landing, participants had to maintain their balance for 5 s without tripping. Participants were asked to perform eight successful trials of each jump-landing task in random order. There was a minimum of 30 s of rest between trials to avoid fatigue. Each participant wore his own training shoes.
2.3. Instrumentation
Fifty-three passive reflective markers with a diameter of 14 mm were placed on the body. Markers were placed bilaterally on the acromion, shoulder, medial and lateral epicondyle of humerus, radius-styloid process and ulna-styloid process, third head of metacarpal, anterior superior iliac spine, posterior superior iliac spine, greater trochanter, medial and lateral femoral condyles, tibial tuberosity, lateral shank, and medial and lateral malleolus. Three markers were attached to a rigid cluster and placed at the mid-thigh. Four markers were attached to each shoe on the second toe, posterior heel, medial side of first metatarsal head and lateral side of fifth metatarsal head. Markers were also placed on the sternum, seventh cervical vertebrae, tenth thoracic vertebrae, left and right anterior and posterior head. Sixteen cameras (Oqus, Qualisys, Sweden) were used to collect motion data at 200 Hz. Synchronized analog data were collected at 2000 Hz with the use of four force plates (9281C, 9281EA and two 9287CA, Kistler, Switzerland).
2.4. Data Processing
A 23 degree of freedom (DOF) full-body musculoskeletal model, with 92 muscles actuators (43 per leg and 6 at the torso) was used to compute muscle forces, joint kinematics and moments through OpenSim v4.0 [
23]. The trunk had 3-DOF and the lower extremity was modeled as seven body segments: pelvis, femur, patella, tibia/fibula, talus, foot, and toes. The pelvis segment had 6-DOF and was able to rotate and translate in all three dimensions with respect to the ground. The knee was modeled as a simple 1-DOF joint. The hip and the ankle joints had respectively 3 and 2-DOF. The metatarsophalangeal joint had 1-DOF.
The generic model was scaled to match the anthropometry of each participant as closely as possible. Three-dimensional marker coordinates were low pass filtered at 10 Hz using a zero time-lag fourth order Butterworth filter and used to calculate the hip, knee and ankle joint angles using OpenSim’s inverse kinematics tool. Joint kinematics conventions were defined such as hip flexion, knee flexion, and ankle dorsiflexion and were assigned to be positive. Then, the combination of ground reaction force and joint kinematic data was used to calculate net internal joint moments from OpenSim’s inverse dynamics tool. To overcome inaccuracies in assessment of joint moment calculation, force plate data were filtered in the same way as kinematic data using a cutoff frequency of 10 Hz and a zero time-lag fourth order Butterworth filter [
24]. Individual muscle forces were estimated from a static optimization procedure using OpenSim’s static optimization tool [
25]. The muscular load sharing problem was solved for each time step, by minimizing a function composed of the sum squared of muscle activations subject to the constraints of force–length–velocity properties of muscles. The individual muscular moment is calculated from the muscle force (the unknown of the optimization problem) and muscle moment arms, which are based on musculoskeletal anatomy and may or may not depend on joint angles. The maximum possible muscle forces are limited by physiological values, which constitutes an additional constraint. The quadriceps force was calculated by summing the force of four muscles of the musculoskeletal model: rectus femoris, vastus lateralis, vastus intermedius, vastus medialis. The PTF estimated with the inverse dynamic method was calculated following the equation:
where the patellar tendon moment arm was calculated as a function of the knee flexion angle [
26,
27]. Finally, the PTF estimated with the static optimization method was calculated following the equation:
where the ratio of PTF and quadriceps force was estimated by a regression equation using the knee flexion angle [
28].
The landing phase was defined as the time interval from initial contact to the maximum knee flexion. Initial contact was determined when the vertical ground reaction force (GRF) first exceeded 10 N. Peaks of PTF from both methods were determined as the maximum PTF during the landing phase. Loading rates of PTF from both methods were calculated by dividing the PTF peak minus the PTF at initial contact by the time interval between initial contact to the time of the PTF peak. Peak of quadriceps force was determined as the maximum quadriceps force during the landing phase. PTF peaks, PTF loading rates and peak of quadriceps force were normalized to body weight.
Additional kinetic and kinematic dependent variables were also analyzed to understand the effects of jump-landing tasks and PTF estimation methods. Kinetic dependent variables were composed of the magnitude of the peak of vertical GRF and the peak of anteroposterior GRF, the loading rate of peak vertical GRF, and the peak knee moment in the sagittal plane. The loading rate was defined as the average slope of the force-time curve from 20% to 80% before the corresponding peak [
29]. Except for the inverse dynamic procedure, no filtering was conducted on the GRF data to avoid possible signal distortion, especially on the impact peak. All GRF variables were normalized to body weight, knee joint moment was normalized to body mass and the knee extension moment was assigned to be positive. Additional kinematic dependent variables were hip, knee and ankle angles in the sagittal plane at initial contact and the range of motion for the landing phase. Jump height was also calculated by the maximum height of the body center of mass. The center of mass was defined as the overall center of mass of the full-body musculoskeletal model and was calculated using the OpenSim’s analyze tool.
2.5. Statistical Analysis
The normality of residuals and the homogeneity of variance were first checked with the Shapiro–Wilk test and the Bartlett’s test, respectively. Then, a two-way repeated measures ANOVA (jump-landing task × PTF estimation method) was used for statistical analysis of PTF peaks and PTF loading rates. Post hoc pairwise comparisons with a Bonferroni correction were performed when the ANOVA revealed statistically significant differences. A paired sample Student’s t-test was also used to investigate the effect of jump-landing tasks on other dependent variables. When the assumptions were not satisfied, a paired sample Mann–Whitney–Wilcoxon test was performed. The significance level was set at p < 0.05. Partial omega squared was used to determine small (0.01–0.06), medium (0.06–0.14) and large (>0.14) effect sizes on the two-way ANOVA. Cohen’s d was used to determine small (0.2–0.5), medium (0.5–0.8) and large (>0.8) effect sizes on the paired sample Student’s t-test or Mann–Whitney–Wilcoxon test. All statistical analyses were performed using RStudio software (version 1.1.453, RStudio, Inc., Boston, MA, USA).
4. Discussion
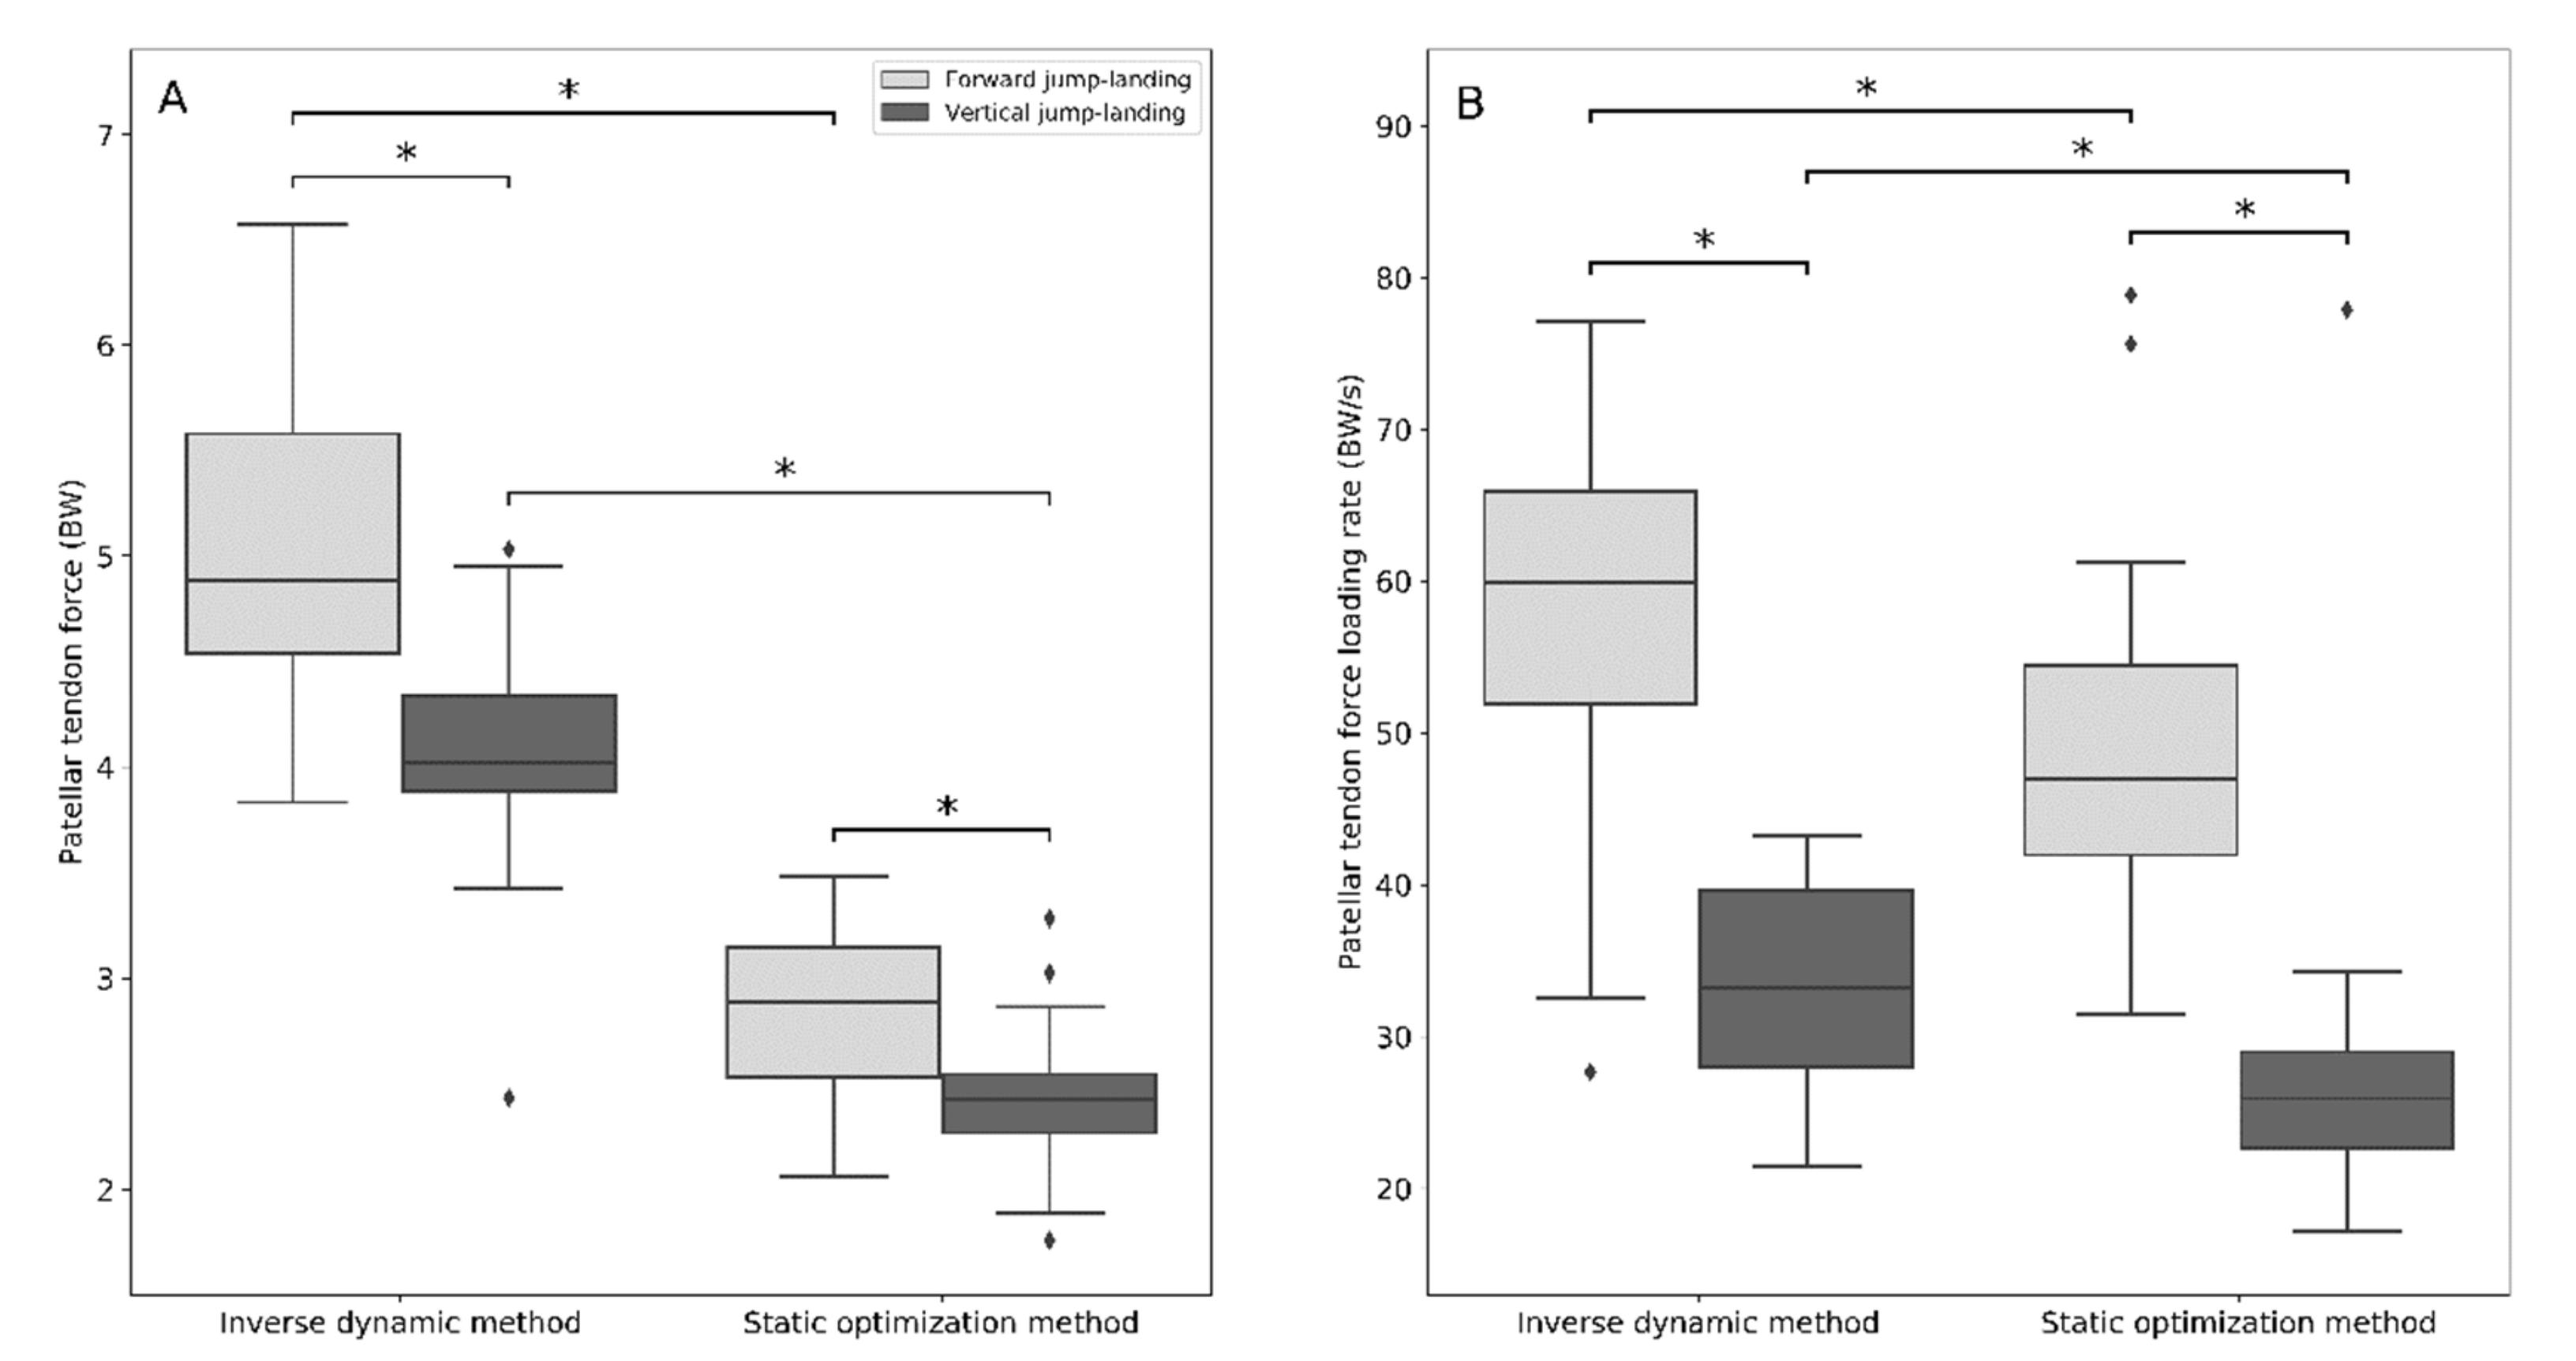
The primary purpose of this investigation was to compare the patellar tendon force between landings of a vertical jump-landing (VJL) and a vertical jump-landing with a forward velocity component (FJL) in volleyball players. The findings of this study support our hypothesis that the FJL would generate higher PTF peaks and higher PTF loading rates compared to the VJL. PTF were on average 25% and 17% higher during FJL calculated with inverse dynamic and static optimization methods, respectively. According to the inverse dynamic method, FJL and VJL exposed the patellar tendon to an average maximal force of 5.0 ± 0.8 and 4.0 ± 0.6 BW respectively, which closely matched the results from previous investigations on lateral stop-jump, and the horizontal and vertical landing phases of a stop-jump [
8,
9]. Average PTF loading rates estimated with the inverse dynamic method were 57 ± 14 and 33 ± 7 BW/s on FJL and VJL, respectively, and were also in agreement with a previous investigation [
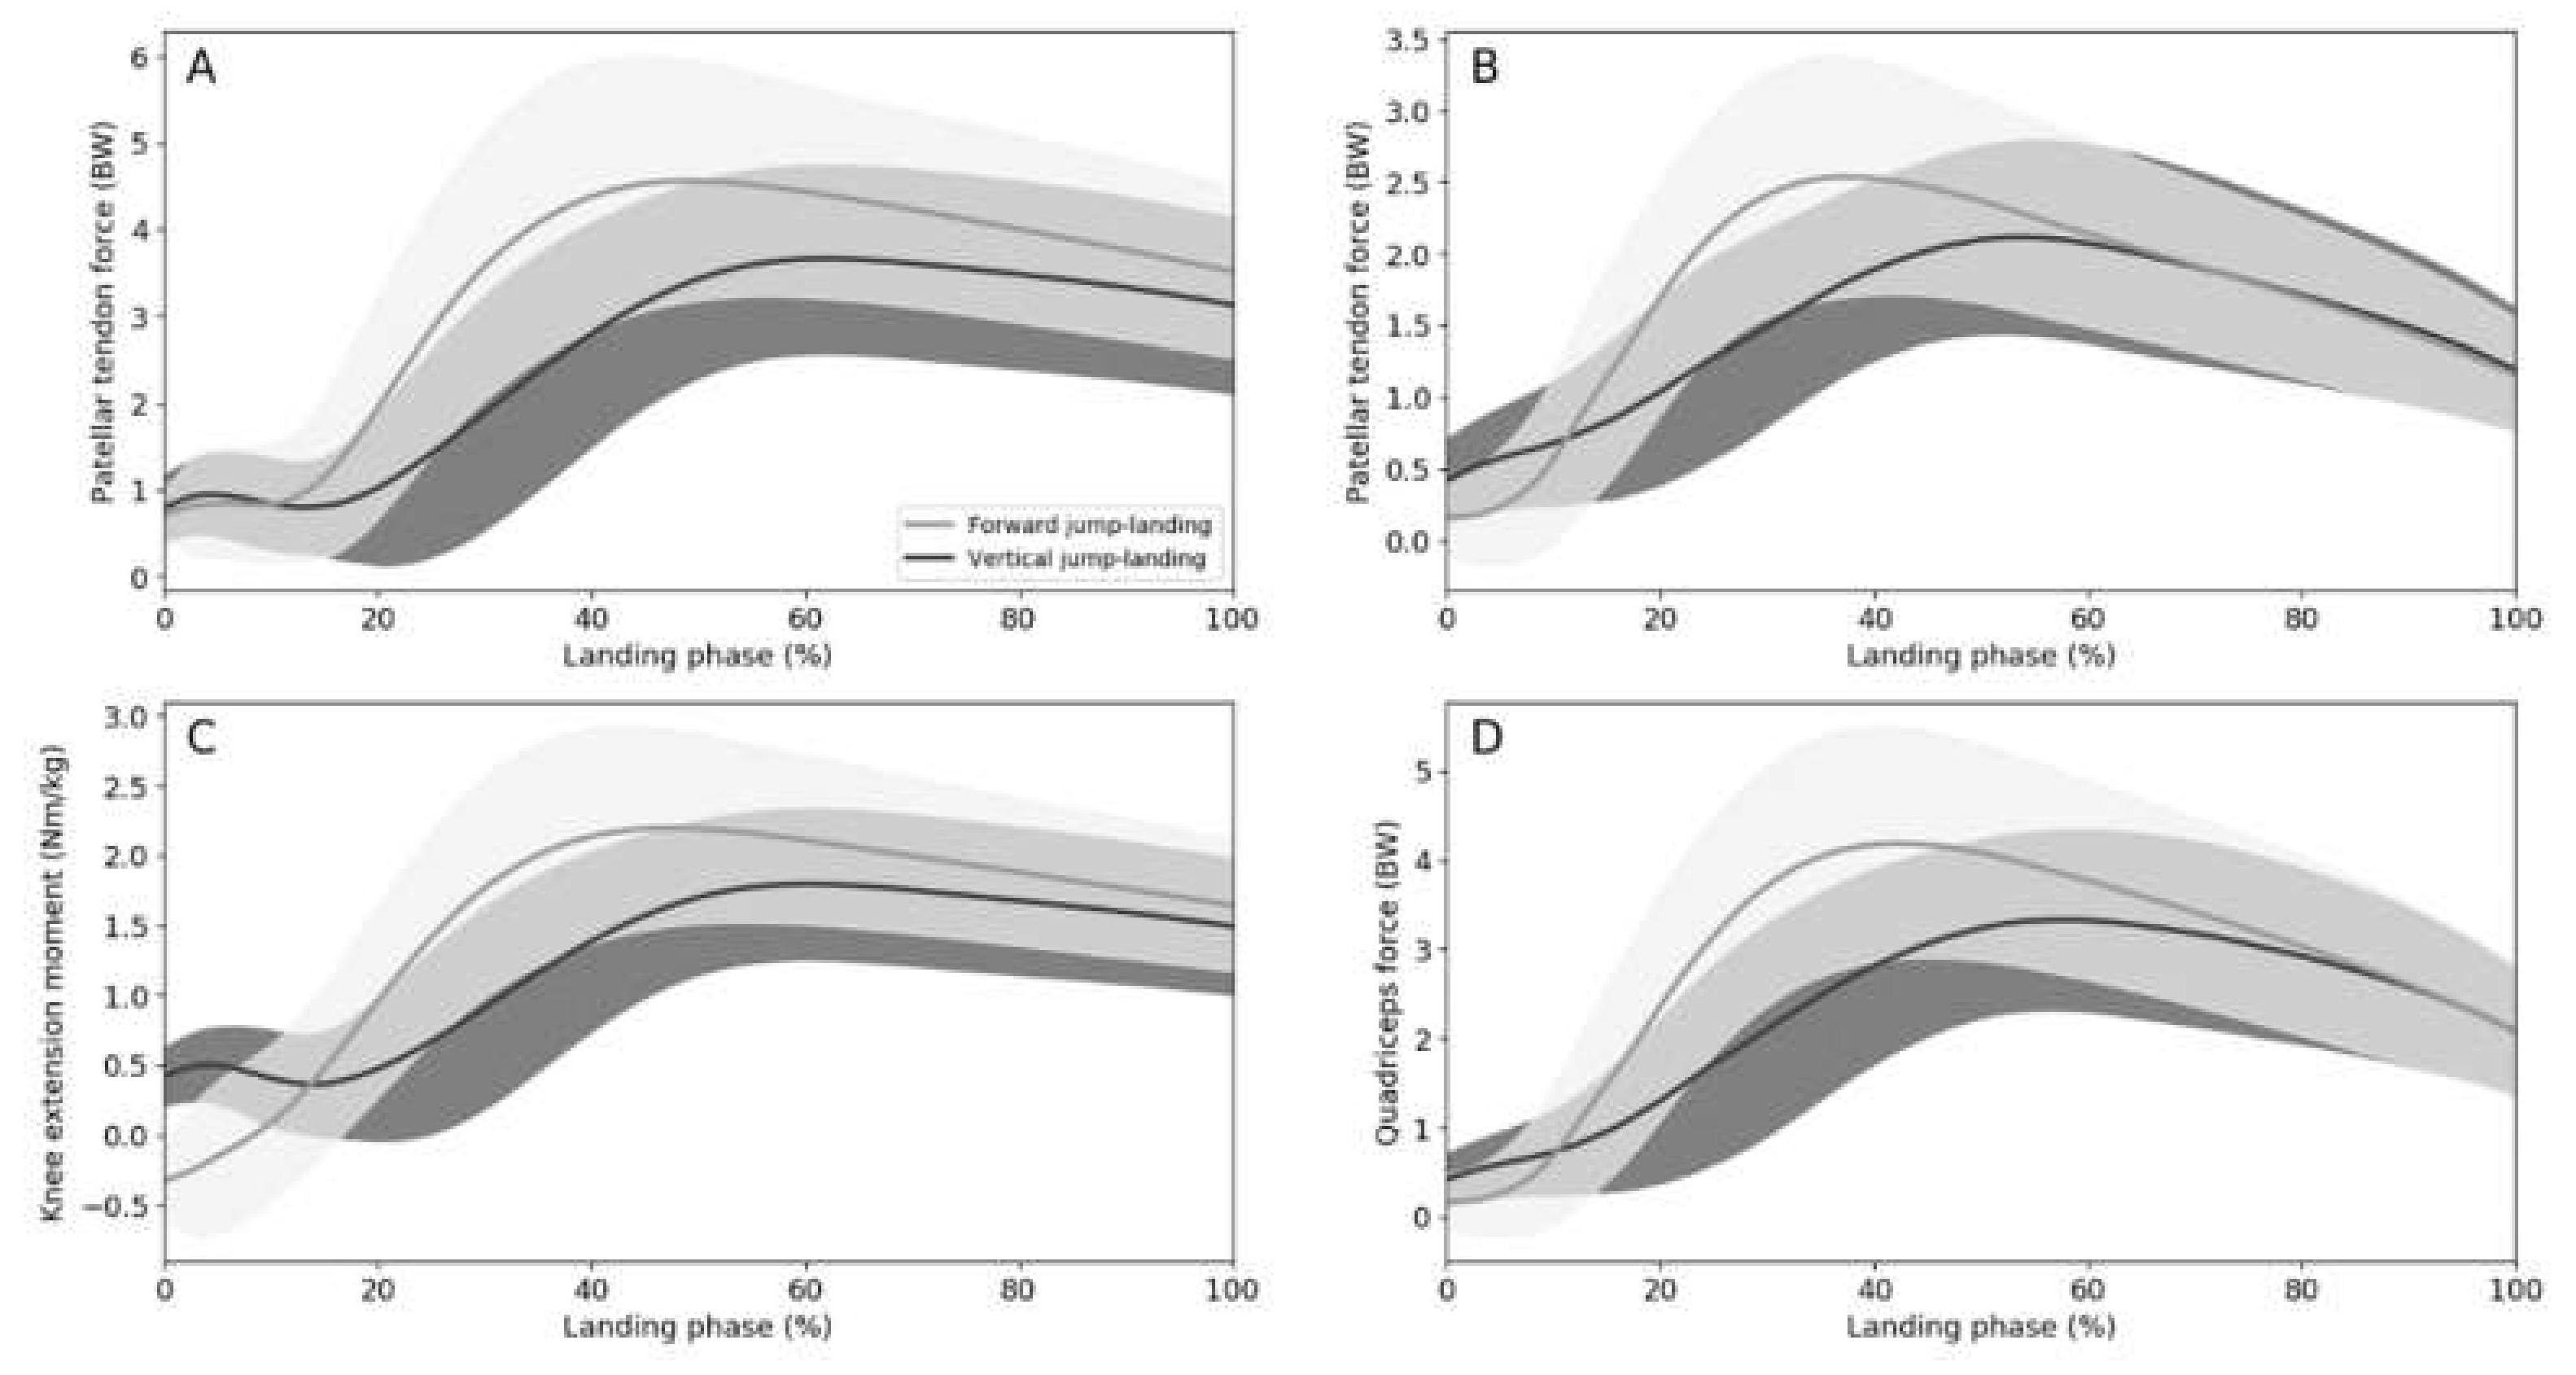
8]. These findings confirmed that landing from a jump with a forward velocity component generated higher loads on the patellar tendon compared to landing from a jump with only vertical motion.
In association with higher PTF, our results showed that participants landed with greater hip and knee flexion angles at initial contact and greater knee flexion range of motion during FJL compared to VJL. Inappropriate landing technique can influence the risk of patellar tendinopathy development [
14]. For example, asymptomatic athletes with patellar tendon abnormality previously displayed greater knee flexion at initial contact during the horizontal landing phase of a stop-jump [
30,
31]. In volleyball players, knee flexion angles were also strong predictors of the patellar tendon pain during both spike and block jumps [
10]. The latter study stated that the likelihood of patellar tendinopathy was higher with greater knee flexion angles associated with high impact forces and rates of force development in the knee extensor mechanism [
10]. Findings of these studies suggested that the knee flexion angle at initial contact may be related to patellar tendon load. The more the knee is flexed, the more the tendon is placed under tension, which may contribute to greater tensile loading on the region of the tendon and a greater ratio of PTF and quadriceps force [
28,
32]. From a biomechanical perspective, a larger knee flexion angle will increase the distance of the lever arm between the center of the knee joint and the line of action of the resulting GRF vector which will increase the knee extension moment and thus lead to a larger PTF. The greater knee flexion observed during FJL was the first element to explain the greater PTF compared to VJL. For the hip joint, athletes with asymptomatic patellar tendinopathy extended rather than flexed their hip after initial contact of a horizontal landing of a stop-jump compared to asymptomatic athletes with normal patellar tendons [
14]. In the present study, although participants displayed greater hip flexion angles during the FJL, they flexed their hip after the initial contact for both tasks (
Table 2). This result is not surprising, firstly, because the FJL task was different from the horizontal landing task of the previous studies. The horizontal jump task referred to the braking phase where the participants decelerated their center of mass velocity after the first acceleration steps whereas the FJL was a complete task aiming to perform a higher jump. Secondly, because the population of the current study was composed of healthy volleyball players with no recent history of lower-limb injuries.
The results also showed that the maximum eccentric quadriceps force was 22% higher and the knee extension moment was 23% higher during the FJL compared to the VJL. Similar observations have been made in a previous study which reported higher knee joint moments during the horizontal landing of the approach phase of a stop-jump (before jumping) compared to the vertical landing phase in male athletes with healthy patellar tendons [
8]. It is likely that the higher knee joint moment observed in the FJL was mainly due to the higher peak of anteroposterior GRF. This additional anteroposterior component may modify the direction of the vector of the resultant GRF and increase the perpendicular distance between the knee joint center and the line of action of this vector [
8]. Greater quadriceps force was also required to resist the forward velocity component during landing. Although participants jumped at the same height for both tasks, our results indicated that the peak vertical GRF and its loading rate were higher for the FJL compared to the VJL. The additional forward velocity during FJL influenced not only the anteroposterior component of the GRF but also the vertical component, which could explain the greater quadriceps force production required compared to VJL. As a result, the greater quadriceps force may transmit greater forces through the patellar tendon. However, it was suggested that athletes who were not able to cope with eccentric patellar tendon loads during landing may be more prone to developing patellar tendinopathy [
13]. Therefore, our results indicated that the forward velocity component of the aerial phase of a jumping task may play an important role in the development of patellar tendinopathy during landing.
The second purpose of this investigation was to compare two estimation methods for PTF available in the scientific literature: the inverse dynamic method and the static optimization method. The inverse dynamic method calculates the PTF by dividing the knee joint moment by the estimated patellar tendon moment arm [
26]. The knee joint moment was calculated by inverse dynamics and the patellar tendon moment arm was estimated by a regression equation using the knee flexion angle, obtained by dissection of cadaver specimens [
27]. The static optimization method consists of multiplying the quadriceps tendon force with a ratio of the PTF and the quadriceps tendon force as a function of the knee flexion angle [
28,
33]. The ratio of the PTF and the quadriceps tendon force represents the part of the quadriceps force that is distributed over the patellar tendon [
28]. The latter method should provide a more realistic approach as it considers muscle co-contractions. Therefore, we hypothesized that the estimation of PTF calculated with the inverse dynamic method would be lower because this method does not consider muscle co-contractions [
19]. However, the results revealed that the inverse dynamic method estimated statistically significant higher PTF peaks compared to the static optimization method.
We speculated that this unexpected difference may be due to an underestimation of the ratio used in the static optimization method that represents the part of the quadriceps force that is distributed over the patellar tendon. This ratio was determined by a previous study using a mathematical model based on knee autopsies [
28]. However, this latter study has several limitations. Firstly, the knees were obtained from cadavers of men who were around 77 years old, whereas our participants were on average 29 years old. A systematic review highlighted that the aging process appeared to be associated with a decrease in the elastic modulus and stiffness of collagenous tissues [
34]. Thus, these potential differences in mechanical properties of the patellar tendon may have an impact on the PTF estimated by the static optimization method. Secondly, their ratio was not validated by in vivo experimental measurements because the authors did not have the required technical facilities [
28]. These authors compared this ratio with the available literature and showed that it was lower than in a previous study [
35]. The results of our study suggested that the consideration of muscle co-contractions alone does not result in a higher PTF, possibly due to the underestimated ratio of the PTF and the quadriceps tendon force used in the static optimization method.
Interestingly, although statistically significant differences were found between both estimation methods, the results of both jump-landing tasks based on PTF peaks and loading rates were not different. Thus, regardless of the estimation method chosen, the overall conclusions would be: FJL induced higher forces and loading rates on the patellar tendon compared to VJL. The advantage of the static optimization method is that this method considers muscle co-contractions and may provide more biologically plausible values compared to the inverse dynamic method. However, the main limitation of the static optimization method is that the PTF values estimated were lower compared with the PTF values estimated through the inverse dynamic method which were known to be underestimated compared to reality [
8,
9]. Researchers must consider both advantages and limitations when choosing the estimation methods according to their purposes.
There are limitations in the current study that must be considered when interpreting the results. Firstly, the complete sequence of the jumping movement was not studied because the purpose of the current study was to focus on the landing phase which was considered a greater risk for the development of patellar tendinopathy. Another study focusing on the complete jumping task and highly comparable to volleyball practice would be needed to better understand the risk of injury in real practice conditions. Secondly, the PTF was estimated from a musculoskeletal model and not measured directly, which is currently not possible in vivo in healthy participants. Without these in vivo measurements, it is difficult to determine the true accuracy of the PTF estimation methods. Lastly, the musculoskeletal model was composed with only one degree of freedom for the knee joint, which may oversimplify how the patellar tendon was loaded as the patellar tendon is a three-dimensional structure [
36].


