
Failure Analysis of Steel Fiber-Reinforced Concrete T-Beams without Shear Stirrups


Abstract
:1. Introduction
2. Shear Critical Failure Test of an R/FRC T-Beam
3. Finite Element Models
4. Results and Discussions
5. Conclusions
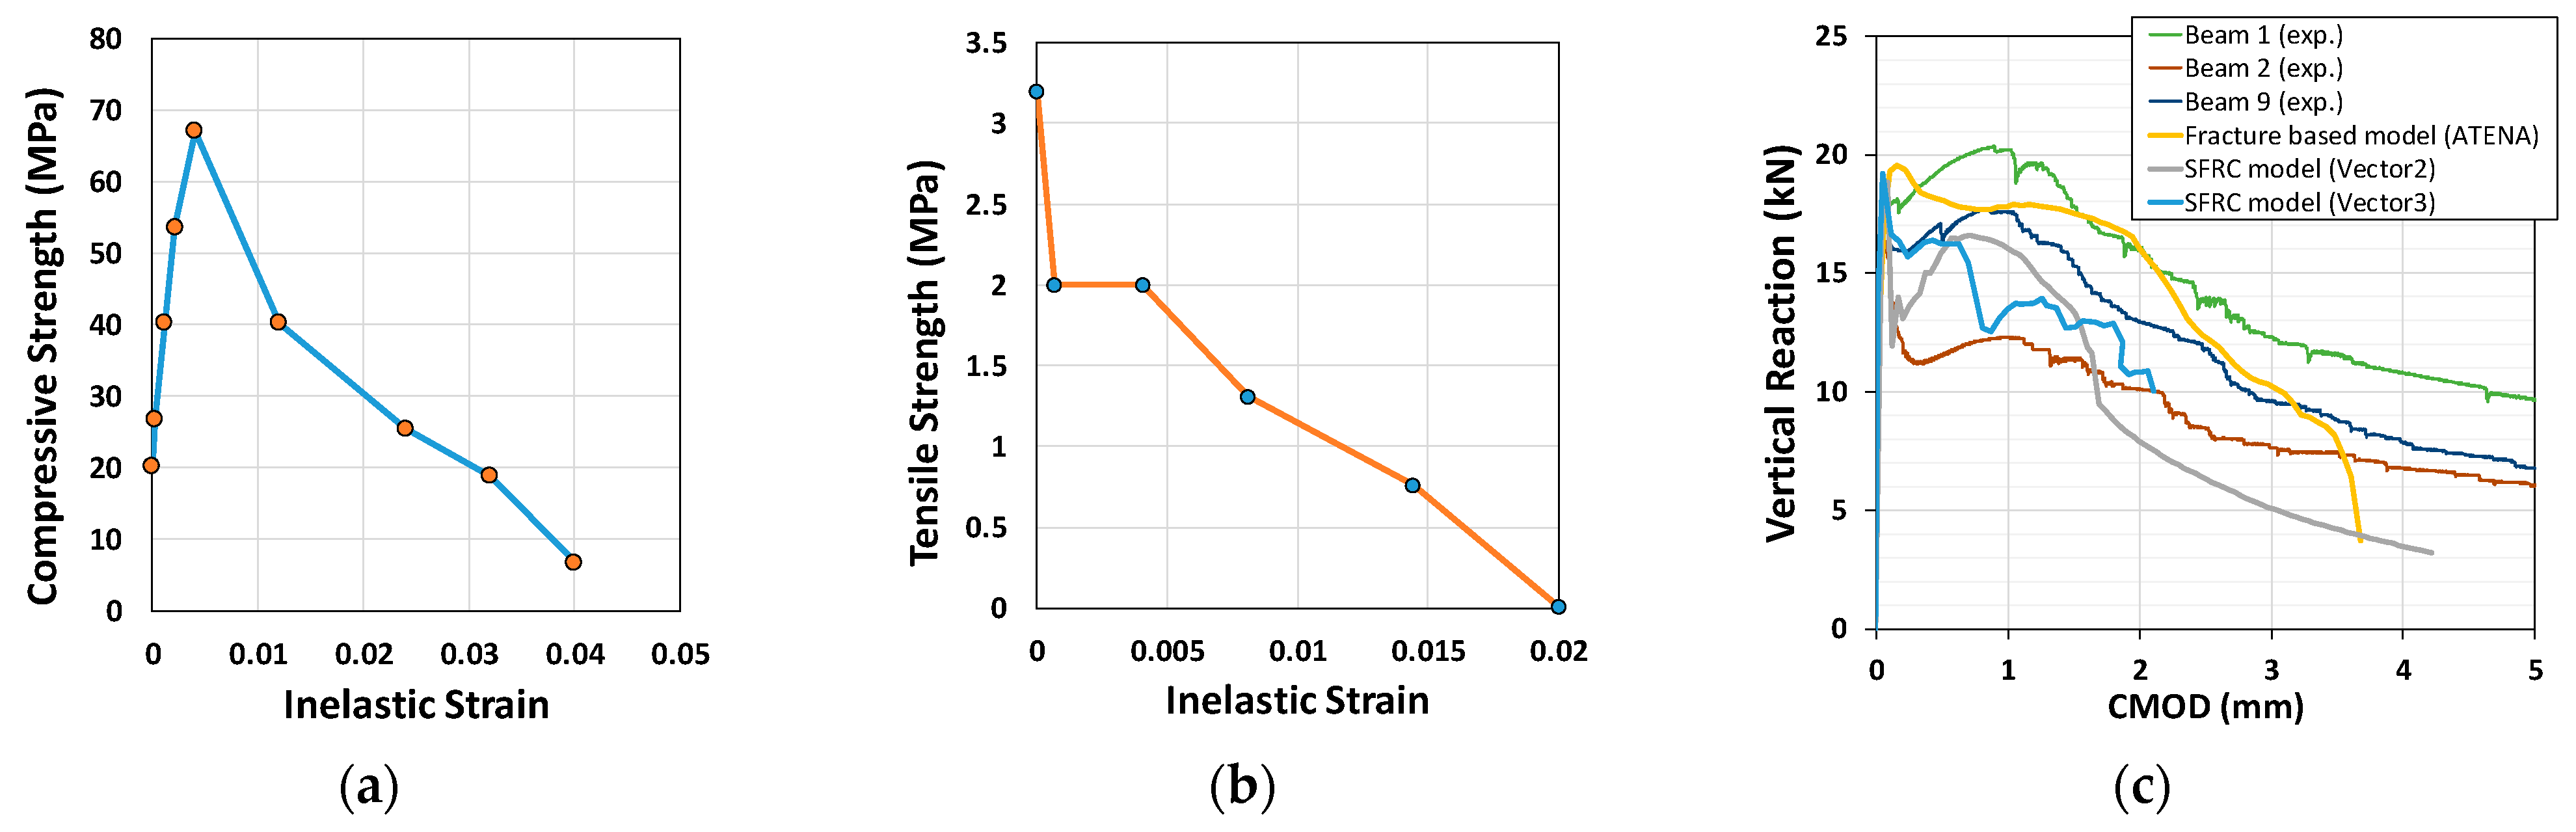
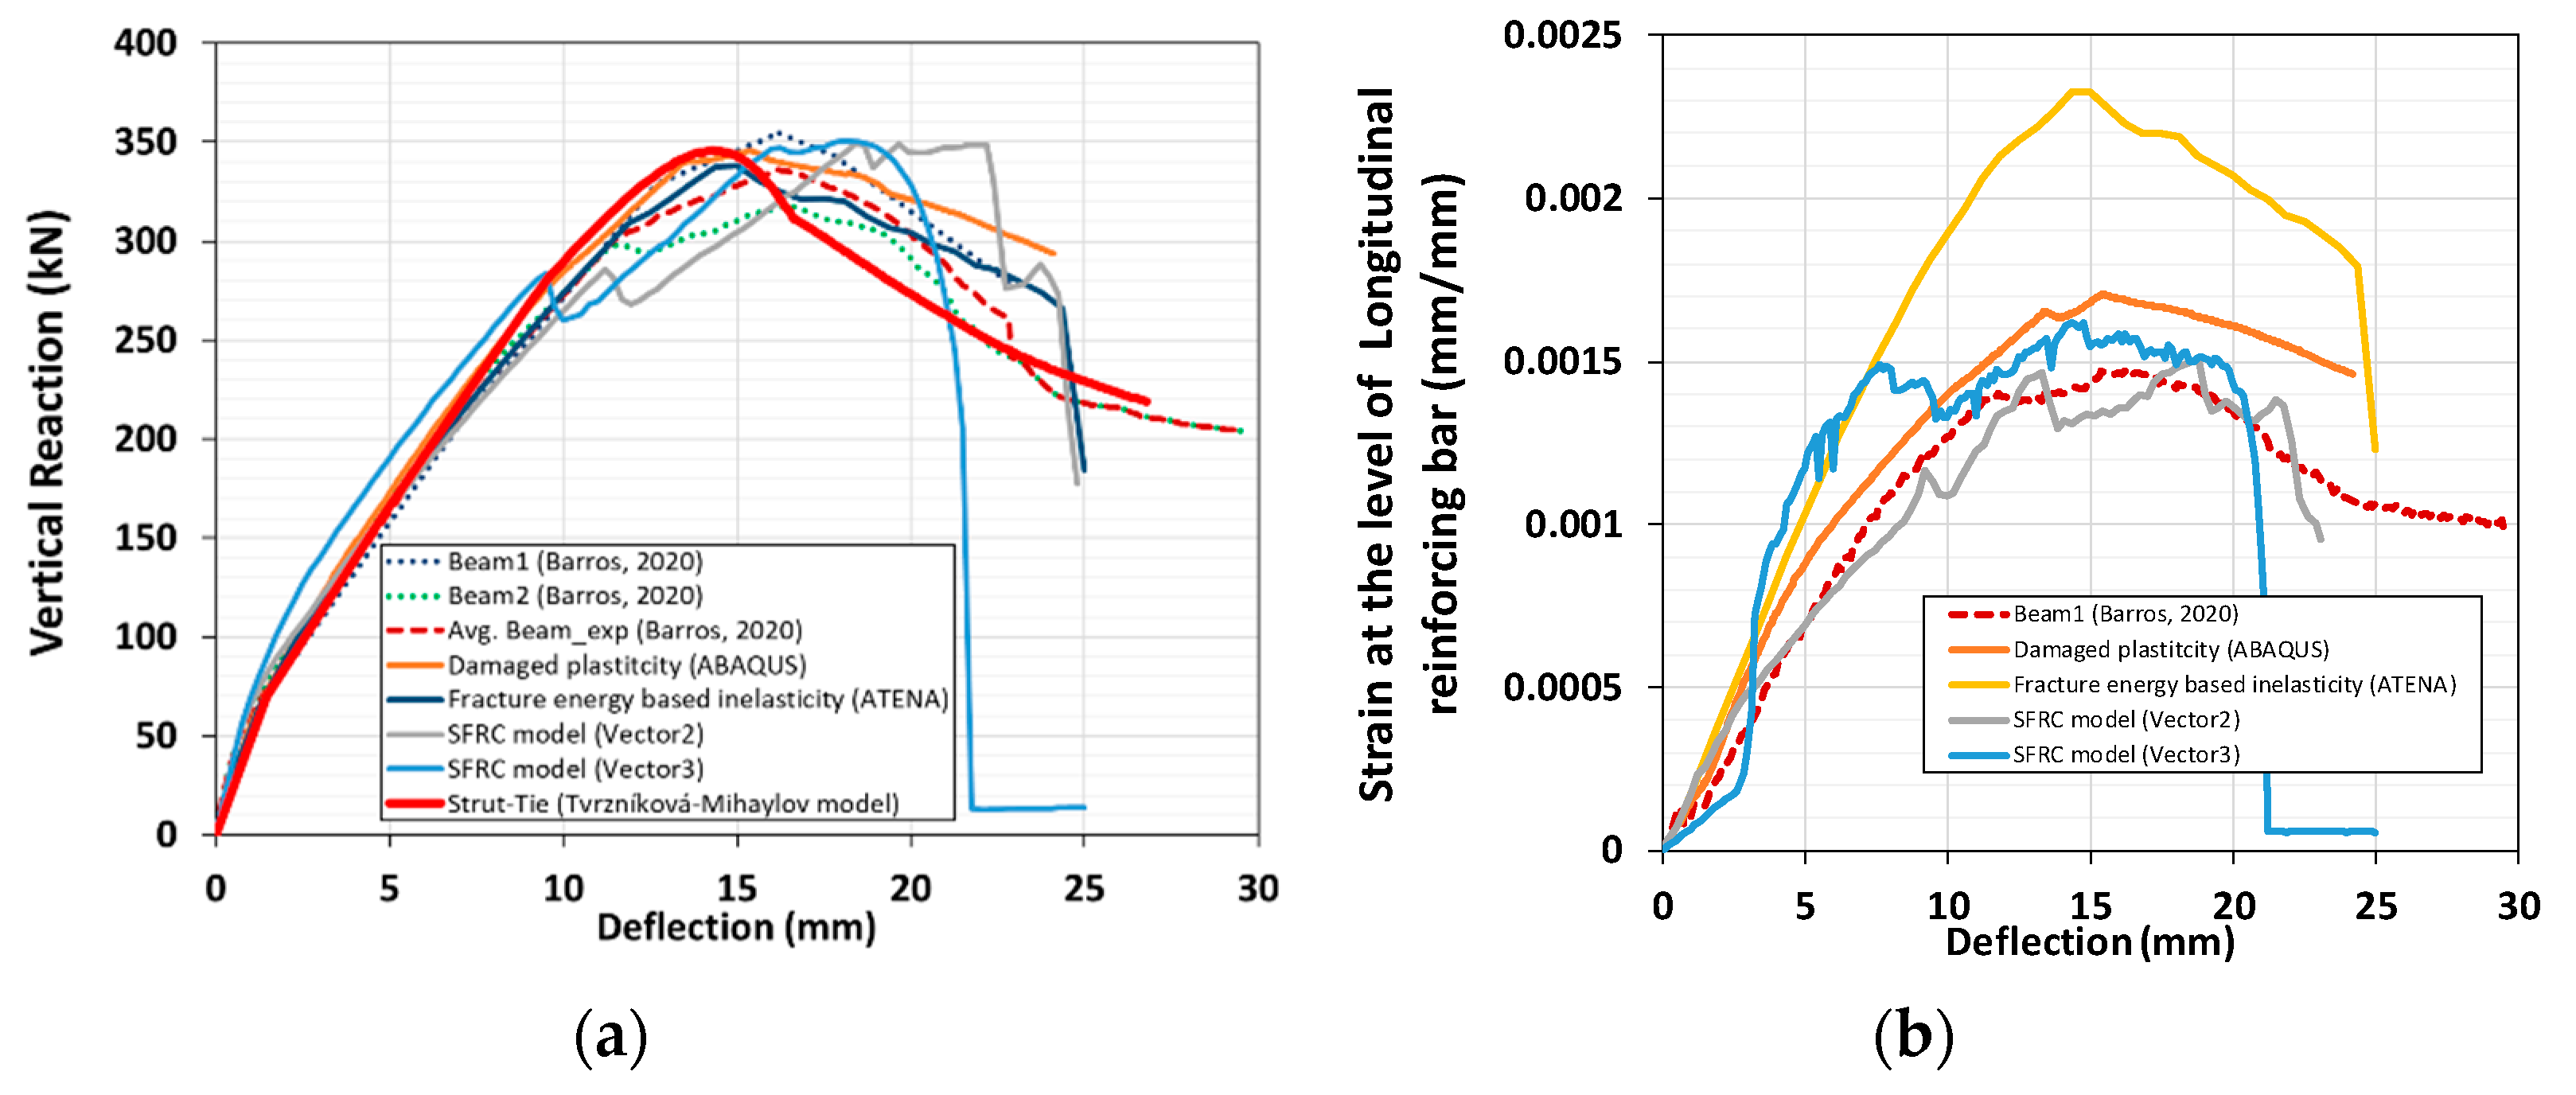
- The shear capacity of the T-beam was approximately 350 kN. The nonlinear analyses of ABAQUS, Vector2, Vector3, and ATENA were in good agreement with the experimental results.
- However, the strains at the level of longitudinal reinforcing differed according to the chosen platform and the model (the continuum-damage, fracture energy-based inelasticity, and modified MCFT models). The continuum-damage model accurately predicted strain at the level of the bottom reinforcement.
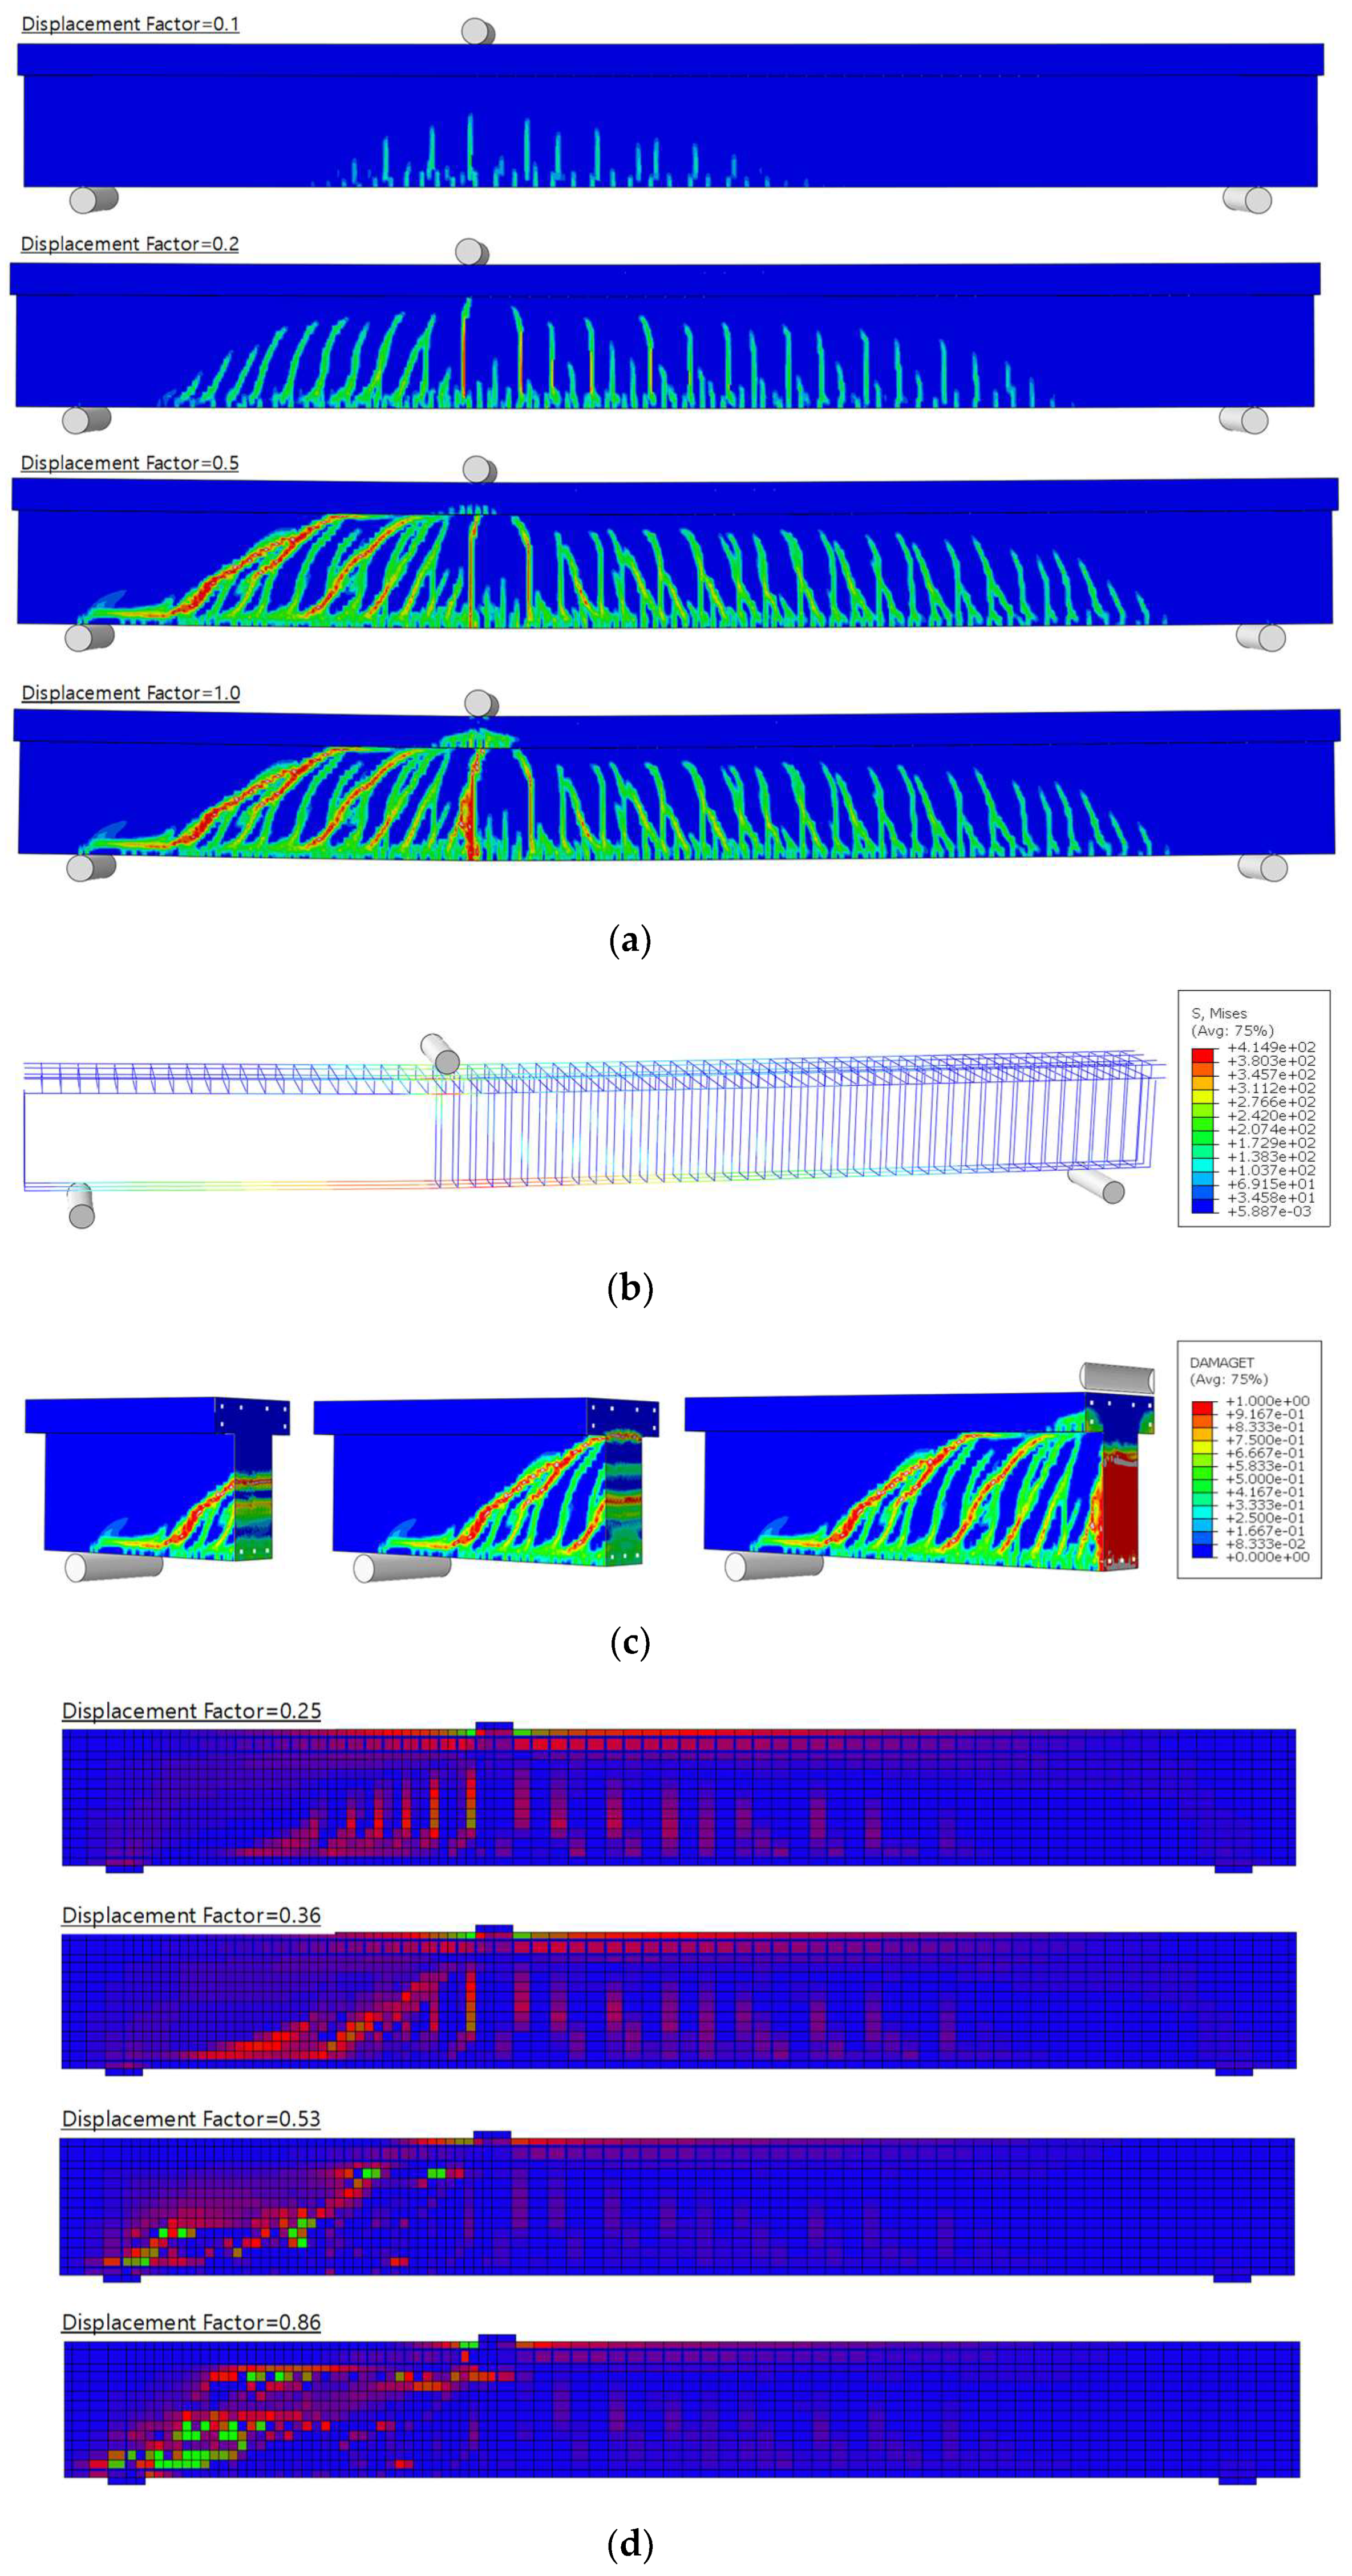
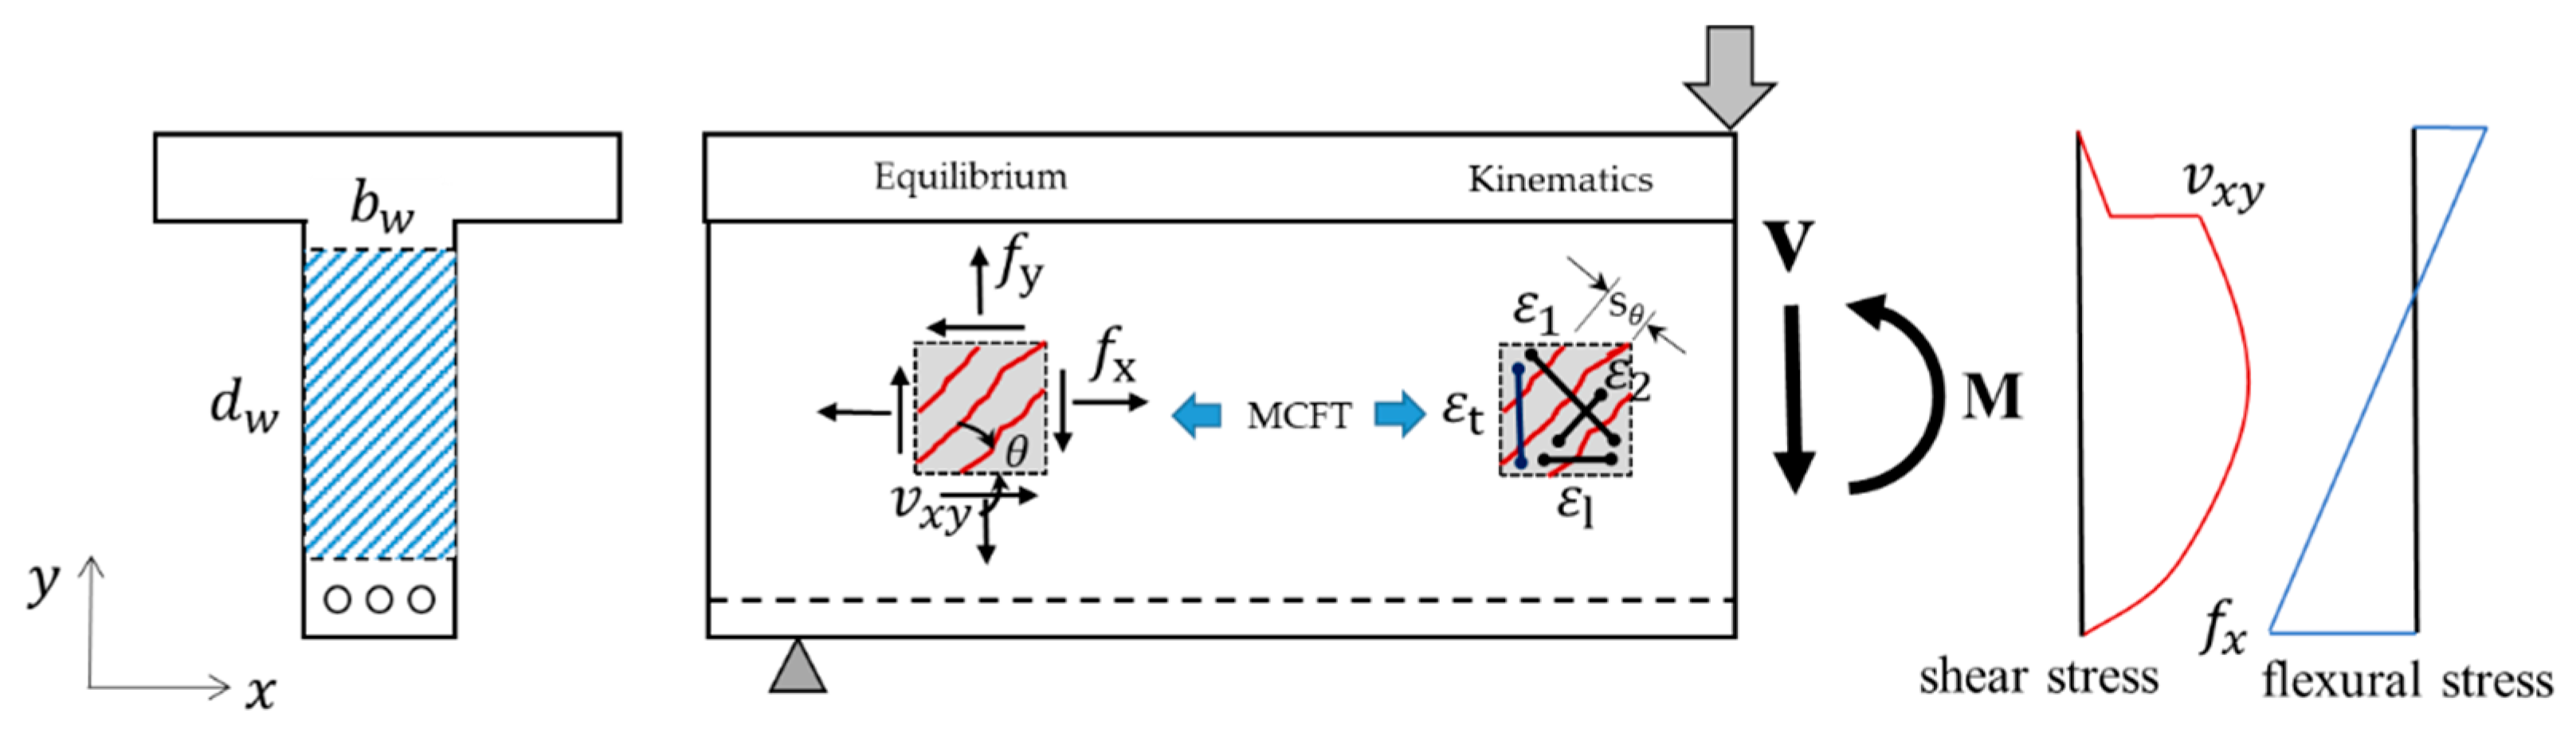
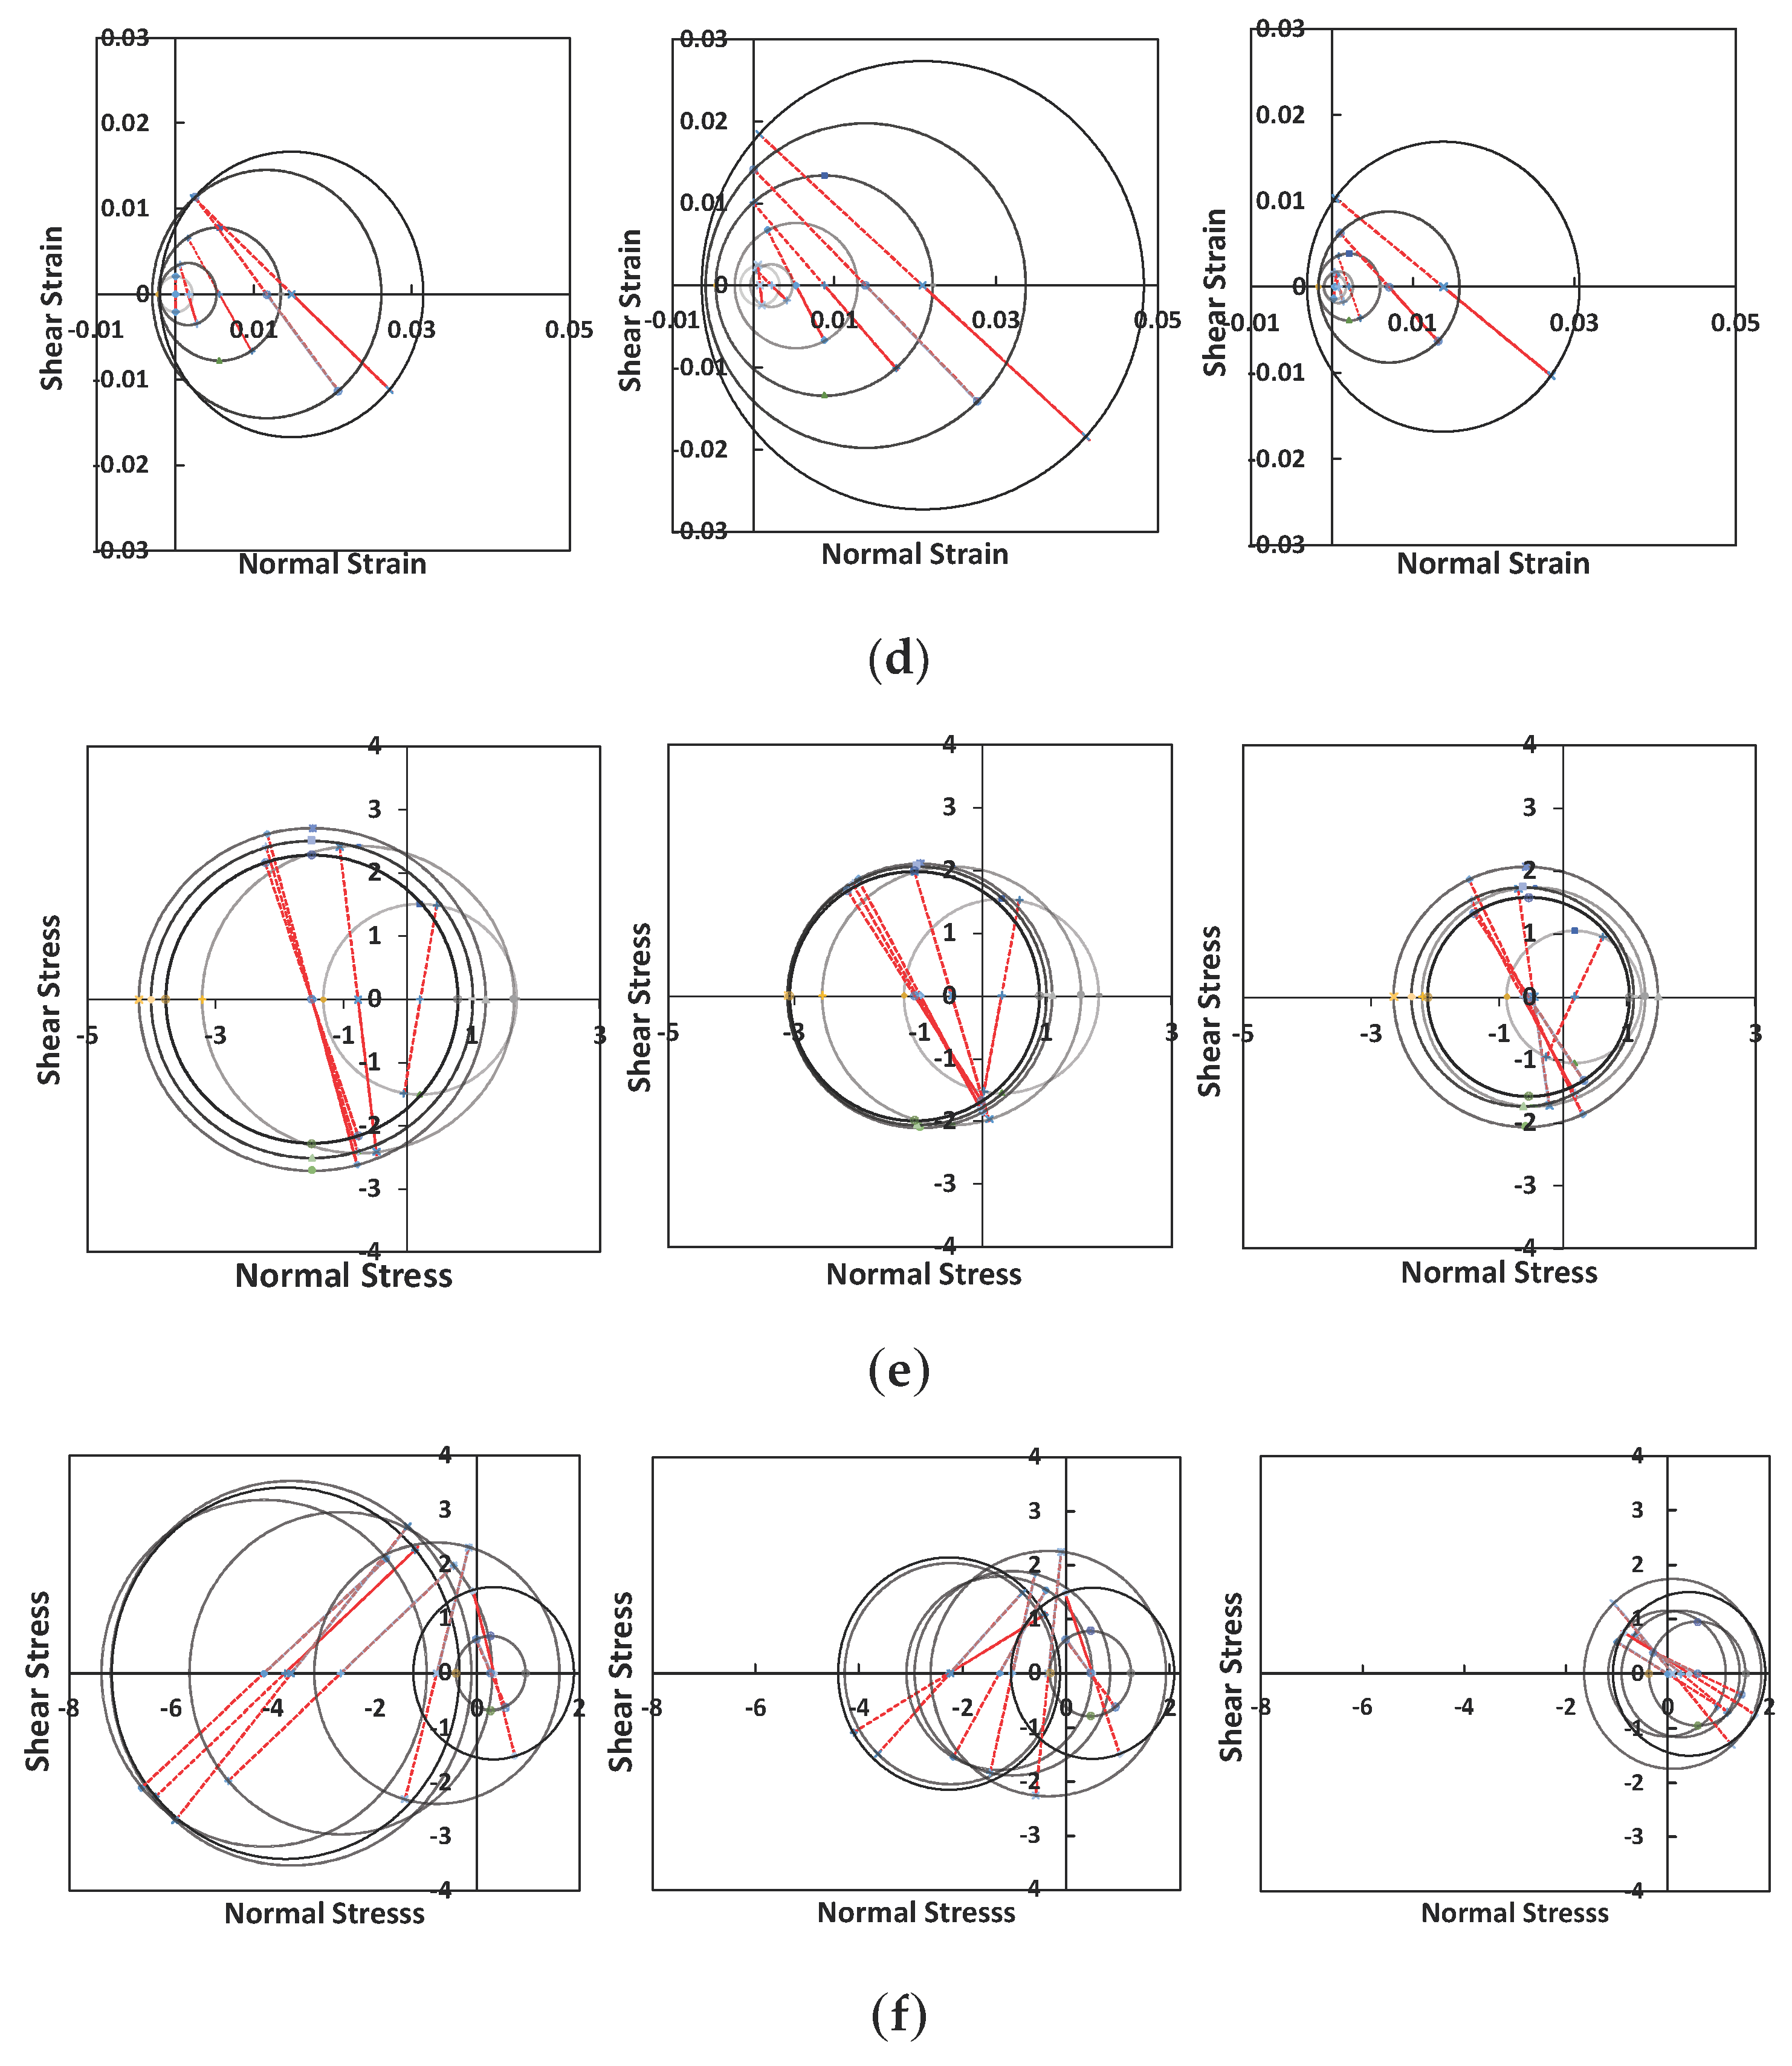
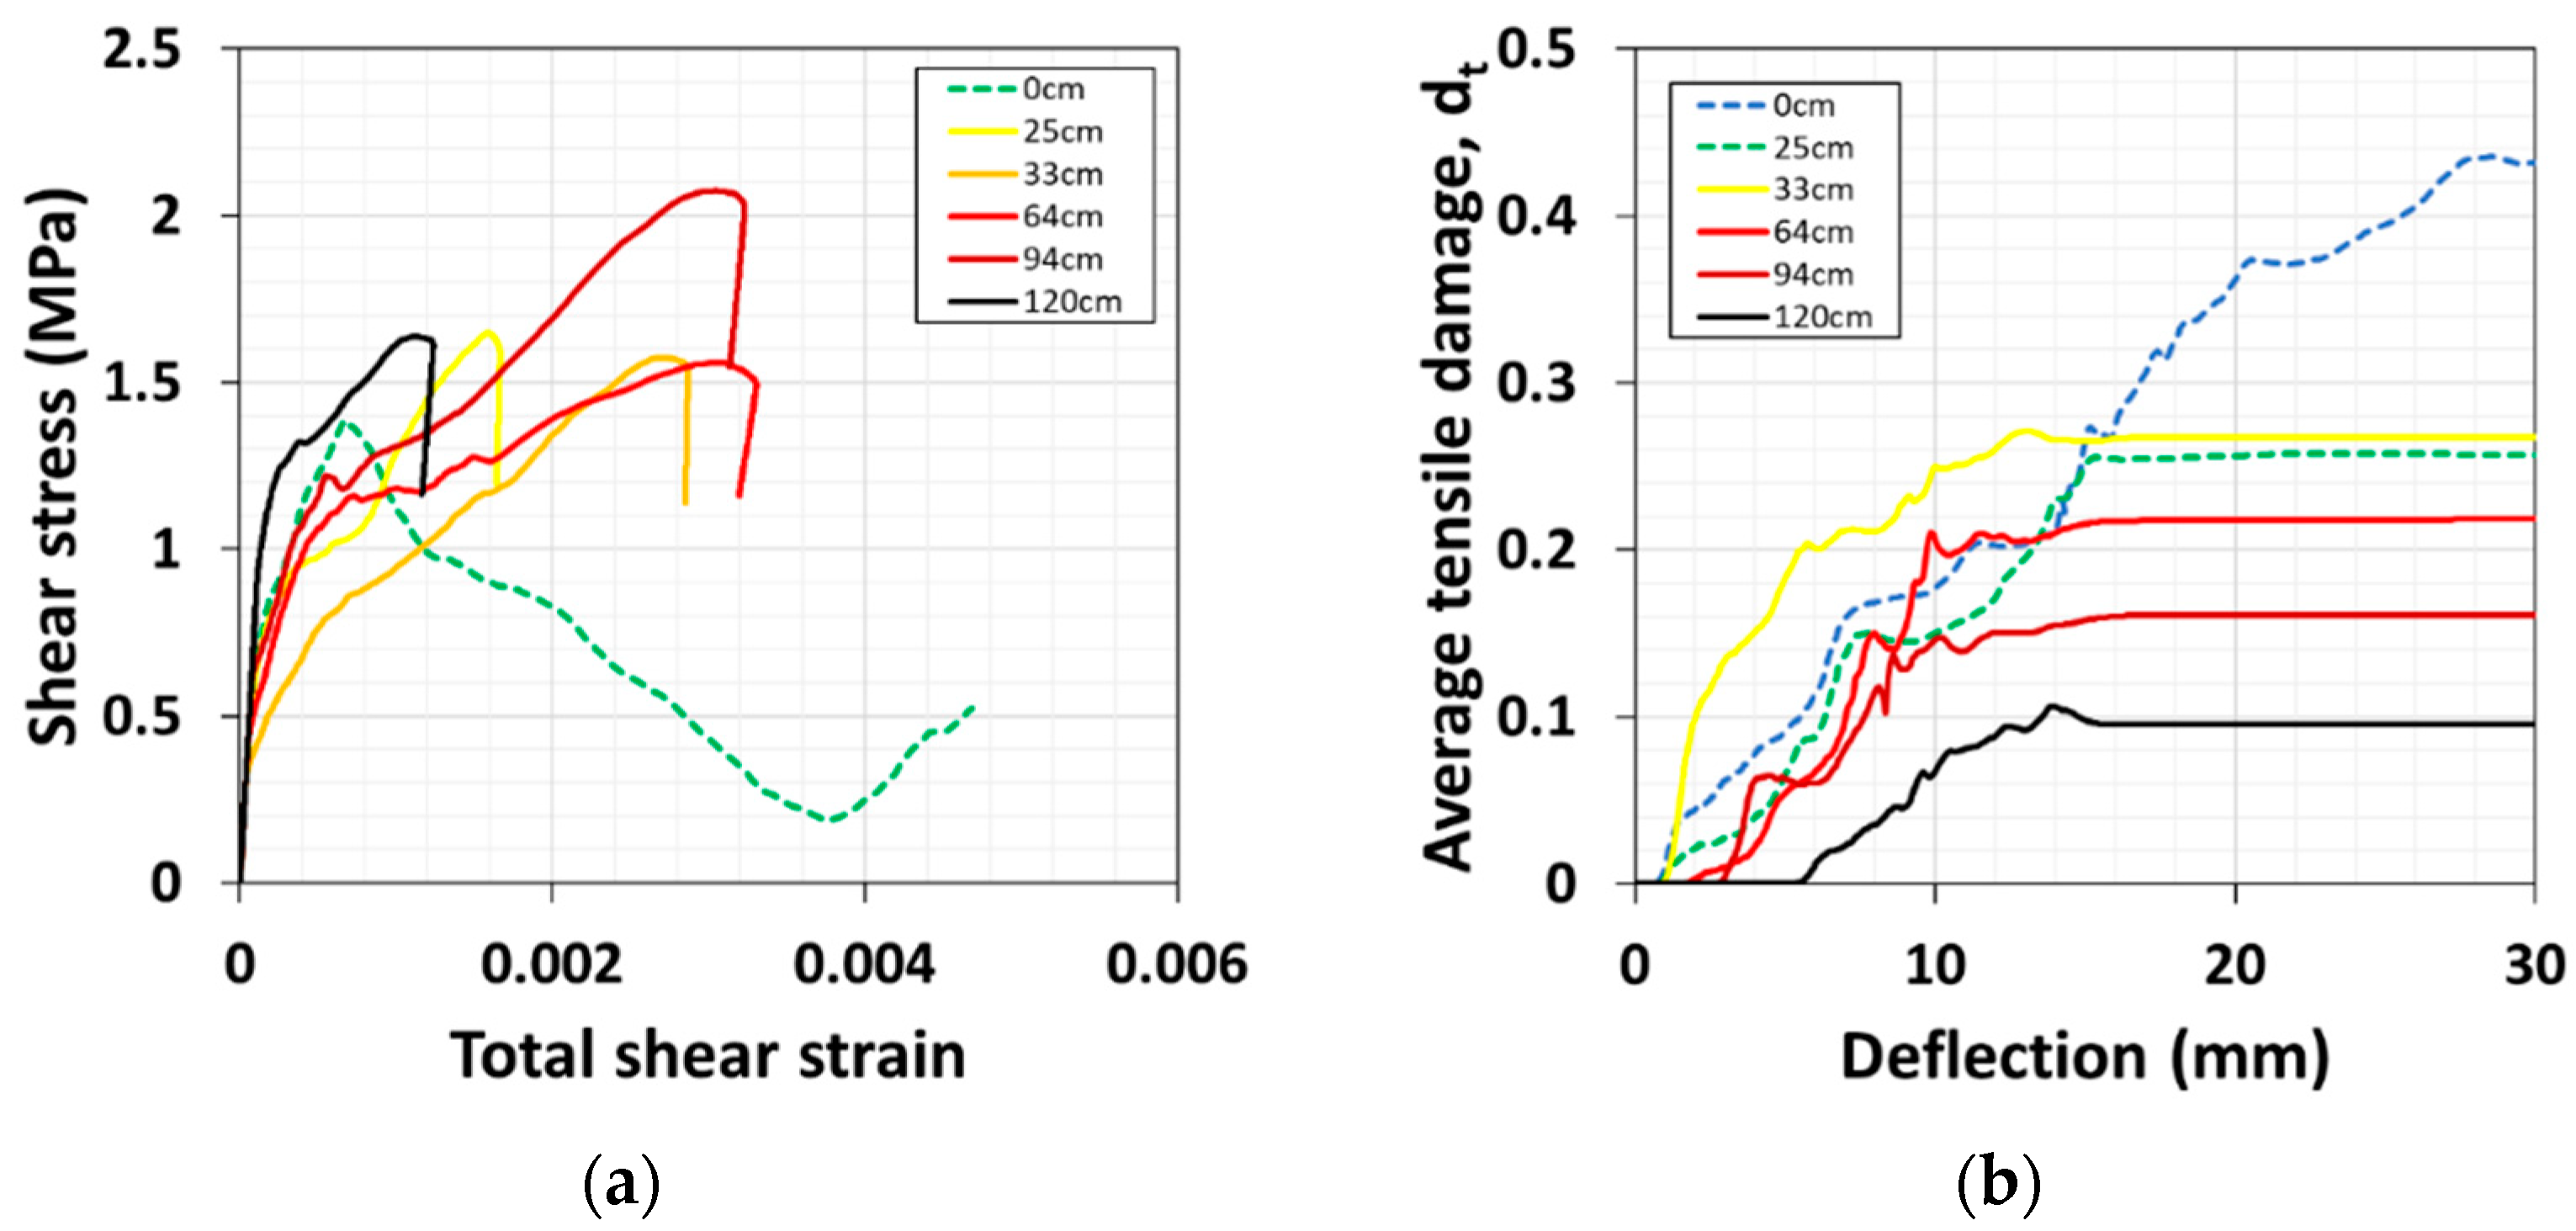
- In the case of Vector2/MCFT, which is based on strain, the progressive failure of web elements is well depicted in the biaxial strain relationship. Conversely, ABAQUS result shows better failure trace of web elements under their biaxial stress state in a stress-based Mohr circle. MCFT, which analyzes changes in macro-web elements based on average strain and average stress, can be interpreted as more suitable for SFRC structures than relatively local nodal or element-based analysis. While the ABAQUS result shows better force-displacement excursion curve up to the failure. In addition, the damaged plasticity model reproduces more realistic crack patterns.
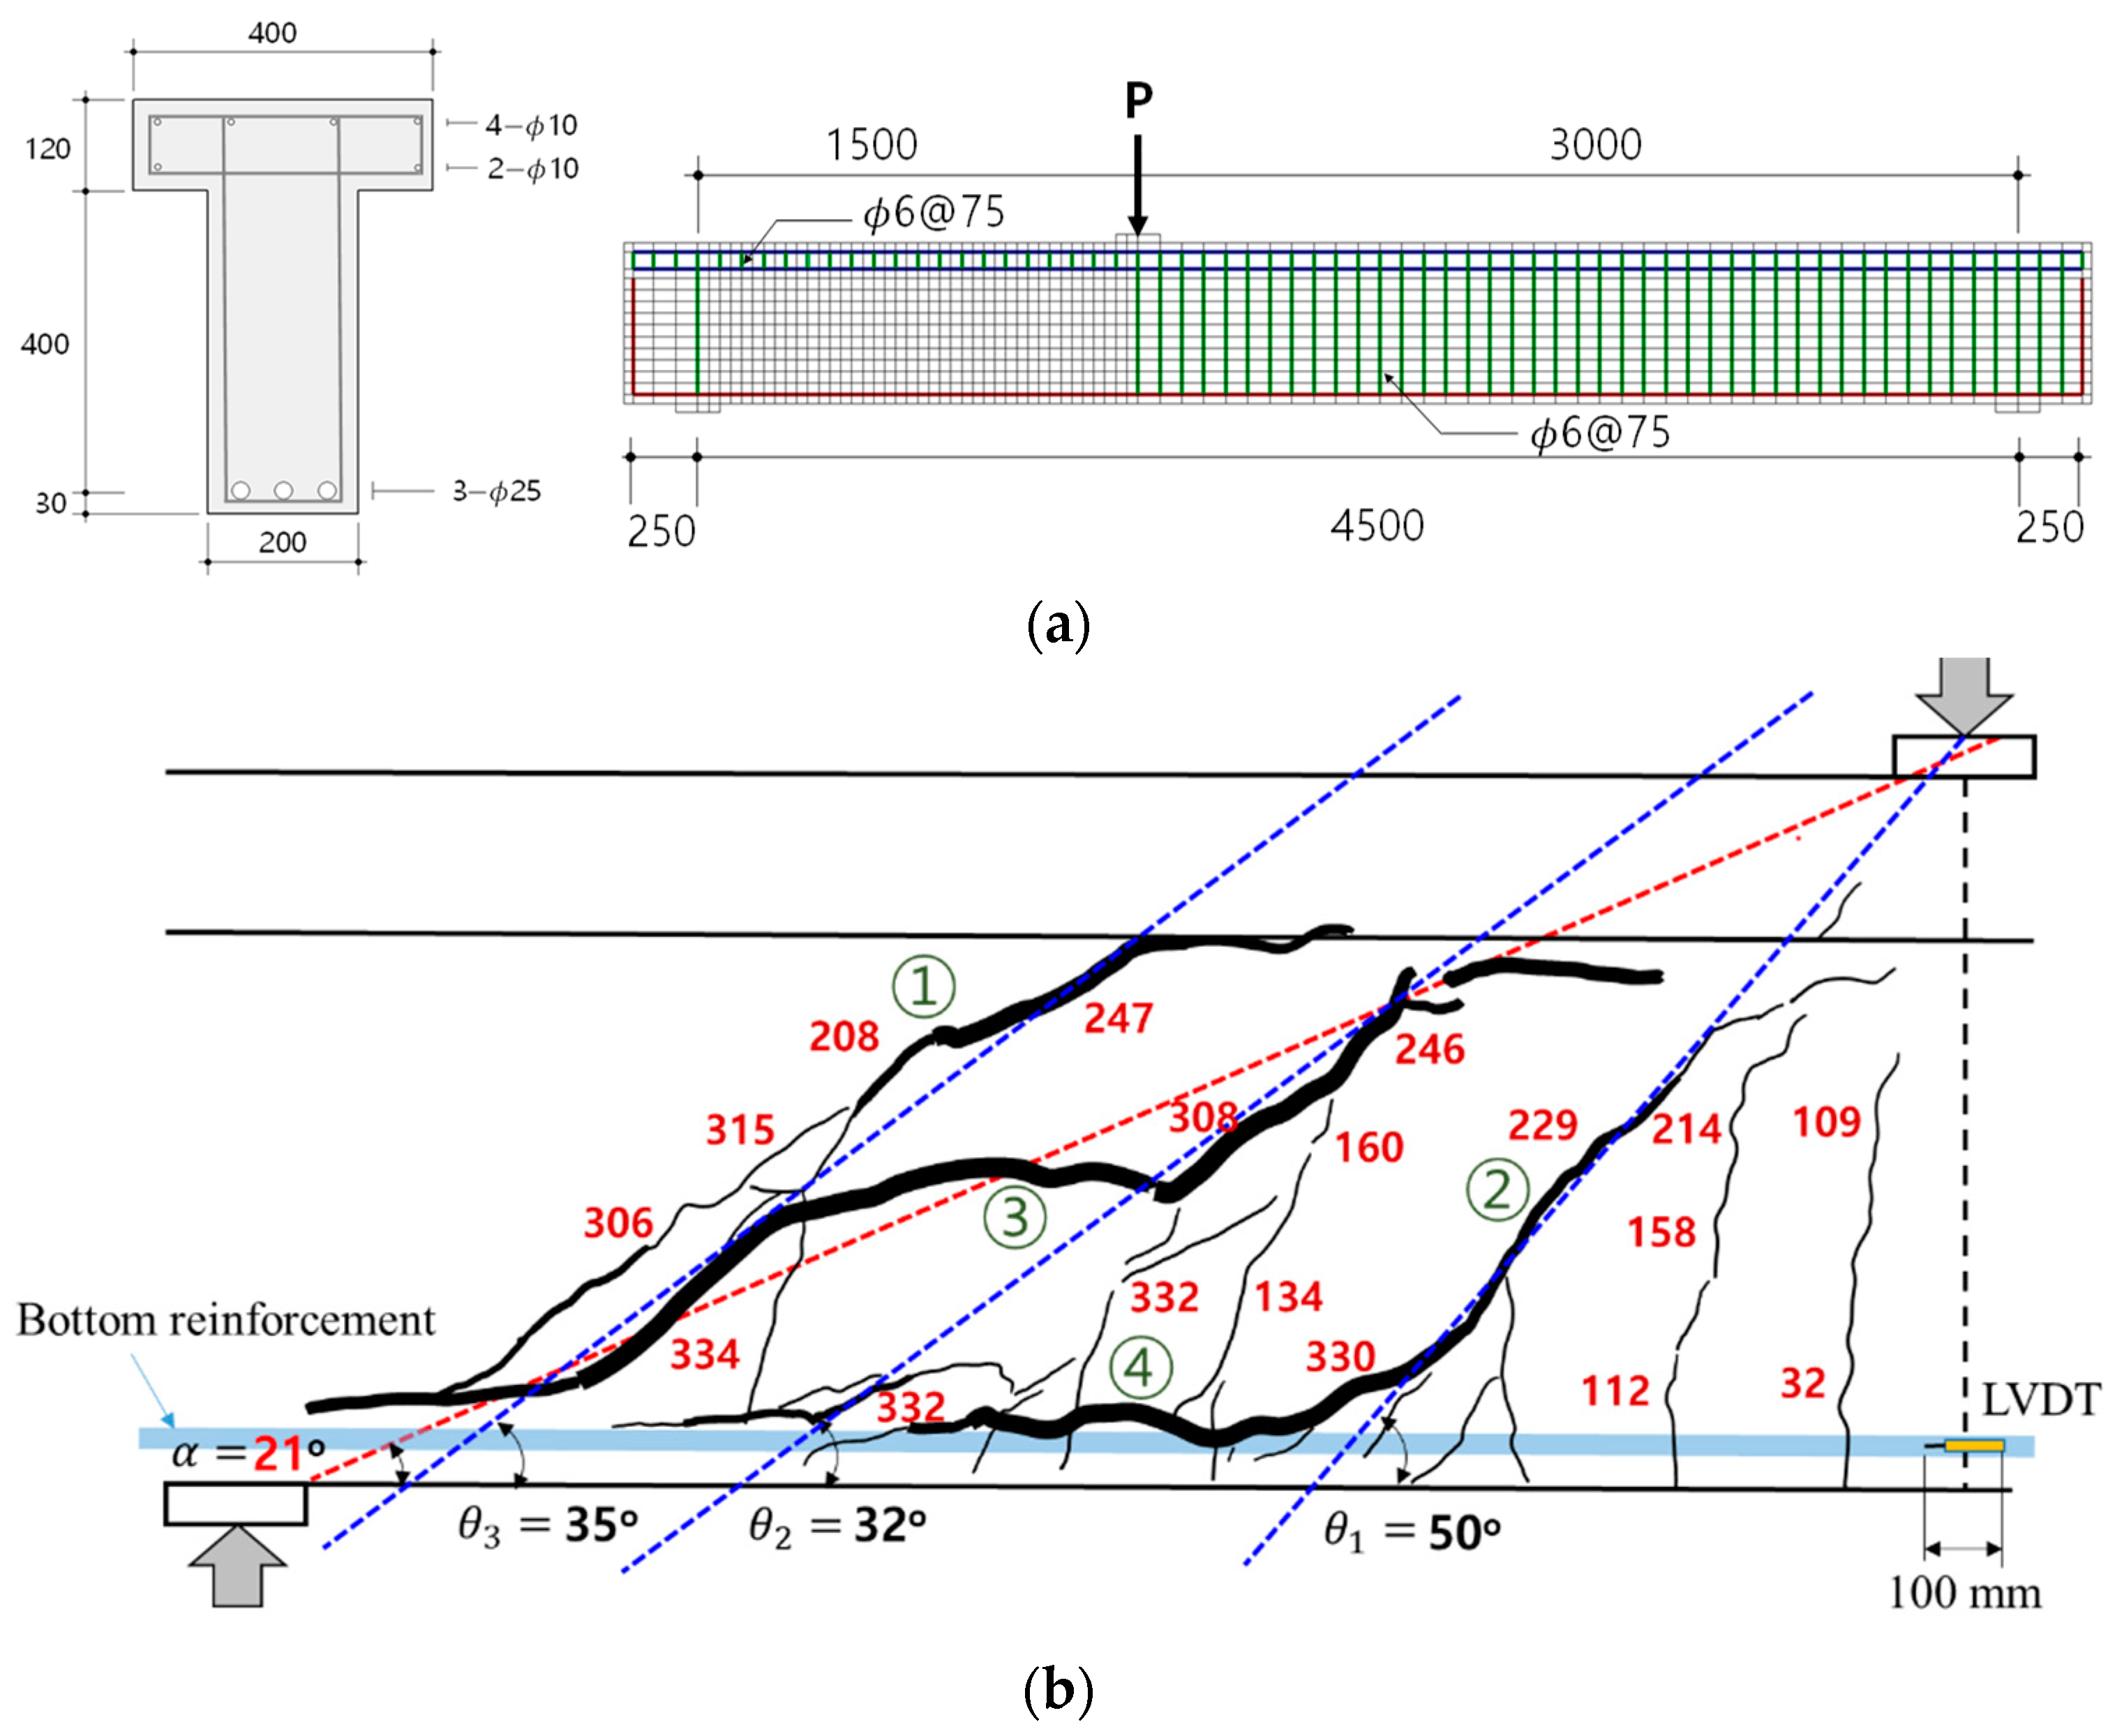
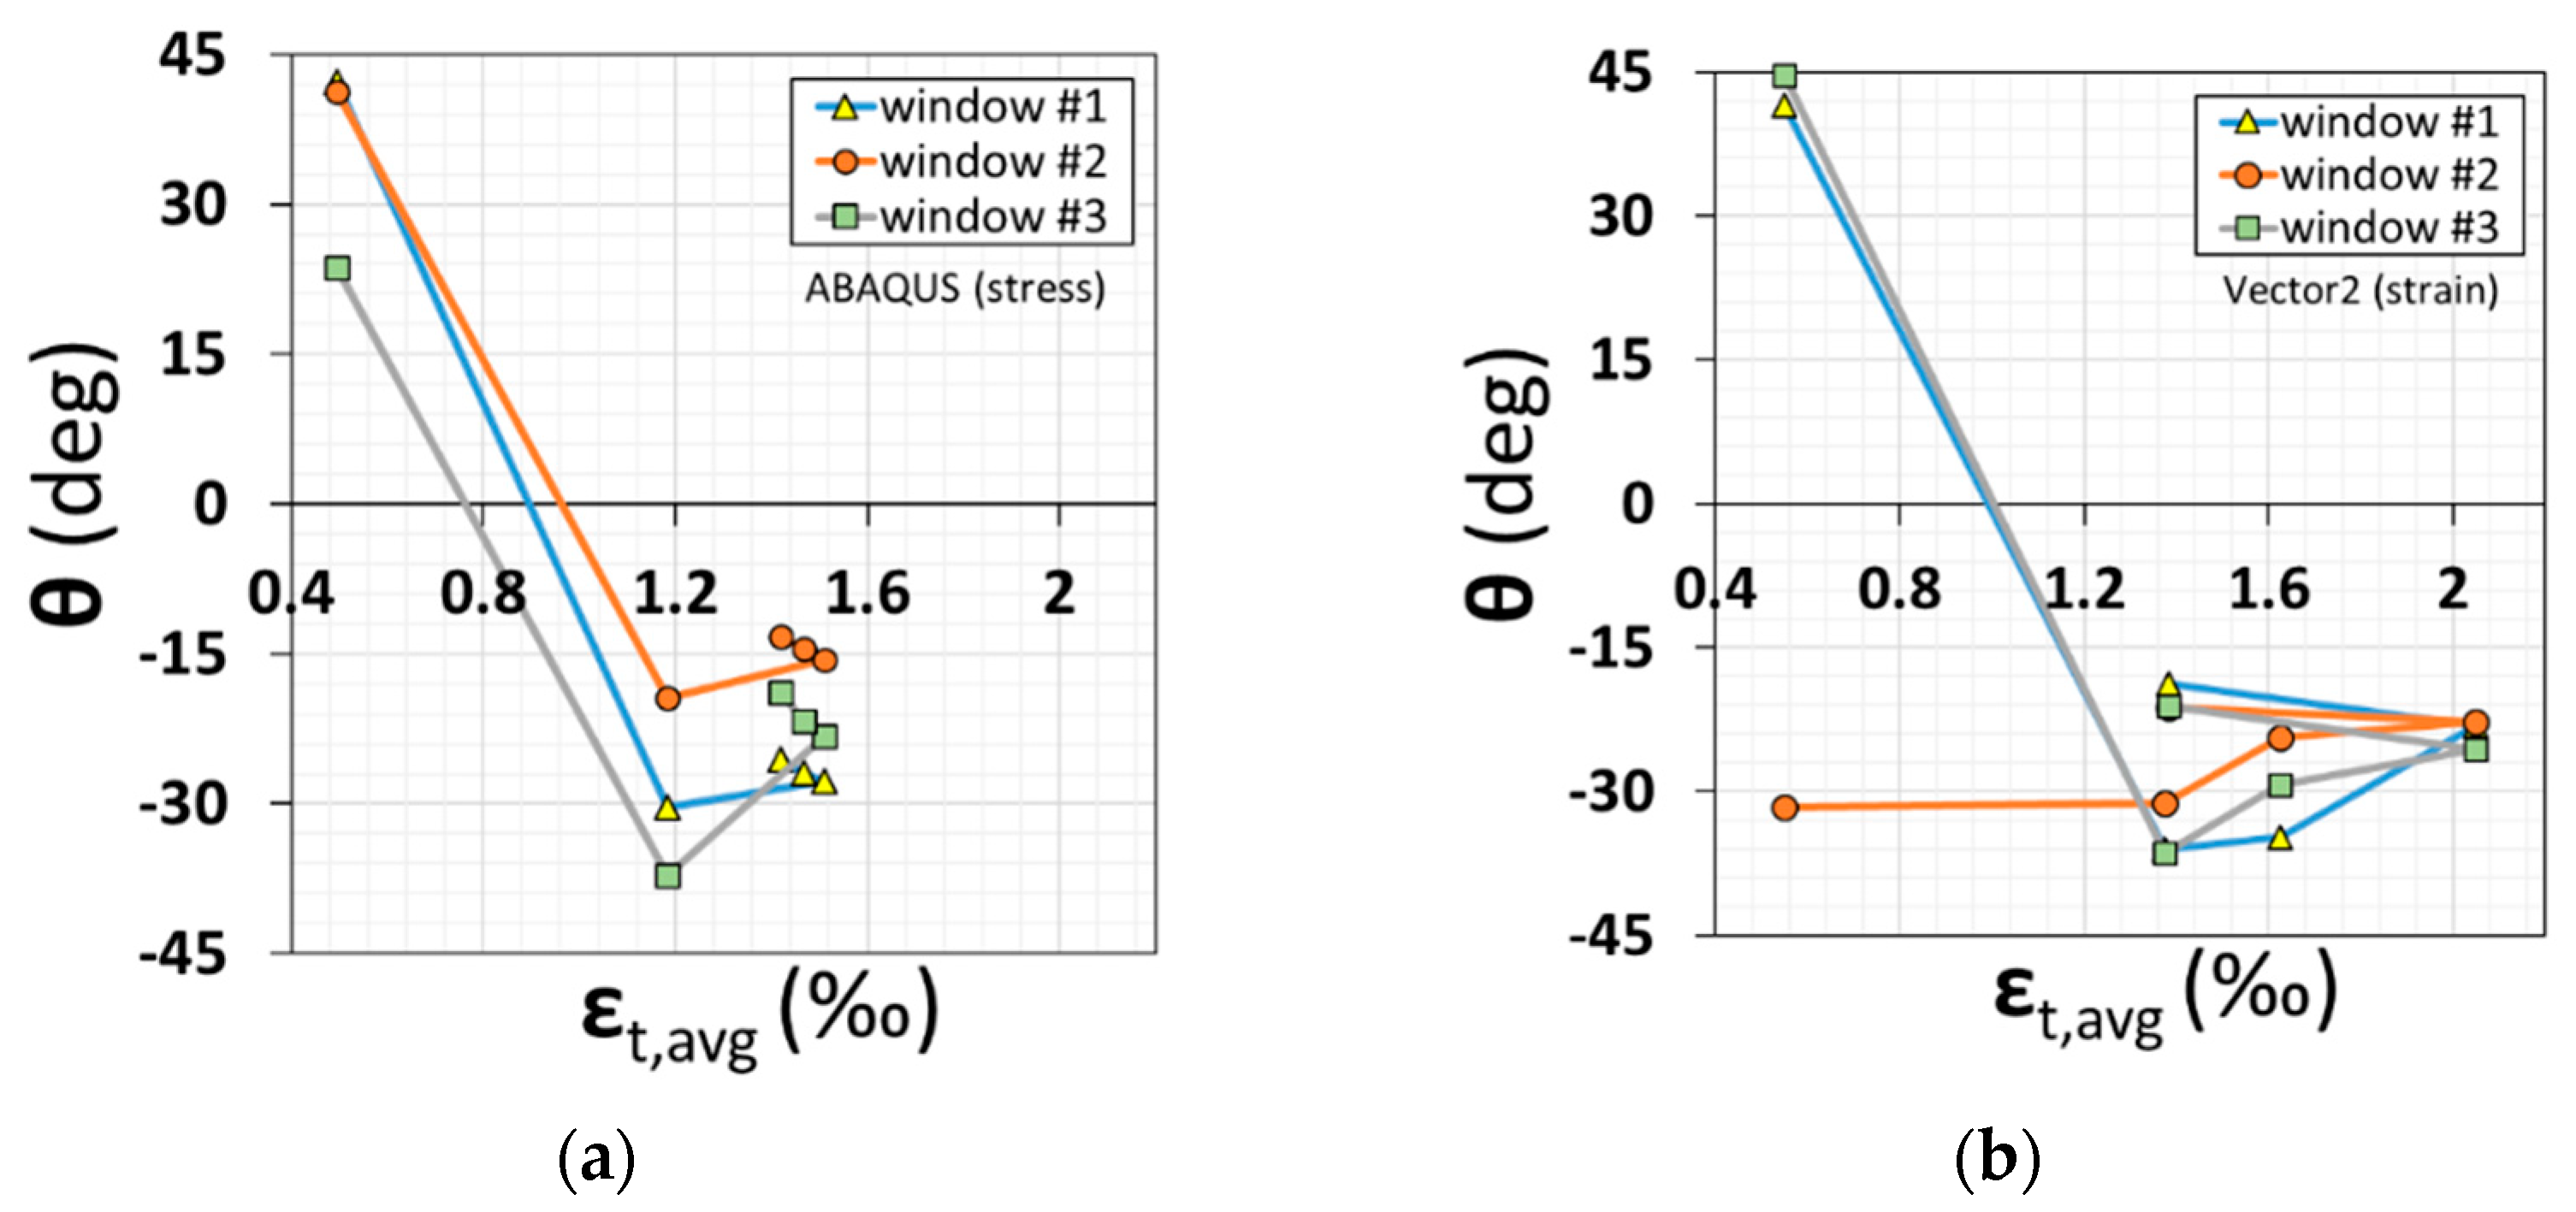
- The shear capacity yielded by the two-kinematic strut-tie model established by Mihaylov et al. was in good agreement with the experimental data. Because that model was originally developed for deep beams (a/d < 2.5), it estimates stiffer than that of the T-beam (a/d = 2.9). Since the T-beam was slender, the was approximately two-fold greater than the of the strut-tie model. Furthermore, the crack inclination angle 𝛼1 averaged 21°, which was less than the 35° of previous works (Mihaylov et al., 2013). The differences reflect the shear span variations between slender and deep beams.
Funding
Institutional Review Board Statement
Informed Consent Statement
Data Availability Statement
Acknowledgments
Conflicts of Interest
References
- Popovics, S. A Review of Stress -Strain Relationships for Concrete. ACI J. 1970, 67, 243–248. [Google Scholar]
- ACI-ASCE Task Committee 426. The shear strength of reinforced concrete members. Proc. ASCE 1973, 99, 1091–1187. [Google Scholar]
- ACI-ASCE Committee 445. Recent approaches to shear design of structural concrete. J. Struct. Eng. ASCE 1998, 124, 1357–1417. [Google Scholar]
- Vecchio, F.J.; Collins, M.P. The Modified Compression-Field Theory for Reinforced Concrete Elements Subjected to Shear. ACI Struct. J. 1986, 83, 219–231. [Google Scholar]
- Hsu, T.T.C.; Mo, Y.L. Unified Theory of Concrete Structures; John Wiley & Sons Ltd.: West Susex, UK, 2010. [Google Scholar]
- fib. MC2010: 5.6 Fibres/Fibre-Reinforced Concrete; CEB·FIP: Lausanne, Switzerland, 2010; pp. 220–231. [Google Scholar]
- Kim, W. Limit State Design for Concrete Structures (Written in Korean); Dongwha Tech. Pub.: Seoul, Korea, 2015; p. 692. [Google Scholar]
- Bentz, E.C.; Vecchio, F.J.; Collins, M.P. Simplified modified compression field theory for calculating shear strength of reinforced concrete elements. ACI Struct. J. 2006, 103, 614–624. [Google Scholar]
- Slater, E.; Moni, M.; Alam, M.S. Predicting the shear strength of steel fiber reinforced concrete beams. Constr. Build. Mater. 2012, 26, 423–436. [Google Scholar] [CrossRef]
- Zhang, F.; Ding, Y.; Xu, J.; Zhang, Y.; Zhu, W.; Shi, Y. Shear strength prediction for steel fiber reinforced concrete beams without stirrups. Eng. Str. 2016, 127, 101–116. [Google Scholar] [CrossRef]
- Cheng, K.; Zhang, J.; Dai, Q.L.; Wang, P.Y.; Zhang, J. Shear Performance of Steel Fiber Reinforced Concrete Beams Without Stirrups: Experimental Investigation. Int. J. Civ. Eng. 2020, 18, 865–881. [Google Scholar]
- Yuan, T.F.; Yoo, D.Y.; Yang, J.M.; Yoon, Y.-S. Shear Capacity Contribution of Steel Fiber Reinforced High-Strength Concrete Compared with and without Stirrup. Int. J. Concr. Struct. Mater. 2020, 14, 1–15. [Google Scholar] [CrossRef]
- Barros, J.A.O.; Figueiras, J.A. Flexural behavior of SFRC: Testing and modeling. ASCE J. Mater. Civ. Eng. 1999, 11, 331–339. [Google Scholar] [CrossRef] [Green Version]
- Kwak, Y.-K.; Eberhard, M.O.; Kim, W.-S.; Kim, J. Shear strength of steel fiber-reinforced concrete beams without stirrups. ACI Structural J. 2002, 99, 530–538. [Google Scholar]
- Abad, B.F.; Lantsoght, E.; Yang, Y. Shear capacity of steel fibre-reinforced concrete beams. In CONCRETE Innovations in Materials, Design and Structures: Proceedings of the fib Symposium 2019 held in Krakow, Poland 27–29 May 2019; Derkowski, W., Krajewski, P., Gwozdziewicz, P., Pantak, M., Hojdys, L., Eds.; International Federation for Structural Concrete: Krakow, Poland, 2019; pp. 1710–1717. [Google Scholar]
- Mihaylov, B.I.; Bentz, E.C.; Collins, M.P. Two-parameter kinematic theory for shear behavior of deep beams. Int. J. Cem. Compos. Lightweight Concr. 2010, 6, 263–271. [Google Scholar]
- Mihaylov, B.I.; Bentz, E.C.; Collins, M.P. Two-parameter kinematic theory for shear behavior of deep beams. ACI Structural J. 2013, 110, 447–455. [Google Scholar]
- Calvi, P.M. A Theory for the Shear Behaviour of Cracks Providing a Basis for the Assessment of Cracked Reinforced Concrete Structures. Ph.D. Thesis, University of Toronto, Toronto, ON, Canada, 2015; p. 367. [Google Scholar]
- Lobet, R. Modelling of the Shear Behaviour of Coupling Beams with Fibre-Reinforced Concrete. Master Thesis, University of Liège, Liège, Belgium, 2017; p. 110. [Google Scholar]
- Tvrznikova, K. Two-Parameter Kinematic Approach for the Shear Behavior of Deep Beams Made of Fiber-Reinforced Concrete. Master’s Thesis, University of Liège, Liège, Belgium, 2017; p. 100. [Google Scholar]
- Mihaylov, B.I. Five-spring model for complete shear behavior of deep beams. Struct. Concr. 2015, 16, 71–83. [Google Scholar] [CrossRef]
- Mihaylov, B.I.; Hunt, B.; Bentz, E.C.; Collins, M.P. Three-parameter kinematic theory for shear behavior of continuous deep beams. ACI Structural J. 2015, 112, 47–57. [Google Scholar] [CrossRef]
- Mihaylov, B.I.; Hannewald, P.; Beyer, K. Three-parameter kinematic theory for shear-dominated reinforced concrete walls. ASCE J. Struct. Eng. 2016, 142, 1–14. [Google Scholar] [CrossRef] [Green Version]
- Mansur, M.A.; Ong, K.C.G. Behavior of Reinforced Fiber Concrete Deep Beams in Shear. ACI J. 1991, 88, 98–105. [Google Scholar]
- Lee, S.-C.; Cho, J.-Y.; Vecchio, F.J. Simplified Diverse Embedment Model for Steel Fiber-Reinforced Concrete in Tension. ACI Structural J. 2013, 110, 403–412. [Google Scholar]
- Lee, S.-C.; Cho, J.-Y.; Vecchio, F.J. Tension-stiffening model for steel fiber-reinforced concrete containing conventional reinforcement. ACI Structural J. 2013, 110, 639–648. [Google Scholar]
- Barros, J.; Sanz, B.; Kabele, P.; Yu, P.K.; Meschke, G.; Planas, J.; Cunha, V.; Caggiano, A.; Ozyurt, N.; Gouveia, V.; et al. Blind Competition on the Numerical Simulation of Steel-Fiber-Reinforced Concrete Beams failing in Shear. Struct. Concrete 2021, 22, 939–967. [Google Scholar] [CrossRef]
- Smith, M. ABAQUS/Standard User’s Manual; Dassault Systèmes Simulia Corp.: Providence, RI, USA, 2020. [Google Scholar]
- Lubliner, J.; Oliver, J.; Oller, S.; Onate, E. A plastic-damage model for concrete. Int. J. Soilds Struct. 1989, 25, 299–326. [Google Scholar] [CrossRef]
- Lee, J.; Fenves, G.L. A plastic-damage model for cyclic loading of concrete structures. J. Eng. Mech. ASCE 1998, 124, 892–900. [Google Scholar] [CrossRef]
- Hashim, D.T.; Hejazi, F.; Lei, V.Y. Simplified Constitutive and Damage Plasticity Models for UHPFRC with Different Types of Fiber. Int. J. Concr. Struct. Mater. 2020, 14, 1–21. [Google Scholar] [CrossRef]
- Minh, H.-L.; Khatir, S.; Wahab, M.A.; Cuong-Le, T. A concrete damage plasticity model for predicting the effects of compressive high-strength concrete under static and dynamic loads. J. Build. Eng. 2021, 44, 1–13. [Google Scholar]
- Ombres, L.; Verre, S. Shear strengthening of reinforced concrete beams with SRG (Steel Reinforced Grout) composites: Experimental investigation and modelling. J. Build. Eng. 2021, 42, 1–17. [Google Scholar] [CrossRef]
- Bai, W.; Lu, X.; Guan, J.; Huang, S.; Yuan, C.; Xu, C. Stress–Strain Behavior of FRC in Uniaxial Tension Based on Mesoscopic Damage Model. Crystals 2021, 11, 689. [Google Scholar] [CrossRef]
- Wong, P.S.; Vecchio, F.J.; Trommels, H. Vector2 & FormWorks User’s Manual, 2nd ed.; Vectoranalysis.com: Toronto, ON, Canada, 2013; p. 347. [Google Scholar]
- Eligehausen, R.; Popov, E.; Bertero, V. Local Bond Stress-Slip Relationship of Deformed Bars under Generalized Excitations; Report No. UCB/EERC-83/23; Earthquake Engineering Center, University of California: Berkeley, CA, USA, 1983; pp. 69–80. [Google Scholar]
- ElMohandes, F.; Vecchio, F.J. Vector3 User’s Manual, 2nd ed.; Vectoranalysis: Toronto, ON, Canada, 2013; p. 153. [Google Scholar]
- Li, B.; Maekawa, K. Contact density model for cracks in concrete. In Proceedings of the IABSE Colloquium DELFT 1987: Computational Mechanics of Concrete Structures—Advances and Application, Delft, The Netherlands, 26–28 August 1987; Volume 54, pp. 51–62. [Google Scholar]
- Voo, J.Y.L.; Foster, S.J. Variable Engagement Model for Fiber-Reinforced Concrete in Tension; Uniciv Report No. R-420; University of New South Wales: Sydney, Australia, 2003; p. 86. [Google Scholar]
- ATENA, Program document ATENA 3D Tutorial & Manual; Červenka Consulting: Prague, Czech Republic, 2013; p. 120.


Publisher’s Note: MDPI stays neutral with regard to jurisdictional claims in published maps and institutional affiliations. |
© 2022 by the author. Licensee MDPI, Basel, Switzerland. This article is an open access article distributed under the terms and conditions of the Creative Commons Attribution (CC BY) license (https://creativecommons.org/licenses/by/4.0/).
Share and Cite
Rhee, I. Failure Analysis of Steel Fiber-Reinforced Concrete T-Beams without Shear Stirrups. Appl. Sci. 2022, 12, 411. https://doi.org/10.3390/app12010411
Rhee I. Failure Analysis of Steel Fiber-Reinforced Concrete T-Beams without Shear Stirrups. Applied Sciences. 2022; 12(1):411. https://doi.org/10.3390/app12010411
Chicago/Turabian StyleRhee, Inkyu. 2022. "Failure Analysis of Steel Fiber-Reinforced Concrete T-Beams without Shear Stirrups" Applied Sciences 12, no. 1: 411. https://doi.org/10.3390/app12010411
APA StyleRhee, I. (2022). Failure Analysis of Steel Fiber-Reinforced Concrete T-Beams without Shear Stirrups. Applied Sciences, 12(1), 411. https://doi.org/10.3390/app12010411