
Air Cleaning Performance of Two Species of Potted Plants and Different Substrates

 , , and
Abstract
:1. Introduction
1.1. Sources of Formaldehyde
1.2. Health Effects of Formaldehyde
1.3. Formaldehyde Guidelines and Regulations
1.4. Effects of Plants on Formaldehyde Removal
2. Materials and Methods
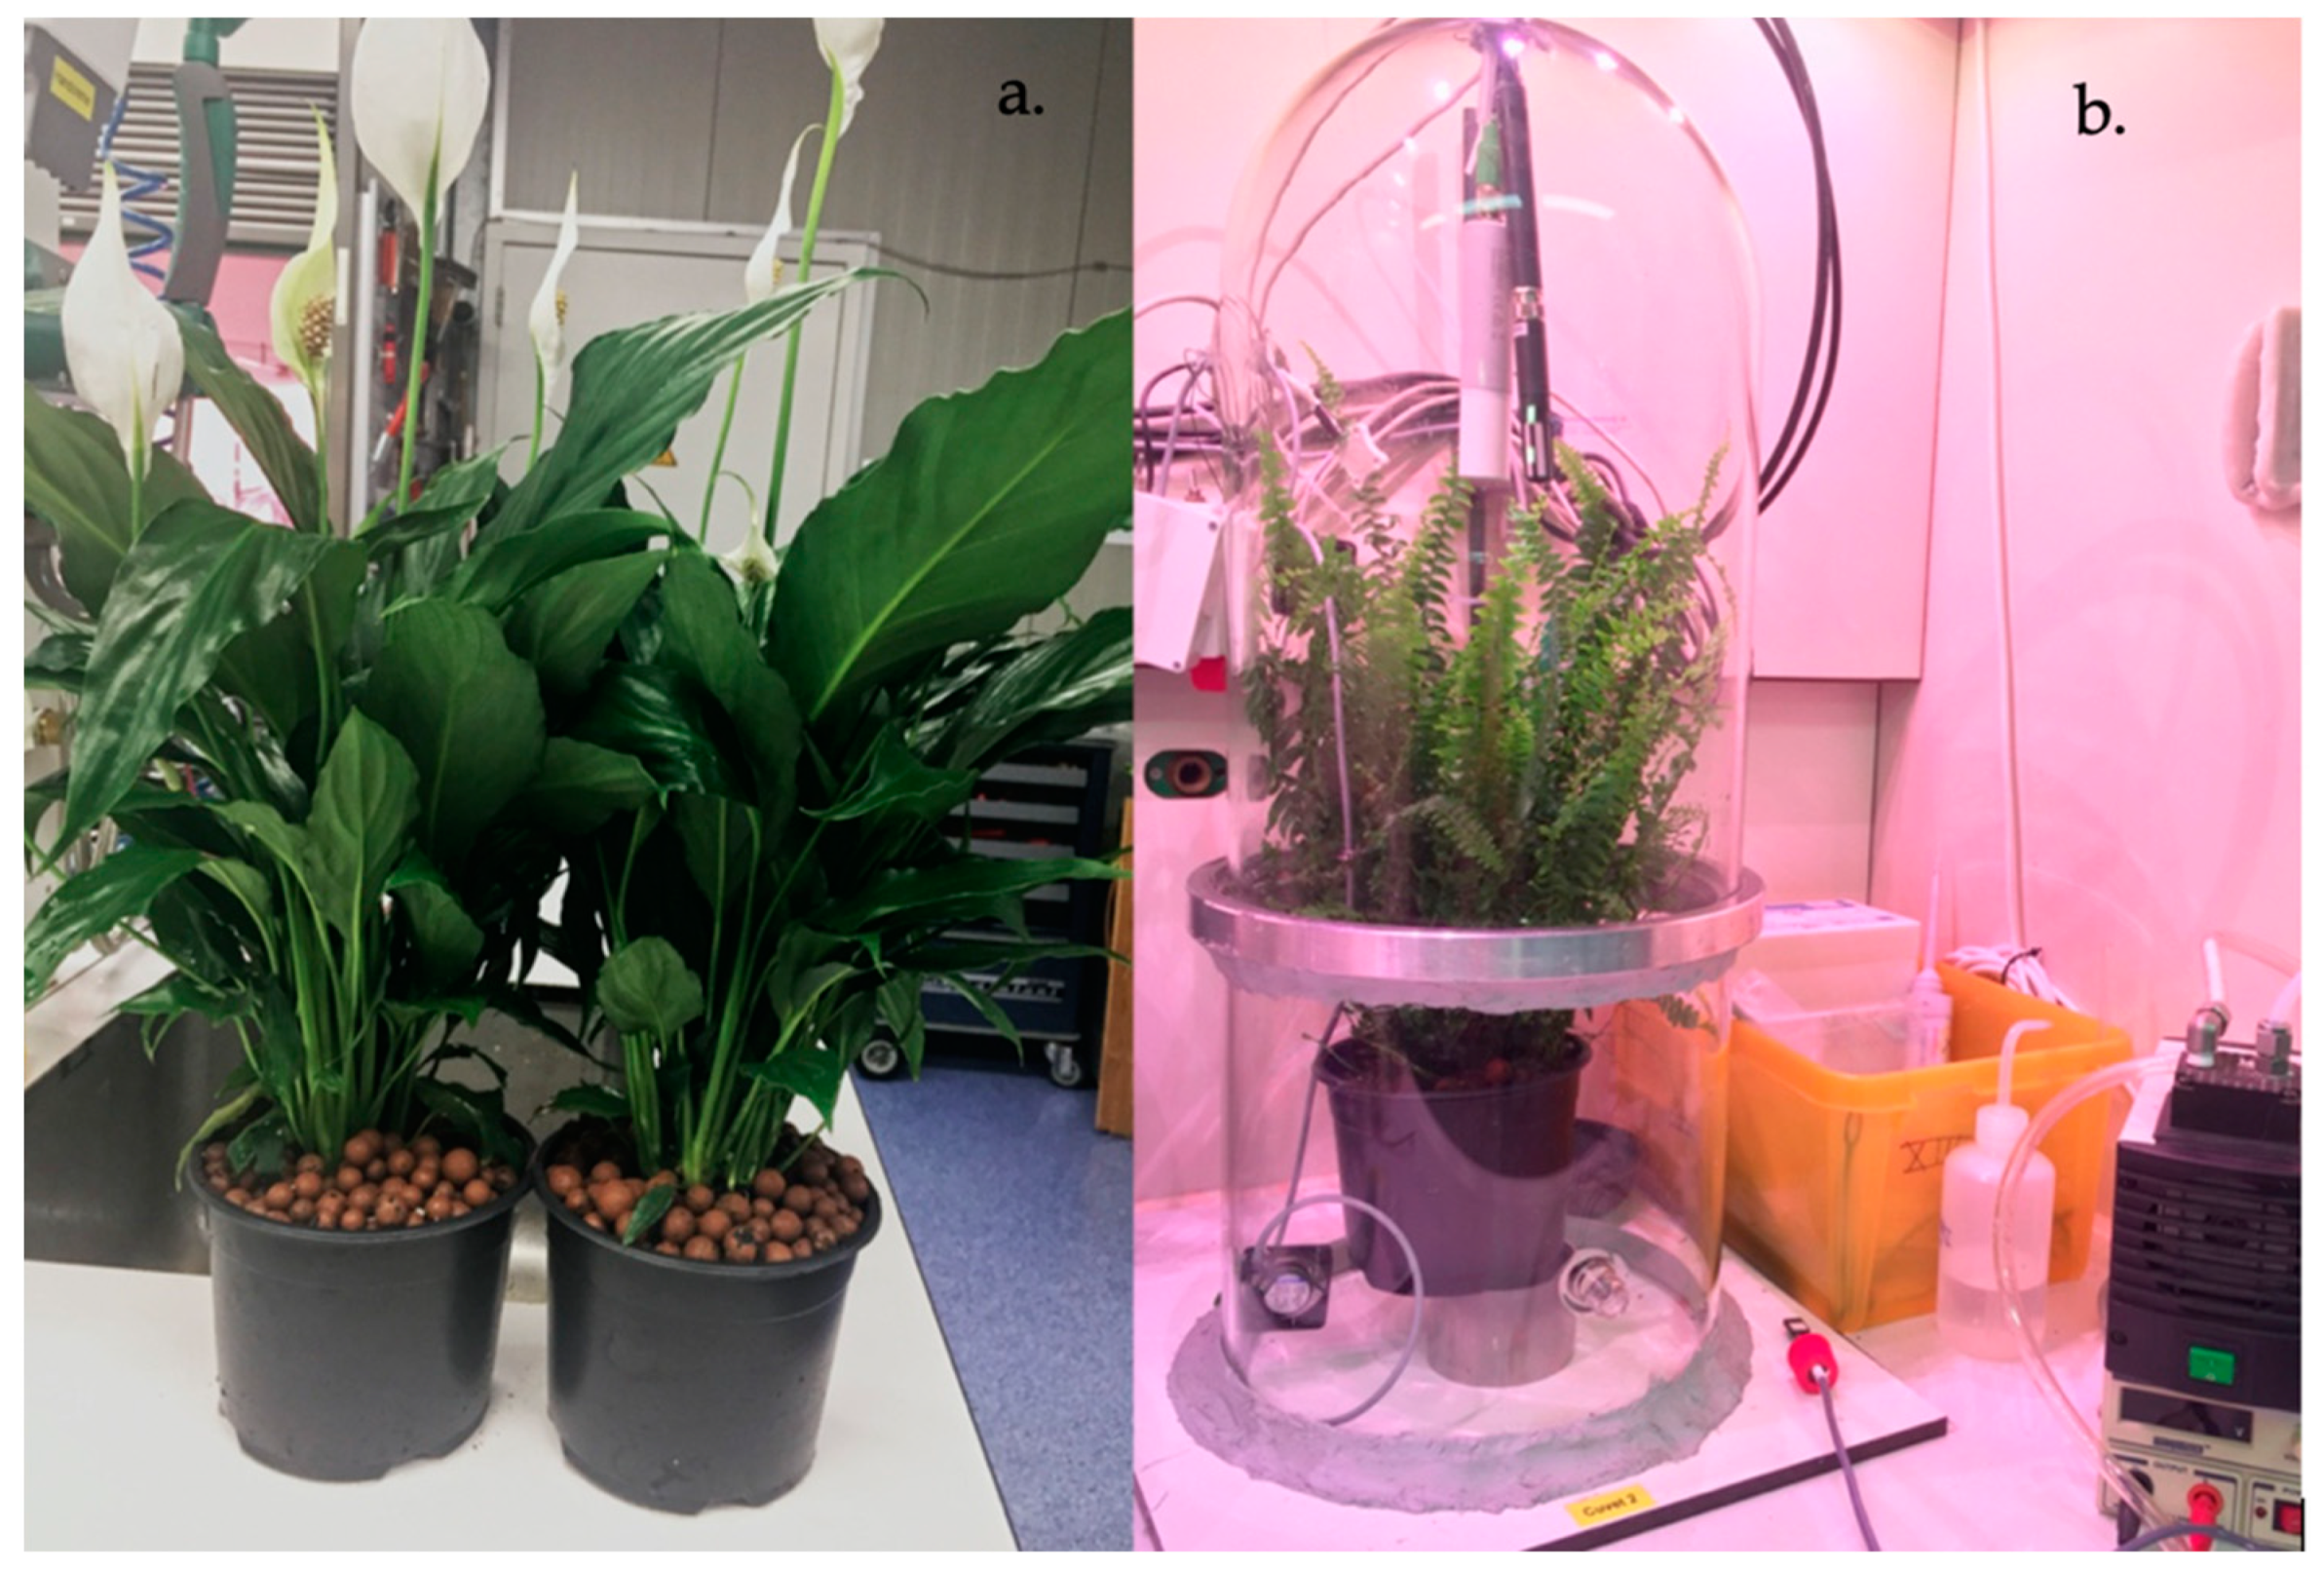
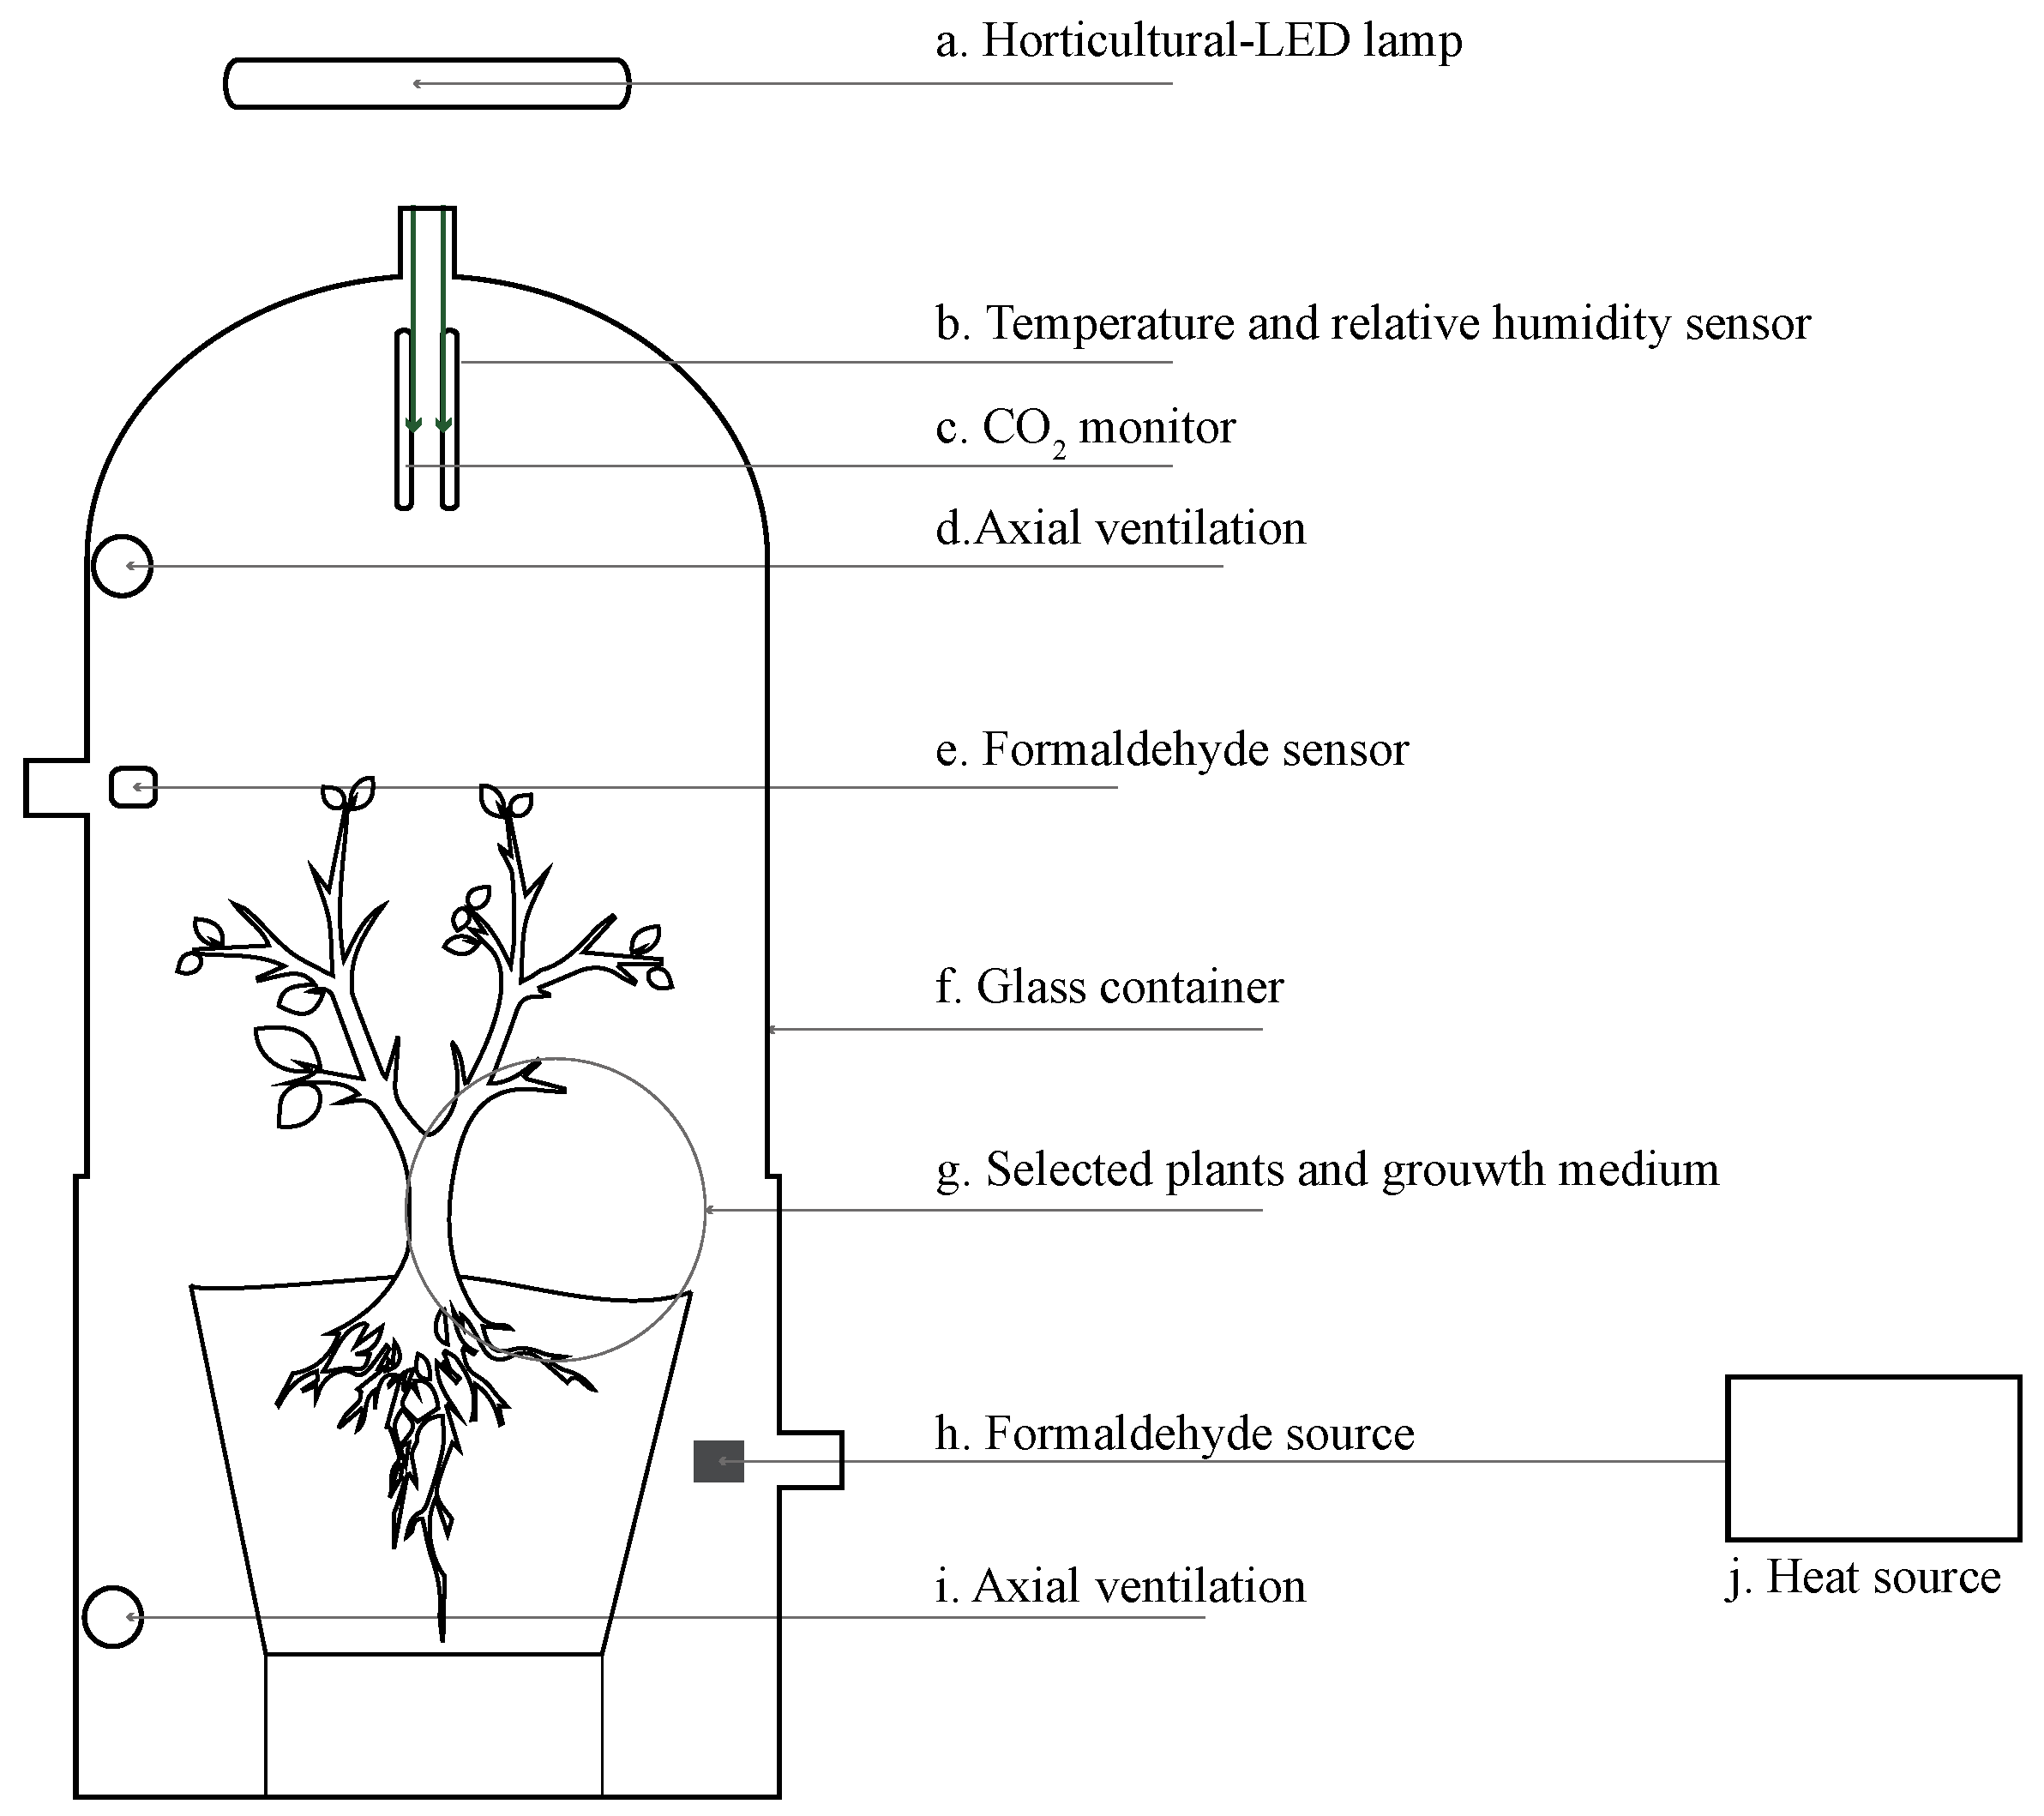
2.1. Experimental Setup
2.2. Formaldehyde Source
- 10 μL formaldehyde + 90 μL demi-water = 100 μL (final mixture).
- 10 μL of the final mixture generated 300 ppb of formaldehyde, within the chamber.
2.3. Selection and Preparation of the Substrates
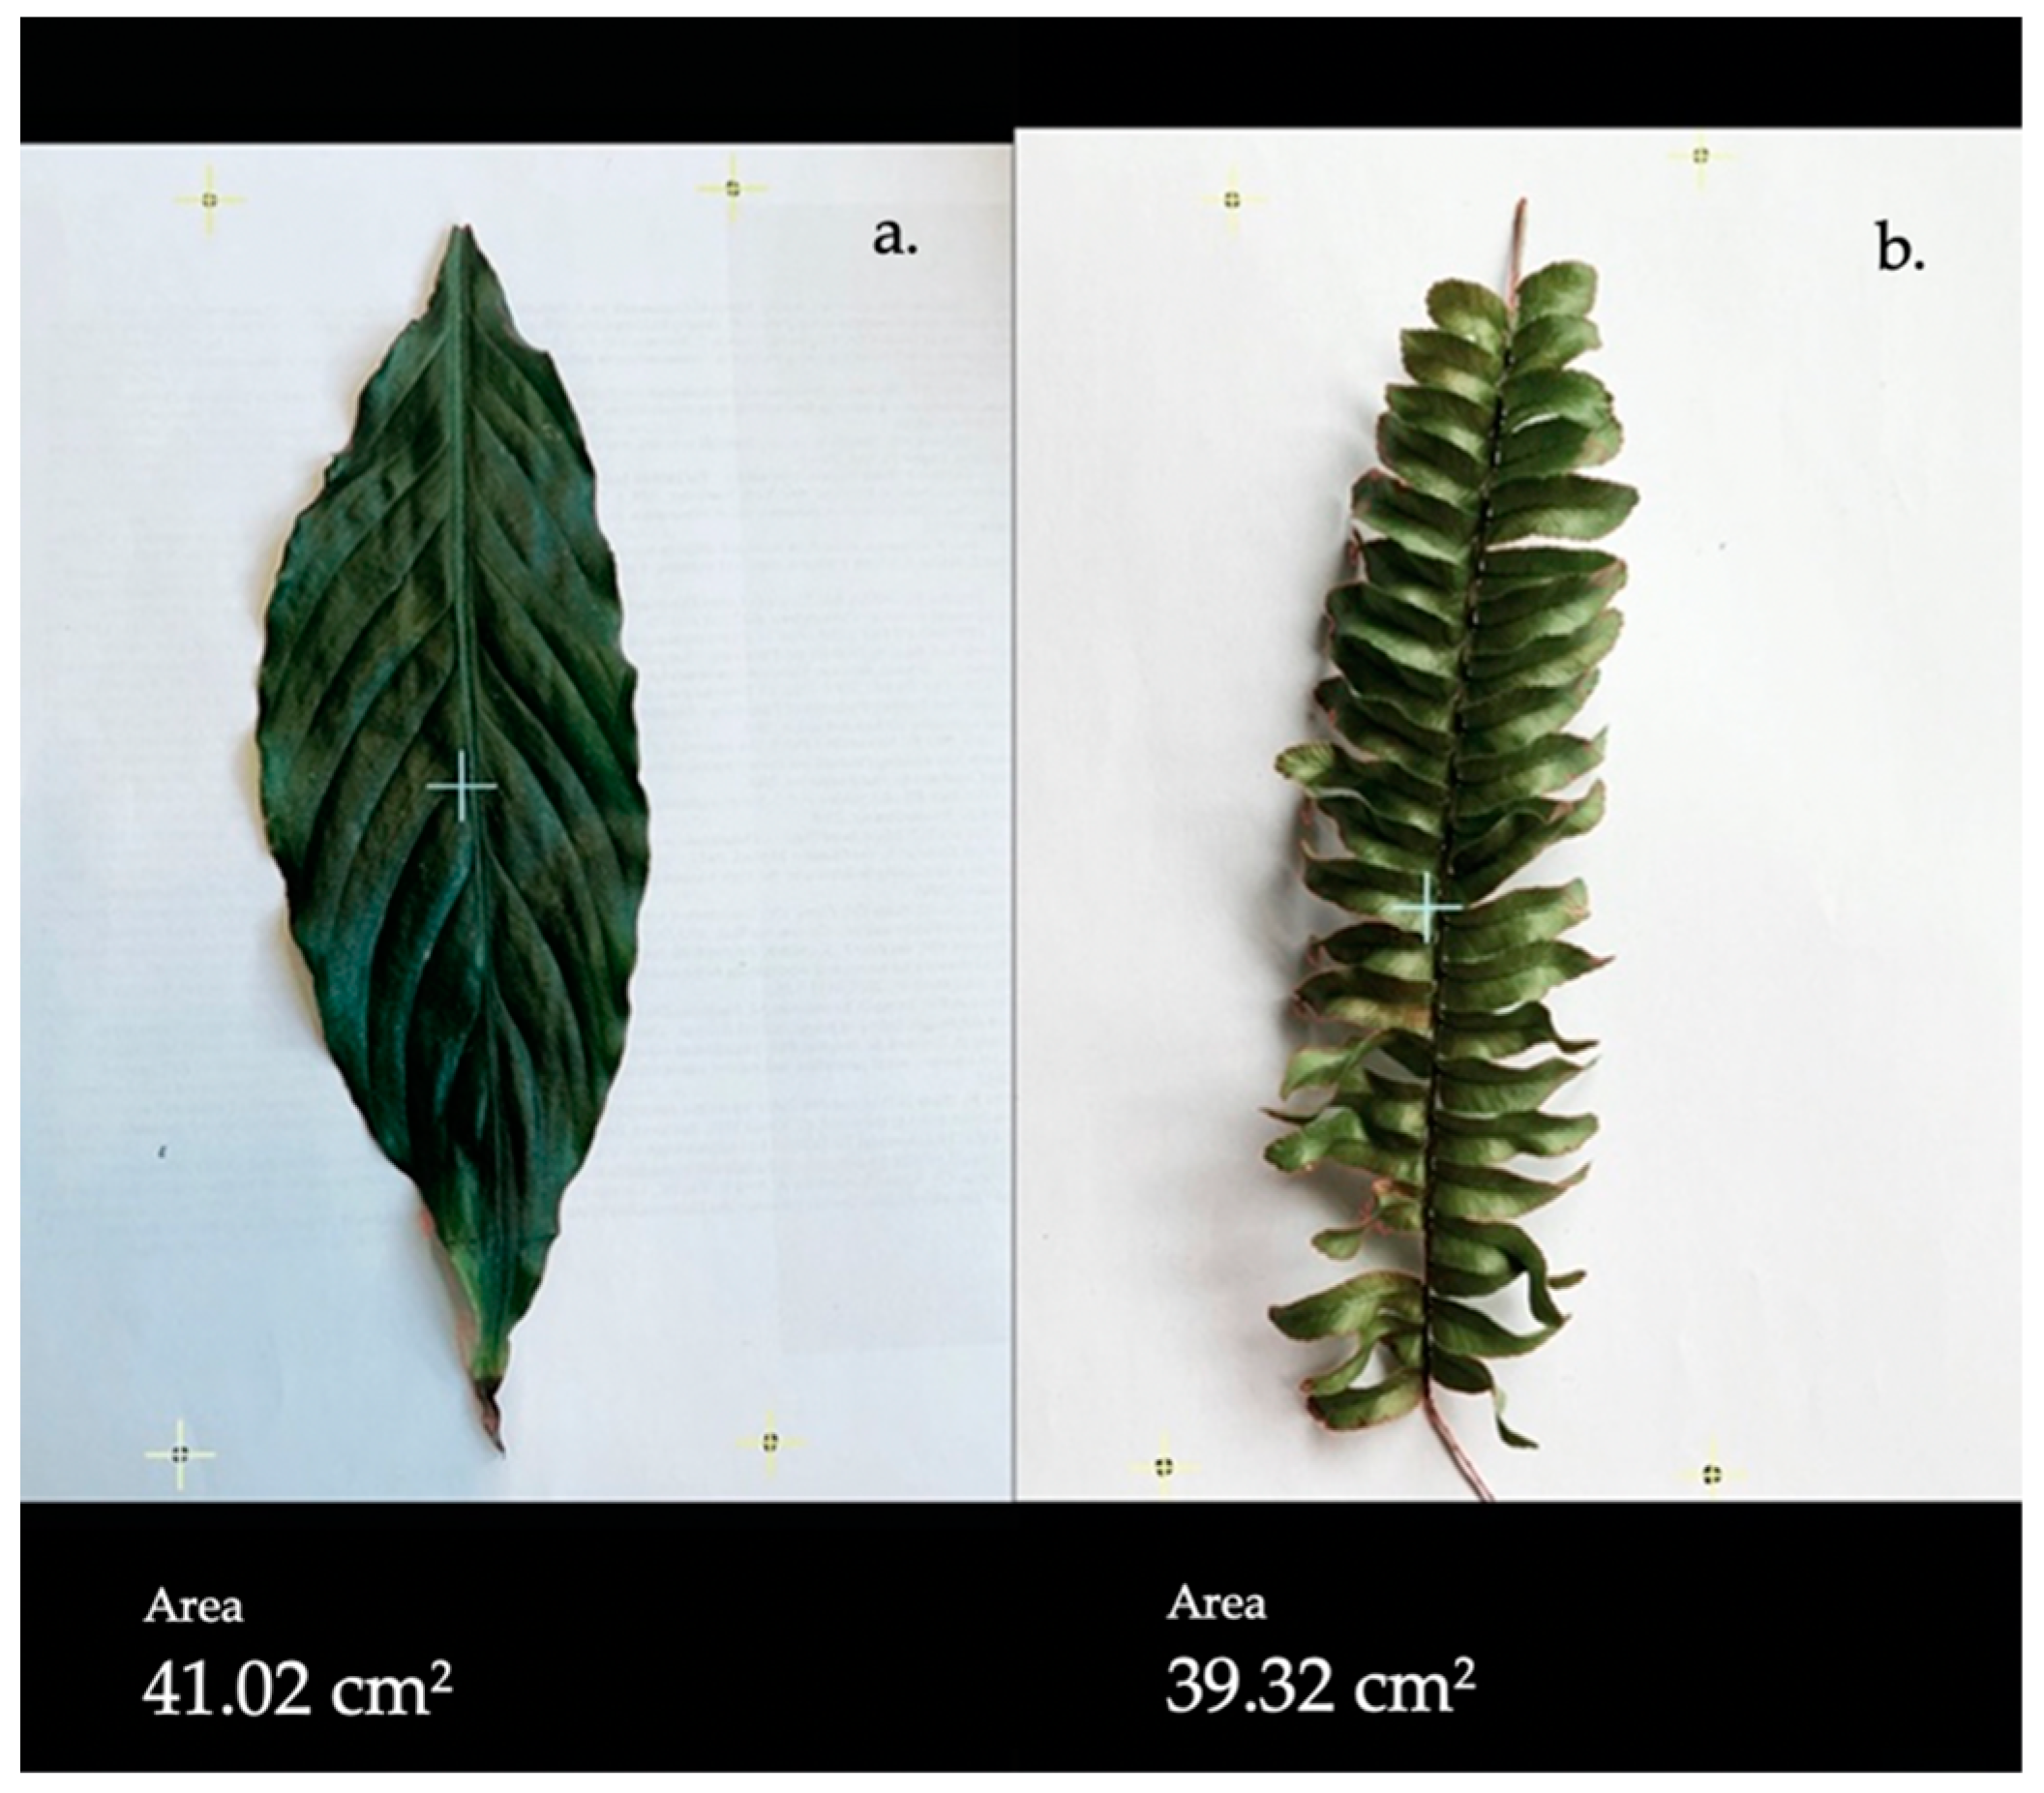
2.4. Selection and Preparation of the Plant Samples
2.5. Procedure
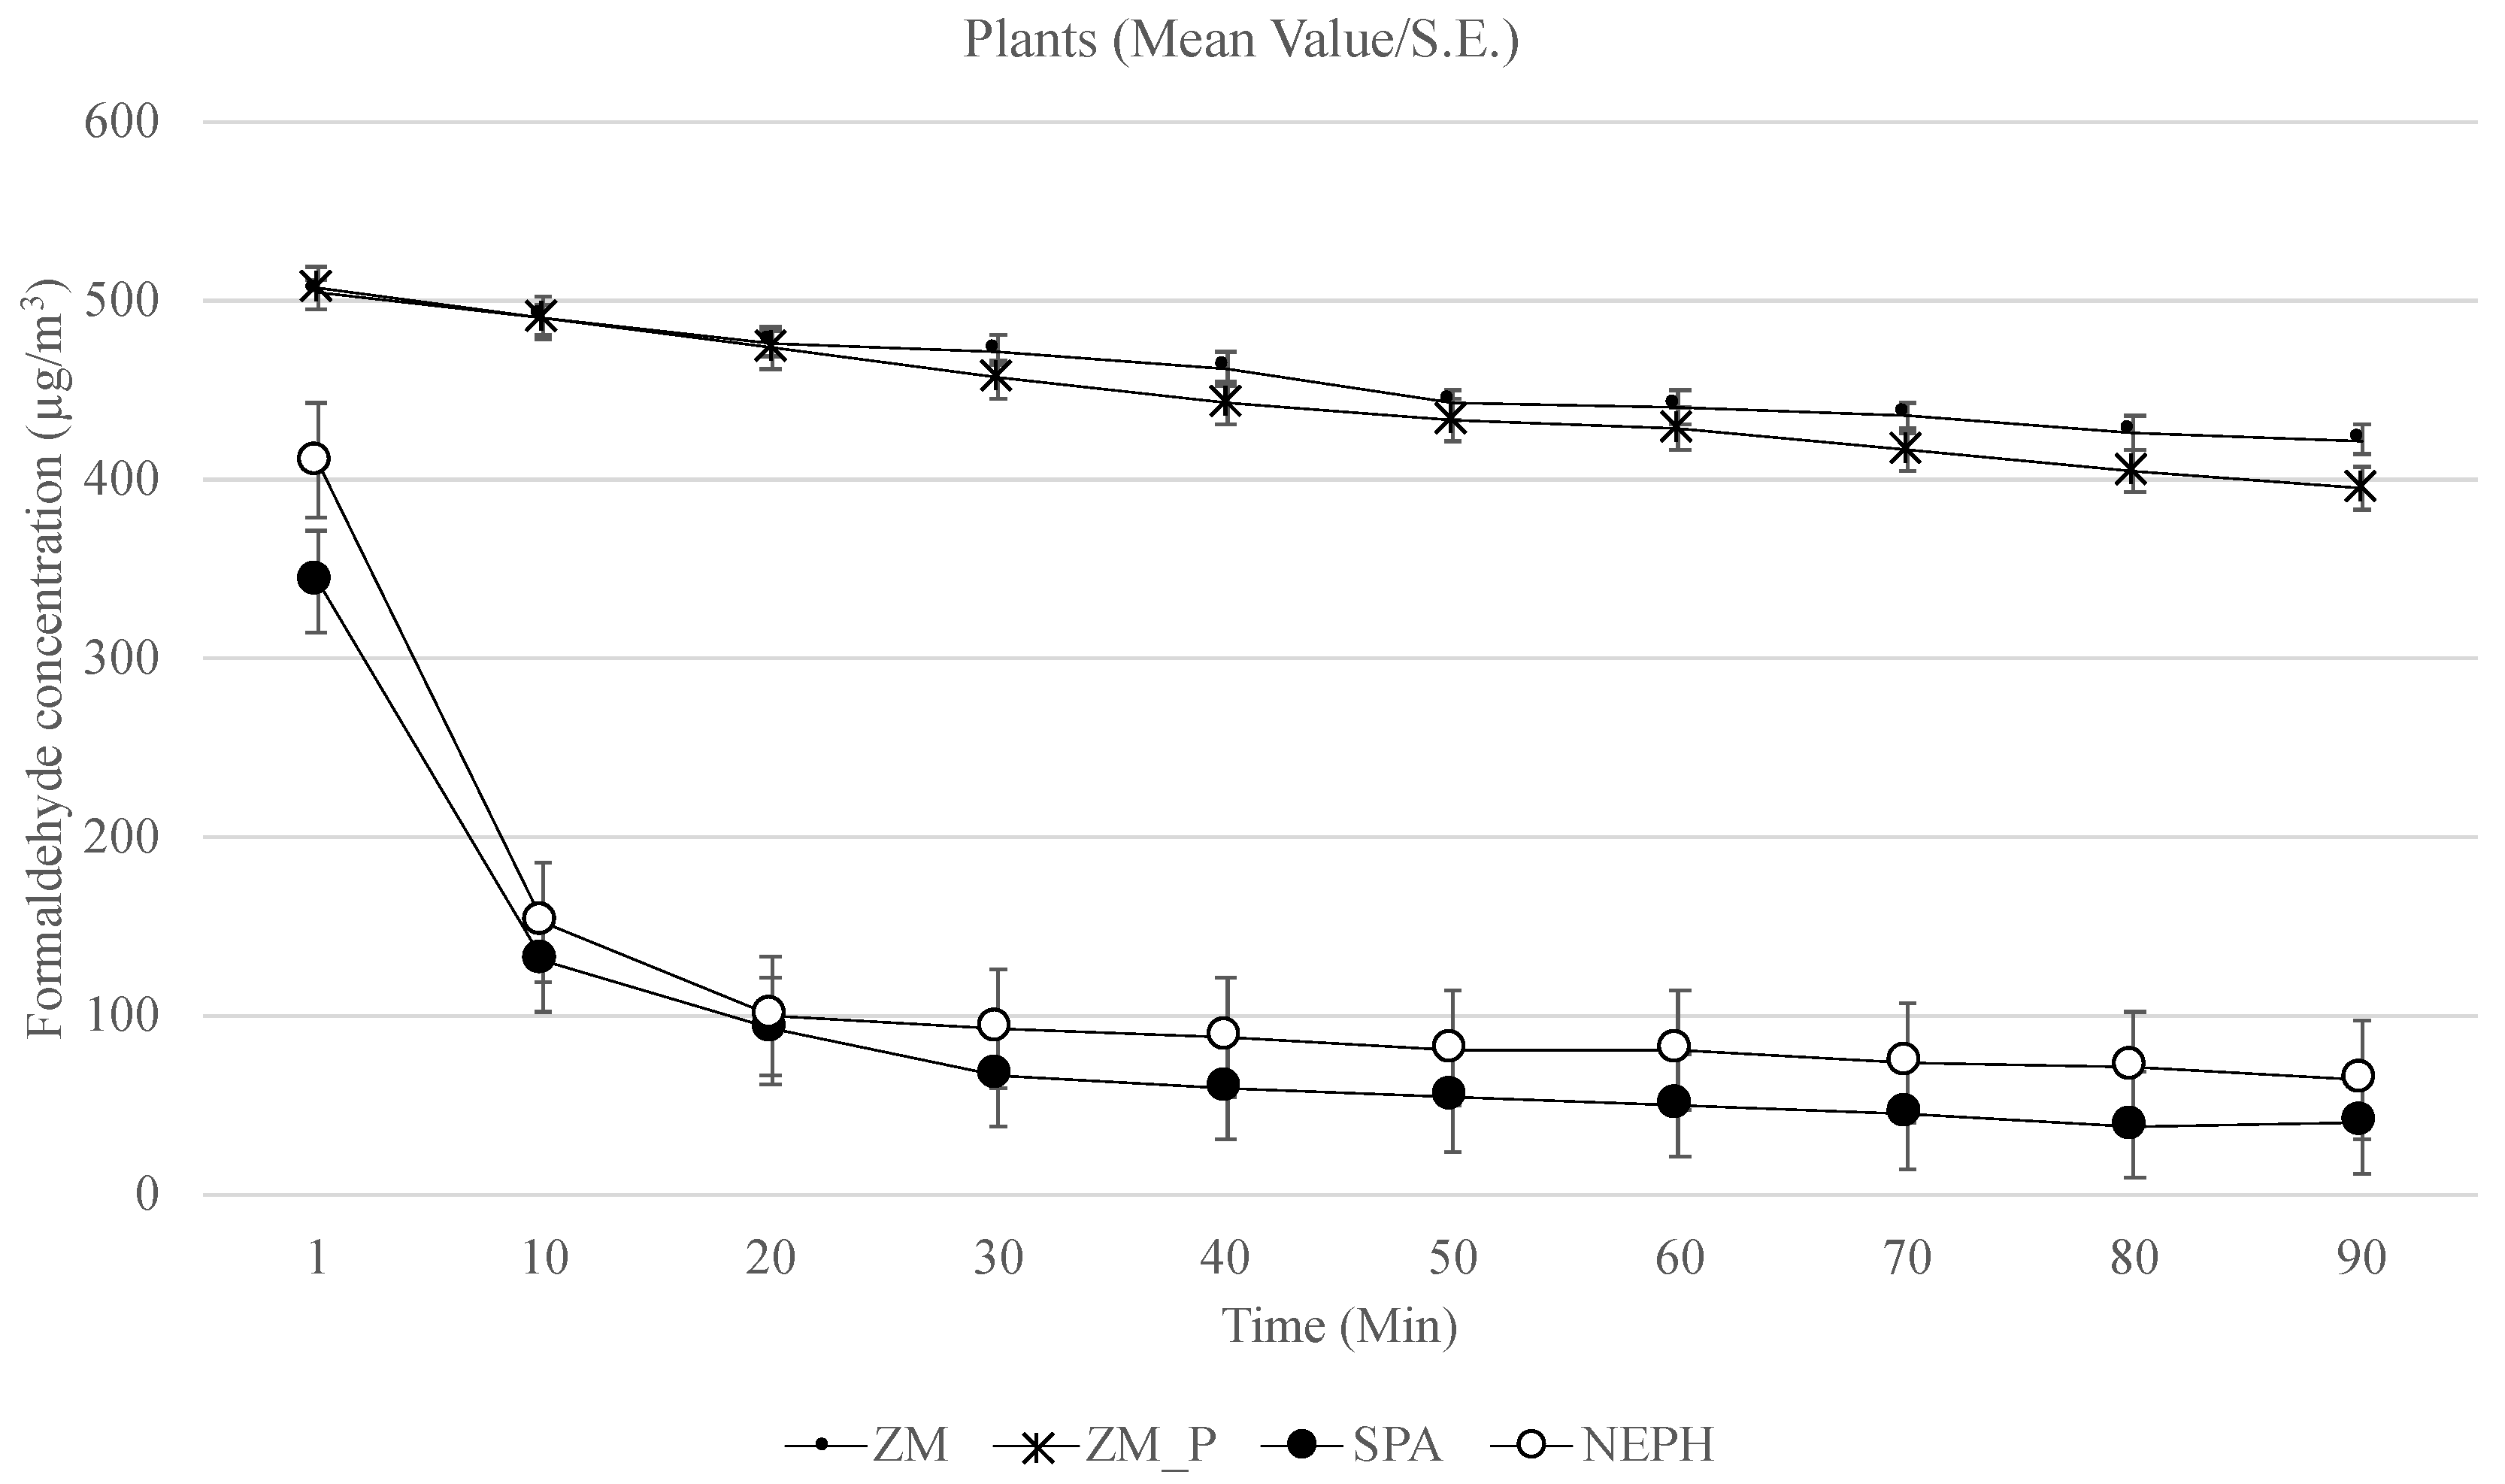
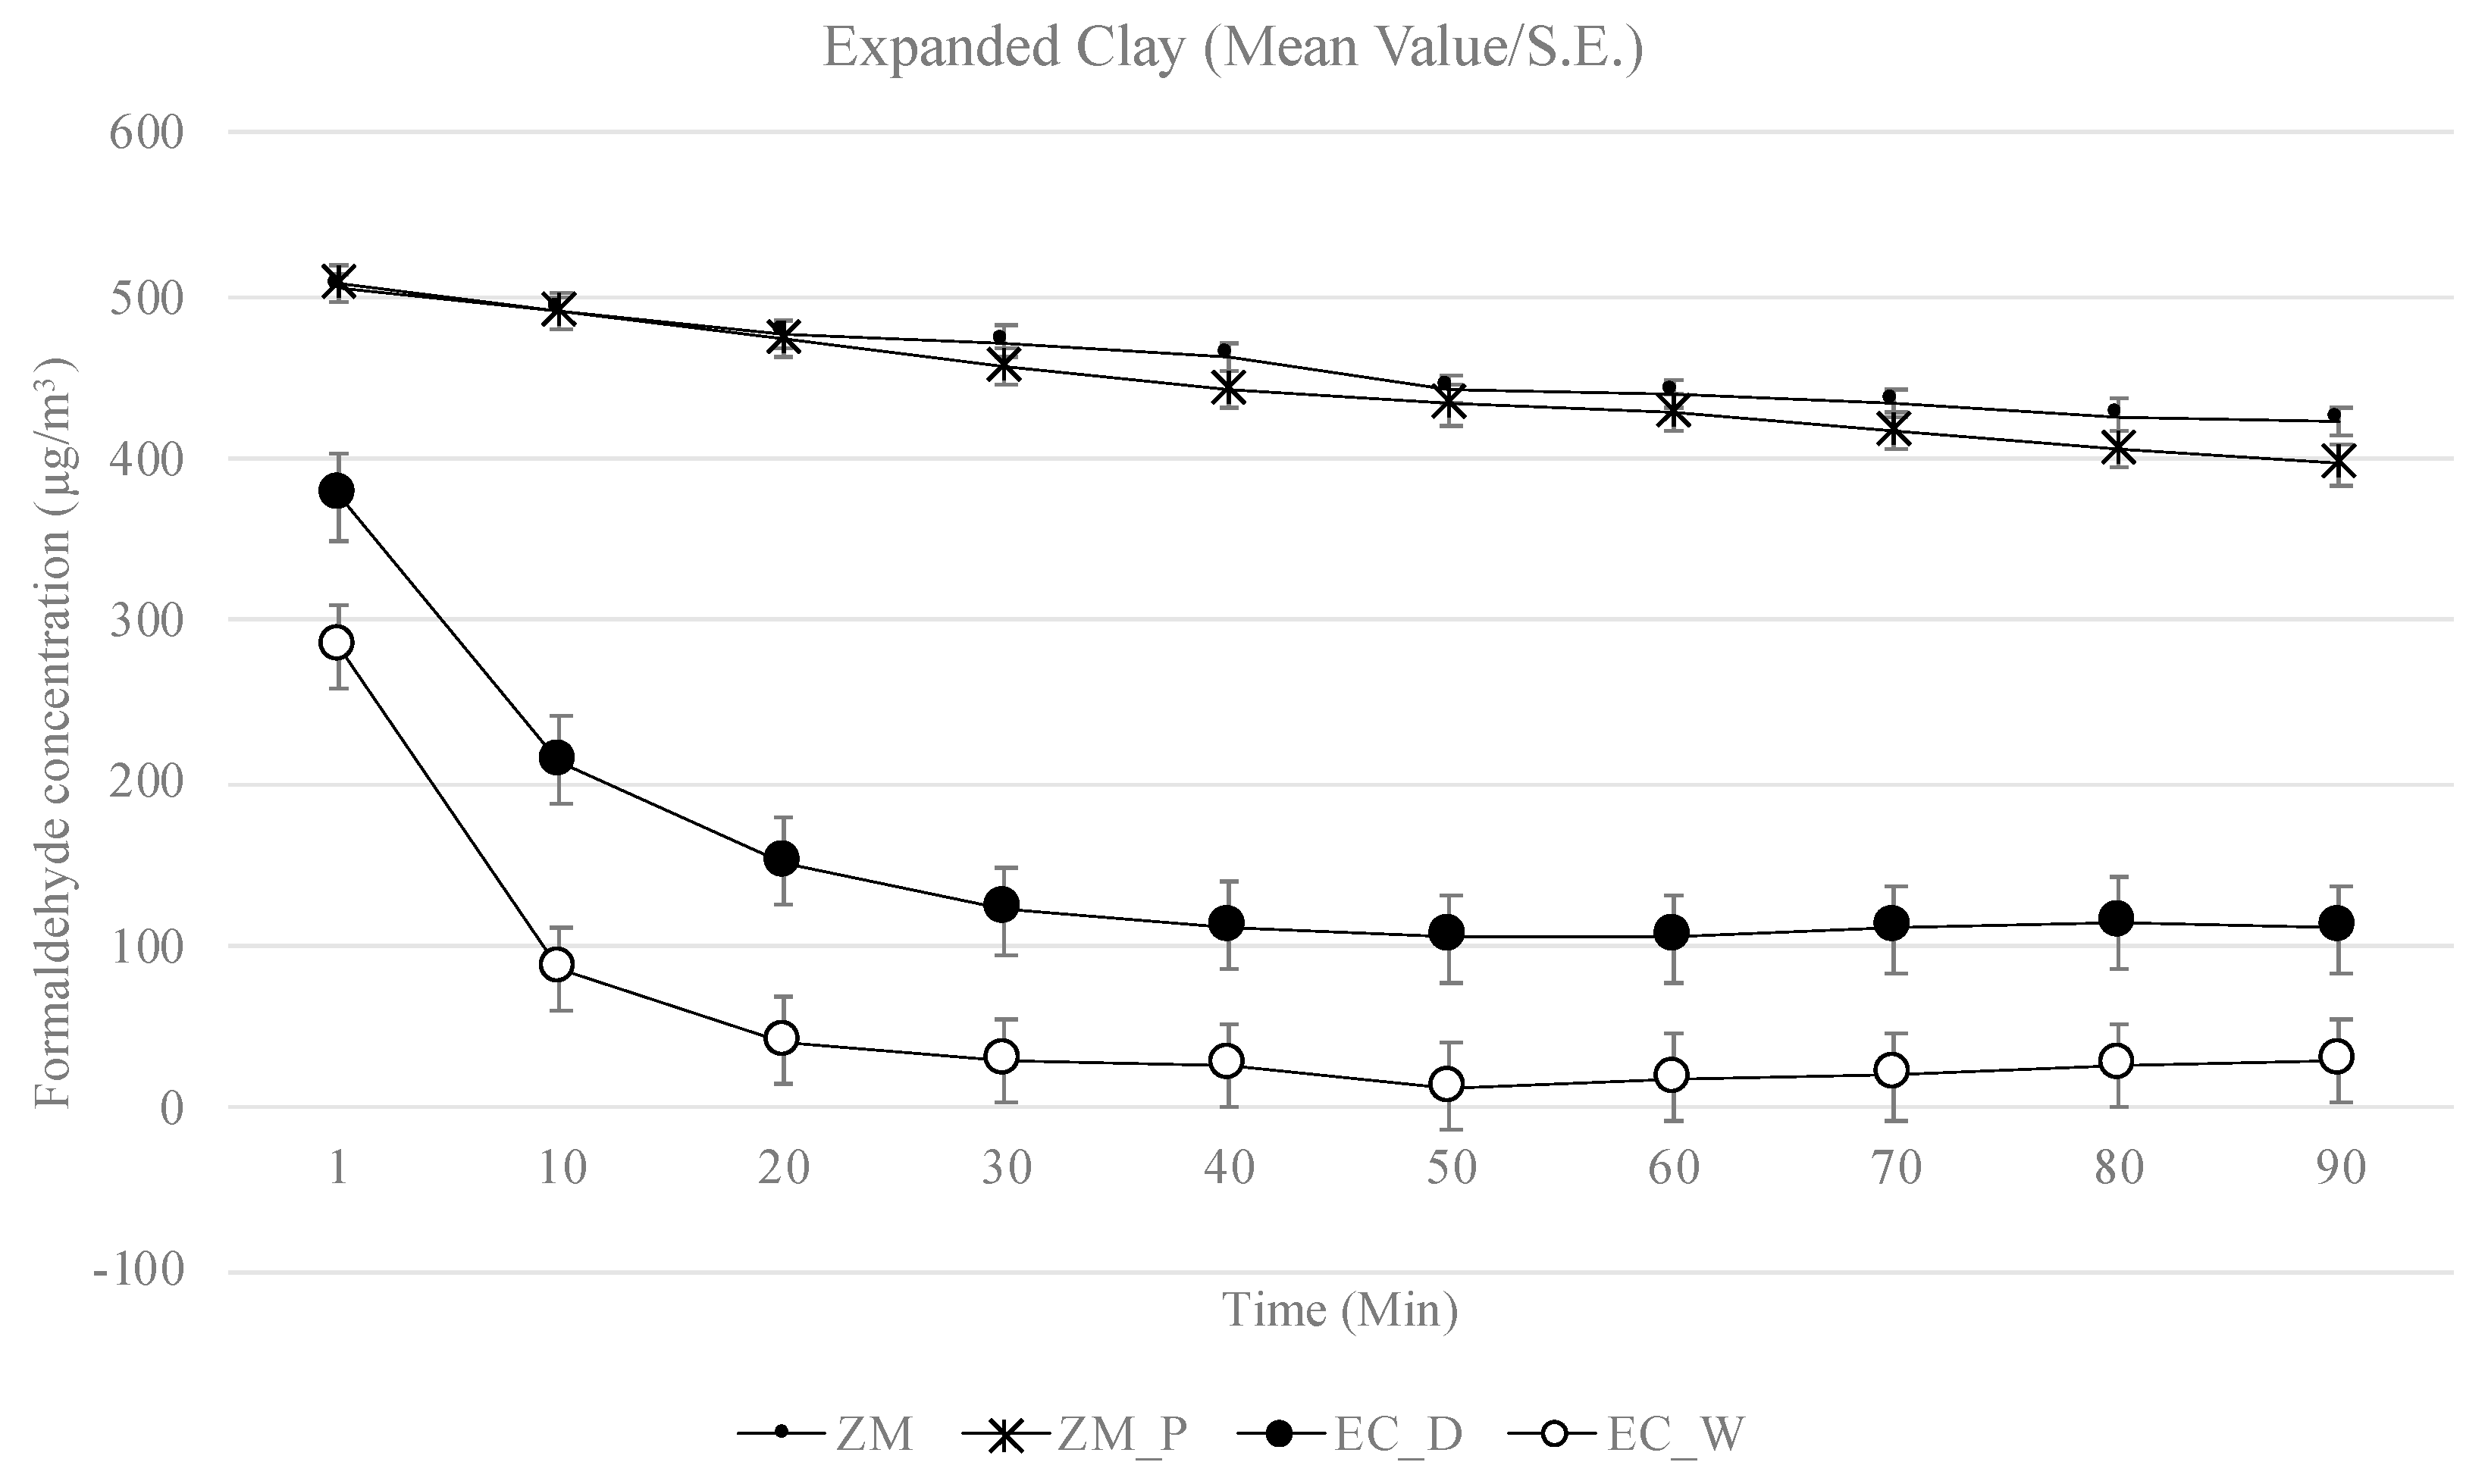
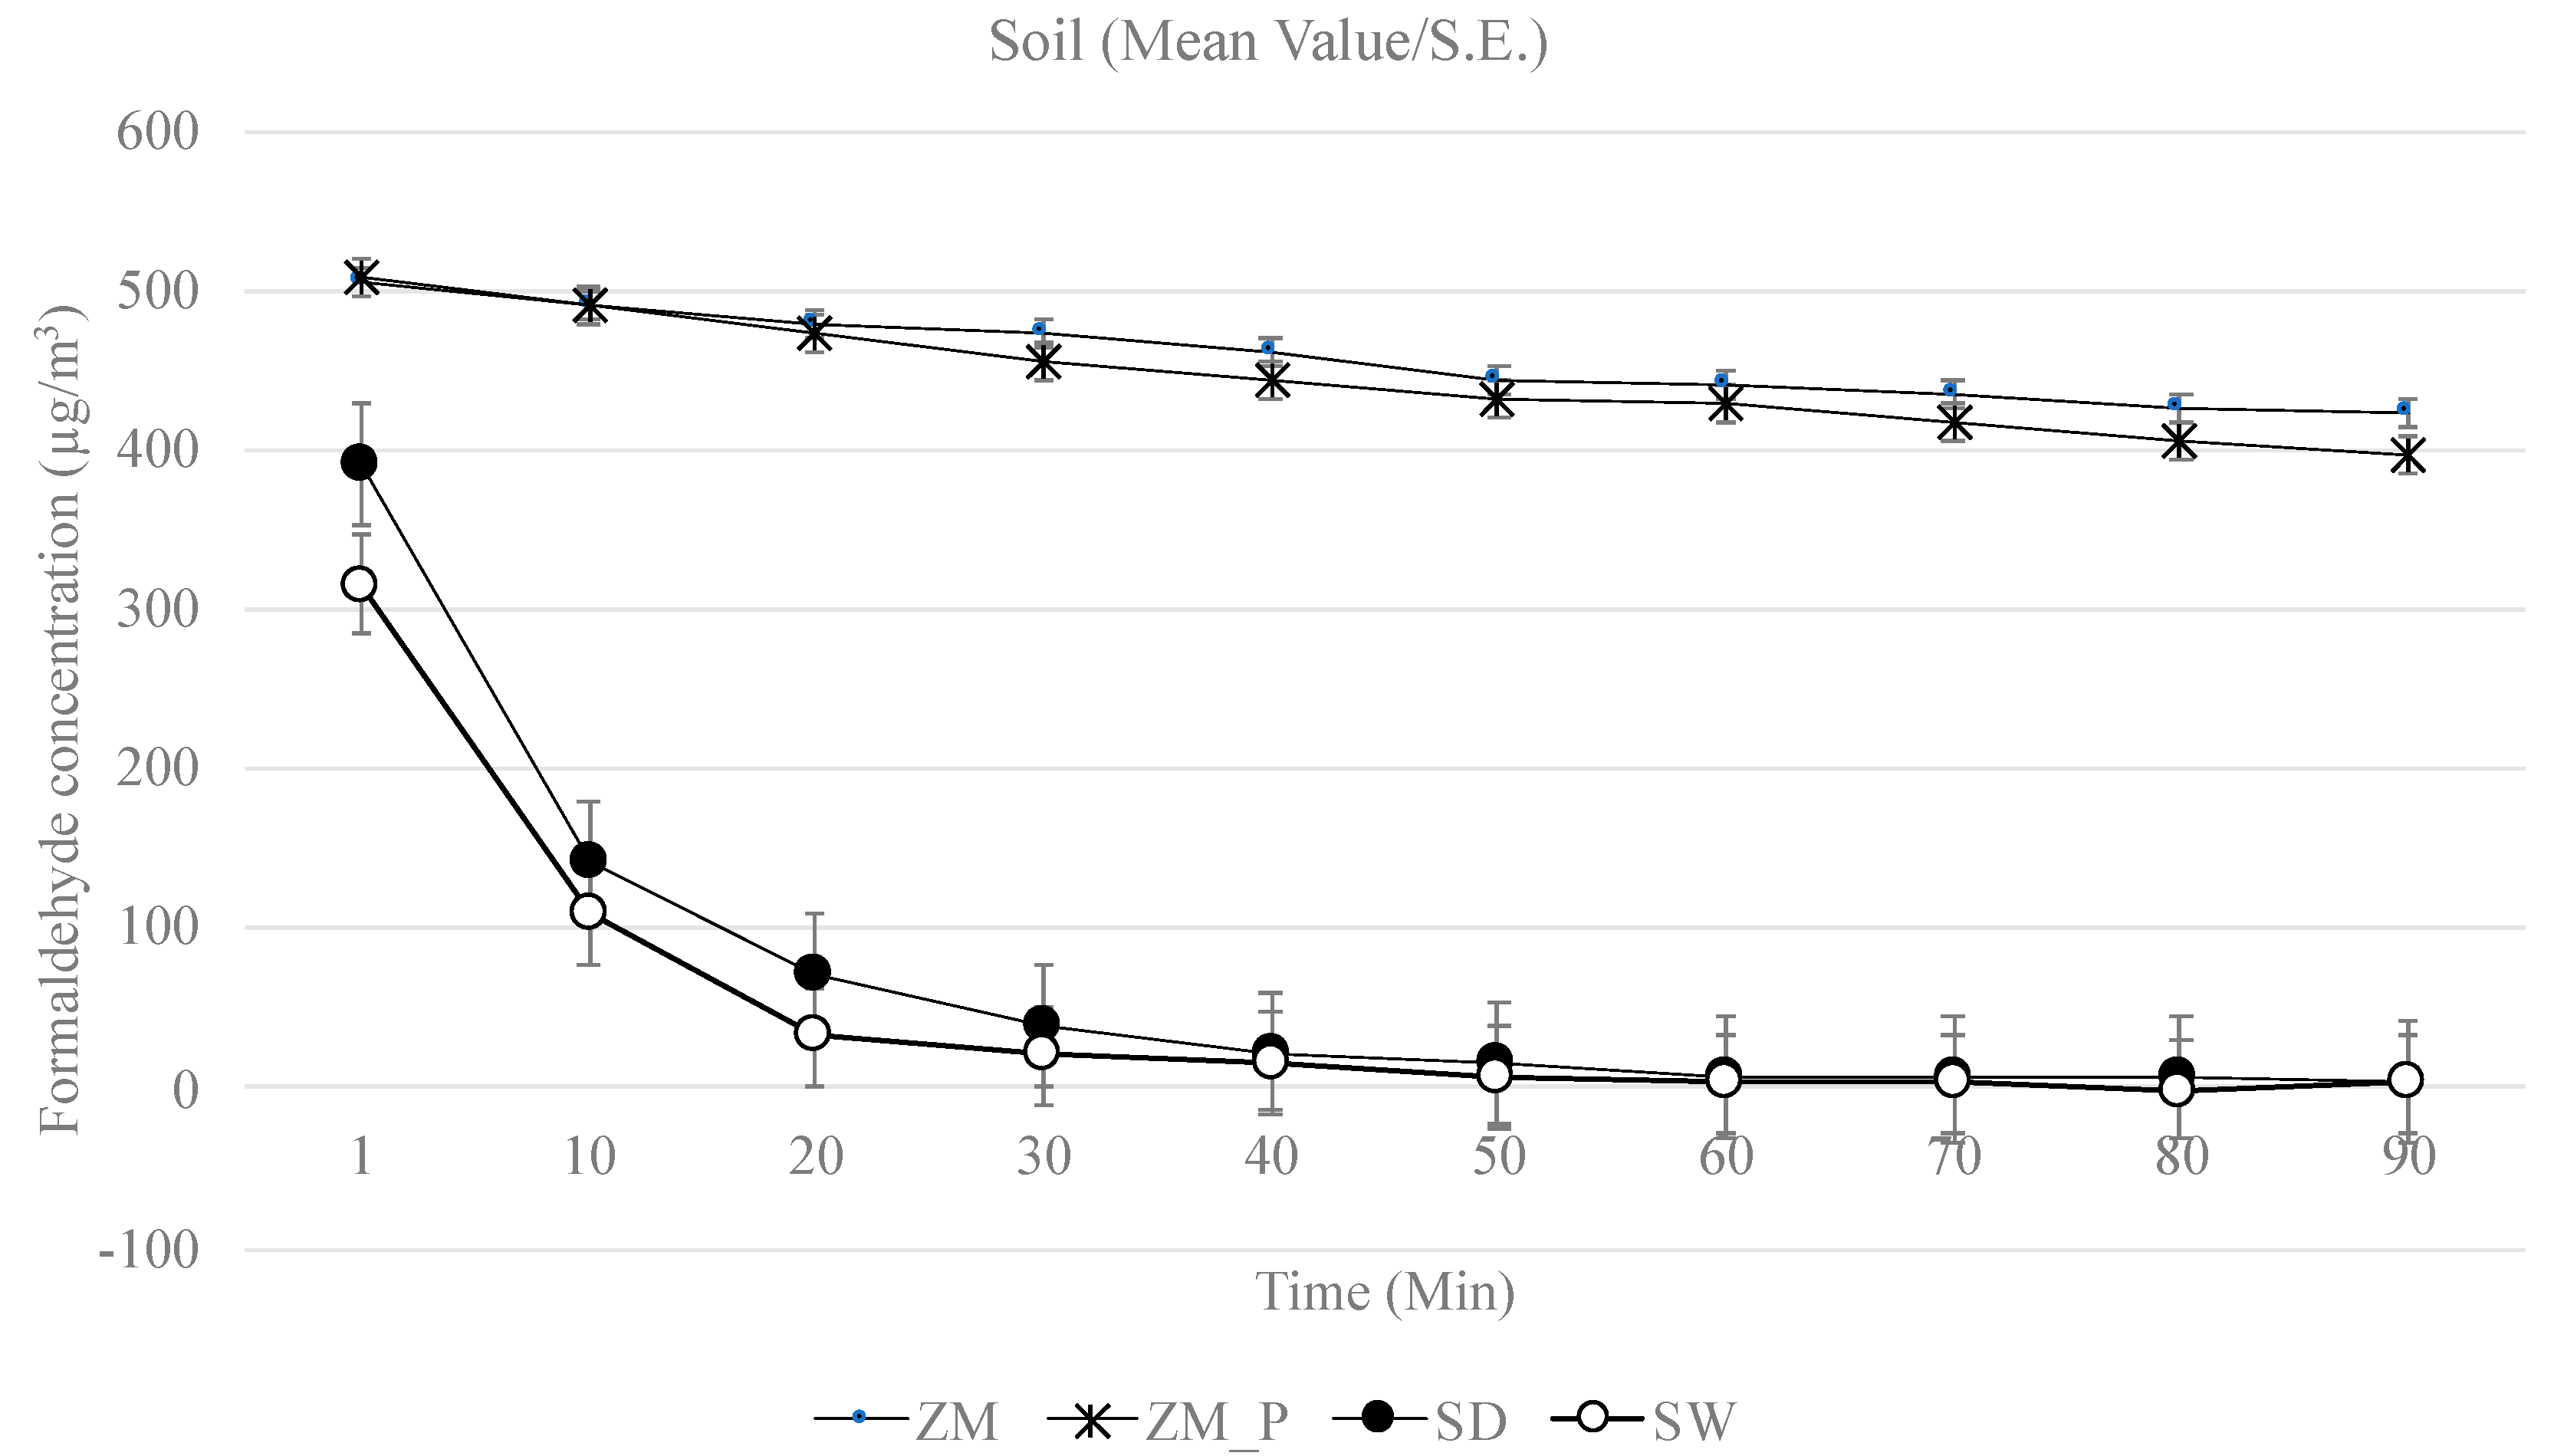
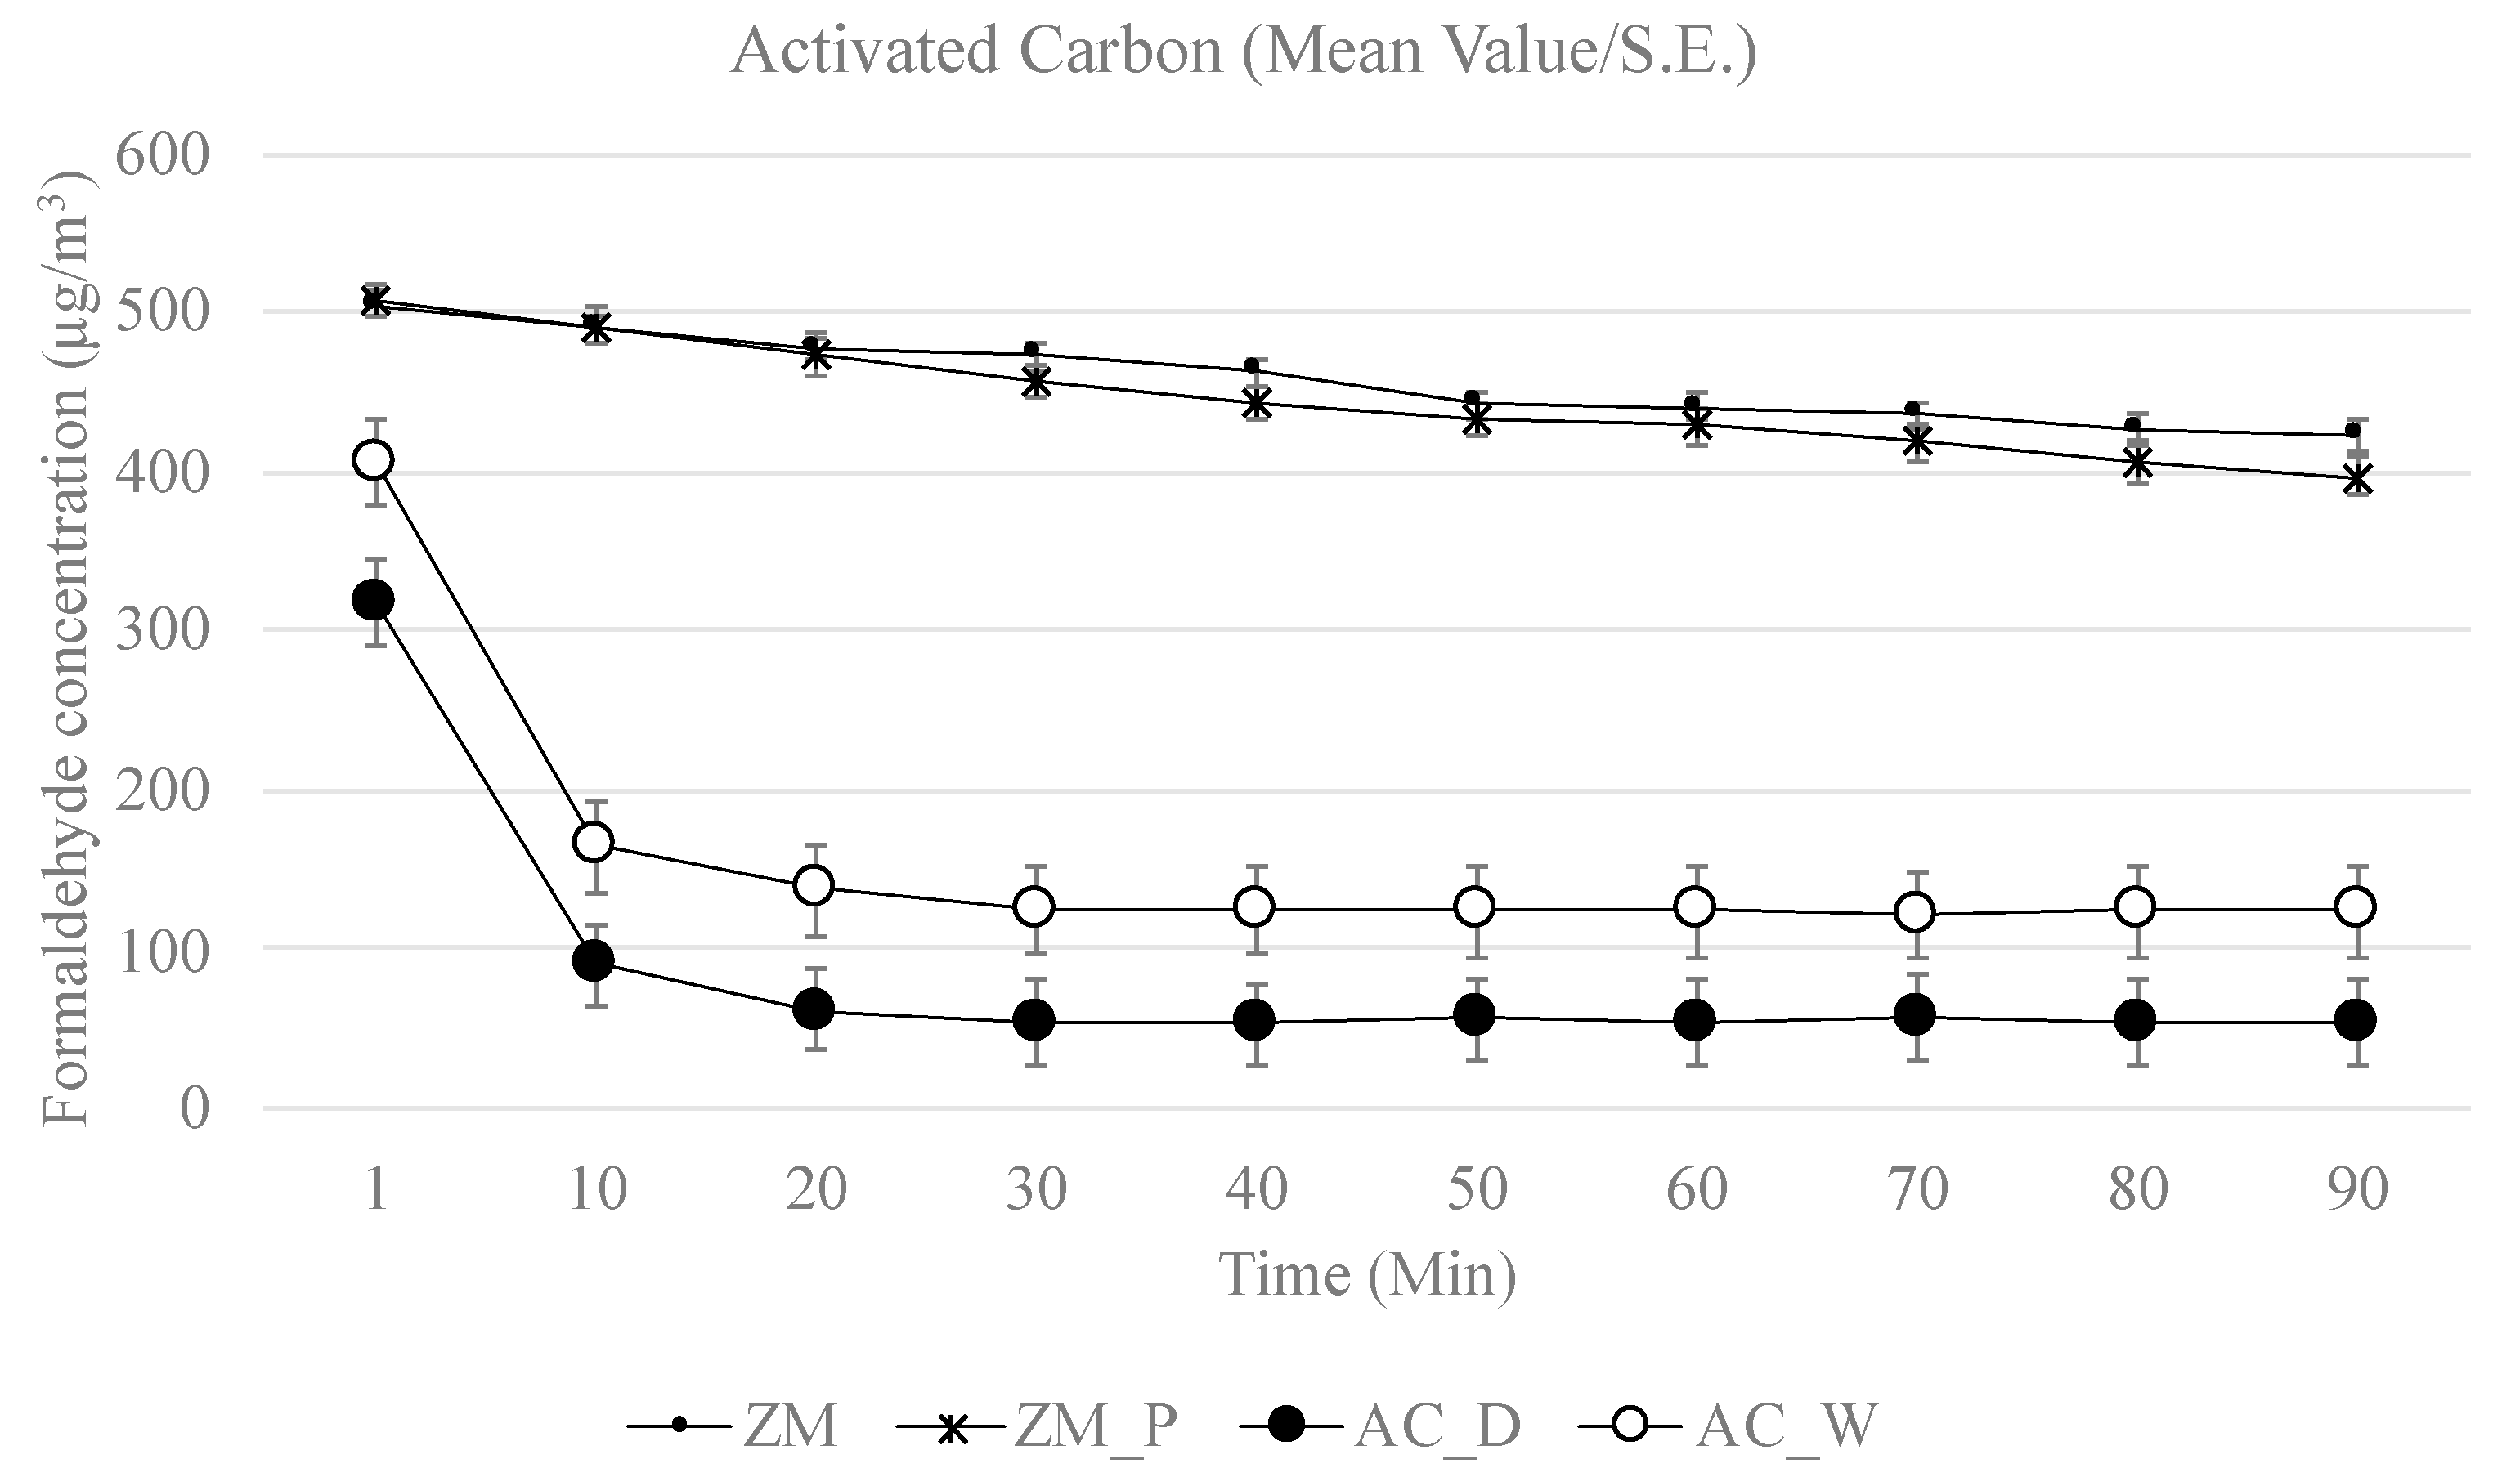
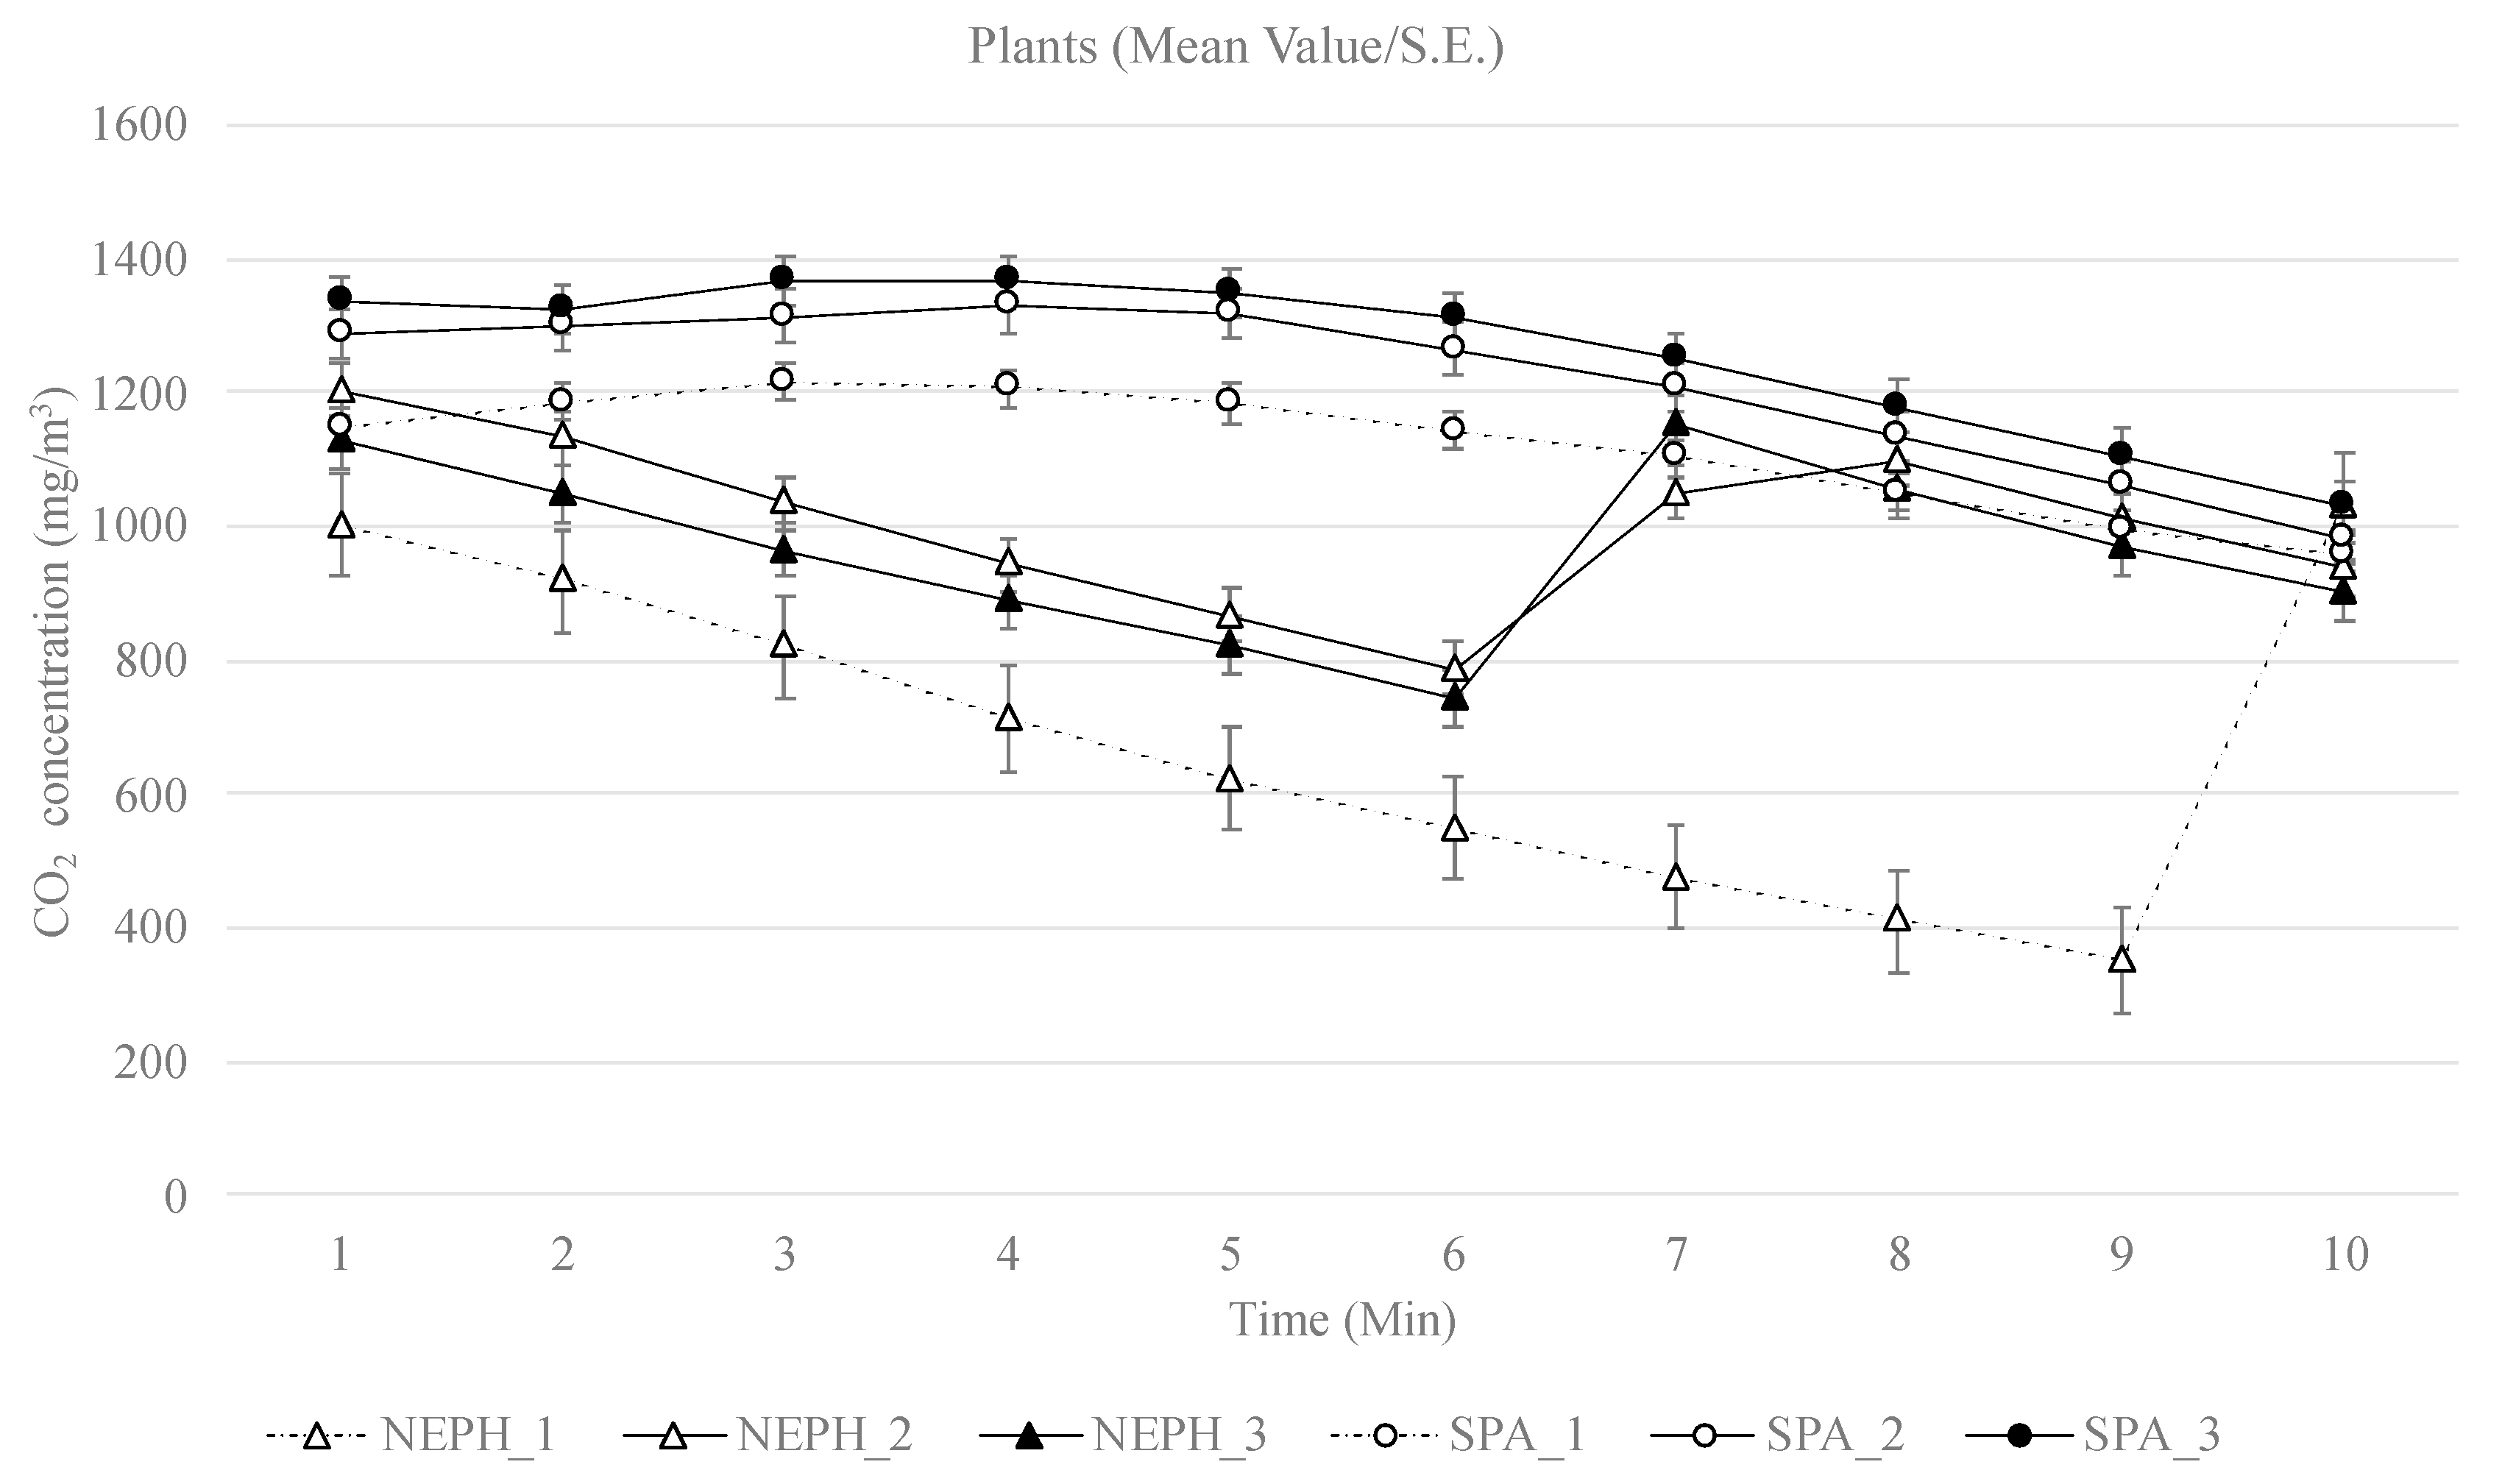
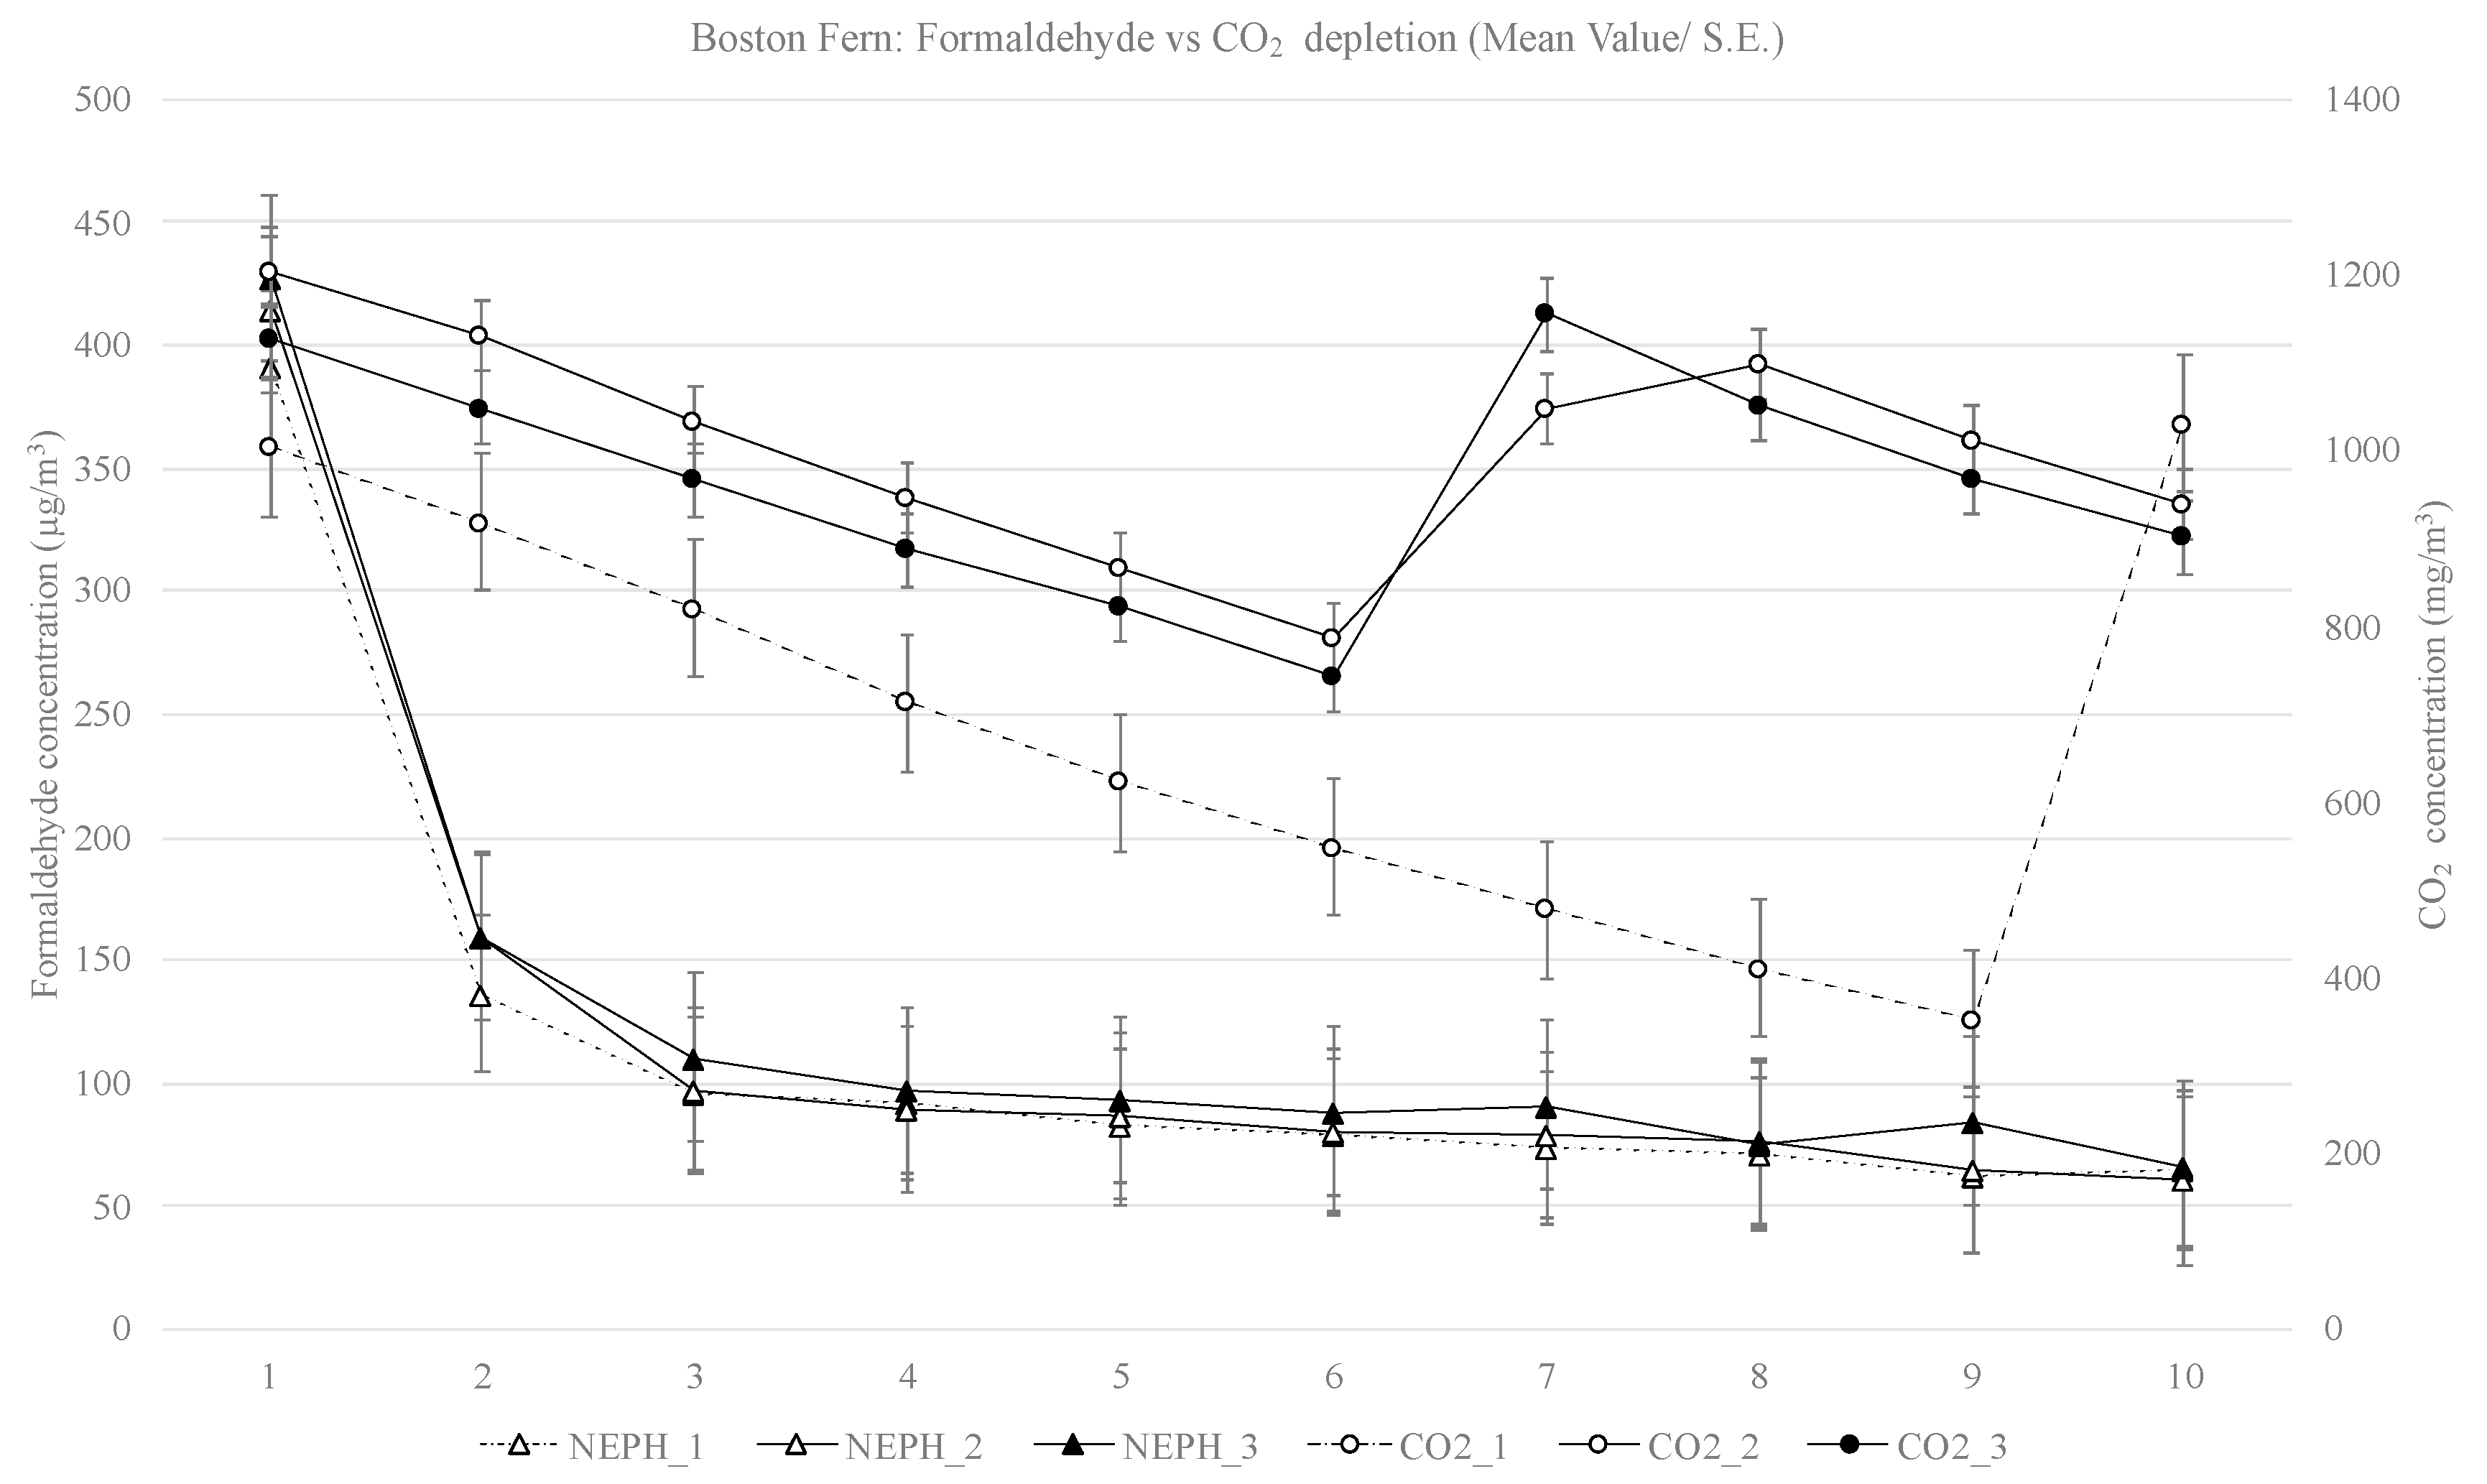
3. Results
4. Discussion
4.1. Depletion of Formaldehyde
4.2. Depletion of CO2
4.3. Plants vs. Growth Media
4.4. Potted Plants and Their Effect on the Indoor Air Quality
4.5. Limitations
5. Conclusions and Recommendations
Author Contributions
Funding
Institutional Review Board Statement
Informed Consent Statement
Data Availability Statement
Acknowledgments
Conflicts of Interest
References
- WHO. WHO Guidelines for Indoor Air Quality: Selected Pollutants; World Health Organization: Geneva, Switzerland, 2010. [Google Scholar]
- Kotzias, D.; Koistinen, K.; Schlitt, C.; Carrer, P.; Maroni, M.; Jantunen, M. The INDEX Project: Final Report for Critical Appraisal of the Setting and Implementation of Indoor Exposure Limits in the EU; Institute for Health and Consumer Protection: Ispra, Italy, 2005. [Google Scholar]
- Kotzias, D. Indoor air and human exposure assessment—Needs and approaches. Exp. Toxicol. Pathol. 2005, 57, 5–7. [Google Scholar] [CrossRef]
- Brown, S.K.; Sim, M.R.; Abramson, M.J.; Gray, C.N. Concentrations of volatile organic-compounds in indoor air—A review. Indoor Air-Int. J. Indoor Environ. Health 1994, 4, 123–134. [Google Scholar] [CrossRef]
- Bluyssen, P.M.; de Oliveira Fernandes, E.; Groes, L.; Clausen, G.; Fanger, P.O.; Valbjørn, O.; Bernhard, C.A.; Roulet, C.A. European indoor air quality audit project in 56 office buildings. Indoor Air Int. J. Indoor Environ. Health 1996, 6, 221–238. [Google Scholar] [CrossRef]
- Bluyssen, P.M.; Cochet, C.; Fischer, M.; Knöppel, H.; Levy, L.; Lundgren, B.; Maroni, M.; Mølhave, L.; Rothweiler, H.; Saarela, K.; et al. Evaluation of VOC Emissions from Building Products: Solid Flooring Materials; European Collaborative Action: Brussels, Belgium; Luxembourg, 1997. [Google Scholar]
- Sofuoglu, S.C.; Aslan, G.; Inal, F.; Sofuoglu, A. An assessment of indoor air concentrations and health risks of volatile organic compounds in three primary schools. Int. J. Hygiene Environ. Health 2011, 214, 36–46. [Google Scholar] [CrossRef] [Green Version]
- Campagnolo, D.; Saraga, D.E.; Cattaneo, A.; Spinazzè, A.; Mandin, C.; Mabilia, R.; Perreca, E.; Sakellaris, I.; Canha, N.; Mihucz, V.G.; et al. VOCs and aldehydes source identification in European office buildings—The OFFICAIR study. Build. Environ. 2017, 115, 18–24. [Google Scholar] [CrossRef]
- Yu, C.; Crump, D. A review of the emission of VOCs from polymeric materials used in buildings. Build. Environ. 1998, 33, 357–374. [Google Scholar] [CrossRef]
- Bluyssen, P.M. The Indoor Environment Handbook: How to Make Buildings Healthy and Comfortable; Taylor & Francis: London, UK, 2009. [Google Scholar]
- Wolkoff, P. Trends in Europe to reduce the indoor air pollution of VOCs. Indoor Air 2002, 13, 5–11. [Google Scholar] [CrossRef] [PubMed]
- IARC. Formaldehyde, 2-Butoxyethanol and 1-Tert-Butoxy-2-Propanol; International Agency for Research on Cancer: Lyon, France, 2006.
- Nielsen, G.D.; Wolkoff, P. Cancer effects of formaldehyde: A proposal for an indoor air guideline value. Arch. Toxicol. 2010, 84, 423–446. [Google Scholar] [CrossRef] [PubMed] [Green Version]
- Salthammer, T.; Mentese, S.; Marutzky, R. Formaldehyde in the Indoor Environment. Chem. Rev. 2010, 110, 2536–2572. [Google Scholar] [CrossRef]
- Knoeppel, H.; Molhave, L.; Seifert, B. Indoor Air Pollution by Formaldehyde in European Countries; EUR 13216 EN; JRC7582; CEC: Brussels, Belgium; Luxembourg, 1990. [Google Scholar]
- Haghighat, F.; De Bellis, L. Material emission rates: Literature review, and the impact of indoor air temperature and relative humidity. Build. Environ. 1998, 33, 261–277. [Google Scholar] [CrossRef]
- Kaden, D.; Mandin, C.; Nielsen, G.D.; Wolkoff, P. Formaldehyde. In WHO Guidelines for Indoor Air Quality: Selected Pollutants; World Health Organization: Geneva, Switzerland, 2010; pp. 103–156. [Google Scholar]
- WHO. Organic Pollutants, in Air Quality Guidelines for Europe; World Health Organization: Geneva, Switzerland, 2000; pp. 58–121. [Google Scholar]
- Van Gemert, L.J. Compilations of odour threshold values in air, water and other media. In Part 1: Odour Threshold Values in Air; Oliemans, Punter & Partners BV: Zeist, The Nehterlands, 2011; pp. 11–181. [Google Scholar]
- Soreanu, G.; Dixon, M.; Darlington, A. Botanical biofiltration of indoor gaseous pollutants—A mini-review. Chem. Eng. J. 2013, 229, 585–594. [Google Scholar] [CrossRef]
- Dela Cruz, M.; Christensen, J.H.; Thomsen, J.D.; Müller, R. Can ornamental potted plants remove volatile organic compounds from indoor air?—A review. Environ. Sci. Pollut. Res. 2014, 21, 13909–13928. [Google Scholar] [CrossRef]
- Irga, P.J.; Pettit, T.; Torpy, F. The phytoremediation of indoor air pollution: A review on the technology development from the potted plant through to functional green wall biofilters. Rev. Environ. Sci. Bio/Technol. 2018, 17, 395–415. [Google Scholar] [CrossRef]
- Armijos Moya, T.; van den Dobbelsteen, A.; Ottelé, M.; Bluyssen, P.M. A review of green systems within the indoor environment. Indoor Built. Environ. 2019, 28, 298–309. [Google Scholar] [CrossRef]
- Wolverton, B.C.; Johnson, A.; Bounds, K. Interior Landscape Plants for Indoor Air Pollution Abatement; National Aeronautics and Space Administration: Hancock County, MS, USA, 1989; pp. 1–22.
- Aydogan, A.; Montoya, L.D. Formaldehyde removal by common indoor plant species and various growing media. Atmos. Environ. 2011, 45, 2675–2682. [Google Scholar] [CrossRef]
- Torpy, F.; Zavattaro, M.; Irga, P. Green wall technology for the phytoremediation of indoor air: A system for the reduction of high CO2 concentrations. Air Qual. Atmos. Health 2016, 10, 575–585. [Google Scholar] [CrossRef]
- Torpy, F.; Clements, N.; Pollinger, M.; Dengel, A.; Mulvihill, I.; He, C.; Irga, P. Testing the single-pass VOC removal efficiency of an active green wall using methyl ethyl ketone (MEK). Air Qual. Atmos. Health 2018, 11, 163–170. [Google Scholar] [CrossRef] [Green Version]
- Sandhu, A.; Halverson, L.J.; Beattie, G.A. Bacterial degradation of airborne phenol in the phyllosphere. Environ. Microbiol. 2006, 9, 383–392. [Google Scholar] [CrossRef]
- Khaksar, G.; Treesubsuntorn, C.; Thiravetyan, P. Effect of endophytic Bacillus cereus ERBP inoculation into non-native host: Potentials and challenges for airborne formaldehyde removal. Plant Physiol. Biochem. 2016, 107, 326–336. [Google Scholar] [CrossRef]
- Wood, R.A.; Orwell, R.L.; Tarran, J.; Torpy, F.; Burchett, M. Potted-plant/growth media interactions and capacities for removal of volatiles from indoor air. J. Hortic. Sci. Biotechnol. 2002, 77, 120–129. [Google Scholar] [CrossRef]
- Orwell, R.L.; Wood, R.L.; Tarran, J.; Torpy, F.; Burchett, M.D. Removal of Benzene by the Indoor Plant/Substrate Microcosm and Implications for Air Quality. Water Air Soil Pollut. 2004, 157, 193–207. [Google Scholar] [CrossRef]
- Kim, K.J.; Kil, M.J.; Song, J.S.; Yoo, E.H.; Son, K.-C.; Kays, S.J. Efficiency of Volatile Formaldehyde Removal by Indoor Plants: Contribution of Aerial Plant Parts versus the Root Zone. J. Am. Soc. Hortic. Sci. 2008, 133, 521–526. [Google Scholar] [CrossRef] [Green Version]
- Wolverton, B.C.; Wolverton, J.D. Plants and soil microorganisms: Removal of formaldehyde, xylene, and ammonia from the indoor environment. J. Miss. Acad. Sci. 1993, 38, 11–15. [Google Scholar]
- Liu, Y.J.; Mu, Y.J.; Zhu, Y.G.; Ding, H.; Arens, N.C. Which ornamental plant species effectively remove benzene from indoor air? Atmos. Environ. 2007, 41, 650–654. [Google Scholar] [CrossRef]
- IPCC. Climate Change 2014: Synthesis Report; Contribution of Working Groups I, II and III to the Fifth Assessment Report of the Intergovernmental Panel on Climate Change: Geneva, Switzerland, 2014; pp. 1–151.
- NASA. Carbon Dioxide: Direct Measurements: 2005–Present. Available online: https://climate.nasa.gov (accessed on 10 November 2019).
- Zheng, Y.; Li, F.; Hao, L.; Shedayi, A.A.; Guo, L.; Ma, C.; Huang, B.; Xu, M. The optimal CO2 concentrations for the growth of three perennial grass species. BMC Plant Biol. 2018, 18, 1–12. [Google Scholar] [CrossRef] [Green Version]
- Irga, P.; Paull, N.; Abdo, P.; Torpy, F. An assessment of the atmospheric particle removal efficiency of an in-room botanical biofilter system. Build. Environ. 2017, 115, 281–290. [Google Scholar] [CrossRef]
- EPA. Evaluation of In-Room Particulate Matter Air Filtration Devices; Environmental Protection Agency: Washington, DC, USA, 2008.
- ANSI/AHAM-AC-1-2013. Method for Measuring Performance of Portable Household Electric Room Air Cleaners; Association of Home Appliance Manufacturers: Washington, DC, USA, 2015. [Google Scholar]
- Wolverton, B.C.; Mcdonald, R.C.; Watkins, E.A. Foliage plants for removing indoor air-pollutants from energy-efficient homes. Econ. Bot. 1984, 38, 224–228. [Google Scholar] [CrossRef]
- Teiri, H.; Pourzamani, H.; Hajizadeh, Y. Phytoremediation of VOCs from indoor air by ornamental potted plants: A pilot study using a palm species under the controlled environment. Chemosphere 2018, 197, 375–381. [Google Scholar] [CrossRef]
- Darlington, A.; Chan, M.; Malloch, D.; Pilger, C.; A Dixon, M. The Biofiltration of Indoor Air: Implications for Air Quality. Indoor Air 2000, 10, 39–46. [Google Scholar] [CrossRef]
- Cummings, B.E.; Waring, M.S. Potted plants do not improve indoor air quality: A review and analysis of reported VOC removal efficiencies. J. Expo. Sci. Environ. Epidemiol. 2019, 30, 253–261. [Google Scholar] [CrossRef] [Green Version]
- Van de Geijn, S.C.; Goudriaan, J. The effects of elevated CO2 and temperature change on transpiration and crop water use. In Global Climate Change and Agricultural Production; FAO and John Wiley & Sons: Oxford, UK, 1996; pp. 101–121. [Google Scholar]
- Wang, Y.; Chen, X.; Xiang, C.-B. Stomatal Density and Bio-water Saving. J. Integr. Plant Biol. 2007, 49, 1435–1444. [Google Scholar] [CrossRef]
- Elliott-Kingston, C.; Haworth, M.; Yearsley, J.M.; Batke, S.; Lawson, T.; McElwain, J.C. Does Size Matter? Atmospheric CO2 May Be a Stronger Driver of Stomatal Closing Rate Than Stomatal Size in Taxa That Diversified under Low CO2. Front. Plant Sci. 2016, 7, 1253. [Google Scholar] [CrossRef] [PubMed] [Green Version]
- Grantz, D.A.; Assmann, S.M. Stomatal response to blue light: Water use efficiency in sugarcane and soybean. Plant Cell Environ. 1991, 14, 683–690. [Google Scholar] [CrossRef]
- ASHRAE-62.1. Ventilation for Acceptable Indoor Air Quality; American Society of Heating, Refrigerating and Air Conditioning Engineers: Atlanta, GA, USA, 2016. [Google Scholar]
- NEN-EN15251. Indoor Environmental Input Parameters for Design and Assessment of Energy Performance of Buildings Addressing Indoor Air Quality, Thermal Environment, Lighting and Acoustics; European Committee for Standardization: Brussels, Belgium, 2007. [Google Scholar]


| Test No. | Test Condition | RH * | T * | Time | N(0) | N(t) | λe | λn | λp | CADR | η | |
|---|---|---|---|---|---|---|---|---|---|---|---|---|
| (%) | (°C) | (h) | (μg/m3) | (μg/m3) | (h)−1 | (h)−1 | (h)−1 | (m3/h) | (%) | |||
| 1 | Zero measurement 1 | (ZM_1) | 53 | 24 | 2.38 | 481.48 | 0.09 | |||||
| 2 | Zero measurement 2 | (ZM_2) | 59 | 24 | 1.52 | 524.47 | 0.13 | |||||
| 3 | Zero measurement_Pot 1 | (ZMP_1) | 43 | 24 | 2.10 | 498.68 | 0.16 | |||||
| 4 | Zero measurement_Pot 2 | (ZMP_2) | 58 | 24 | 1.52 | 515.87 | 0.14 | |||||
| 5 | Dry Expanded Clay 1 | (EC_D_1) | 85 | 25 | 1.55 | 363.57 | 98.26 | 0.84 | 0.02 | 73 | ||
| 6 | Dry Expanded Clay 2 | (EC_D_2) | 83 | 24 | 1.13 | 335.32 | 70.01 | 1.38 | 0.04 | 79 | ||
| 7 | Dry Expanded Clay 3 | (EC_D_3) | 57 | 24 | 1.60 | 431.12 | 116.69 | 0.82 | 0.02 | 73 | ||
| 8 | Wet Expanded Clay 1 | (EC_W_1) | 93 | 26 | 1.10 | 308.30 | 1.23 | 5.02 | 0.16 | 100 | ||
| 9 | Wet Expanded Clay 2 | (EC_W_2) | 92 | 25 | 1.10 | 368.48 | 22.11 | 2.56 | 0.08 | 94 | ||
| 10 | Wet Expanded Clay 3 | (EC_W_3) | 95 | 24 | 1.65 | 174.41 | 17.20 | 1.40 | 0.04 | 90 | ||
| 11 | Dry Soil 1 | (S_D_1) | 92 | 24 | 1.27 | 389.36 | 2.46 | 4.00 | 0.12 | 99 | ||
| 12 | Dry Soil 2 | (S_D_2) | 93 | 24 | 1.50 | 336.55 | 4.91 | 2.82 | 0.08 | 99 | ||
| 13 | Dry Soil 3 | (S_D_3) | 93 | 25 | 1.43 | 447.09 | 13.51 | 2.44 | 0.07 | 97 | ||
| 14 | Wet Soil 1 ** | (S_W_1) | 91 | 25 | 1.07 | 197.75 | 1.00 | 4.96 | 0.16 | 99 | ||
| 15 | Wet Soil 2 | (S_W_2) | 96 | 24 | 1.38 | 366.02 | 1.23 | 4.12 | 0.13 | 100 | ||
| 16 | Wet Soil 3 | (S_W_3) | 93 | 24 | 1.48 | 381.99 | 1.23 | 3.87 | 0.12 | 100 | ||
| 17 | Dry Activated Carbon 1 | (AC_D_1) | 41 | 25 | 1.42 | 296.01 | 39.30 | 1.43 | 0.04 | 87 | ||
| 18 | Dry Activated Carbon 2 | (AC_D_2) | 43 | 24 | 1.52 | 297.24 | 45.45 | 1.24 | 0.03 | 85 | ||
| 19 | Dry Activated Carbon 3 | (AC_D_3) | 50 | 24 | 1.49 | 358.65 | 67.55 | 1.13 | 0.03 | 81 | ||
| 20 | Wet Activated Carbon 1 | (AC_W_1) | 95 | 25 | 1.57 | 383.22 | 126.51 | 0.71 | 0.01 | 67 | ||
| 21 | Wet Activated Carbon 2 | (AC_W_2) | 93 | 26 | 1.25 | 428.67 | 128.97 | 0.96 | 0.02 | 70 | ||
| 22 | Wet Activated Carbon 3 | (AC_W_3) | 91 | 24 | 0.75 | 356.20 | 1469.01 | −1.89 | - | |||
| 23 | Peace Lily 1 | (SPA_1) | 95 | 24 | 1.77 | 311.98 | 41.76 | 1.14 | 0.03 | 87 | ||
| 24 | Peace Lily 2 | (SPA_2) | 95 | 24 | 1.67 | 367.25 | 44.22 | 1.27 | 0.03 | 88 | ||
| 25 | Peace Lily 3 | (SPA_3) | 94 | 24 | 1.72 | 348.83 | 46.67 | 1.17 | 0.03 | 87 | ||
| 26 | Boston fern 1 | (NEPH_1) | 93 | 24 | 1.63 | 390.59 | 58.96 | 1.16 | 0.03 | 85 | ||
| 27 | Boston fern 2 | (NEPH_2) | 94 | 24 | 1.58 | 413.93 | 67.55 | 1.14 | 0.03 | 84 | ||
| 28 | Boston fern 3 | (NEPH_3) | 95 | 24 | 1.55 | 427.44 | 74.92 | 1.12 | 0.03 | 82 | ||
| Test No. | Test Condition | RH * | T * | Time | N(0) | N(t) | λe | λn | λp | CADR | η | |
|---|---|---|---|---|---|---|---|---|---|---|---|---|
| (%) | (°C) | (h) | (mg/m3) | (mg/m3) | (h)−1 | (h)−1 | (h)−1 | (m3/h) | (%) | |||
| 1 | Zero measurement 1 | (ZM_1) | 53 | 24 | 2.38 | 756.00 | 0 | |||||
| 2 | Zero measurement 2 | (ZM_2) | 59 | 24 | 1.52 | 887.40 | 0 | |||||
| 3 | Zero measurement_Pot 1 | (ZMP_1) | 43 | 24 | 2.10 | 1024.21 | 0 | |||||
| 4 | Zero measurement_Pot 2 | (ZMP_2) | 58 | 24 | 1.52 | 1054.81 | 0 | |||||
| 5 | Dry Expanded Clay 1 | (EC_D_1) | 85 | 25 | 1.55 | 1368.01 | 0 | - | ||||
| 6 | Dry Expanded Clay 2 | (EC_D_2) | 83 | 24 | 1.13 | 1297.81 | 1281.61 | 0.01 | 0.00 | 1 | ||
| 7 | Dry Expanded Clay 3 | (EC_D_3) | 57 | 24 | 1.60 | 1243.81 | 0 | - | ||||
| 8 | Wet Expanded Clay 1 | (EC_W_1) | 93 | 26 | 1.10 | 1018.81 | 0 | - | ||||
| 9 | Wet Expanded Clay 2 | (EC_W_2) | 92 | 25 | 1.10 | 1051.21 | 1031.41 | 0.02 | 0.00 | 2 | ||
| 10 | Wet Expanded Clay 3 | (EC_W_3) | 95 | 24 | 1.65 | 1351.81 | 1323.01 | 0.01 | 0.00 | 2 | ||
| 11 | Dry Soil 1 | (S_D_1) | 92 | 24 | 1.27 | 977.40 | −0.05 | - | ||||
| 12 | Dry Soil 2 | (S_D_2) | 93 | 24 | 1.50 | 1146.61 | −0.04 | - | ||||
| 13 | Dry Soil 3 | (S_D_3) | 93 | 25 | 1.43 | 1099.81 | −0.04 | - | ||||
| 14 | Wet Soil 1 | (S_W_1) | 91 | 25 | 1.07 | 851.40 | −0.13 | - | ||||
| 15 | Wet Soil 2 | (S_W_2) | 96 | 24 | 1.38 | 932.40 | −0.18 | - | ||||
| 16 | Wet Soil 3 | (S_W_3) | 93 | 24 | 1.48 | 981.00 | −0.14 | - | ||||
| 17 | Dry Activated Carbon 1 | (AC_D_1) | 41 | 25 | 1.42 | 2190.61 | −0.21 | - | ||||
| 18 | Dry Activated Carbon 2 | (AC_D_2) | 43 | 24 | 1.52 | 1002.61 | −0.06 | - | ||||
| 19 | Dry Activated Carbon 3 | (AC_D_3) | 50 | 24 | 1.49 | 1033.21 | −0.01 | - | ||||
| 20 | Wet Activated Carbon 1 | (AC_W_1) | 95 | 25 | 1.57 | 1432.81 | −0.48 | - | ||||
| 21 | Wet Activated Carbon 2 | (AC_W_2) | 93 | 26 | 1.25 | 1222.21 | −0.09 | - | ||||
| 22 | Wet Activated Carbon 3 | (AC_W_3) | 91 | 24 | 0.75 | 1272.61 | −0.17 | - | ||||
| 23 | Peace Lily 1 | (SPA_1) | 95 | 24 | 1.77 | 1146.61 | 885.60 | 0.15 | 0.01 | 23 | ||
| 24 | Peace Lily 2 | (SPA_2) | 95 | 24 | 1.67 | 1288.81 | 925.20 | 0.20 | 0.01 | 28 | ||
| 25 | Peace Lily 3 | (SPA_3) | 94 | 24 | 1.72 | 1337.41 | 963.00 | 0.19 | 0.01 | 28 | ||
| 26 | Boston fern 1 | (NEPH_1) | 93 | 24 | 1.37 | 1002.61 | 351.00 | 0.77 | 0.03 | 65 | ||
| 27 | Boston fern 2 | (NEPH_2) | 94 | 24 | 0.97 | 1202.41 | 718.20 | 0.53 | 0.02 | 40 | ||
| 28 | Boston fern 3 | (NEPH_3) | 95 | 24 | 0.92 | 1126.81 | 718.20 | 0.49 | 0.02 | 36 | ||
Publisher’s Note: MDPI stays neutral with regard to jurisdictional claims in published maps and institutional affiliations. |
© 2021 by the authors. Licensee MDPI, Basel, Switzerland. This article is an open access article distributed under the terms and conditions of the Creative Commons Attribution (CC BY) license (https://creativecommons.org/licenses/by/4.0/).
Share and Cite
Armijos-Moya, T.; de Visser, P.; Ottelé, M.; van den Dobbelsteen, A.; Bluyssen, P.M. Air Cleaning Performance of Two Species of Potted Plants and Different Substrates. Appl. Sci. 2022, 12, 284. https://doi.org/10.3390/app12010284
Armijos-Moya T, de Visser P, Ottelé M, van den Dobbelsteen A, Bluyssen PM. Air Cleaning Performance of Two Species of Potted Plants and Different Substrates. Applied Sciences. 2022; 12(1):284. https://doi.org/10.3390/app12010284
Chicago/Turabian StyleArmijos-Moya, Tatiana, Pieter de Visser, Marc Ottelé, Andy van den Dobbelsteen, and Philomena M. Bluyssen. 2022. "Air Cleaning Performance of Two Species of Potted Plants and Different Substrates" Applied Sciences 12, no. 1: 284. https://doi.org/10.3390/app12010284
APA StyleArmijos-Moya, T., de Visser, P., Ottelé, M., van den Dobbelsteen, A., & Bluyssen, P. M. (2022). Air Cleaning Performance of Two Species of Potted Plants and Different Substrates. Applied Sciences, 12(1), 284. https://doi.org/10.3390/app12010284