Article

Mineralogical Transformations in Granitoids during Heating at Fire-Related Temperatures

1
GEGENAA, Université de Reims Champagne-Ardenne, 2, Esplanade Roland Garros, 51100 Reims, France
2
Laboratorio de Petrologia Aplicada, Universidad de Alicante, 03690 Saint Vicent du Raspeig, Spain
3
Departamento de Geologia y Geoquimica, Universidad Autónoma de Madrid, 28049 Madrid, Spain
*
Author to whom correspondence should be addressed.
Appl. Sci. 2022, 12(1), 188; https://doi.org/10.3390/app12010188
Submission received: 24 November 2021 / Revised: 20 December 2021 / Accepted: 22 December 2021 / Published: 24 December 2021
(This article belongs to the Special Issue Applied Petrology: Latest Advances and Prospects)

Abstract

:
Fire is a major decay agent of rocks and can generate immediate catastrophic effects as well as directional and anisotropic damage that affect long-term weathering processes. Temperature increase is the most relevant factor, among other components in a fire, generating mineral transformations and bulk mechanical damage. Mineralogical changes at high temperatures are key to understanding the overall mechanical behaviour. However, most studies to date were carried out after rock specimens were heated to a target temperature and cooled down to room temperature. Therefore, these studies are missing the observation of the actual mineral processes during heating. This paper aims to compare mineralogical changes in crystalline rocks during heating by means of XPS and different XRD techniques. Samples of four different granitoids were heated to several temperatures up to 1000 °C to evaluate their chemical and structural changes. Results show how standardised thermal expansion coefficients are not a suitable indicator of the bulk effect of high temperatures on rocks. Results also show how thermal expansion estimations from XRD lattice measurements may be an alternative to bulk dilatometric tests, as they can be performed with limited sampling, which may be necessary in some studies. Nevertheless, XRD and XPS results need to be interpreted carefully in relation to the bulk effects of temperature increase in the rocks, as the structural behaviour may seemingly contradict the macroscopic effect.

1. Introduction

Fire is a major catastrophic event for rock outcrops and stone structures, as it can generate both immediate and long-term damage [1,2]. The damage generated by fire on rocks is relevant to several fields, such as Geomorphology, Built Heritage, as well as Civil Engineering and Engineering Geology. Recent events such as the Notre Dame of Paris fire, Brazil’s National Museum [3], or the increasingly frequent summer fires in southern Europe illustrate the importance of the impact generated by fires. Moreover, climate change scenarios predict an increase in the frequency of these events [4,5,6].
Although ashes, fumes, and gases also generate different effects on rocks during a fire [7], temperature increase is arguably the main factor causing short-term mineralogical changes during a fire. Early observations [8] noted the forest fires as a major factor causing scaling of rocks.
Previous research on the effects of fire on rocks have often compared the decay experienced in real fires to the effect of heating rocks in a laboratory [7,9,10,11]. Thus, most studies on the effects of fire on rocks have focussed on how rock properties change with temperature after heating sound centimetric rock samples in an oven, e.g., [12,13,14]. However, sometimes this kind of experimentation using a number of centimetric samples of a specific rock is not possible, particularly if the study deals with built heritage properties and the original quarries cannot be located or are exhausted.
Most studies to date have focused on the macroscopic effects of temperature increase on rocks. The most noticeable changes a rock exposed to heat undergoes are colour variation and cracking (and an overall volume increase because of cracking). Colour parameters, such as chroma and lightness, change in quartz and feldspar due to microcracking development [14]. Hue change is also noticeable in mica, clays, and iron oxides mainly due to iron thermal oxidation, which causes yellowing and reddening [12,14,15,16,17,18,19]. Volume increase and roughness changes as a consequence of thermal expansion have been also evaluated [14,20,21].
One of the main objectives of heating tests of rocks is assessing how their cracking dynamics and strength decrease with temperature [22,23,24]. For this purpose, previous research used non-destructive indirect methods such as p-waves velocity, capillary water uptake, and porosity variations [12,13,19,25,26,27], as well as direct methods such as compression or flexural strength tests [24,28,29]. Most of these tests were carried out after the rock specimens were heated to a certain target temperature and cooled down to room temperature. Therefore, they missed the observation of the actual mineral processes during heating and at the target temperature. Thus, it was necessary to develop a methodology that allowed measuring dilation during the heating stage to understand the processes of microcracking and thermal expansion.
All rock types are prone to decay at high temperatures. However, porous friable sedimentary rocks tend to exhibit less noticeable mechanical damage than particularly compact rocks with low porosity, especially polymineral rocks such as granites [9,30]. Even weathered granites with high porosity resist high temperature better than low porosity healthy ones [14]. It is well known, for example, how sandstones may show increased strength if they are heated up to temperatures near 400 °C–500 °C, whereas the strength decreased when they are heated up to temperatures higher than that [15,18,22,28,31,32]. Granites accommodate crystalline and pre-existent fissures from 60 °C and up to approximately 200 °C, although irreversible damage is observed from 400 °C and in the quartz transition temperature [25,26,33]. However, mineral behaviour during heating is less understood [14,17].
Within granitic rocks, differences in their integrity for the same heating procedure were observed [14], which can be due to the variables such as mineral proportion, weathering degree, mineral size, or mineral boundaries, among others [10,14,27,34,35,36]. With heating, mineralogical changes and associated thermal expansion mismatch are the main causes for cracking and, in turn, bulk strength loss.
In summary, mineral transformations during heating are the main cause of structural and colour changes after heating. Therefore, the aim of this paper is to improve the knowledge of mineral changes and thermal expansion during and after heating, in order to understand the processes of rock damage caused by heat during a fire. In addition, this study aims to validate the use of changes at the mineral scale during heating to estimate the behaviour of rocks in cases where it is not possible to get centimetric samples of rocks to perform standardised rock thermal expansion tests (as it is the case, for example, of heritage properties).
For this purpose, four granitoids with differences in mineralogy and texture were heated up to 1000 °C and their chemical and structural changes evaluated. Each mineral was evaluated individually before and after heating by microscopical and chemical techniques, and the lattice changes and thermal expansion were measured during heating. Finally, the rock thermal expansion was calculated from mineral data.

2. Materials and Methods

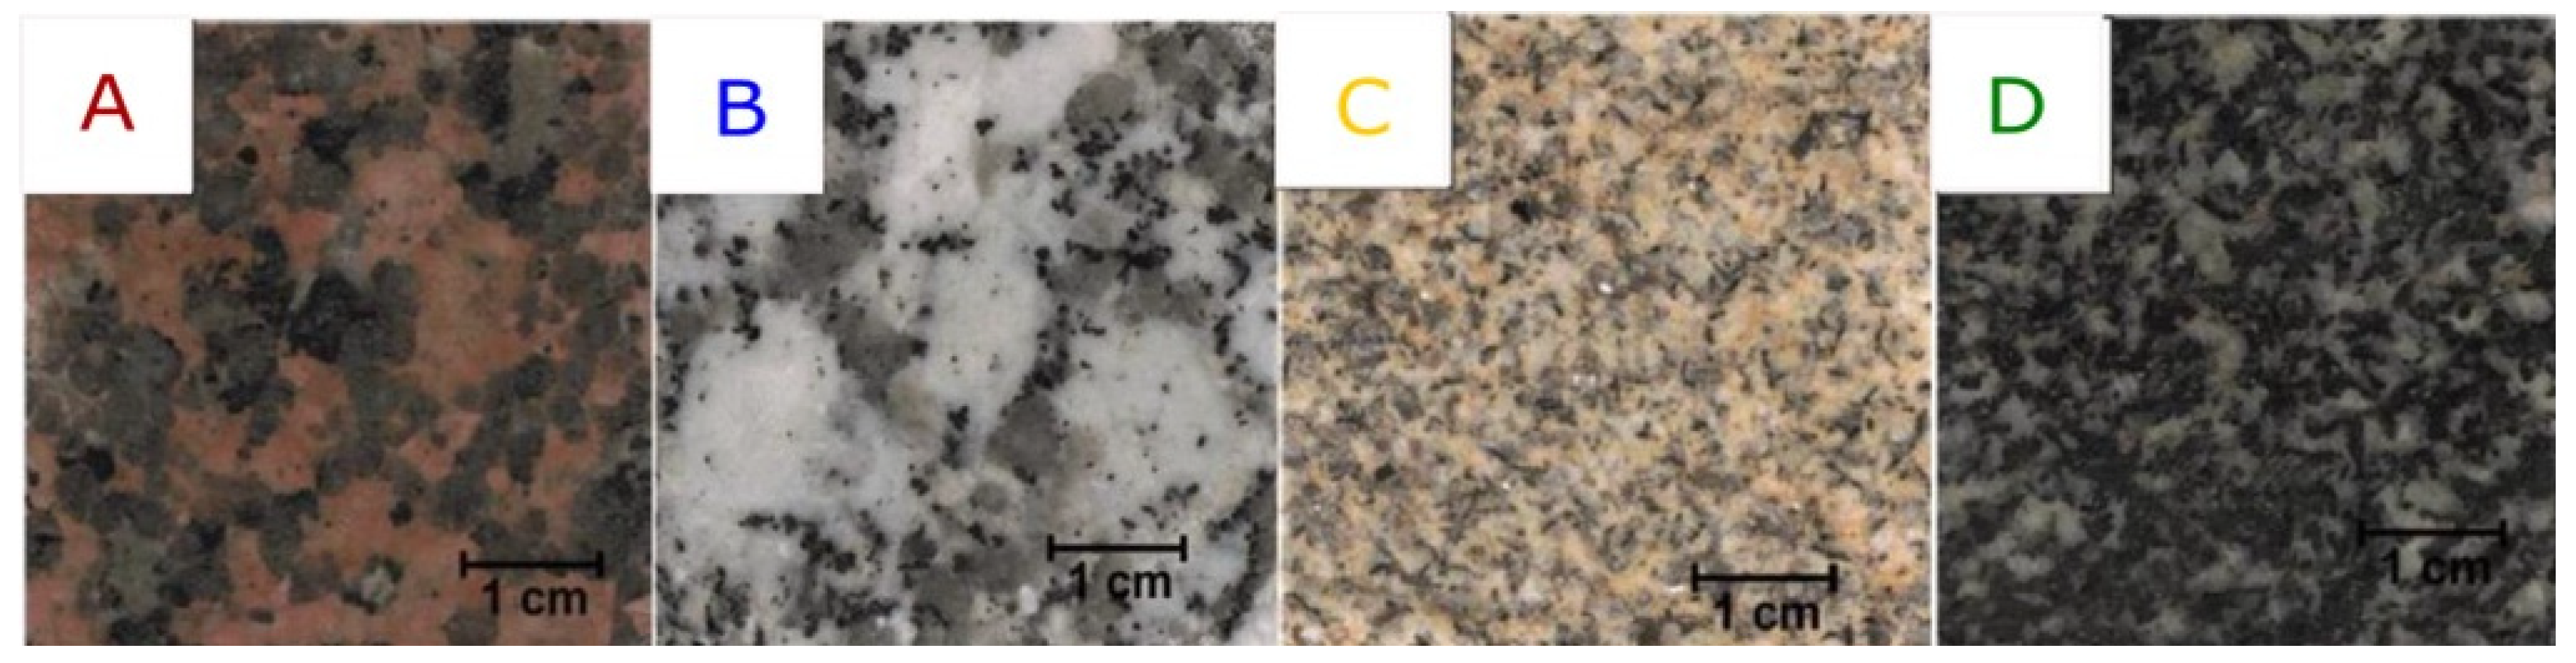
Four granitoids were selected for this study, which correspond to building stones, known commercially as: Eagle Red (ER), Grissal (G), Golden Sky (GS), and Negro Galicia (NG) (Figure 1). These building stones were selected to cover a range of mineralogy, grain size, colour, and intrinsic weathering degree. ER is quarried in Finland, and the other three types are quarried in the Galician Region (northwest Spain) [27]. These last three are a set of post and syn-kinematic Variscan granites located in the inner sector of the northwestern part of Iberian Massif, in the so-called Galicia-Tràs-Os-Montes zone.
Eagle Red (Figure 1A) is an alkali-feldspar granite with red feldspars and rounded quartz. This stone is quarried in the southeast of Finland, and it corresponds to the set of “Rapakivi granites”. It forms an elongated discordant intrusion orientated E-W dated from Proterozoic.
Grissal (Figure 1B) is a monzonite with grey feldspars. It belongs to the calc-alkaline post-kinematic granites. It is a circumscribed pluton with a net contact with the metasediments, and its deformation is not significant.
Golden Ski (Figure 1C) is a yellow fine-grained monzonite characterized by the presence of two kinds of mica and a noticeable degree of weathering. It is a peraluminous syn-kinematic granitoid located in areas of high metamorphic degree. The pluton is elongated, with mineral orientation following the Hercynian direction.
Negro Galicia (Figure 1D) is a tonalite of fine grain size with biotite and amphibole as dark minerals. It belongs to the calc-alkaline syn-kinematic granites, and it is a post-tectonic hypabyssal rock assigned to the “Basic Dikes” unit.

2.1. Experimental Setup

Five slabs of 7 × 4 × 2 cm of each of the four granitoids types were heated to different target temperatures up to 1000 °C (200, 400, 600, 800, and 1000 °C) in a NABETHERM L9/517 oven. A different sample of each of the four granitic rocks was utilised for each target temperature. A step 6 °C/min heating ramp was used to facilitate thermal cracking and the target temperature was maintained for 3 h to ensure the sample was heated uniformly. After this, the oven was turned off and the samples cooled freely to room temperature. Each sample was placed in a porcelain cup to allow recovering loose fragments if the sample crumbled due to thermal cracking and to avoid contamination. Once the samples cooled to room temperature, the samples from tests at each target temperature were analysed and chemical and structural changes after heating assessed.

2.2. Materials Characterisation

Polarizing Microscopy: Thin sections of the fresh granitoids were observed with a Nikon Labophot 2 polarizing microscope. Minerals were identified and quantified, and cracking patterns were characterized.
SEM + EDX: Samples were observed with a scanning electron microscopy (SEM) Hitachi S3000N with an EDS detector BRUKER XFlash 3001 for microanalysis and mapping before and after heating at 1000 °C.
FRX: Elementary chemical analysis was performed with an X-ray fluorescence device PHILIPS MAGICX PRO PW2400 on 30 g of powder of each fresh granitoid. The results were analysed with the SuperQ software to obtain an accurate quantification. In addition, mineral analysis was carried out with an Orbis Micro-XRF Analyzer EDAX. This technique and equipment allowed focussing analysis areas as small as 10 µm and without the necessity to reduce the sample to powder. Thus, the minerals from the fresh and 1000 °C heated stones were analysed individually. Three measurement points were selected for each mineral and temperature and the average was calculated.
XRD: Mineral composition was determined by X-ray diffraction. The equipment used was a Bruker D8-Advance with an X-ray generator KRISTALLOFELX K 760-80F whose copper anode (Cu K alpha 0.15418 nm) allowed us to obtain the data in the 2Theta interval 4–60°. The results were treated with the software XPowder Ver. 2010.01.42PRO. For the analysis, 30 g of powder from the sound stone were used. This equipment has a Göebel mirror, which allows a high temperature chamber to heat the sample and measure it simultaneously. Thus, each granitoid was heated up to 1000 °C and the XRD spectra analysed approximately each 200 °C. Chemical and structural variations were quantified and compared with bibliographical data for discussion of thermal expansion.
XPS: Mineralogical transformations such as the oxidation state, binding energy of the different elements, and the concentration within the sample were analysed with X-ray photoelectron (XPS) AVG-Microtech Mutilab 3000 system equipped with a hemispherical electron analyser with nine channeltrons (with a step energy of 2–200 eV) and a X-RAY radiation source with Mg and Al anodes. A part of each granitoid was reduced to powder and measured. In addition, micas were separated and studied independently. Molar proportions of C, O, K, Fe, and Ti were selected as measurement parameters before and after heating. Five measurements were recorded in each sample. The detector quantifies the number of photoelectrons emitted by the sample after being triggered with the X-ray source. Its speed is related with the energy needed to extract them from the atom, termed as binding energy (BE). This energy is characteristic of each element. The BE value is also modified by the chemical environment of the atom that allows us to distinguish between species with different oxidation states. Because core level electrons in solid-state atoms are quantized, the resulting energy spectra exhibit peaks characteristic of the electronic structure of atoms in the sample.
Linear thermal expansion: These coefficients (α) were determined using a dilatometer and heating the samples from room temperature up to 90 °C with a ΔT = 70 °C. The used dilatometer allows us to measure the deformation of six samples simultaneously, with a time interval of 20 s. The samples used were six cylinders of 50 × 15 mm of each of the four granitoids, two of each direction of the space. The software used was DasyLab Voltmeter 5.6 [37]. Five cycles of heating-cooling were performed with the following steps. The linear thermal expansion was obtained from the average of the five cycles.
  • S1: Sample stabilization at 20 °C for 1 h.
  • S2: Heating up to 90 °C with a constant rate of 1 °C/min.
  • S3: Stabilization at 90 °C for 6 h.
  • S4: Cooling down to 20 °C with a constant rate of 1 °C/min.
  • S5: Stabilization at 20 °C for 5 h.
Mineral thermal expansion: The XRD instrument is equipped with micro-XRD, which allows for analysing a sample without powdering by centring a µm-diameter spot on a single crystal of interest.

3. Results

3.1. Petrographic Description

Main features of the selected granitoids are shown in Table 1.
Eagle Red (ER) is a medium-coarse grained reddish alkali-feldspar-rich granite quarried from the Wiborg batholite in the south of Finland. It is characterized by almost 50% reddish feldspar, which gives it its commercial denomination. Alkali feldspar is orthoclase or microcline in similar proportions and with pertitic transformation. Alkali feldspars showed mainly inter and intracrystalline fissures. The quartz proportion is approximately 30% and displays equidimensional habit. Quartz is remarkably fissured, with mainly intra and transcrystalline fissures, often filled with secondary minerals. Plagioclase comprises approximately 15% of the rock and has a euhedral habit and low weathering. Mica is mainly biotite and appears as small crystals accounting for less than 10% of the rock. Secondary and accessory minerals are muscovite, apatite, rutile, and chlorite (Figure 2).
Grissal (G) is a coarse-grained grey Calc-alkaline post-kinematic monzonite from the northwest of Spain. Quartz and alkali feldspars account for approximately 30% of the rock each. Alkali feldspars are either orthoclase or microcline, some of them with perthitic texture. Fissuration is mainly intracrystalline. Quartz is euhedral and of homogeneous size, with numerous fissures, mainly inter and intracrystalline. Plagioclase comprises almost 20% of the rock and it shows an advanced weathering degree in the nucleus and on the edges that are in contact with biotite. Biotite mica forms approximately 15% of the rock and it is deeply weathered (chloritization). It also exhibits numerous inclusions of zircon and opaque minerals. Secondary and accessory minerals are amphibole, chlorite, and sericite (Figure 2).
Golden Ski (GS) is a fine-grained peraluminous syn-kinematic yellow monzogranite. GS is quarried in southern Pontevedra (Spain). The main difference with the rest of the studied granites is its mineral orientation, shown mainly by micas. This monzogranite has only 15% of alkali feldspar, which is mainly orthoclase. Orthoclase is euhedral to subhedral, with intracrystalline fissures and weathered centres. Quartz is the main mineral (more than 30% of the rock), widely fractured with inter, intra, and transcrystalline fissures. Plagioclase forms approximately 20% of the rock and it is severely weathered to sericite and highly fissured. Mica is relatively abundant with approximately 20% muscovite and 10% biotite. The former shows tabular habit although some edges exhibited corrosion signs, whereas the latter shows euhedral habit and no evidence of chloritization (Figure 2).
Negro Galicia (NG) is a post-tectonic hypabyssal black tonalite assigned to “Basic Dikes” unit. NG is a homogeneous fine-grained stone (≈3 mm) quarried in northern Pontevedra (northwestern Spain). The mineral composition is more complex with 30% of mica and the rest equally repartitioned between quartz, feldspar, and amphibole-pyroxene. Alkali feldspar is mainly orthoclase, with rough boundaries due to its advanced weathering degree. Quartz showed intracrystalline fissuration with sericite from feldspars alteration filling the cracks. Plagioclase was widely fissured and altered to sericite, mainly in the nucleus. Biotite appeared forming 25% of the stone and muscovite only 5%. The first one showed slight chloritization and the second one tabular habit. Amphiboles showed euhedral habit and well defined cleavage plans (Figure 2).

3.2. Visual Differences after Heating

Visible changes were observed on the samples depending on the temperature, mainly as colour changes and fissuring [14]. The four granitoids showed a visible reddening in all samples heated to 400 °C and above, as well as some new fissures or a widening of the existing ones.
ER showed a whitening of quartz due to visible cracks in samples heated to 600 °C and above. The overall colour did not change much; whereas the cracking partially crumbled the sample heated to 800 °C and completely crumbled the sample heated to 1000 °C.
G was the granitoid that held together better, with only some slight reddening and thin but visible fissures in samples heated to 1000 °C. While both noted granitoids have a low proportion of mica, which diminishes mineral thermal expansion mismatch, ER has a quartz/feldspar ratio close to 1 (which leads to higher micro-stress) than G with a quartz/feldspar ratio of 0.37 [36].
GS exhibited a noticeable change, associated mainly to clay minerals oxidation. The quartz α to β phase transition at 573 °C did not lead to visible cracking in samples heated to 600 °C, probably due to a too short period at the target temperature. However, the cracking was obvious in samples heated to 800 °C and aggravated in samples heated to 1000 °C.
NG showed an aesthetical decay; mica and amphiboles became golden-brownish and, even if the sample heated to 1000 °C remained unbroken, the volume increase and the newly created fissures were clearly visible. The physical integrity of these two last granitoids was better than in the previous ones due to their higher mica proportion that accommodated the stresses caused by the mineral thermal expansion mismatch [14,36].
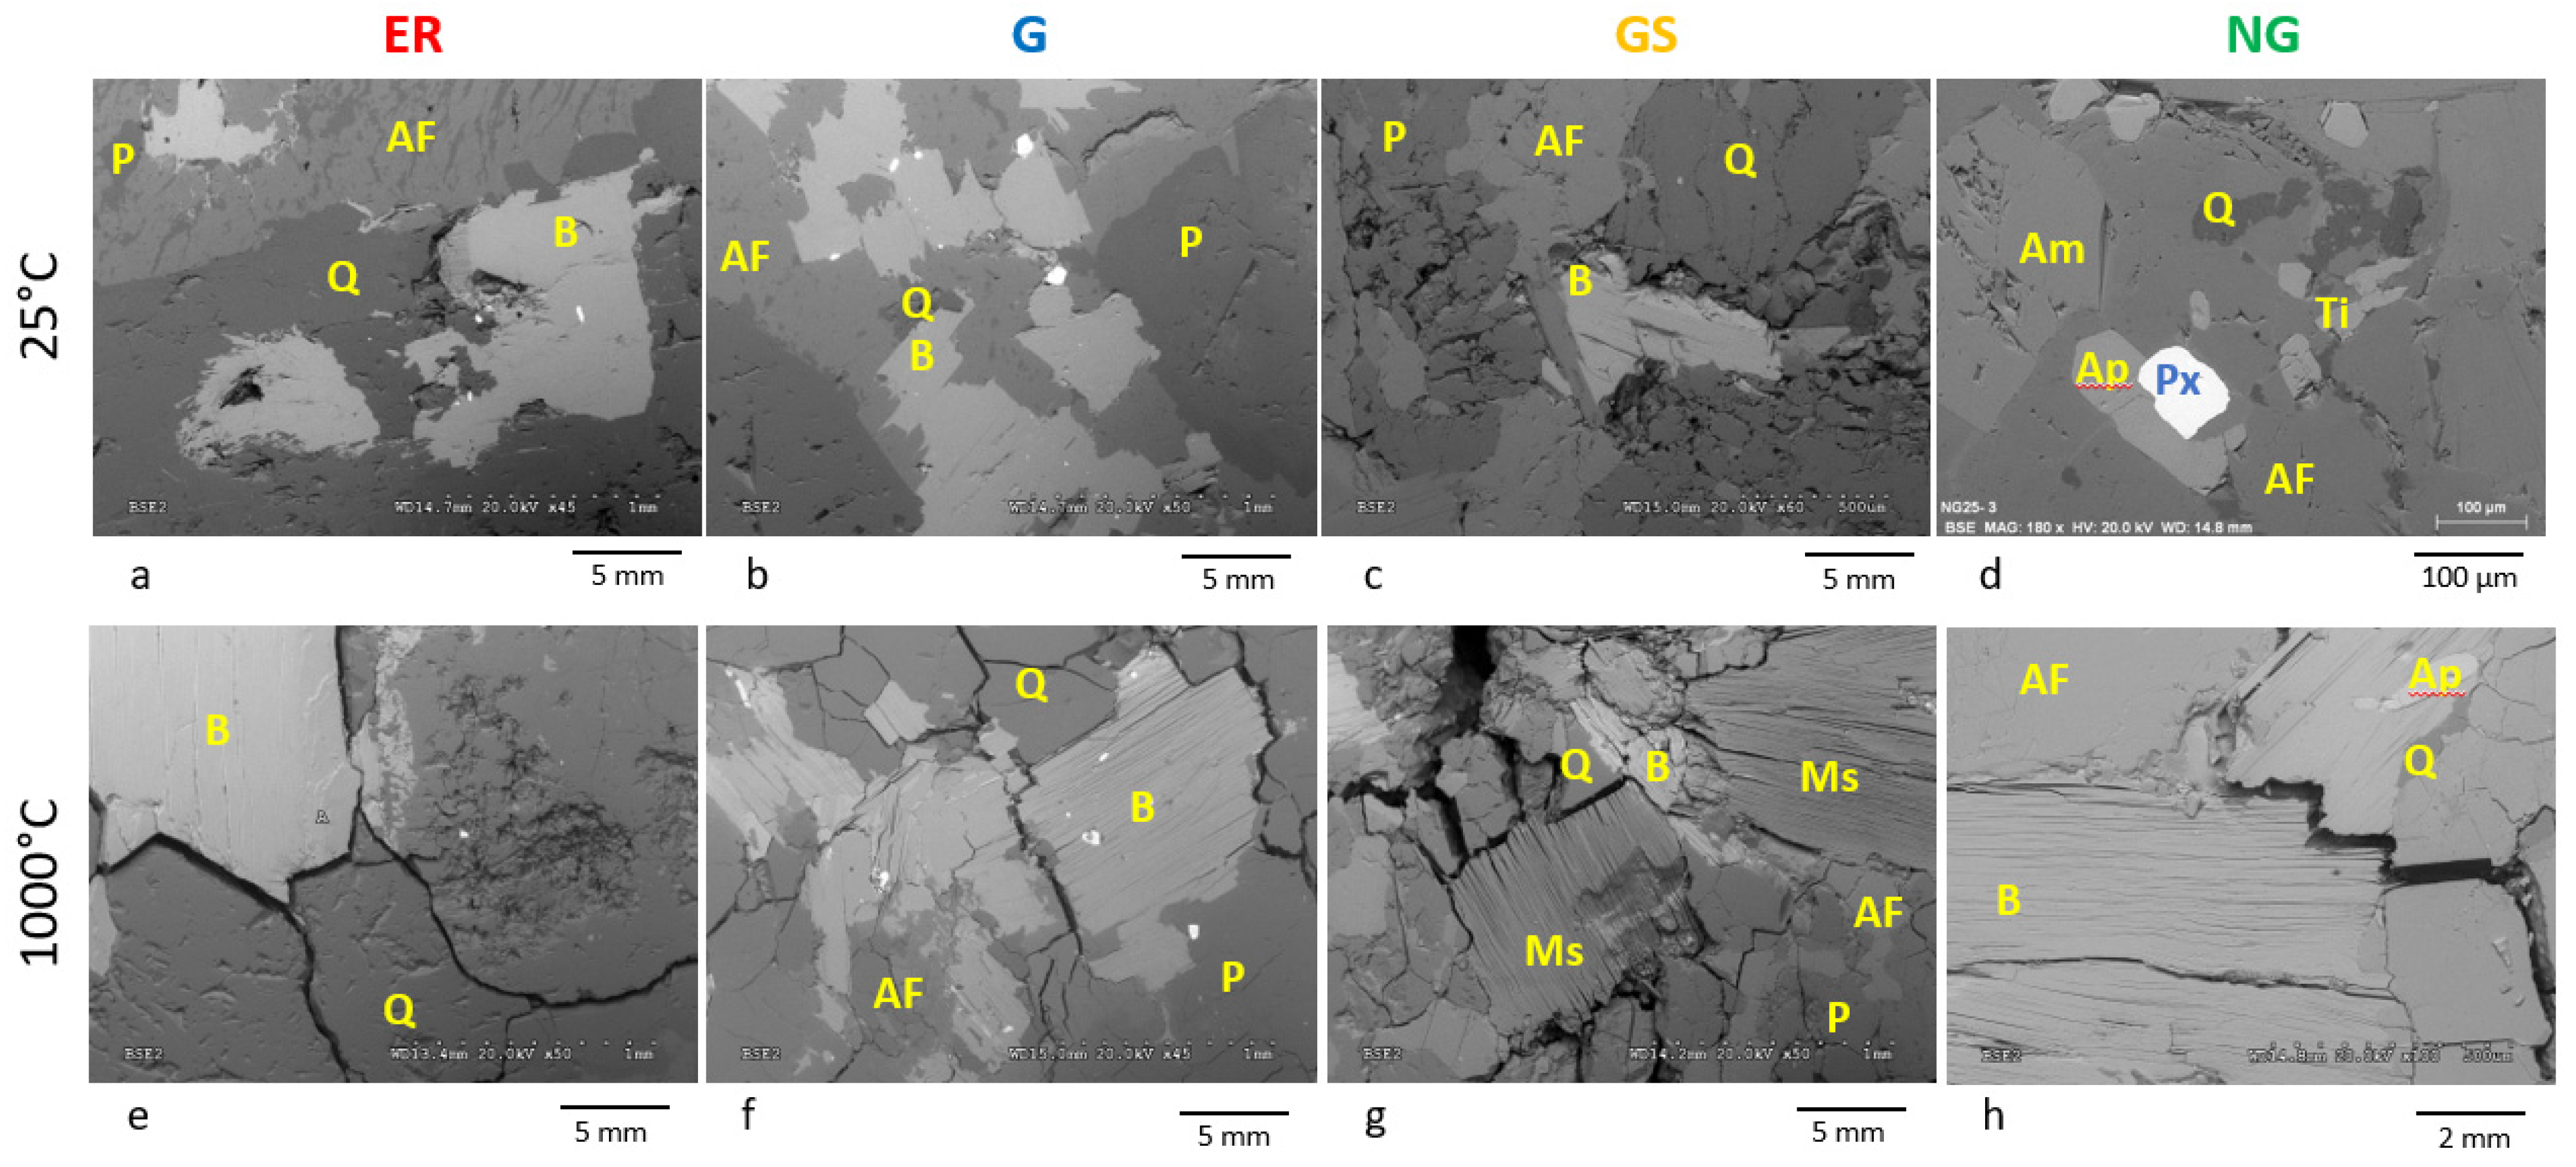
The physical differences before and after heating were evident under SEM observations (Figure 3).
As the ER sample disaggregated completely after the 1000 °C test, the observations were performed in samples heated to 800 °C. The alkali feldspar of ER was the lesser altered of the stone, even when intra and intercrystalline fissuration was evident. Quartz developed wide fractures (inter-, intra-, and trans-) as observed in Figure 3e.
Mica experienced a great change in all the granitoids, although it can absorb large stress without cracking, the high thermal expansion and contraction during heating and cooling produced open intergranular cracks and sheet opening (Figure 3f–h). Accessory minerals such as zircons or magnetite on NG also produced wide boundary cracks due to the differential expansion.

3.3. Chemical and Mineralogical Composition

The three major minerals: quartz, alkali feldspar, and biotite, were analysed before and after heating by µ-XRF in the ER, G, and GS granitoids. Plagioclase was not analysed because of its small size and weathering degree that could give misleading results. Muscovite was also analysed in GS granitoid. Biotite, titanite, and amphibole were the selected minerals in NG granitoid.
Table 2 shows the oxide composition of each mineral for each stone in the fresh state and the absolute difference after heating at 1000 °C. Before heating, quartz composition in ER and GS was purely SiO2, whereas in G, quartz showed impurities of feldspar. After heating, quartz showed a more heterogeneous composition, with up to 10% of its total composition mainly of Al and K oxides. This was particularly noticeable in the purest specimens before heating. Only G and ER showed variations in alkali feldspar after heating, consisting of a reduction in SiO2. Specifically, G showed an increase in K2O in this mineral, and ER an increase of 10% of MgO and the appearance of Fe2O3. Biotite showed variations in all granitoids, but it was not possible to establish a clear trend: for example, in GS SiO2 increased and MgO decreased, whereas in NG SiO2 increased and CaO decreased.
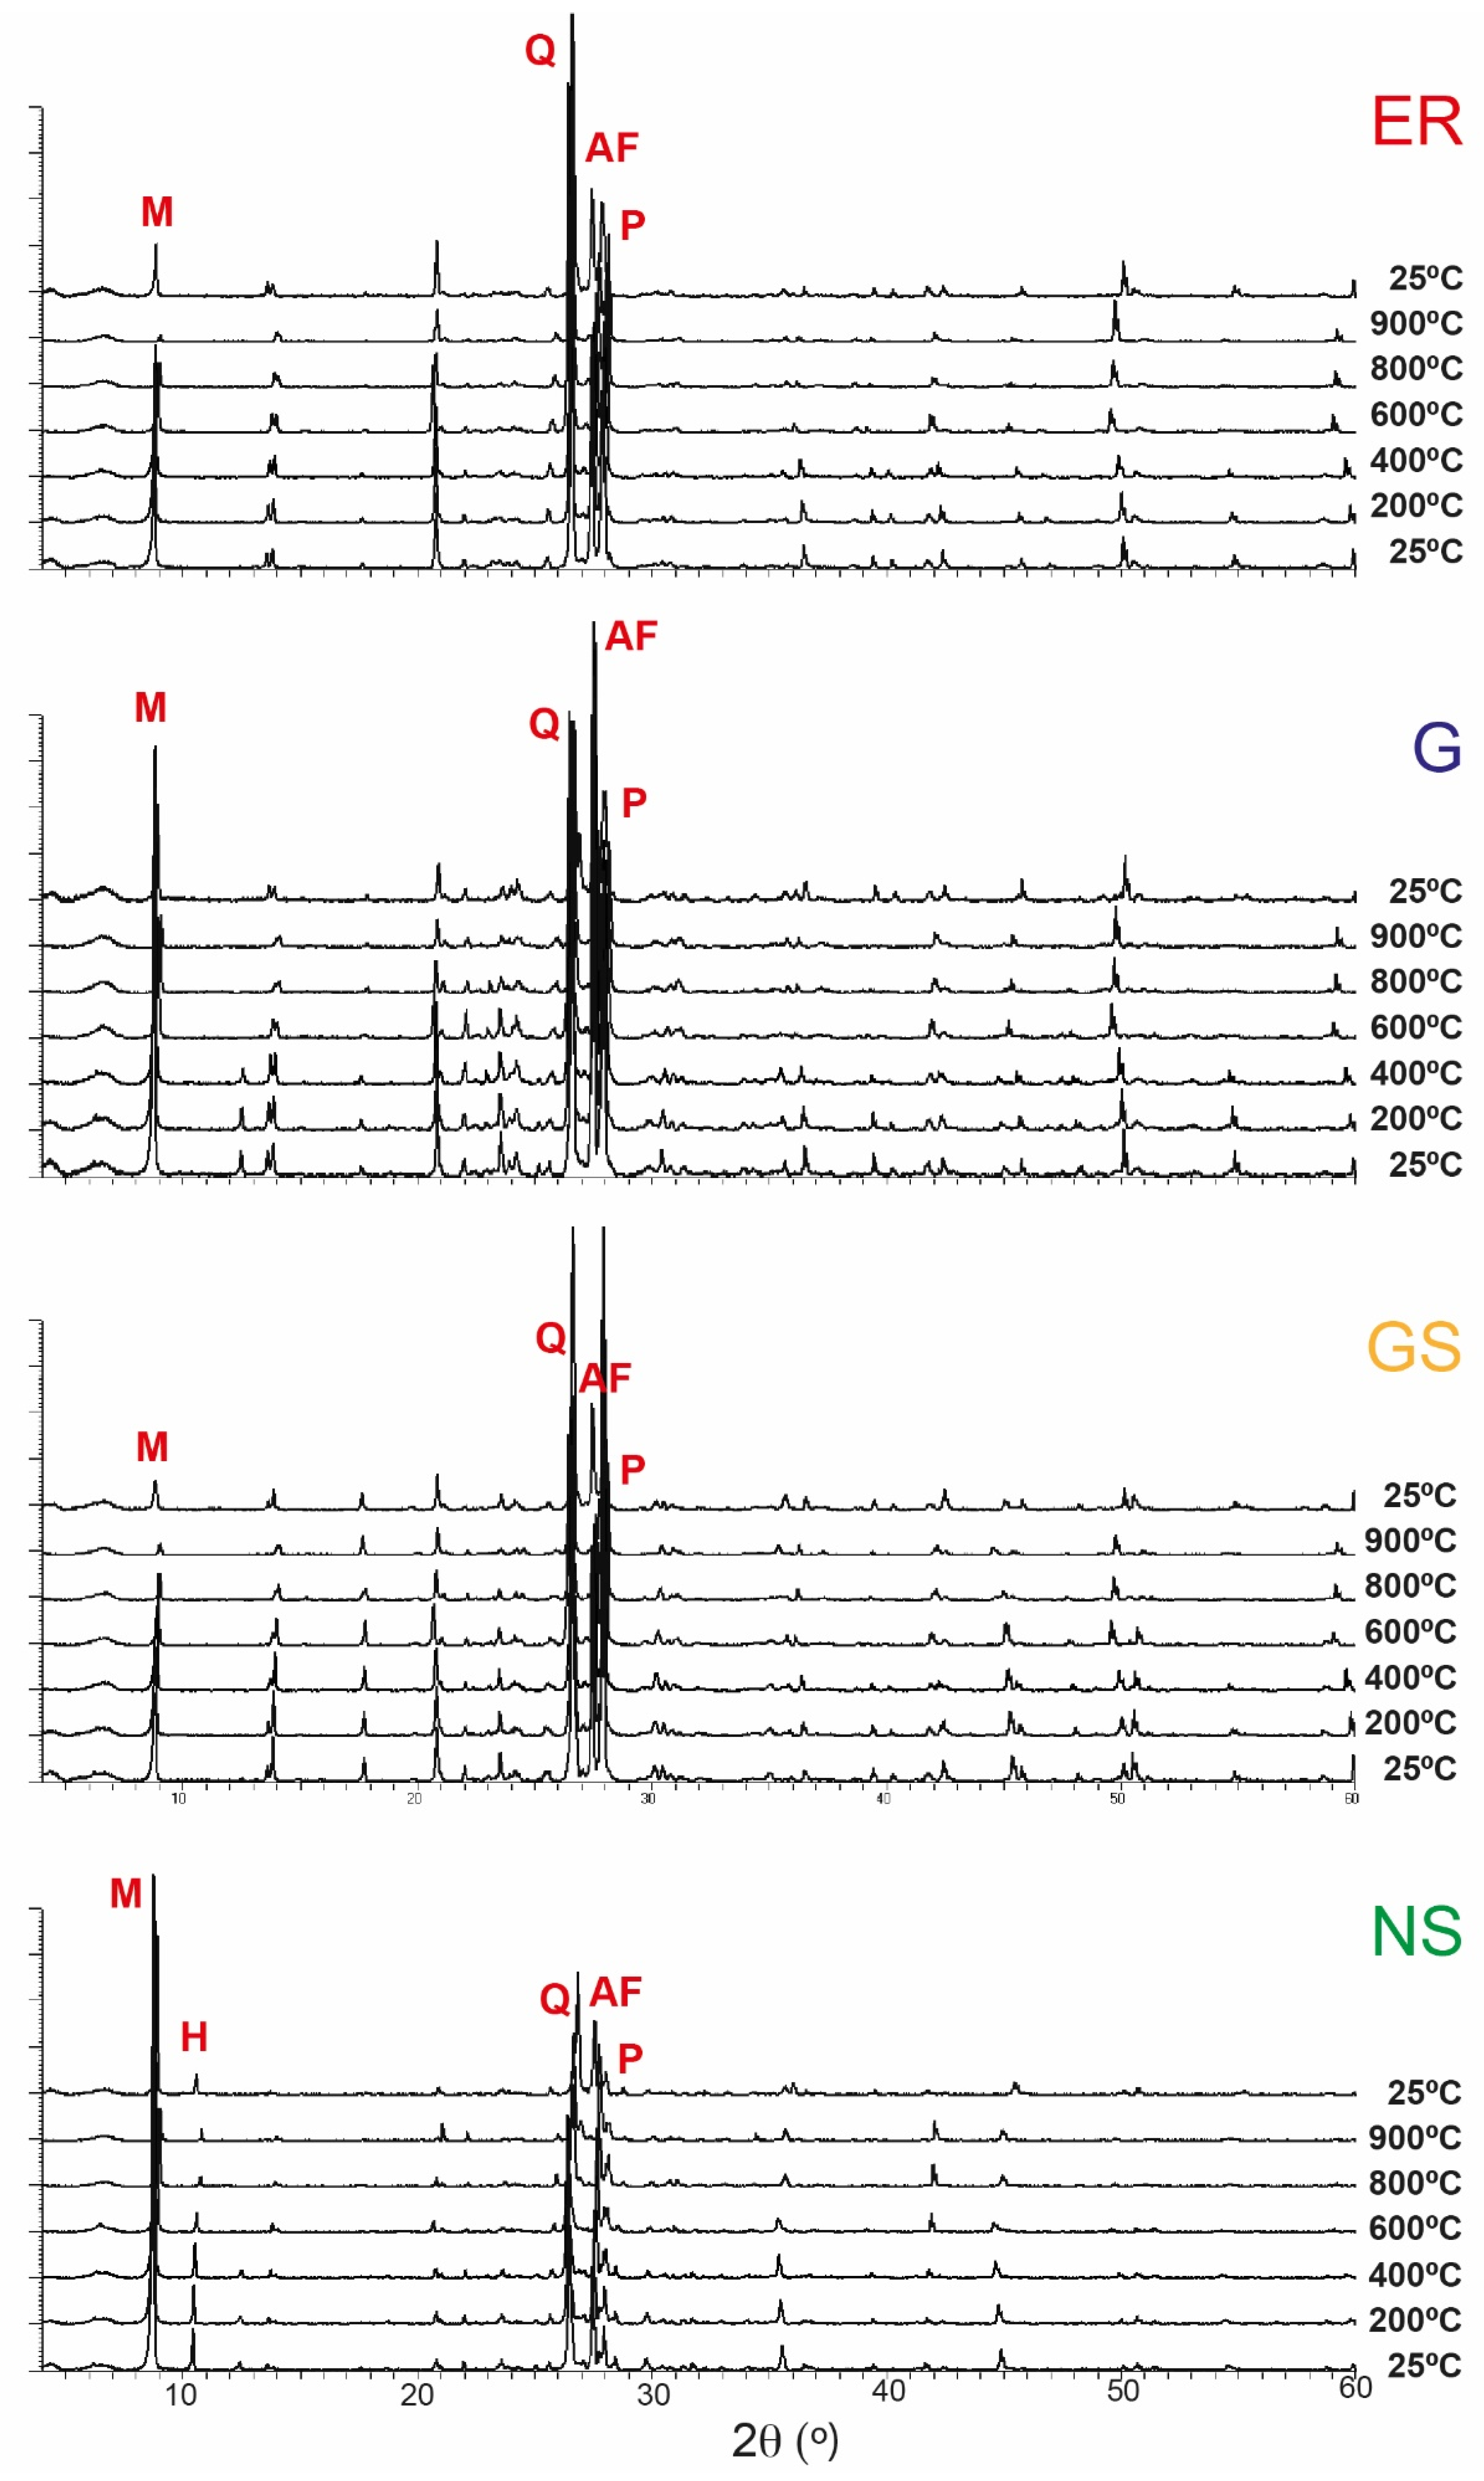
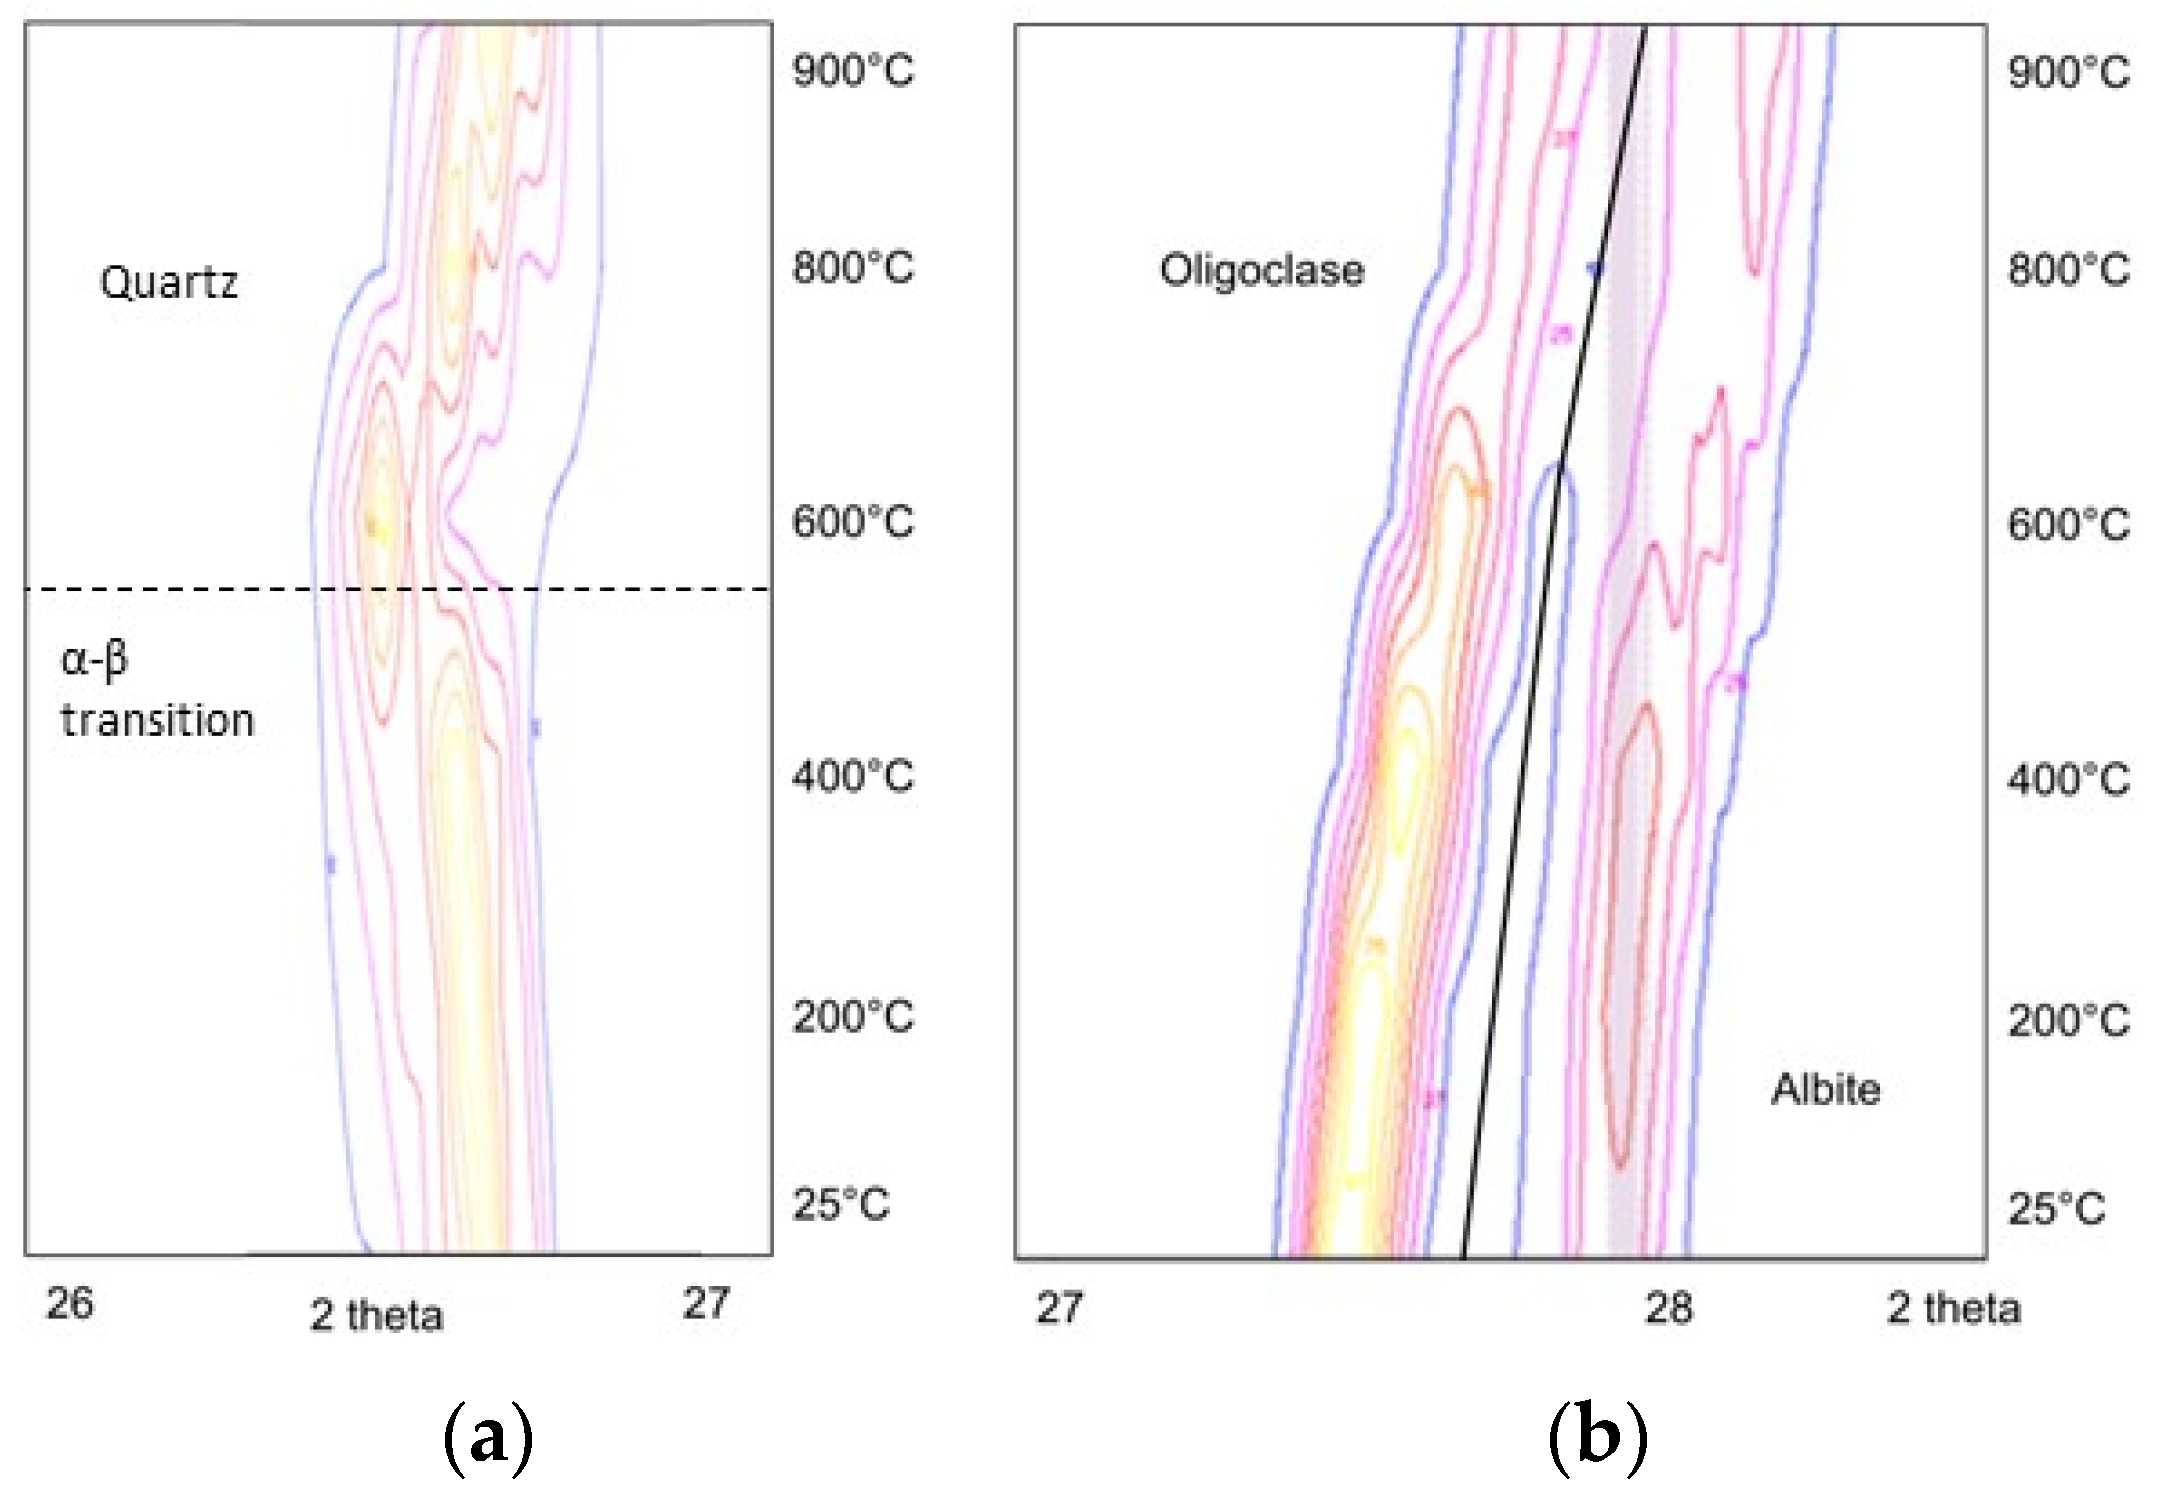
XRD analysis was carried out in powdered samples. The temperature was increased progressively up to 1000 °C and then cooled down to initial values for a final measure.
The variation in the peaks may show two different trends. If the peaks move laterally, that means a variation in the internal structure. A shift to higher diffraction angles reflects a decrease in the network spacing, that is, a contraction. If the peak changes in intensity, the mineral phase may experience a change, even becoming a different species.
Figure 4 shows XRD spectra for each granitoid subjected to an increase in temperature followed by a cooling down. An easily recognizable mica peak is found at approximately 9°, corresponding to the (001) plane. This peak moves towards higher angles with temperature, which indicates a contraction. In ER and GS, micas also exhibited a compositional change, recognised by a change of the peak intensity at the highest temperature, almost disappearing from the pattern. However, after cooling down, mica peaks appeared again, which implied the recovery of the original composition. Quartz and feldspars also showed a movement of their peaks towards an expansion. The mineral that experienced a higher dilation was plagioclase, followed by Q and finally by alkali feldspar. NG showed a variation in the hornblende peak. The mineral hardly dilated although it showed a decrease in intensity, almost disappearing at high temperatures. As in the case of mica, this mineral recovered with a return to initial conditions.
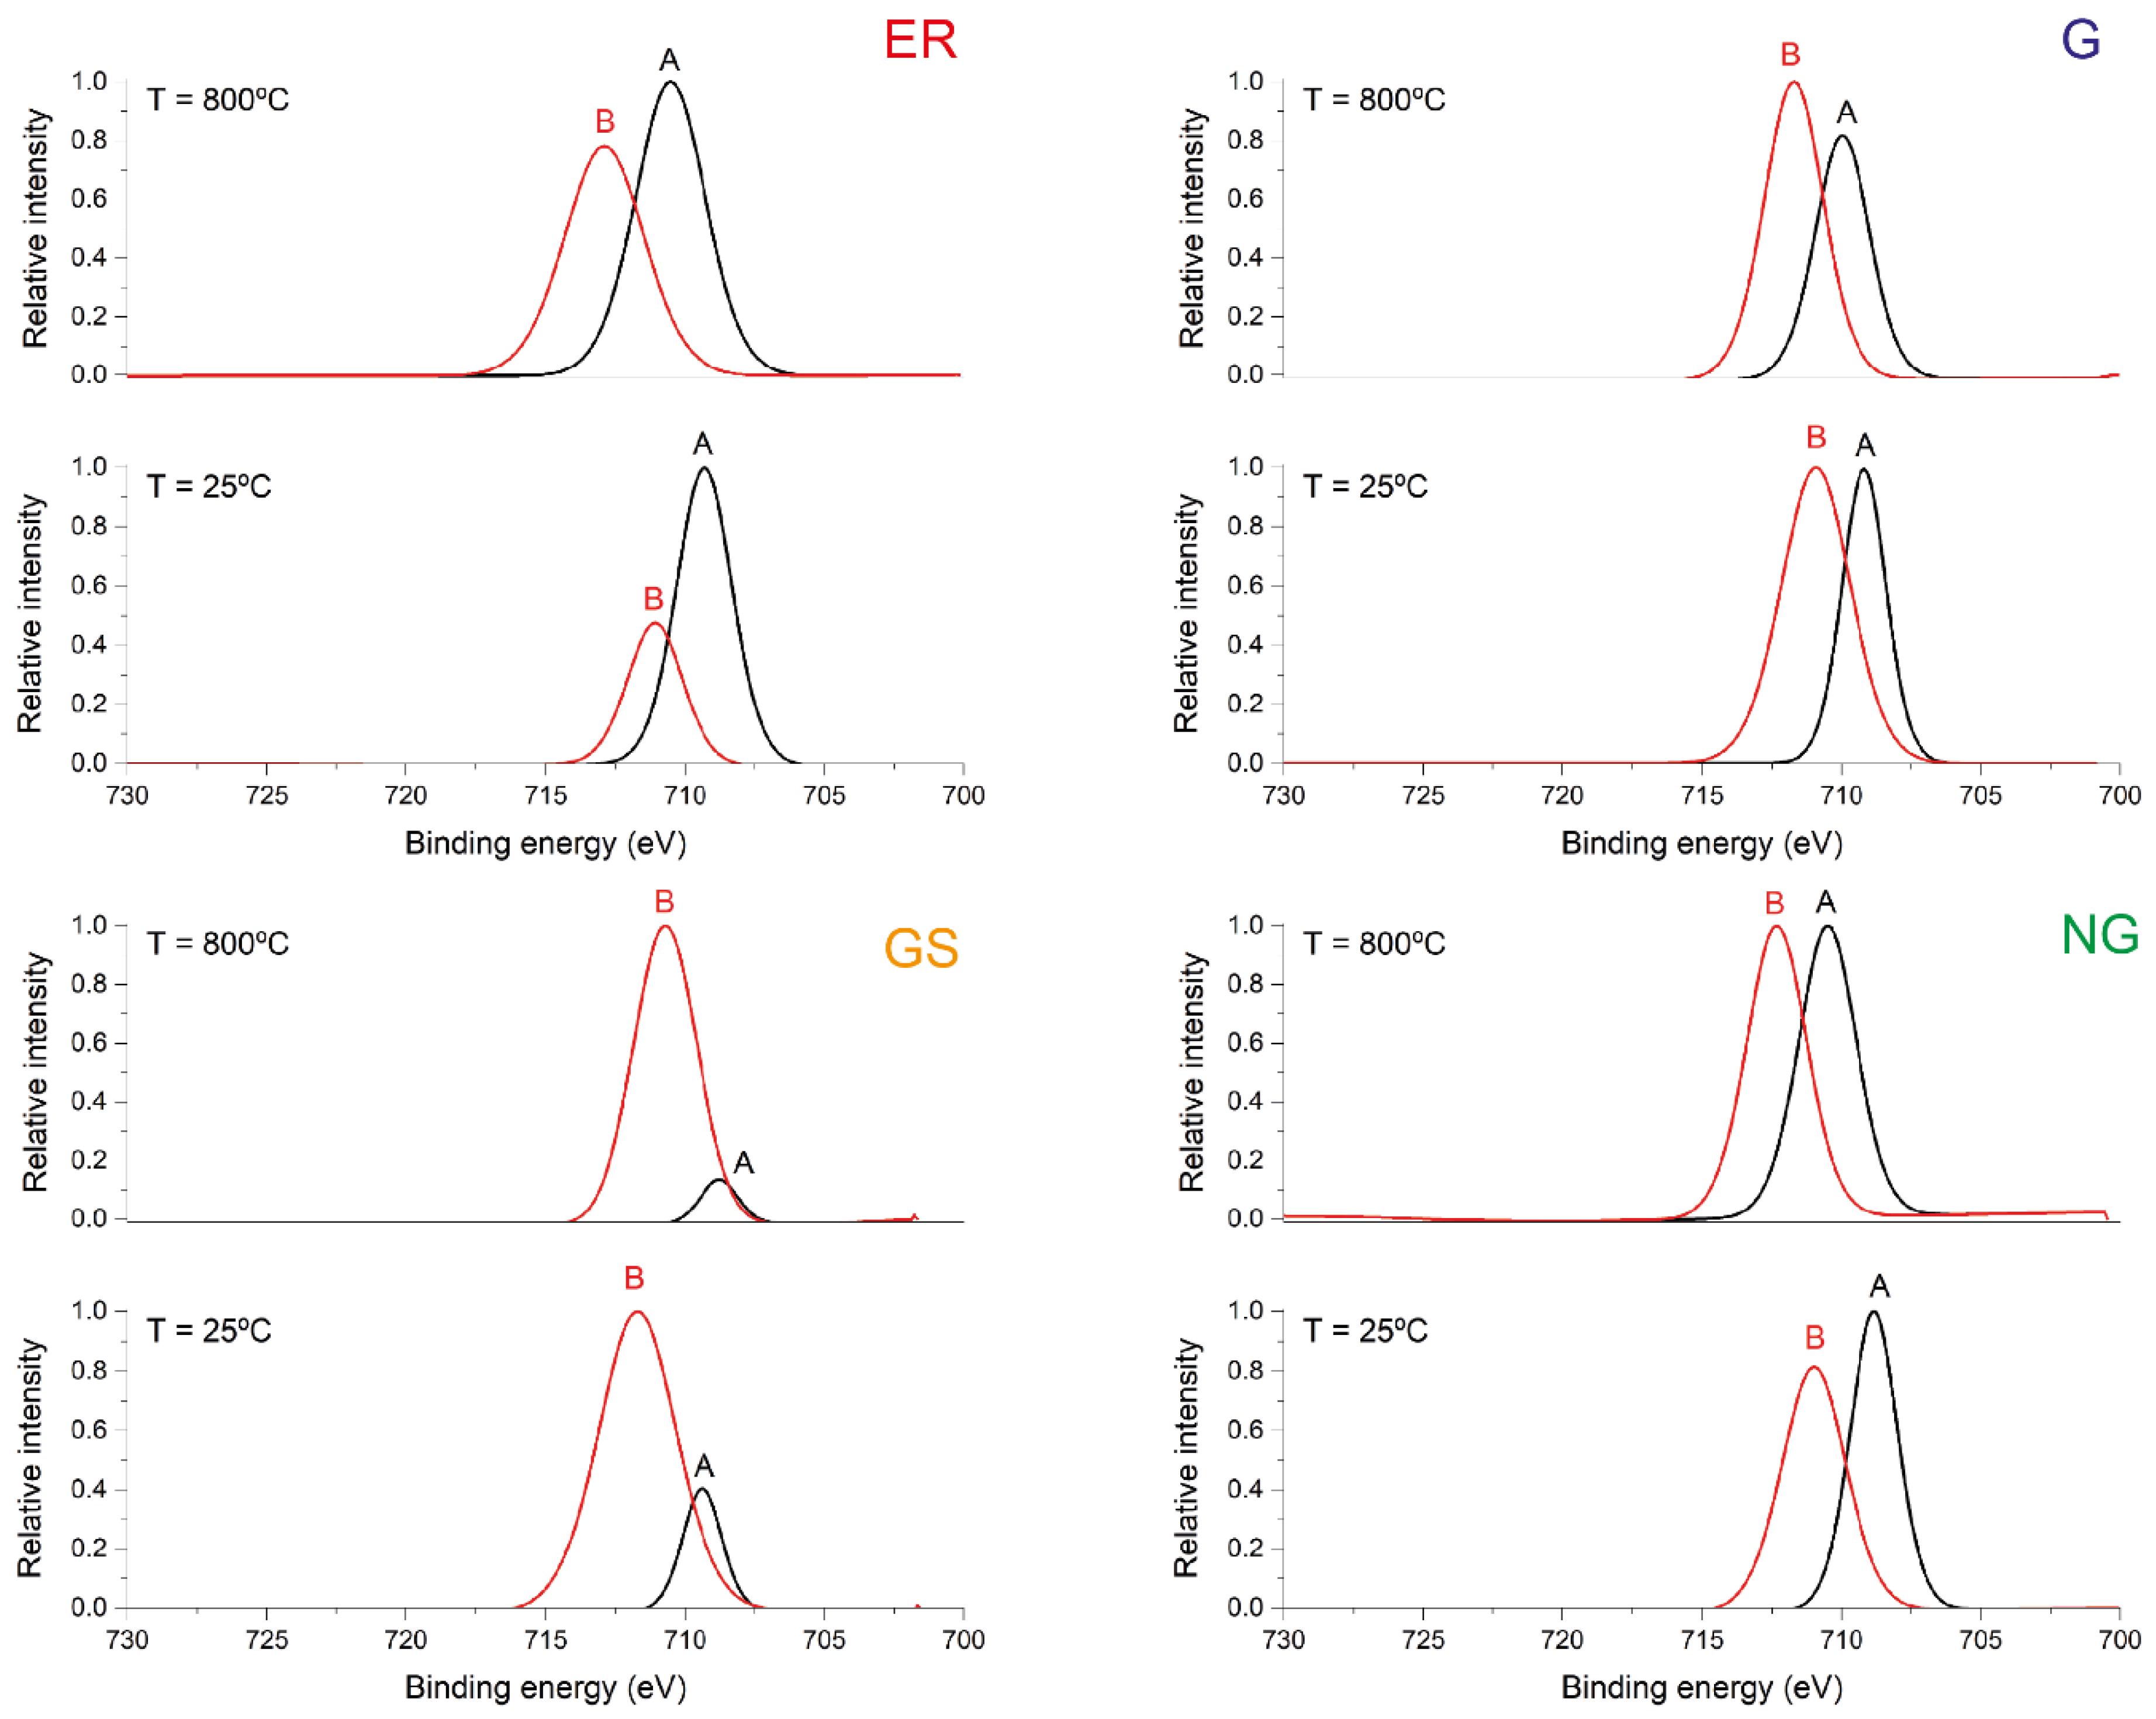
XPS analysis of the whole rocks shows different proportions of potassium, iron, and titanium, which are the key elements in the transformation by heating as observed in previous results. XPS allows us to observe the chemical changes in some of the key elements, especially the iron, which is sensitive to high temperatures [14].
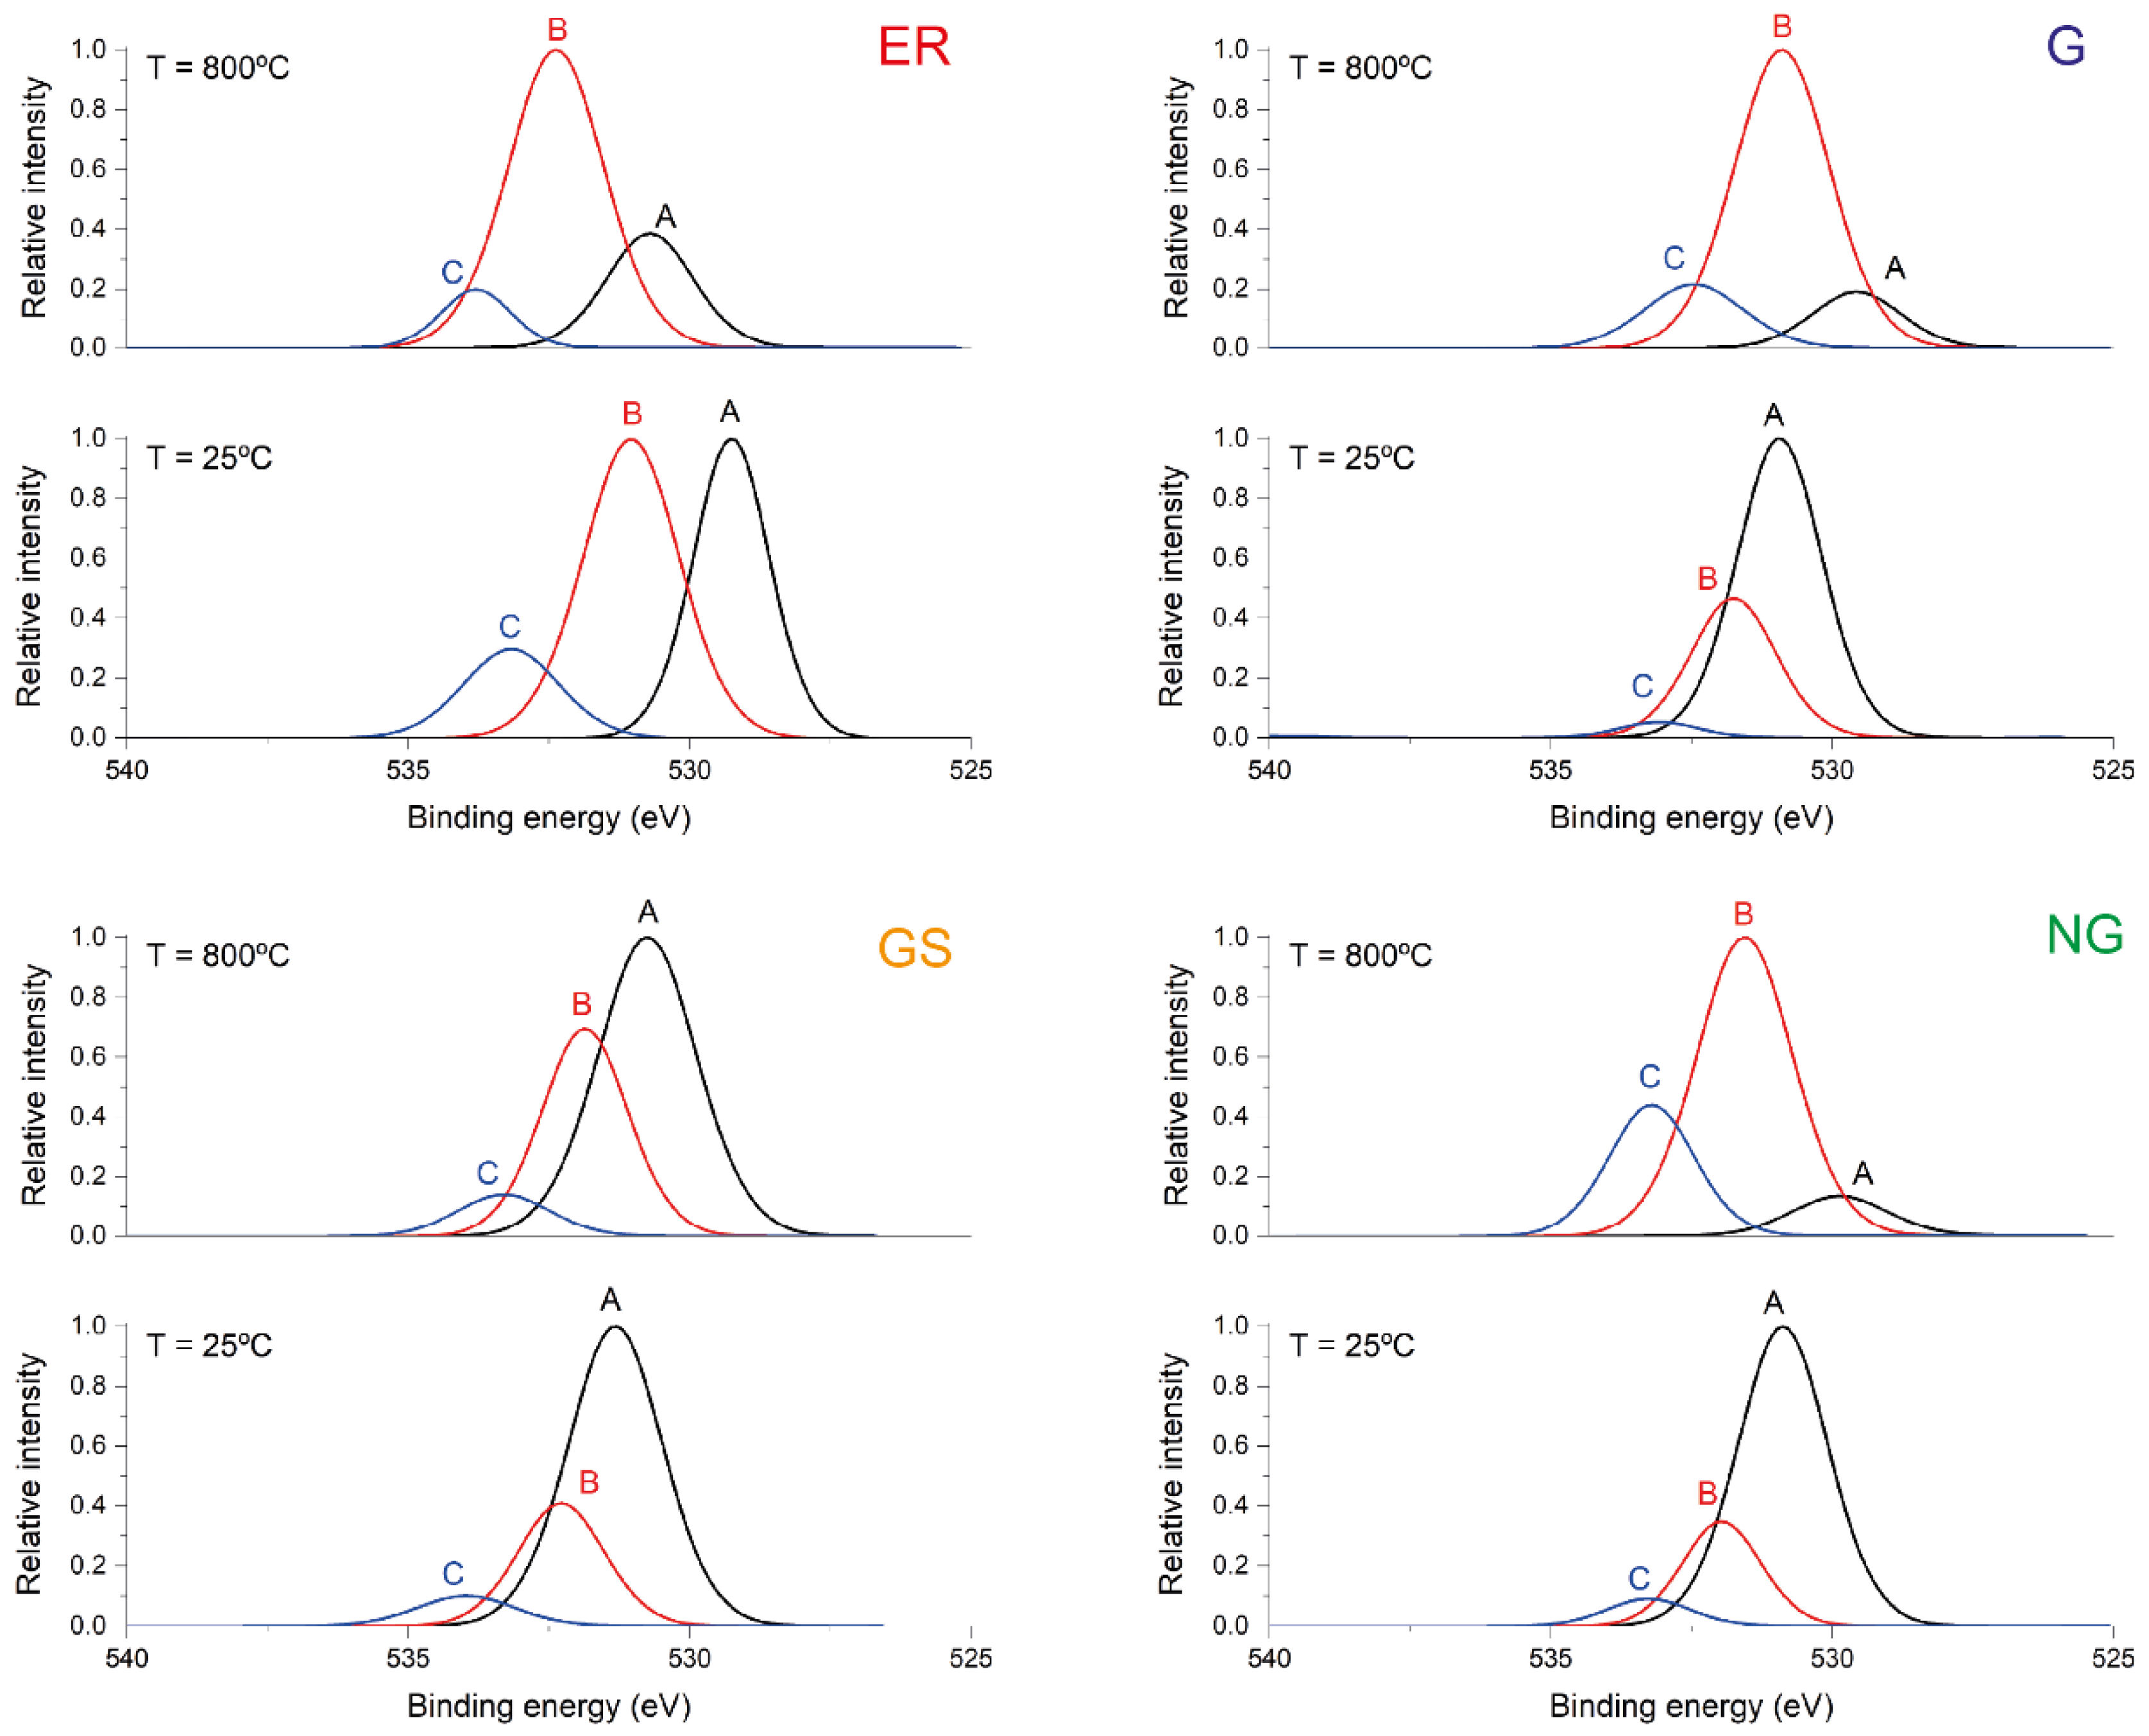
Regarding the iron content and the ratio of Fe/O, there is a general decrease in all the samples. That implies an increase in oxygen that corresponds to an oxidation. The region of the spectrum corresponding to high resolution iron 2p XPS transitions for fresh and 800–1000 °C heated rocks can be clearly deconvolved in three main peaks. XPS data analysis showed two main peaks on the spectra deconvolution corresponding to iron oxides. The peak A at approximately 709 eV of binding energy corresponds to Fe2+ and the peak at approximately 711 eV to the oxidized form Fe3+ [38] (Figure 5). The clearest way to confirm oxidation is the relationship between the A/B peak ratio (Fe2+/Fe3+ compounds). If oxidation takes place, Fe3+ should increase after heating and thus, Fe2+ and the relationship Fe2+/Fe3+ should decrease. Figure 5 has been normalized in the y-axis to better compare the iron behaviour and the differences between granitoids. In all of them, independently of the initial proportion Fe2+/Fe3+, the heating produced a clear increase in Fe3+ curve in relation to the Fe2+ one, as an indicator of an oxidation. GS showed a strong oxidation state at the fresh sample due to its higher initial alteration and enhanced after the temperature increase. ER, with a predominance of Fe2+ at the fresh state, narrowed to the oxidized state after heating. G and NG showed a closer proportion of both types of iron, although the proportion of Fe3+/Fe2+ was higher after heating in both cases.

3.4. Microstructural Analysis

3.4.1. Rock Thermal Expansion

The results from the thermal expansion measurement at 90 °C are shown in Table 3. AD was introduced as the anisotropy index (AD): ɑ min/ɑ max [39]. In general, the four granitoids showed thermal expansion values between approximately 8 and 10 × 10−6 mm/m. ER showed the lowest thermal expansion in two of the directions and a high anisotropy (0.83) due to the higher values in the Z direction. G exhibited variations in three directions, although with the lower values always in the Z direction. The anisotropy in this case was 0.85. The other two rocks GS and NG showed isotropic behaviour (AD > 0.9) without any preferential direction of expansion.

3.4.2. Mineral Thermal Expansion

Quartz, biotite, and plagioclase were assessed by this technique for each granitoid.
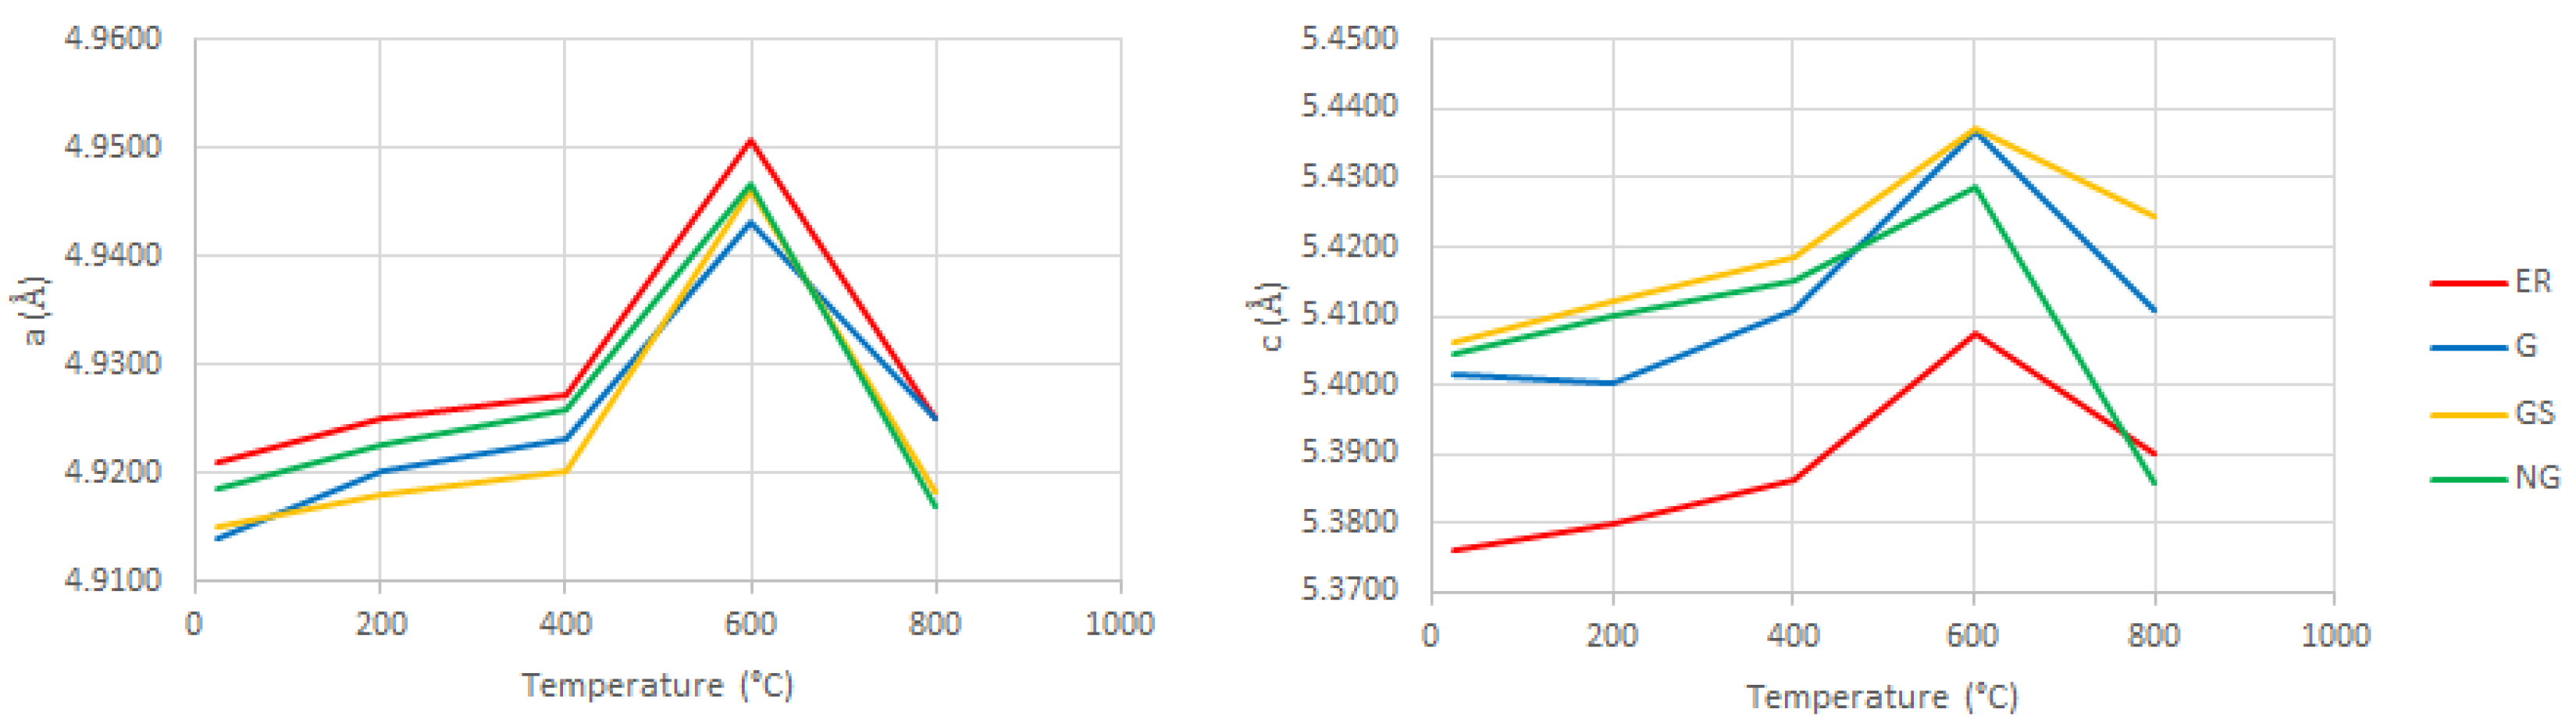
Quartz: The variation of the axis values with temperature were obtained by means of the software XPowder and adjusted to the trigonal system for samples heated to 600 °C and below and hexagonal system for samples heated to 800 °C (Figure 6). Both the a- and c-axis lengthen with temperature. The a-axis showed a very similar behaviour for the four rocks, with a progressive pattern up to 400 °C and an abrupt increase from 400–600 °C. From that point, that corresponded to the α-β transition, the a-axis contracted for all the granitoids. The c-axis showed a similar behaviour for ER and GS, although with different initial length. NG showed a greater contraction at 800 °C and G did not change when heated up to 200 °C in the c-axis.
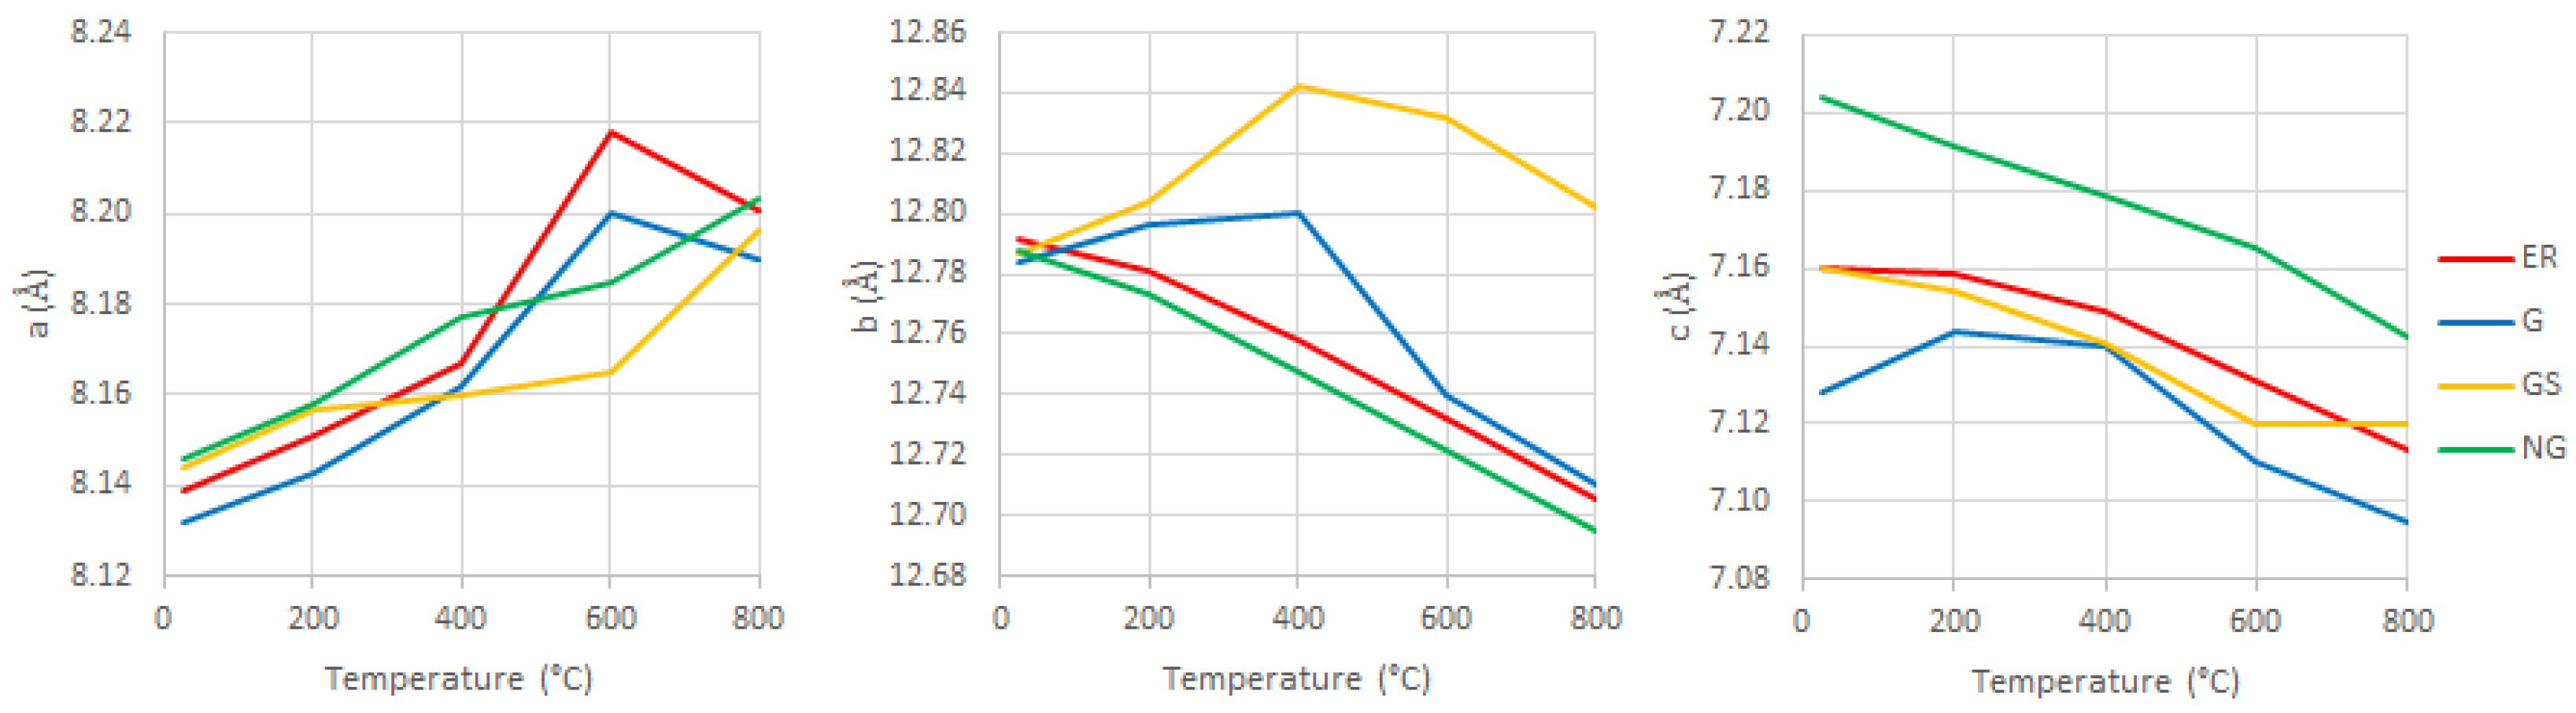
Albite was selected to assess the axis evolution (Figure 7). Due to the amount of small peaks and noise of this mineral, the adjusting was first done with peaks (002) and (040) clearly defined, and that give information about the b and c parameters, and thus the peaks for (111), (1–11), and (200) gave enough information about the a parameter. For a-axis, the trend was an increase with temperature, with ER and G that contracted slightly after 600 °C. The b-axis showed two different behaviours, a progressive decrease with temperature for ER and NG and an increase up to 400 °C followed by a contraction for the other two rocks. Albite also contracted progressively along c-axis except for G, which showed a stepped contraction.
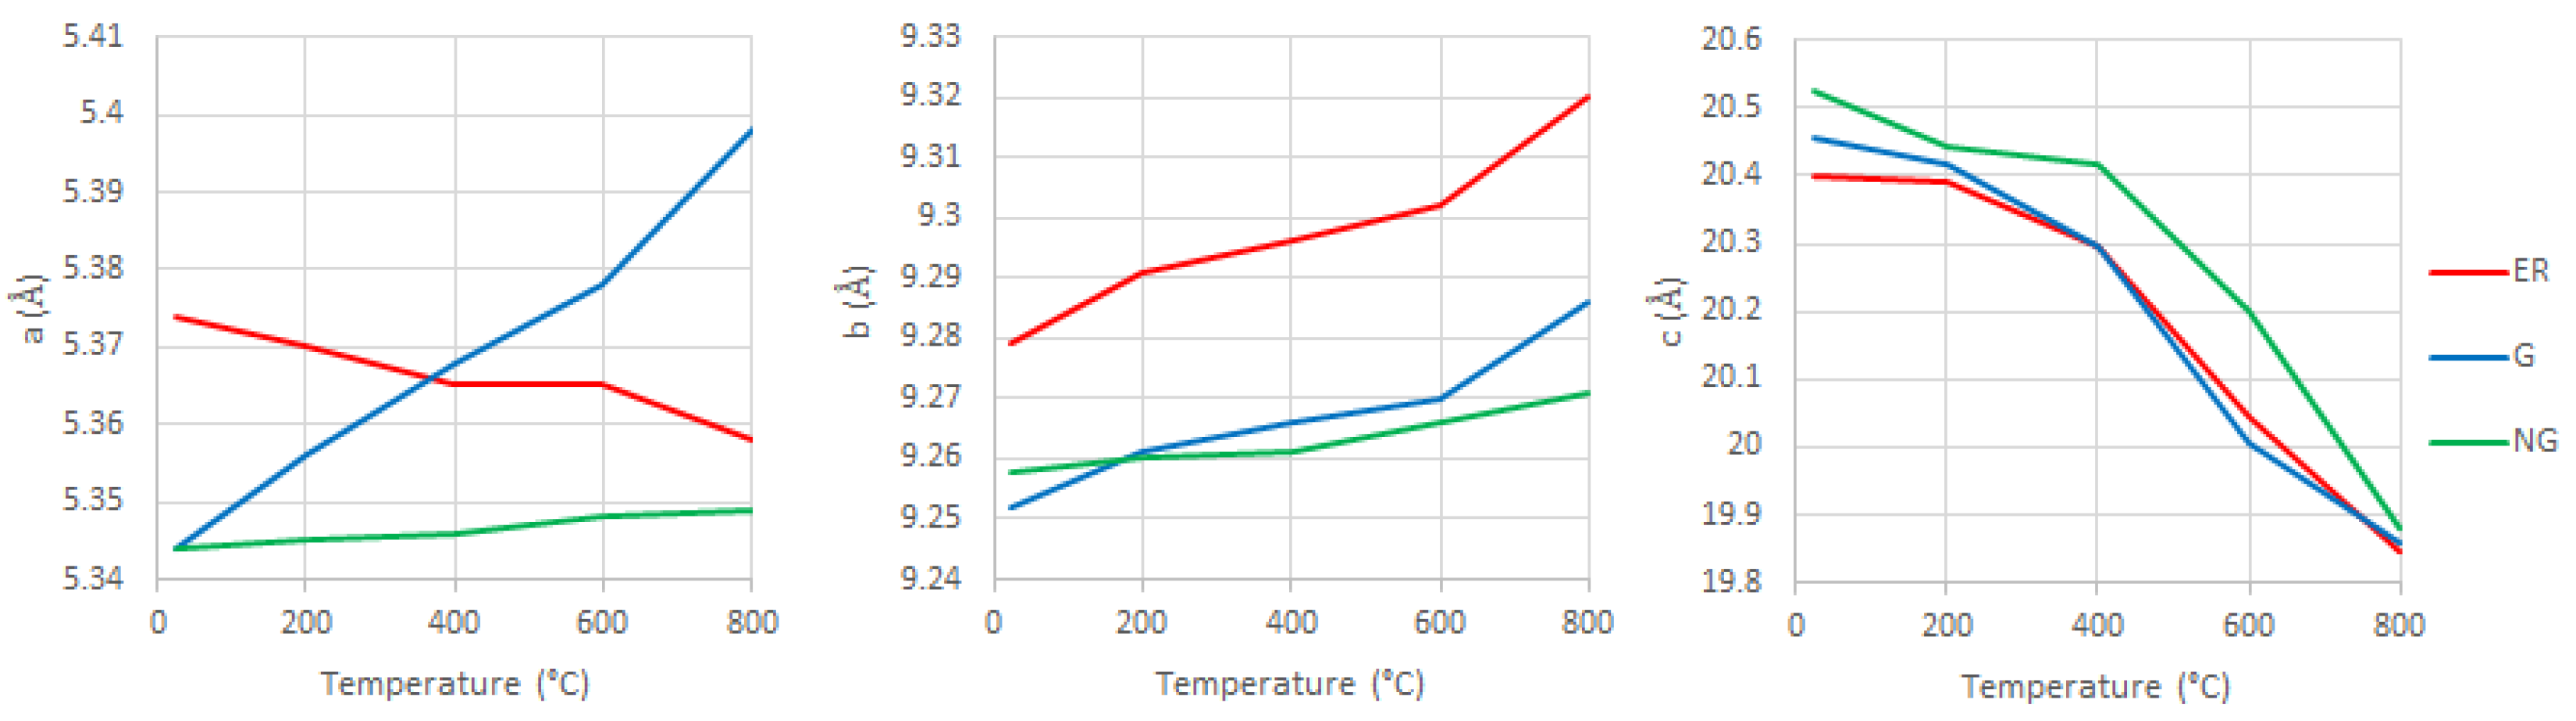
Biotite: This mica was evaluated for three of the granitoids ER, G, and NG (Figure 8), and GS was used to analyse muscovite behaviour due to the higher proportion of this mica type. The a-axis showed very different behaviours depending on the granitoid studied, although for the b-axis and c-axis the trends are similar for the three rocks. The b-axis dilated with temperature and the c-axis contracted, specially from 400 °C. Muscovite a- and b-axis remained stable until 400 °C and dilated greatly at 600 °C. For the c-axis, muscovite also reflected a continuous contraction, as in the case of biotite.

4. Discussion

4.1. Mineral Thermal Expansion

As noted, and observed above, one of the main parameters influencing the damage in granitoids by temperature is the differential mineral expansion due to their heterogeneous composition. For this reason, a deeper discussion of each mineral was developed independently.
Quartz: The experiments carried out by several authors with thermal dilatometers, X-ray diffraction, and neutron scattering reflected a progressive increase in volume up to 500 °C. From 500 °C to almost 600 °C, quartz abruptly increased the volume due to the beginning of the alpha-beta transition, and after that, the volume stabilized or decrease slightly [40,41,42]. The volume of 1 Kg of quartz was calculated considering its density and the cell parameters obtained with XRD (1). The calculated results for quartz in each of the studied rocks are compared with Bloss’ data [41] (Figure 9).
ρt = n × A/Vc × N
where ρt is the theoretical density in g/cm3; n is the number of atoms per unit cell, Vc is the volume of the unit cell in cm3 calculated from the XRD results, and N is the Avogadro number.
The approach from XRD results gave the same trend up to 600 °C, although with a volume change lower than the reference. The measurements carried out revealed a contraction along the a- and c-axis for all the quartz of the selected stones, whereas some authors [43] found a negative expansion in the c-axis for temperatures above 600 °C. This beta negative expansion was explained in terms of asymmetrical forces in the Si-O-Si tetrahedral bonds, in which bending is energetically more favourable than compressing Si-O bonds [44]. In addition, alpha-beta transition was observed not exactly at 573 °C but at pproximately 625–650 °C as a gradual change in which dilation and contractions alternated, that is, alpha and beta structures appeared alternately with time or even coexisted [45].
The trends obtained in this study are close to the bibliography ones, with the implication that the calculations from XRD data revealed a volume expansion lower than that measured in single crystals, which may influence that after the phase transition, the four granitoids showed the recovery to the initial dimensions at approximately 800 °C (Figure 10a). This quartz volume recovery in the studied granitoids may explain the creation of intergranular cracks around quartz that produce a loss of integrity of the rocks. ER is the granitoid that broke completely at 800 °C, whereas the other three resisted up to 1000 °C. Quartz content in this granitoid is approximately 50%, similar to GS. The main difference between them that can explain the better integrity of GS is its finer grain size and the mica rich composition that facilitate the absorption of the stresses associated with quartz volume changes.
Feldspars’ pre-existent microcracks propagate through weakness planes such as cleavages, twin planes, and perthites. In addition, plagioclases exhibited commonly secondary mineral phases in their nucleus. All these characteristics favoured microcrack development during heating [46].
Feldspars showed a contraction in the b- and c- axis and a expansion in the a-axis, for alkali feldspar as well as for plagioclase. In Figure 10b, the peaks of the (002) plane from oligoclase and albite corresponding with the c-axis show the contraction with temperature. Both minerals are triclinic, so the differences between their 2Theta angles and the length change are due mainly to the potassium or sodium proportion of the solid solution and zoning within the crystal.
Feldspar thermal expansion may play an important role in the rock degradation because of its size. In the right geological setting, this mineral can reach centimetric size. Thus, even if its thermal expansion is lower than those of quartz and mica, its larger size leads to a greater absolute size change [47].
The scale factor effect of alkali feldspar was assessed, comparing the results obtained in powder XRD with those from an intact crystal within a small sample of the stone. Both types of samples were heated up to 700 °C and the linear thermal expansion coefficient was obtained for the highest intensity peak (−204). Both tests showed a displacement of the peaks to lower angles when heating, which indicates expansion. The calculated expansion coefficient was higher in the powdered sample (Figure 11), which may be due to the crystal thickness of the intact sample.
Bibliographic data note a thermal expansion of all three mica axes [48]. In this study, basal planes showed an expansion, mostly in the b-axis (Figure 8). However, µ-XRD measurements revealed a displacement of the (00l) peak towards higher angles, which implied a contraction of the c-axis. This contraction may be due to structural changes such as vacancy accommodations of the oxide groups due to the interactions of the different polytypes or simply changes in the predominant polytype. To interpret this behaviour, XPS analyses were focused on the iron and oxide groups of the mica for each of the studied granitoids (Figure 12).
The peak A at approximately 529 eV corresponded to the Fe and Ti oxides, the peak B at approximately 531.1 eV to the alumina oxides included in the mica sheets, and the peak C at approximately 533 eV to the silica tetrahedra [49]. Oxygen bounds are difficult to determine accurately. For the four granitoids selected, only ER showed the three peaks clearly for the fresh stone. The rest of the rocks revealed an A peak with a very high binding energy, which implies the low intensity of the real A peak that was masked by the B peak at approximately 531. After heating, the A peak appeared clearly in all the granitoids, which indicated a change in the Fe-O bonds. This change may be related to oxidation as observed in Figure 5. Only ER allowed the comparison between the fresh state and after heating for the three bond types, and in all of them an increase in the binding energy was reported. This change can be related to a contraction between the links Fe-O, Al-O, and Si-O in agreement with the XRD measurements. The molecular contraction is independent to the whole mica mineral dilation following the c-axis, due to the cleavage plans breakdown and the mica sheet separation with heating.

4.2. Granitoid Theoretical Thermal Expansion

Dilatometric measurements are the best method to determine the linear and volumetric thermal expansion of rocks. However, in some cases such as cultural heritage monuments, the sampling size required for this test cannot be achieved and an optional analysis is needed. The theoretical approach is envisaged when working with crystalline stones, in which porosity or other materials as salts are not considered as a variable [36,50]. For this theoretical approach, the thermal expansion in the three main axes and of every mineral is considered together with the mineral proportion within the rock. Some authors [36] used a finite element model to estimate the micro stresses and thermal expansion of several granitoids up to 400 °C, and others [50] used the maximal and minimal linear expansion of each mineral for proposing a values’ interval to fit with experimental data. These coefficients are multiplied by the percentage of each mineral in each rock. In both cases, mineral thermal expansion coefficients were extracted from literature [48,50] and the rock thermal expansion calculated with a dilatometer with temperatures of approximately 100 °C. Following this pattern, it is assumed that minerals are pure, and with a determinate composition, and that their thermal expansions are always constant. However, the mineral expansion is not continuous due to the chemical changes that take place, such as the quartz alpha-beta transition noted above, the water loss, or the mica and clays decomposition at approximately 500–600 °C [23].
The approach proposed in this research is to use the experimental thermal expansion coefficients obtained by XRD during heating up to 600–800 °C (depending on the XRD peaks definition) and to apply the model from [50] to obtain the rock thermal expansion up to high temperatures as are reached during a fire. The coefficients were calculated from 25–200 °C, 200–400 °C, and 400–600 °C from the statement of the non-homogeneous behaviour.
From lattice measurements, the mineral thermal expansion was calculated for two of the granitoids, ER and G. The presence of muscovite and amphiboles in GS and NG made it difficult to present accurate data. As noted above, the minerals dimension varied with temperature in a non-linear pattern, and that was observed in the calculated linear thermal expansion of rocks, and in agreement with the behaviour of centimetric sample exposed to high temperatures (Figure 13). The maximal and minimal thermal expansion coefficients were used to calculate the rock thermal expansion evolution and compared with the experimental value obtained at 90 °C.
ER showed a constant thermal expansion up to 400 °C for the maximal value. The random mineral orientation can be equilibrated for the crack formation over 130 °C and have as a result a comparable dilation coefficient. After this temperature, the mineral transformation revealed a mineral behaviour too separated and, in this case, the crack development by mineral expansion plays a more important role in the rock dilation than the minerals themselves. G has a progressive dilation up to 600° that indicates a lesser influence of mineral transformation at approximately 500–600 °C. As for ER, the maximal value for every mineral agrees with the values obtained for the whole rock.
Figure 13 also shows the rock dilation if the data from references are considered for the model. ER highest values can be compared with the expansion calculated from the theoretical lower coefficients. G presented a good compromise with intermediate dilation of the results from this study and the results from the theoretical approach.

5. Conclusions

The main conclusions that can be extracted from the study of granitoids exposed to high temperature at mineral scale are:
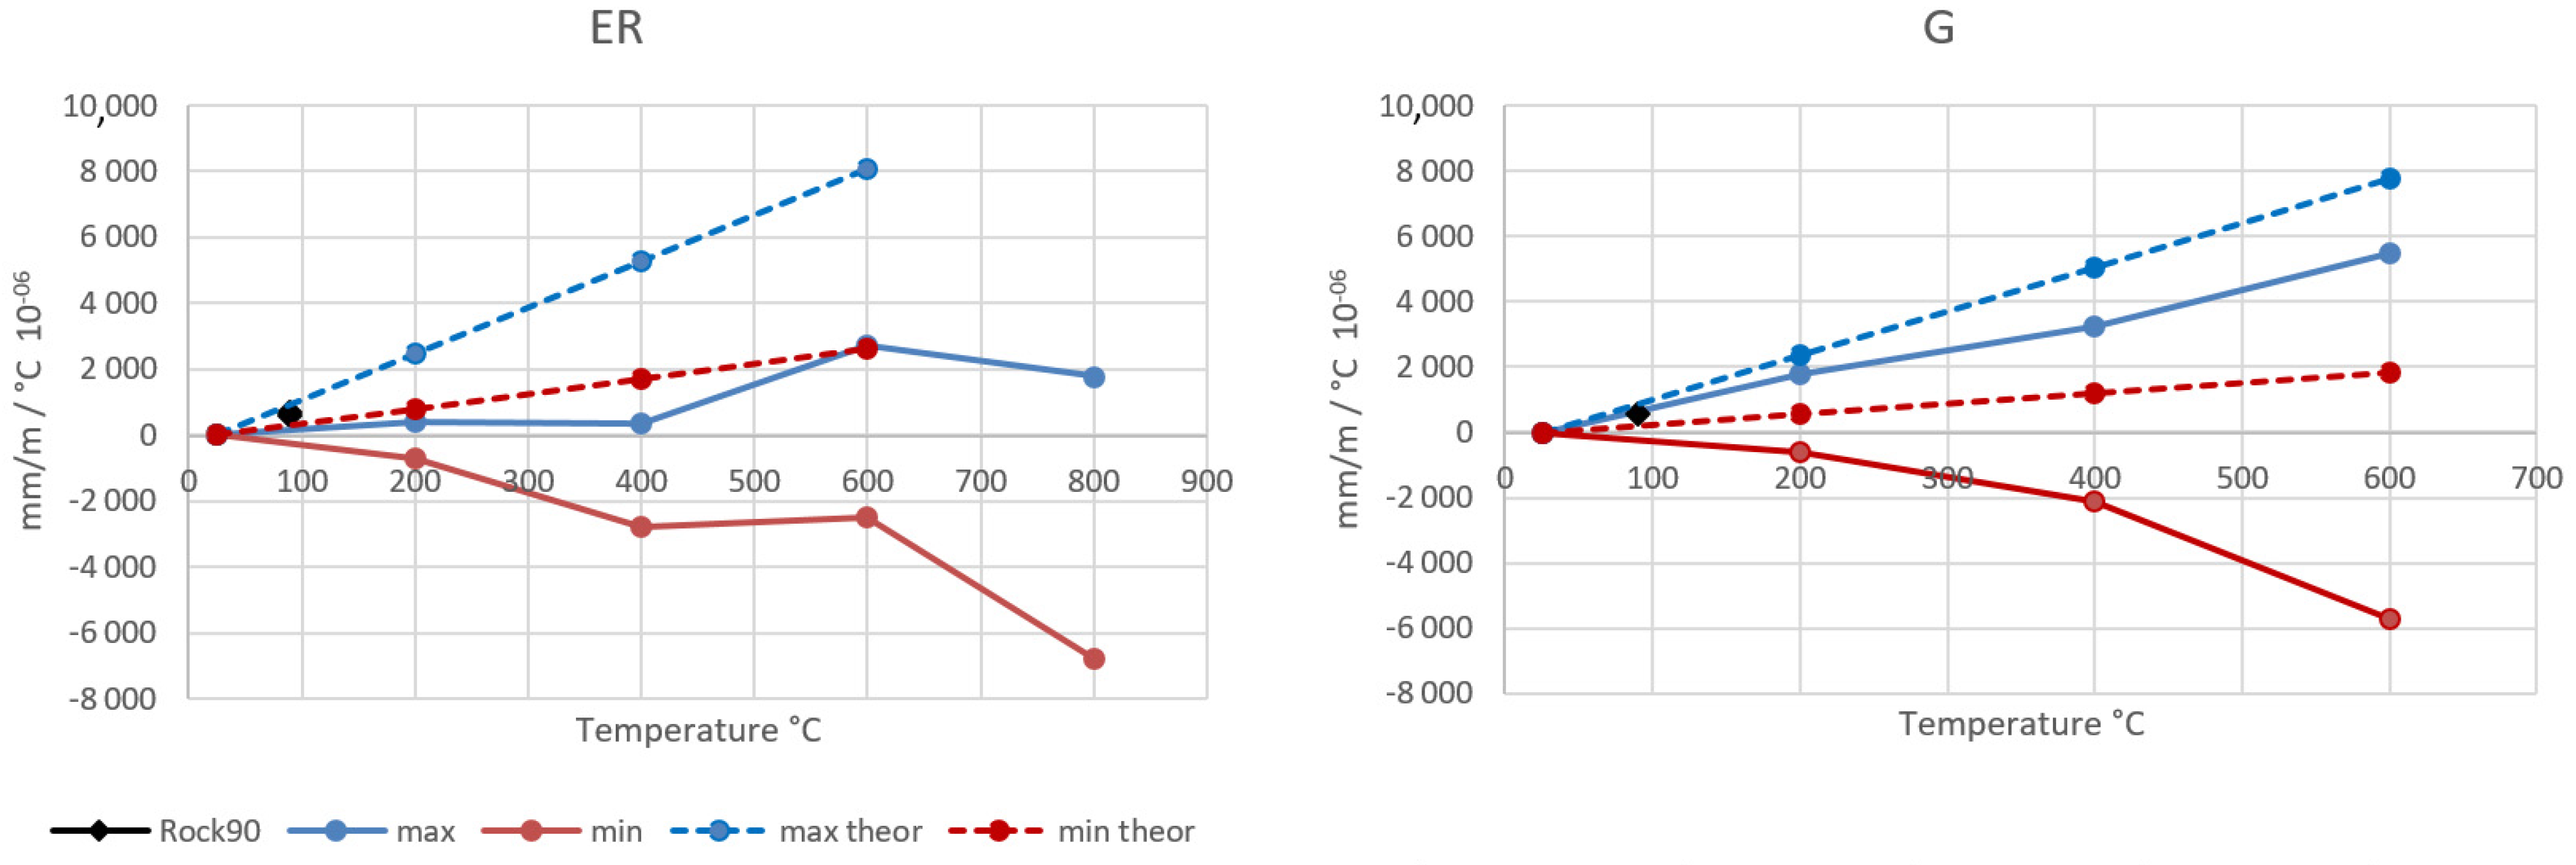
Standard values of thermal expansion coefficients calculated at temperatures near 100 °C are not suitable indicators of how the bulk of the rock will disaggregate when heated to high temperatures.
XRD lattice measurements can give an estimate of rock thermal expansion for crystalline rocks when a dilatometric test is not available or its use is not possible due to sampling restrictions.
Quartz contraction was measurable after the beta-phase change, confirming the findings shown in previous research that consider this phase change as a major cause for rock disaggregation in the context of temperature increase.
XRD measurements revealed the mica contraction along the c-axis, which seemingly contradicts the thermal expansion coefficients compiled from literature. The binding energy increase observed in ER with XPS may imply a bond shortening, despite an overall expansion of the whole mineral along the cleavage planes.
Although XPS analysis can explain changes of the crystalline structure, such as bond lengths and angles, the results must be interpreted carefully in relation to the bulk effects of temperature increase in the rocks. As observed in the mica, a structural contraction may be associated with an overall expansion of the mineral.
XPS is an effective technique to observe iron oxidation, which is the main cause for discolouration and, therefore, visual disamenity caused by temperature increase on rocks.
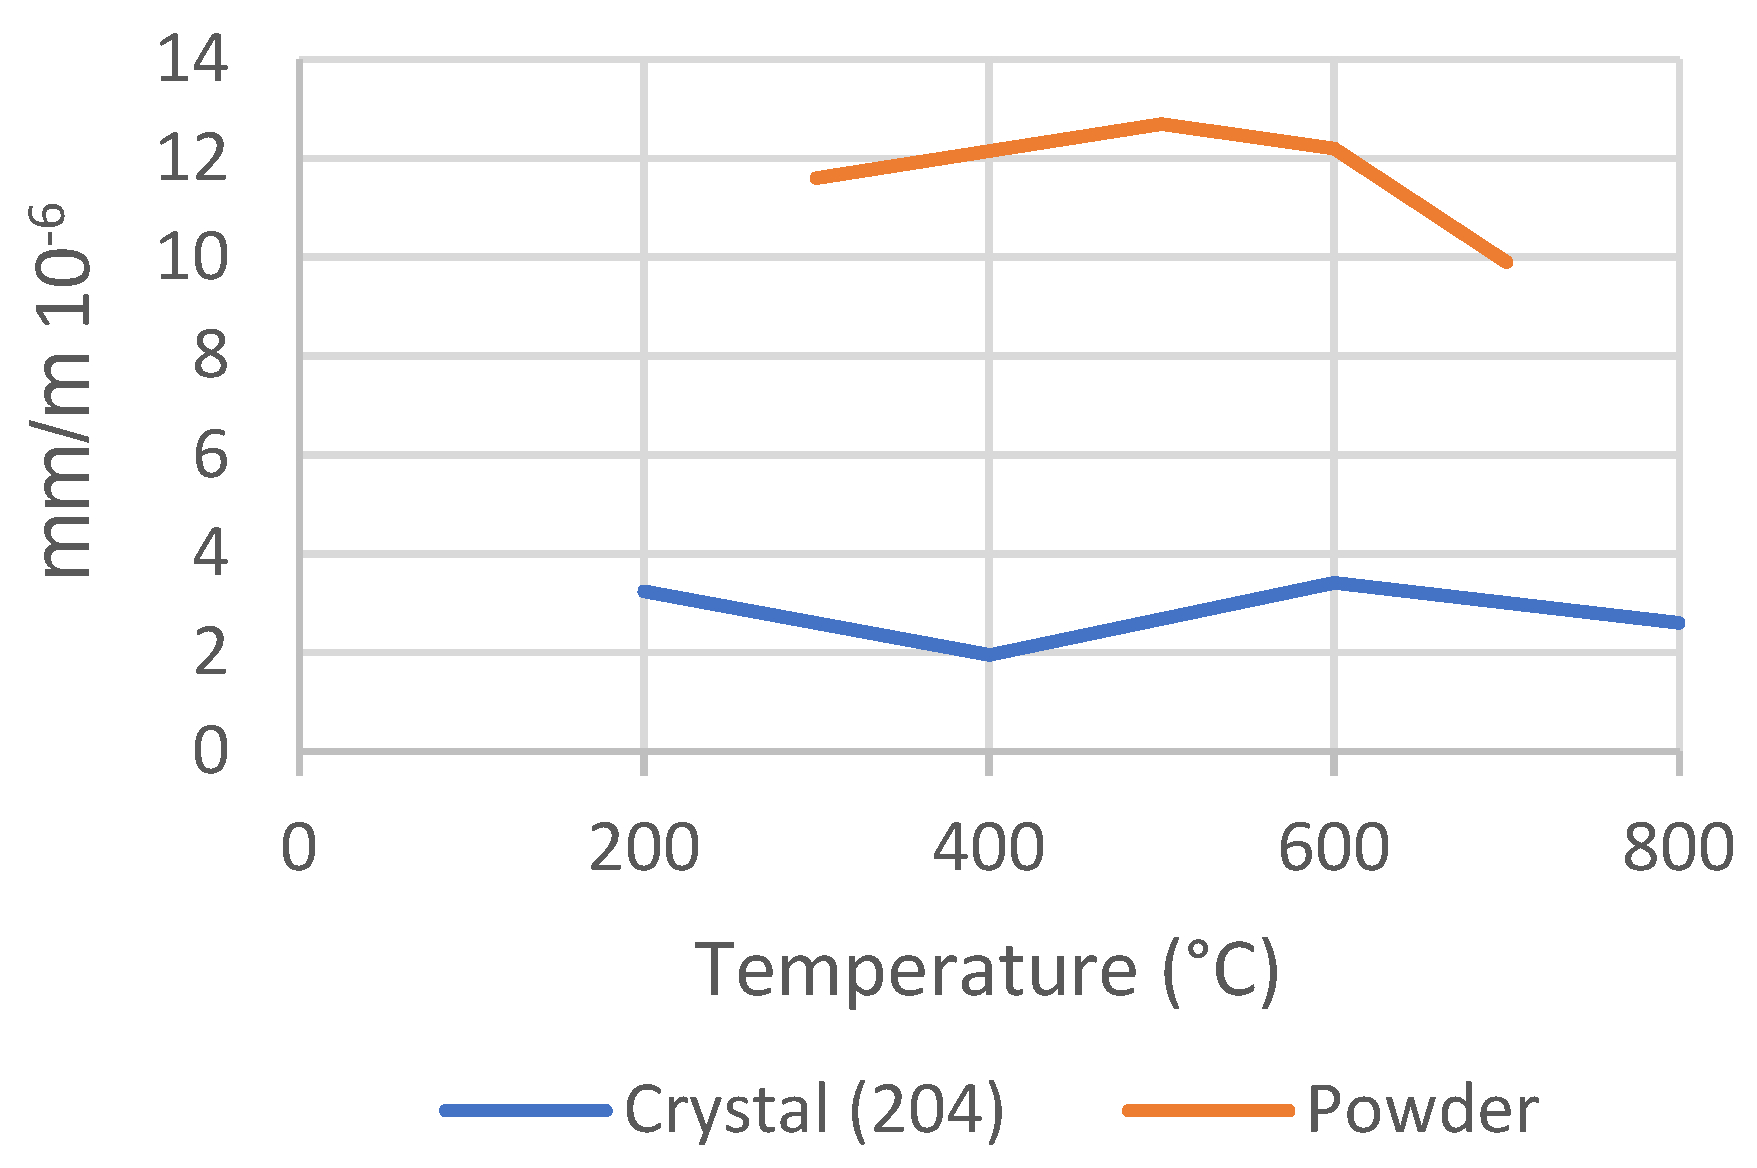
The type of measurement (powder or monocrystal technique) influences XRD thermal expansion measurements and its interpretation of the real damage that can be caused in rocks. Powder XRD does not consider the effect of the competing thermal expansion of the crystals around the target mineral. This competing effect affects the ability of minerals to expand while enhancing thermal expansion mismatch and should be taken into account when interpreting the damage caused by temperature increase in real cases.

Author Contributions

Conceptualization, P.V. and D.B.; methodology, D.B.; software, D.M.; validation, P.V., D.B., D.M. and M.G.-H.; formal analysis, P.V. and D.M.; investigation, D.M.; resources, P.V., D.B., D.M. and M.G.-H.; data curation, P.V. and D.M.; writing—original draft preparation, P.V. and D.M.; writing—review and editing, P.V., D.M., D.B. and M.G.-H.; funding acquisition, D.B. and M.G.-H. All authors have read and agreed to the published version of the manuscript.

Funding

This research was funded by “Top Heritage (P2018/NMT-4372) programme from the Regional Government of Madrid (Spain)”, “Grants PIC2020-116896RB-C21”, “PIC2020-116896RB-C22” funded by MCIN/AEI/ 10.13039/501100011033,” Grant AICO/2020/175” by the Regional government of Comunidad Valenciana (Spain).

Conflicts of Interest

The authors declare no conflict of interest.

References

  1. Gomez-Heras, M.; Mccabe, S.; Smith, B.J.; Fort, R. Impacts of Fire on Stone-Built Heritage. J. Archit. Conserv. 2009, 15, 47–58. [Google Scholar] [CrossRef]
  2. Martinho, E.; Dionísio, A. Assessment Techniques for Studying the Effects of Fire on Stone Materials: A Literature Review. Int. J. Archit. Herit. 2018, 14, 275–299. [Google Scholar] [CrossRef]
  3. Ferreira, T.M. Notre Dame Cathedral: Another Case in a Growing List of Heritage Landmarks Destroyed by Fire. Fire 2019, 2, 20. [Google Scholar] [CrossRef] [Green Version]
  4. Flannigan, M.; Stocks, B.; Wotton, B. Climate change and forest fires. Sci. Total Environ. 2000, 262, 221–229. [Google Scholar] [CrossRef]
  5. Lung, T.; Lavalle, C.; Hiederer, R.; Dosio, A.; Bouwer, L.M. A multi-hazard regional level impact assessment for Europe combining indicators of climatic and non-climatic change. Glob. Environ. Chang. 2013, 23, 522–536. [Google Scholar] [CrossRef]
  6. Fargeon, H.; Pimont, F.; Martin-Stpaul, N.; Caceres, M.D.; Ruffault, J.; Barbero, R.; Dupuy, J.-L. Projections of fire danger under climate change over France: Where do the greatest uncertainties lie? Clim. Chang. 2020, 160, 479–493. [Google Scholar] [CrossRef]
  7. Mccabe, S.; Smith, B.; Warke, P. Exploitation of inherited weakness in fire-damaged building sandstone: The ‘fatiguing’ of ‘shocked’ stone. Eng. Geol. 2010, 115, 217–225. [Google Scholar] [CrossRef]
  8. Blackwelder, E. Fire as an Agent in Rock Weathering. J. Geol. 1927, 35, 134–140. [Google Scholar] [CrossRef]
  9. Chakrabarti, B.; Yates, T.; Lewry, A. Effect of fire damage on natural stonework in buildings. Constr. Build. Mater. 1996, 10, 539–544. [Google Scholar] [CrossRef]
  10. Gómez-Heras, M.; Smith, B.J.; Fort, R. Influence of surface heterogeneities of building granite on its thermal response and its potential for the generation of thermoclasty. Environ. Geol. 2008, 56, 547–560. [Google Scholar] [CrossRef]
  11. Dionísio, A.; Martinho, E.; Pozo-António, J.; Braga, M.S.; Mendes, M. Evaluation of combined effects of real-fire and natural environment in a building granite. Constr. Build. Mater. 2021, 277, 122327. [Google Scholar] [CrossRef]
  12. Ozguven, A.; Ozcelik, Y. Investigation of some property changes of natural building stones exposed to fire and high heat. Constr. Build. Mater. 2013, 38, 813–821. [Google Scholar] [CrossRef]
  13. Vigroux, M.; Eslami, J.; Beaucour, A.-L.; Bourgès, A.; Noumowé, A. High temperature behaviour of various natural building stones. Constr. Build. Mater. 2021, 272, 121629. [Google Scholar] [CrossRef]
  14. Vazquez, P.; Acuña, M.; Benavente, D.; Gibeaux, S.; Navarro, I.; Gomez-Heras, M. Evolution of surface properties of ornamental granitoids exposed to high temperatures. Constr. Build. Mater. 2016, 104, 263–275. [Google Scholar] [CrossRef]
  15. Hajpál, M.; TöRöK, A. Mineralogical and colour changes of quartz sandstones by heat. Environ. Geol. 2004, 46, 311–322. [Google Scholar] [CrossRef]
  16. Dionisio, A.; Sequeira-Braga, M.; Waerenborgh, J. Clay minerals and iron oxides-oxyhydroxides as fingerprints of firing effects in a limestone monument. Appl. Clay Sci. 2009, 42, 629–638. [Google Scholar] [CrossRef]
  17. Gillhuber, S.; Lehrberger, G.; Göske, J. Fire damage of trachyte: Investigations of the Teplá monastery building stones. Geol. Soc. Lond. Spec. Publ. 2010, 333, 73–79. [Google Scholar] [CrossRef]
  18. Beck, K.; Janvier-Badosa, S.; Brunetaud, X.; Török, Á.; Al-Mukhtar, M. Non-destructive diagnosis by colorimetry of building stone subjected to high temperatures. Eur. J. Environ. Civ. Eng. 2015, 20, 643–655. [Google Scholar] [CrossRef]
  19. Németh, A.; Antal, Á.; Török, Á. Physical Alteration and Color Change of Granite Subjected to High Temperature. Appl. Sci. 2021, 11, 8792. [Google Scholar] [CrossRef]
  20. Gomez-Heras, M.; Vazquez, P.; Carrizo, L.; Fort, R.; Alonso, F.J. Effects of high temperatures in building granites: Micro-cracking patterns and ultrasound velocity attenuation. Geol. Balc. 2010, 39, 138. [Google Scholar]
  21. Kompaníková, Z.; Gomez-Heras, M.; Vázquez, P.; Vlčko, J. Evolution of petrophysical properties of Spanish building granites at high temperatures. Geophys. Res. Abstr. 2011, 13, EGU2011-8753-1. [Google Scholar]
  22. Hajpál, M. Changes in sandstones of historical monuments exposed to fire or high temperature. Fire Technol. 2002, 38, 373–382. [Google Scholar] [CrossRef]
  23. Zhang, W.; Sun, Q.; Zhang, Y.; Xue, L.; Kong, F. Porosity and wave velocity evolution of granite after high-temperature treatment: A review. Environ. Earth Sci. 2018, 77, 350. [Google Scholar] [CrossRef]
  24. Biró, A.; Hlavička, V.; Lublóy, É. Effect of fire-related temperatures on natural stones. Constr. Build. Mater. 2019, 212, 92–101. [Google Scholar] [CrossRef]
  25. Junique, T.; Vázquez, P.; Géraud, Y.; Thomachot-Schneider, C.; Sidibé, H. Microstructural evolution of granitic stones exposed to different thermal regimes analysed by infrared thermography. Eng. Geol. 2021, 286, 106057. [Google Scholar] [CrossRef]
  26. Junique, T.; Vazquez, P.; Thomachot-Schneider, C.; Hassoun, I.; Jean-Baptiste, M.; Géraud, Y. The Use of Infrared Thermography on the Measurement of Microstructural Changes of Reservoir Rocks Induced by Temperature. Appl. Sci. 2021, 11, 559. [Google Scholar] [CrossRef]
  27. Vazquez, P.; Sánchez-Delgado, N.; Carrizo, L.; Thomachot-Schneider, C.; Alonso, F.J. Statistical approach of the influence of petrography in mechanical properties and durability of granitic stones. Environ. Earth Sci. 2018, 77, 287. [Google Scholar] [CrossRef]
  28. Sirdesai, N.N.; Singh, T.N.; Gamage, R.P. Thermal alterations in the poro-mechanical characteristic of an Indian sandstone—A comparative study. Eng. Geol. 2017, 226, 208–220. [Google Scholar] [CrossRef]
  29. Tian, H.; Kempka, T.; Yu, S.; Ziegler, M. Mechanical Properties of Sandstones Exposed to High Temperature. Rock Mech. Rock Eng. 2015, 49, 321–327. [Google Scholar] [CrossRef]
  30. Winkler, E.M. Stone in Architecture; Springer: Berlin/Heidelberg, Germany, 1997. [Google Scholar]
  31. Gómez-Heras, M.; Smith, B.J.; Fort, R. Surface temperature differences between minerals in crystalline rocks: Implications for granular disaggregation of granites through thermal fatigue. Geomorphology 2006, 78, 236–249. [Google Scholar] [CrossRef]
  32. Kompaníková, Z.; Gomez-Heras, M.; Michňová, J.; Durmeková, T.; Vlčko, J. Sandstone alterations triggered by fire-related temperatures. Environ. Earth Sci. 2014, 72, 2569–2581. [Google Scholar] [CrossRef]
  33. Géraud, Y.; Mazerolle, F.; Raynaud, S. Comparison between connected and overall porosity of thermally stressed granites. J. Struct. Geol. 1992, 14, 981–990. [Google Scholar] [CrossRef]
  34. Castro Lima, J.; Paraguassú, A.B. Linear thermal expansion of granitic rocks: Influence of apparent porosity, grain size and quartz content. Bull. Eng. Geol. Environ. 2004, 63, 215–220. [Google Scholar] [CrossRef]
  35. Vázquez, P.; Siegesmund, S.; Alonso, F.J. Bowing of dimensional granitic stones. Environ. Earth Sci. 2010, 63, 1603–1612. [Google Scholar] [CrossRef] [Green Version]
  36. Vazquez, P.; Shushakova, V.; Gómez-Heras, M. Influence of mineralogy on granite decay induced by temperature increase: Experimental observations and stress simulation. Eng. Geol. 2015, 189, 58–67. [Google Scholar] [CrossRef]
  37. Koch, A.; Siegesmund, S. The combined effect of moisture and temperature on the anomalous expansion behaviour of marble. Environ. Geol. 2004, 46, 350–363. [Google Scholar] [CrossRef]
  38. Grosvenor, A.P.; Kobe, B.A.; Biesinger, M.C.; Mcintyre, N.S. Investigation of multiplet splitting of Fe 2p XPS spectra and bonding in iron compounds. Surf. Interface Anal. 2004, 36, 1564–1574. [Google Scholar] [CrossRef]
  39. Benavente, D.; Martínez-Martínez, J.; Cueto, N.; García-Del-Cura, M. Salt weathering in dual-porosity building dolostones. Eng. Geol. 2007, 94, 215–226. [Google Scholar] [CrossRef]
  40. Somerton, W.; Selim, M. Additional Thermal Data for Porous Rocks--Thermal Expansion and Heat of Reaction. Soc. Pet. Eng. J. 1961, 1, 249–253. [Google Scholar] [CrossRef]
  41. Bloss, F.D. Crystallography and Crystal Chemistry: An Introduction; Holt, Rinehart and Winston: New York, NY, USA, 1971. [Google Scholar]
  42. Sorrell, C.A.; Anderson, H.U.; Ackermann, R.J. Thermal expansion and the high–low transformation in quartz. II. Dilatometric studies. J. Appl. Crystallogr. 1974, 7, 468–473. [Google Scholar] [CrossRef]
  43. Kihara, K. Molecular dynamics interpretation of structural changes in quartz. Phys. Chem. Miner. 2001, 28, 365–376. [Google Scholar] [CrossRef]
  44. Kihara, K. Lattice dynamical calculations of anisotropic temperature factors of atoms in quartz, and the structure of β-quartz. Phys. Chem. Miner. 1993, 19, 492–501. [Google Scholar] [CrossRef]
  45. Kihara, K. An X-ray study of the temperature dependence of the quartz structure. Eur. J. Mineral. 1990, 2, 63–78. [Google Scholar] [CrossRef]
  46. Freire-Lista, D.M.; Fort, R.; Varas-Muriel, M. Thermal stress-induced microcracking in building granite. Eng. Geol. 2016, 206, 83–93. [Google Scholar] [CrossRef] [Green Version]
  47. Hall, K.; Guglielmin, M.; Strini, A. Weathering of granite in Antarctica: II. Thermal stress at the grain scale. Earth Surf. Processes Landf. 2008, 33, 475–493. [Google Scholar] [CrossRef]
  48. Wagner, C.D.; Muilenberg, G.E.; Wagner, C.D. Handbook of X-Ray Photoelectron Spectroscopy: A Reference Book of Standard Data for Use in X-ray Photoelectron Spectroscopy; Physical Electronics Division, Perkin-Elmer Corp: Waltham, MA, USA, 1979. [Google Scholar]
  49. Siegesmund, S.; Sousa, L.; Knell, C. Thermal expansion of granitoids. Environ. Earth Sci. 2018, 77, 41. [Google Scholar] [CrossRef]
  50. Fei, Y. Thermal Expansion. In Mineral Physics & Crystallography; The American Geophysical Union: Washington, DC, USA, 2013; pp. 29–44. [Google Scholar]
Figure 1. Selected granitoids. (A): Eagle Red; (B): Grissal; (C): Golden Ski; (D): Negro Galicia.
Applsci 12 00188 g001
Figure 2. Microscope images of the selected granitoids.
Applsci 12 00188 g002
Figure 3. Scanning electron microscope images of the selected granitoids after heating. Q: quartz; AF: alkali feldspar; P: plagioclase; B: biotite; Ms: muscovite; Am: amphibole; Px: pyroxene; Ap: apatite; Ti: titanite. Photos (ad) correspond to granites before heating. Photo (eh) showed the crack development of the granites after heating.
Applsci 12 00188 g003
Figure 4. Thermal XRD analysis of the four granitoids at temperatures increasing progressively from 25 °C to 1000 °C and cooled down at the end to 25 °C. Q: quartz; AF: alkali feldspar; P: plagioclase; M: mica; H: hornblende.
Applsci 12 00188 g004
Figure 5. Fe2p XPS analysis before and after heating of the four selected granitoids. The proportion of the peaks A/B decreased with heating, implying iron oxidation.
Applsci 12 00188 g005
Figure 6. Quartz cell expansion adapted from software.
Applsci 12 00188 g006
Figure 7. Albite cell expansion adapted from software.
Applsci 12 00188 g007
Figure 8. Biotite cell expansion adapted from software.
Applsci 12 00188 g008
Figure 9. Quartz volume expansion of the granitoids compared to previous studies (* Bloss 1971).
Applsci 12 00188 g009
Figure 10. XRD graphs showing the evolution with temperature. (a) Q-peak (101) evolution with heating measured by X-ray diffraction. (b) Feldspar’s XRD 2Thetha angles increase with temperature, which indicates a contraction.
Applsci 12 00188 g010
Figure 11. Comparison of feldspar thermal expansion coefficient of a crystal sample and a rock powder sample.
Applsci 12 00188 g011
Figure 12. Peaks deconvolution with three binding peaks of the 1s oxygen orbitals before and after heating. The peak A at approximately 529 eV corresponded to the Fe and Ti oxides, the peak B at approximately 531.1 eV to the alumina oxides included in the mica sheets, and the peak C at approximately 533 eV to the silica tetrahedral [49].
Applsci 12 00188 g012
Figure 13. Thermal deformation obtained by XRD measurements (solid) and theoretical thermal expansion of minerals (dotted). The black point is the linear thermal expansion obtained by dilatometry at 90 °C.
Applsci 12 00188 g013
Table 1. Summary of the stones’ main features. Grain size was measured from macroscopic samples. Thus, some mineral aggregates have been included as a single mineral.
Mineral (%)Grain Size (mm)Porosity (%)
Q 1AFPMQAFPMRock Average
ER484075362150.56 ± 0.03
G253532881892110.68 ± 0.03
GS47202013444243.68 ± 0.06
NG1882924555250.53 ± 0.01
1 Q: quartz; AF: alkali feldspar; P: plagioclase; M: mica.
Table 2. Absolute difference between heated and fresh stones. Red colours indicated a loss and green ones a gain.
MgOAl2O3SiO2K2OCaOTiO2MnOFe2O3
ERQ 2.78−3.740.390.56
AF10.82−0.04−11.78−1.13 0.480.061.6
B −0.021.87−0.44 −1.020.05−0.45
GQ −1−0.470.24−0.02−0.08
AF −2.53−3.56.81−0.780.14 −0.14
B 1.35−6.45−1.19 0.510.095.71
GSQ 5.43−8.583.14
AF −0.34−0.841.8−0.57
B−15.264.212.81.01 −0.53−0.02−1.87
NGMs 0.18−0.230.190.04−0.08 −0.11
B3.570.482.56−0.07−13.49−0.19−0.02−0.38
AF−1.010.66−0.250.670−0.08−0.13−2.37
Ti 0.0213.03 −7.14−9.81 −0.21
Q: quartz; AF: alkali feldspar; P: plagioclase; B: biotite; Ms: muscovite; Ti: titanite.
Table 3. Linear thermal expansion (ɑ) of the selected granitoids heated up to 90 °C.
mm/m 10−6ɑ Xɑ Yɑ ZAverage/St. Dev.AD
ER7.907.739.328.32 +/− 0.810.83
G9.5410.128.639.43 +/− 0.640.85
GS9.899.029.129.3 +/− 0.650.91
NG8.378.608.758.58 +/− 0.270.95
Publisher’s Note: MDPI stays neutral with regard to jurisdictional claims in published maps and institutional affiliations.

