Article

Wettability of Carbonate Reservoir Rocks: A Comparative Analysis

by
Mohsen Faramarzi-Palangar
1,
Abouzar Mirzaei-Paiaman
2,*,
Seyyed Ali Ghoreishi
1 and
Behzad Ghanbarian
3,*
1
Institute of Petroleum Engineering, School of Chemical Engineering, College of Engineering, University of Tehran, Tehran 1417935840, Iran
2
Center for Petroleum Studies (CEPETRO), University of Campinas (UNICAMP), Campinas 13083970, SP, Brazil
3
Porous Media Research Lab, Department of Geology, Kansas State University, Manhattan, KS 66506, USA
*
Authors to whom correspondence should be addressed.
Appl. Sci. 2022, 12(1), 131; https://doi.org/10.3390/app12010131
Submission received: 25 November 2021 / Revised: 13 December 2021 / Accepted: 14 December 2021 / Published: 23 December 2021
(This article belongs to the Special Issue Applied Petrology: Latest Advances and Prospects)

Abstract

:
Various methods have been proposed for the evaluation of reservoir rock wettability. Among them, Amott–Harvey and USBM are the most commonly used approaches in industry. Some other methods, such as the Lak and modified Lak indices, the normalized water fractional flow curve, Craig’s triple rules of thumb, and the modified Craig’s second rule are based on relative permeability data. In this study, a set of capillary pressure curves and relative permeability experiments was conducted on 19 core plug samples from a carbonate reservoir to evaluate and compare different quantitative and qualitative wettability indicators. We found that the results of relative permeability-based approaches were consistent with those of Amott–Harvey and USBM methods. We also investigated the relationship between wettability indices and rock quality indicators RQI, FZI, and Winland R35. Results showed that as the rock quality indicators increased, the samples became more oil-wet.

1. Introduction

Wettability is a two- or multi-phase property defined as the preference of solid matrix of rocks to be in contact with one fluid rather than another [1]. It is one of the most critical properties controlling multiphase flow and transport in porous media [2,3,4,5,6,7,8,9,10,11,12,13]. Studies have shown that the wettability of rocks has a direct impact on relative permeability [4,10,14,15], capillary pressure [3,16], and performance of secondary and tertiary oil recovery methods [5,17,18]. A lack of knowledge of rock wetting behavior may lead to substantial uncertainties in the estimation of a reservoir’s accessible oil and recovery rate [18,19,20,21]. Therefore, an advanced understanding of this parameter can significantly contribute to better assigning saturation functions to reservoir simulation models, modeling CO2 geo-sequestration [22,23,24], and evaluation of formation damage [25,26,27] as well as assessing secondary and tertiary enhanced oil recovery efficiencies [21].
Typically, reservoir rocks are initially water-wet since rock particles tend to be solely in contact with brine [1]. However, as crude oil migrates into a reservoir from a source rock, heavier components of oil get adsorbed to the surface of rock over time. Accordingly, reservoir rocks incline towards have less water-wet tendency as they age. Several studies suggested that the wettability of reservoir rocks is a function of various parameters, including aging time [28,29], temperature [1,30], heavy components of the crude oil [1,29], mineral composition of the rocks [31], and pore structures [31].
In the literature, indirect evaluations of wettability have been performed by measuring petrophysical parameters affected by contact angle, e.g., relative permeability and capillary pressure curves [1,15,32]. Laboratory methods, such as Amott [33], Amott–Harvey [34,35], standard USBM [36], and modified USBM [37] have been widely applied in the oil industry. In addition, relative permeability-based techniques including Craig’s triple rules of thumb [38], the normalized water fractional flow curve [39], Lak [15], and modified Lak [13] were proposed to deduce knowledge of wettability in rocks. There exist other wettability indicators, such as the relative pseudo work of imbibition [40], MPMS (MPMS stands for Mirzaei–Paiaman, Masihi and Standnes) [41,42], relative imbibition rate [43], rise in core [44], and NMR-based techniques [45,46,47,48,49,50] that require additional experiments.
Various studies have been conducted to evaluate wettability characteristics of reservoir rocks. For example, Treiber and Owens [51] measured contact angle by analyzing the droplet of oil on a polished crystal of reservoir rock on 50 reservoir rocks and noted that 64% of carbonate reservoirs were intermediate-wet, 28% oil-wet, and 8% water-wet. Chilingar and Yen [52] measured wettability of 161 carbonate samples using image analysis and concluded that 80% of the samples were oil-wet (100–180 degrees), 12% intermediate-wet (80–100 degrees), and 8% water-wet (0–80 degrees). Al-Yousef et al. [53] analyzed the wettability of Saudi Arabian carbonate reservoir rocks using the USBM, Amott, and CryoSEM methods and found that almost all samples were neutral to slightly oil-wet. Webb et al. [54] used displacement characteristics and indicated that preserved carbonate samples exhibited significantly more oil-wet character than restored samples. Marzouk [55] investigated the wettability of Thammama and Arab carbonate reservoirs in Abu Dhabi. The survey revealed oil-wet conditions in the oil zone, mixed-wet in the transition zone, and water-wet in the water zone. Okasha et al. [56] investigated the wettability of Arab carbonate reservoir using Amott, USBM, and relative permeability techniques as well as measurements of contact angle by analyzing the droplet shape placed on a smooth substrate (calcite plate). They stated that carbonate reservoir rocks analyzed in their study were generally ranged from slightly water-wet to slightly oil-wet. Okasha et al. [57] found that the results of the Amott and USBM methods were similar indicating that the Arab-D carbonate reservoir was slightly oil-wet. In another study, Al-Attar et al. [58] evaluated the Bu Hasa reservoir by measuring the contact angle by image analysis and showed the reservoir had slightly water-wet responses. Bakhshi and Torab [59] assessed the wettability of 17 core plug samples from three wells of an Iranian carbonate reservoir via the Amott–Harvey method. Their results showed that the Amott–Harvey index varied from −0.8 to 0.01 indicating oil-wet to slightly water-wet conditions. Chen et al. [60] studied wettability characteristics of a carbonate reservoir in the Middle East via optical-based contact angle measurements. They found that most of samples ranged between neutral-wet and slightly oil-wet. Recently, Faramarzi-Palangar and Mirzaei–Paiaman [61] analyzed the wettability of 25 core plug samples from an Iranian carbonate reservoir via Craig’s triple rules of thumb and the Amott–Harvey index and reported that samples were oil-wet. Using the Lak index, Mirzaei–Paiaman [15] evaluated the wettability of ten plug samples from six carbonate reservoirs. His results showed that the Lak index for their samples varied from −0.64 to −0.19, which indicated oil-wet conditions. Mirzaei–Paiaman et al. [13] also reported the wetness of 20 core plug samples from two carbonate reservoirs of Asmari and Fahlian from the Middle East. Those authors used the Amott–Harvey, USBM, Lak, and modified Lak indices and found slightly water- to oil-wet conditions.
In the literature, various studies evaluated and compared the performance of wettability indices [62,63,64]. Anderson [32] stated that the USBM method performed better than the Amott method in differentiating near-neutral-wet systems. However, some studies argued that both the USBM and Amott methods may not accurately detect the type of wetness in strongly water-wet systems [40,62,63]. Dixit et al. [65] investigated the relationship between the Amott and USBM indices and found that these two methods provided similar results only in weakly-wetted media with randomly distributed water-wet and oil-wet pores.
The main objective of this study is to evaluate and compare different quantitative and qualitative wettability assessment methods including Amott, Amott–Harvey, and USBM as well as relative permeability-based techniques, such as Craig’s triple rules of thumb, the modified Craig’s second rule, the normalized water fractional flow curve, Lak, and modified Lak. For this purpose, a set of capillary pressure curves and relative permeability measurements was conducted on 19 core plug samples from a carbonate reservoir. The relationship between wetting indices and rock quality indicators is also discussed.

2. Wettability Measurement Methods

The Amott method [33] evaluates the impact of wettability based on the microscopic displacement efficiency. The Amott oil index is given by
I O = V w s i V w t
where Vwsi is the volume of water displaced by free imbibition of oil and Vwt represents the total volume of water displaced by free and forced imbibitions of oil. The Amott water index is expressed as:
I w = V o s i V o t
where Vosi is the volume of oil displaced by spontaneous imbibition of water and Vot denotes the total volume of oil displaced by spontaneous and/or forced imbibition of water. The Amott indices, Io and Iw, range from 0 to 1. Io and IW values near 1 represent strongly oil- and strongly water-wet systems, respectively. The difference between Iw and Io is known as the Amott–Harvey wettability index [3,32,33,34,35]:
I A H = I w I o
The IAH index varies from −1 for strongly oil-wet to 1 for strongly water-wet cores. Systems with IAH values between −0.3 and +0.3 are commonly considered intermediate-wet.
Donaldson et al. [36] proposed the USBM method to characterize the wettability of rocks based on the areas under forced displacement capillary pressure curves. The USBM index is given by
I U S B M = log ( A 1 A 2 )
where A 1 and A 2 are the areas under the oil and water drive capillary pressure curves, respectively. The USBM index theoretically varies from to + . Usually, the USBM is mistakenly assumed to vary over the range of −1 to 1 and compared with other indices. Mirzaei–Paiaman [66] showed that in practice the lower and upper bounds of this index are not fully known. As a result, comparing USBM with other indices may cause erroneous interpretations due to dissimilar ranges of variation (other indices vary in the range of −1 to 1). Mirzaei–Paiaman [66] highlighted the bounded form of the USBM index denoted as USBM * , which varies between −1 (strongly oil-wet systems) and 1 (strongly water-wet systems), and suggested that it should replace the traditional form of the USBM index.
I U S B M * = A 1 A 2 A 1 + A 2
Craig [38] introduced three rules of thumb based on relative permeability curves for the qualitative evaluation of wettability. In his approach, relative permeability is defined as the effective permeability of a fluid divided by oil permeability measured at interstitial water saturation. According to Craig’s first rule, water relative permeability at residual oil saturation is generally less than 0.3 in water-wet systems, whereas its value is greater than 0.5 in oil-wet porous media. The second rule views a rock as water-wet, if water saturation at the intersection point of relative permeability curves is greater than 50%, otherwise oil-wet. According to the third rule in a water-wet system the value of interstitial water saturation is usually greater than 20 to 25% pore volume, whereas this is generally less than 15% pore volume (frequently less than 10%) for an oil-wet rock.
Ferreira et al. [39] presented another qualitative method to determine wettability from relative permeability curves, based on the concept of fractional flow Equation (6), called the normalized water fractional flow curve.
f w = q w q t = q w q w + q o = 1 1 + μ w k r o μ o k r w
where q w is the water flow rate, q o is the oil flow rate, and q t is the total flow rate, μ w is the water viscosity, μ o is the oil viscosity, k r o is the oil relative permeability, and k r w is the water relative permeability. Ferreira et al. [39] assumed an equal viscosity for oil and water (viscosity ratio equal to 1) to eliminate the influence of the viscosity ratio on water fractional flow (fw) and proposed changing Equation (6) into
f w μ w = μ o = 1 1 + k r o k r w
In the plot of normalized water fractional flow (based on Equation (7)) against normalized water saturation S w n Equation (8), a sample with a curve below the 1:1 line is assumed to be water-wet, otherwise oil-wet. The normalized water saturation is given by
S w n = S w S w c 1 S o r S w c
in which S w is the water saturation, and S w c is the interstitial water saturation.
Mirzaei–Paiaman [15] investigated the validity of Craig’s rules of thumb and showed that while the third rule is generally unreliable, the first rule is suitable. Moreover, he showed that the second rule needed a modification. Mirzaei–Paiaman [15] pointed out that using 50% water saturation as a reference value in the Craig’s second rule is unrealistic and defined a reference crossover saturation (RCS) as follows:
R C S = 1 2 + S w c S o r 2
where Swc and Sor are both expressed as fractions.
According to the modified Craig’s second rule established by Mirzaei–Paiaman [15], the crossover point of relative permeability curves lies to the right of RCS in water-wet rocks, while the crossover point is expected to be located at the left of the RCS in oil-wet systems. Following the above modification, Mirzaei–Paiaman [15] proposed a new wettability index by combining Craig’s first rule and the modified Craig’s second rule as follows:
I L = α ( 0.3 k r w @ R O S 0.3 ) + β ( 0.5 k r w @ R O S 0.5 ) + C S R C S 1 S o r S w c
where I L is the Lak index and k r w @ R O S is the water relative permeability at residual oil saturation. Recall that relative permeability is defined as the effective permeability divided by oil permeability at the interstitial water saturation. In Equation (10), C S is the crossover saturation in fraction, and α and β are constant coefficients determined based on k r w @ R O S as follows:
If   { k r w @ R O S < 0.3 ,   t h e n   α = 0.5 ,   β = 0 0.3 k r w @ R O S   0.5 ,   t h e n   α = β = 0 k r w @ R O S > 0.5 ,   t h e n   α = 0 ,   β = 0.5
Lak index varies from −1 (strongly oil-wet systems) to 1 (strongly water-wet systems).
In another study, Mirzaei–Paiaman et al. [13] showed that the areas below water and oil relative permeability curves could be used to estimate the average wettability as:
I M L = A o A w A o + A w
where A o and A w are respectively the areas below oil and water relative permeability curves and I M L is the modified Lak wettability index which varies from −1 in strongly oil-wet rocks to 1 in strongly water-wet samples. The near zero values of I M L will indicate intermediate wettability.

3. Materials and Experiments

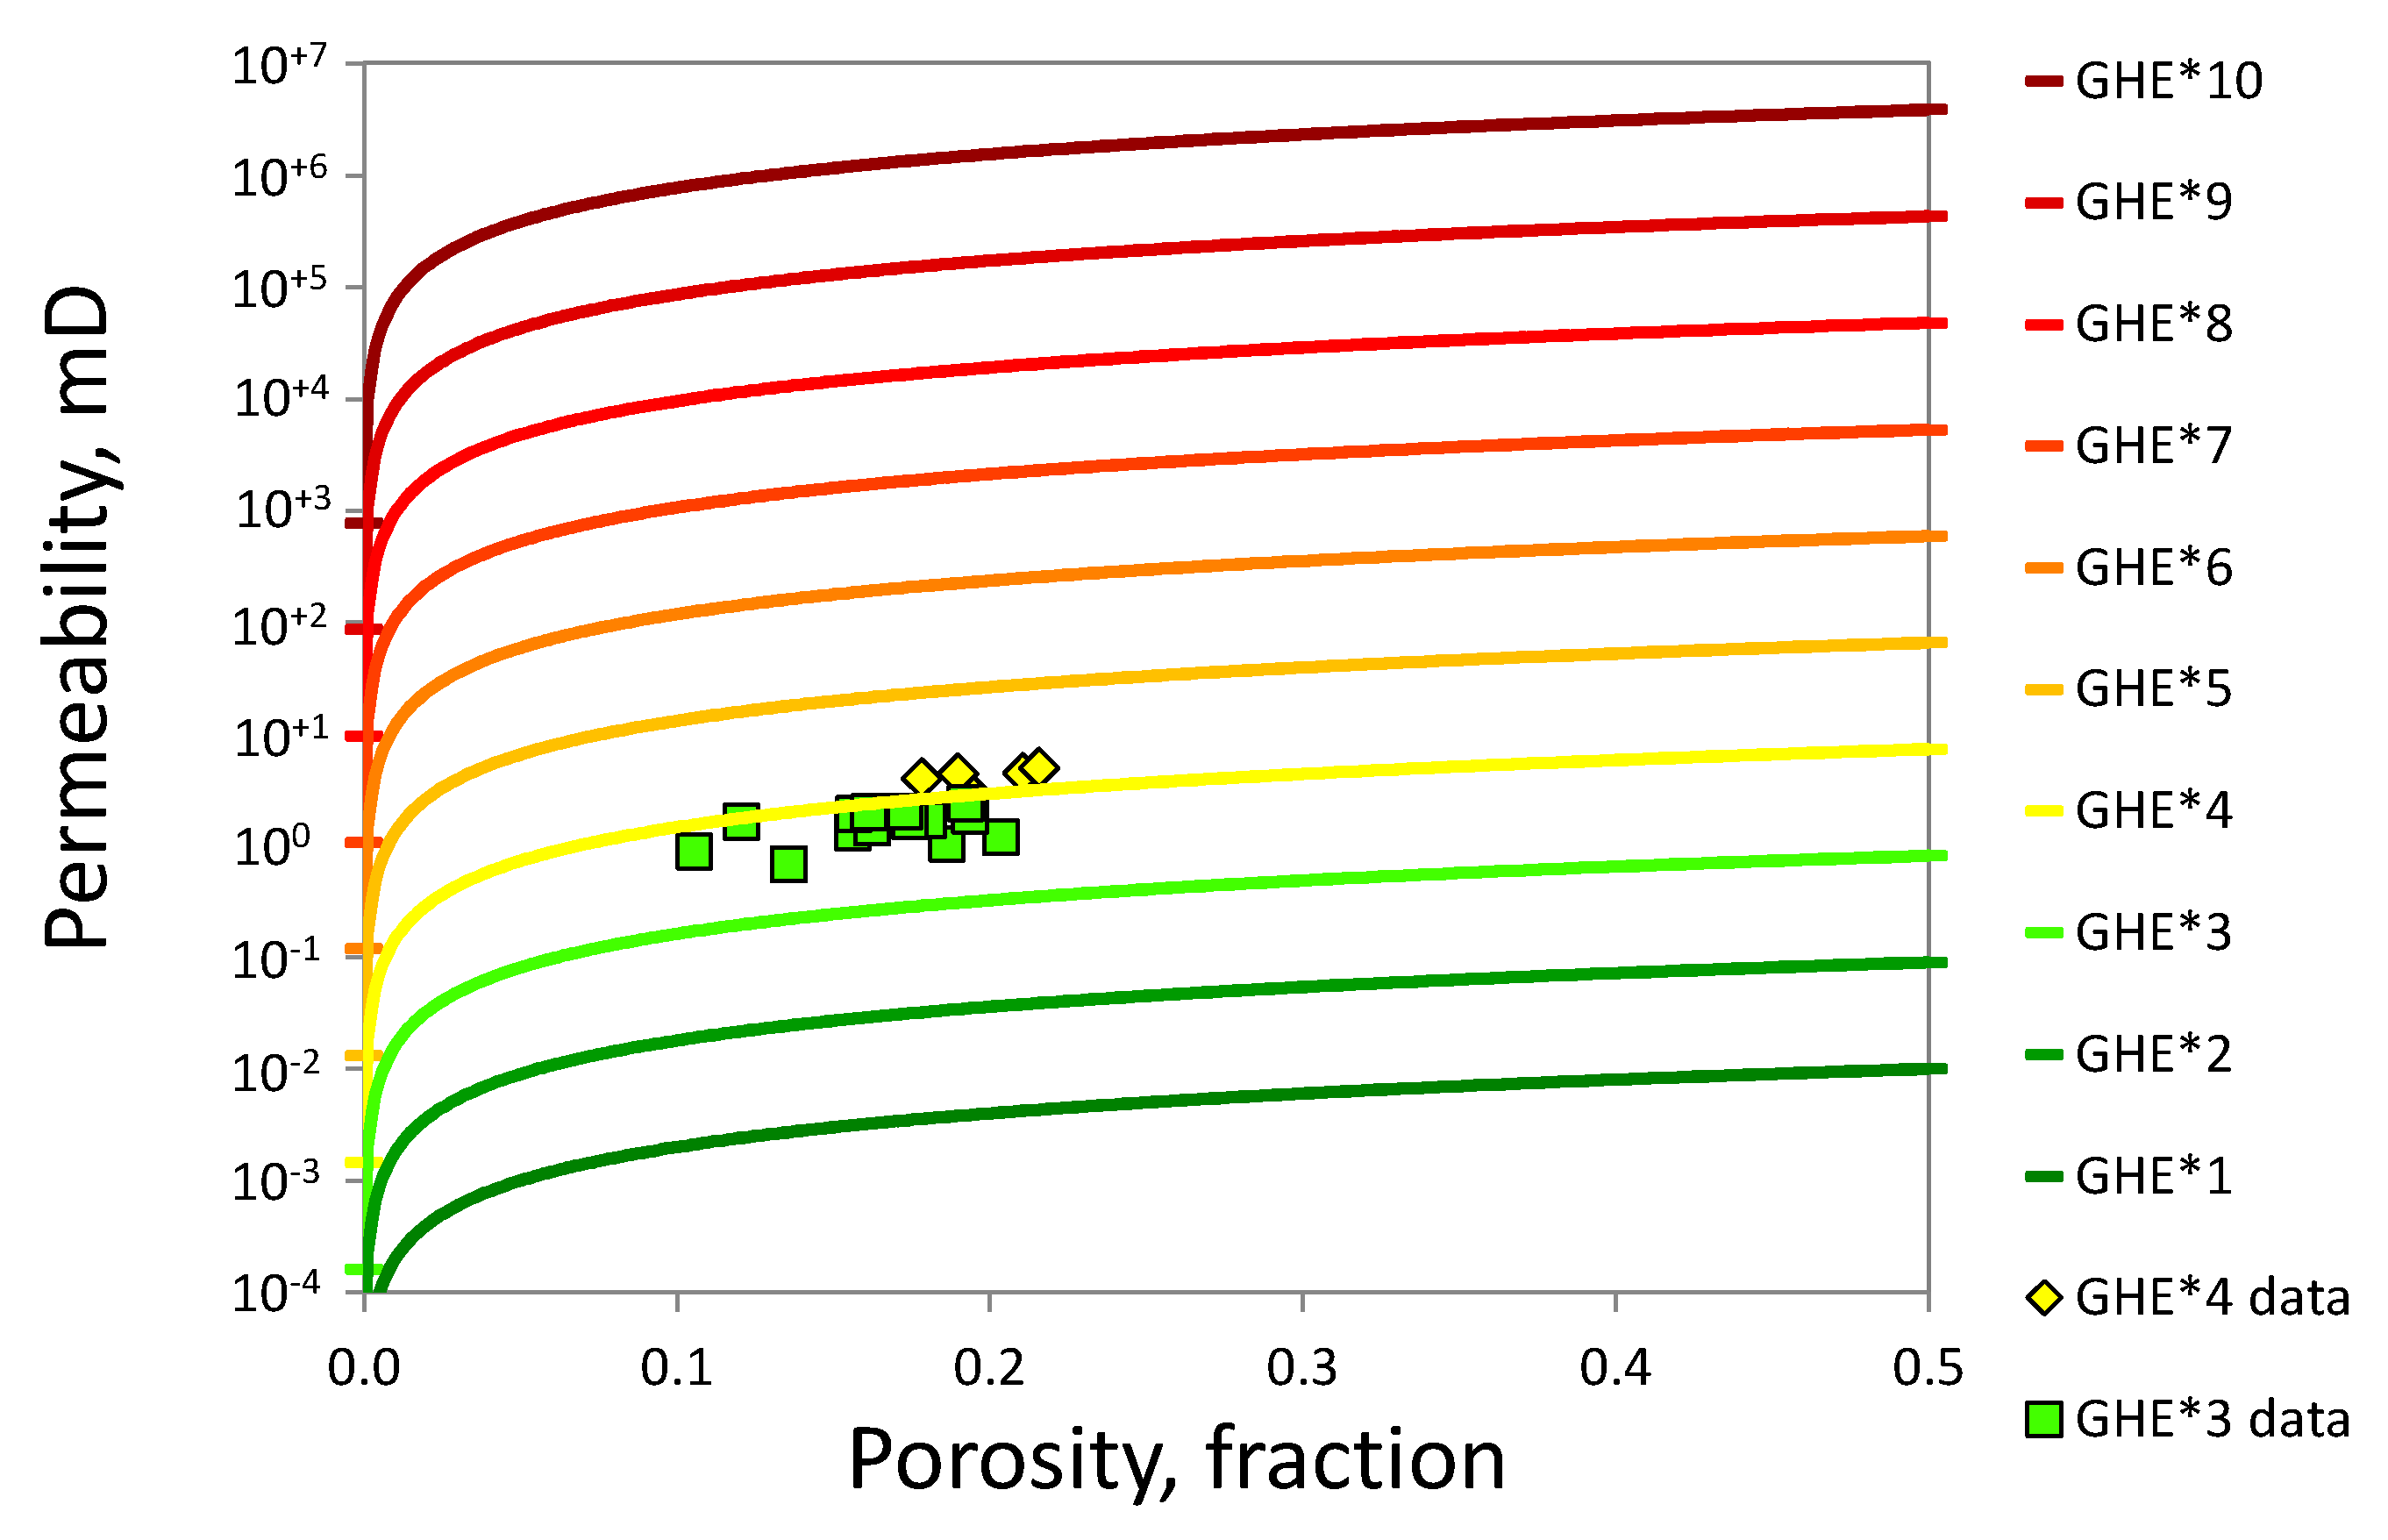
3.1. Plug Samples and Routine Tests

Nineteen core plug samples (with 1.5-inch diameter and 2-inch length) were collected from different depths of a single well in a carbonate reservoir located in the southwest of Iran. The American Petroleum Institute (API) standard of RP40 was employed to prepare the core plugs for routine and special core analysis (RCAL and SCAL) tests. The core plugs were first cleaned using toluene in the Soxhlet extractor in which clearness of the solvent was used as the indicator of a hydrocarbon-free sample. Plugs were then dried in the oven for 48 h. The cores were then cleaned using methanol to eliminate any existing salt crystals where clearness of the extracts in the presence of Silver Nitrate (AgNO3) was adopted as the indicator of a salt-free sample. Consequently, the samples were again dried in the oven at 90 °C for 48 h. After that, the samples were cooled down in desiccators and used for the helium porosity and air permeability measurements.
The petrophysical characteristics (helium porosity and air permeability) of the rock samples are summarized in Table 1. Mirzaei–Paiaman et al. [67] proposed global hydraulic element-star (GHE*) as a graphical template to compare single-phase rock types from different sources (i.e., formations, reservoirs, fields, etc.). Their approach is based on the value of the reservoir quality index (RQI) of Leverett [68] that is used widely in the literature, e.g., by Xu and Torres-Verdin [69] and Mirzaei–Paiaman et al. [70]. The RQI is given by
R Q I = 0.0314 k ϕ
where   ϕ is the porosity in fraction, k is the permeability in millidarcy, and RQI is the reservoir quality index in microns.
The GHE* framework consists of a template comprising ten preset classes, as presented in Figure 1. In this figure, each line on the template corresponds to a given RQI value and describes the lower boundary of a prebuilt reference GHE* class. We used this technique to identify single-phase rock types.
Table 1 includes the GHE* number and RQI value corresponding to each sample. As reported in Table 1, the plugs studied here belong to GHE* classes 3 and 4. This limited number of rock types is probably because porosity and permeability only span a factor of nearly two and seven, respectively, in the studied database. It is noteworthy to mention that the original GHE technique was presented by Corbett and Potter [71] based on the flow zone indicator (FZI) proposed by Amaefule et al. [72] as follows
F Z I = 0.0314 k ϕ ϕ 1 ϕ

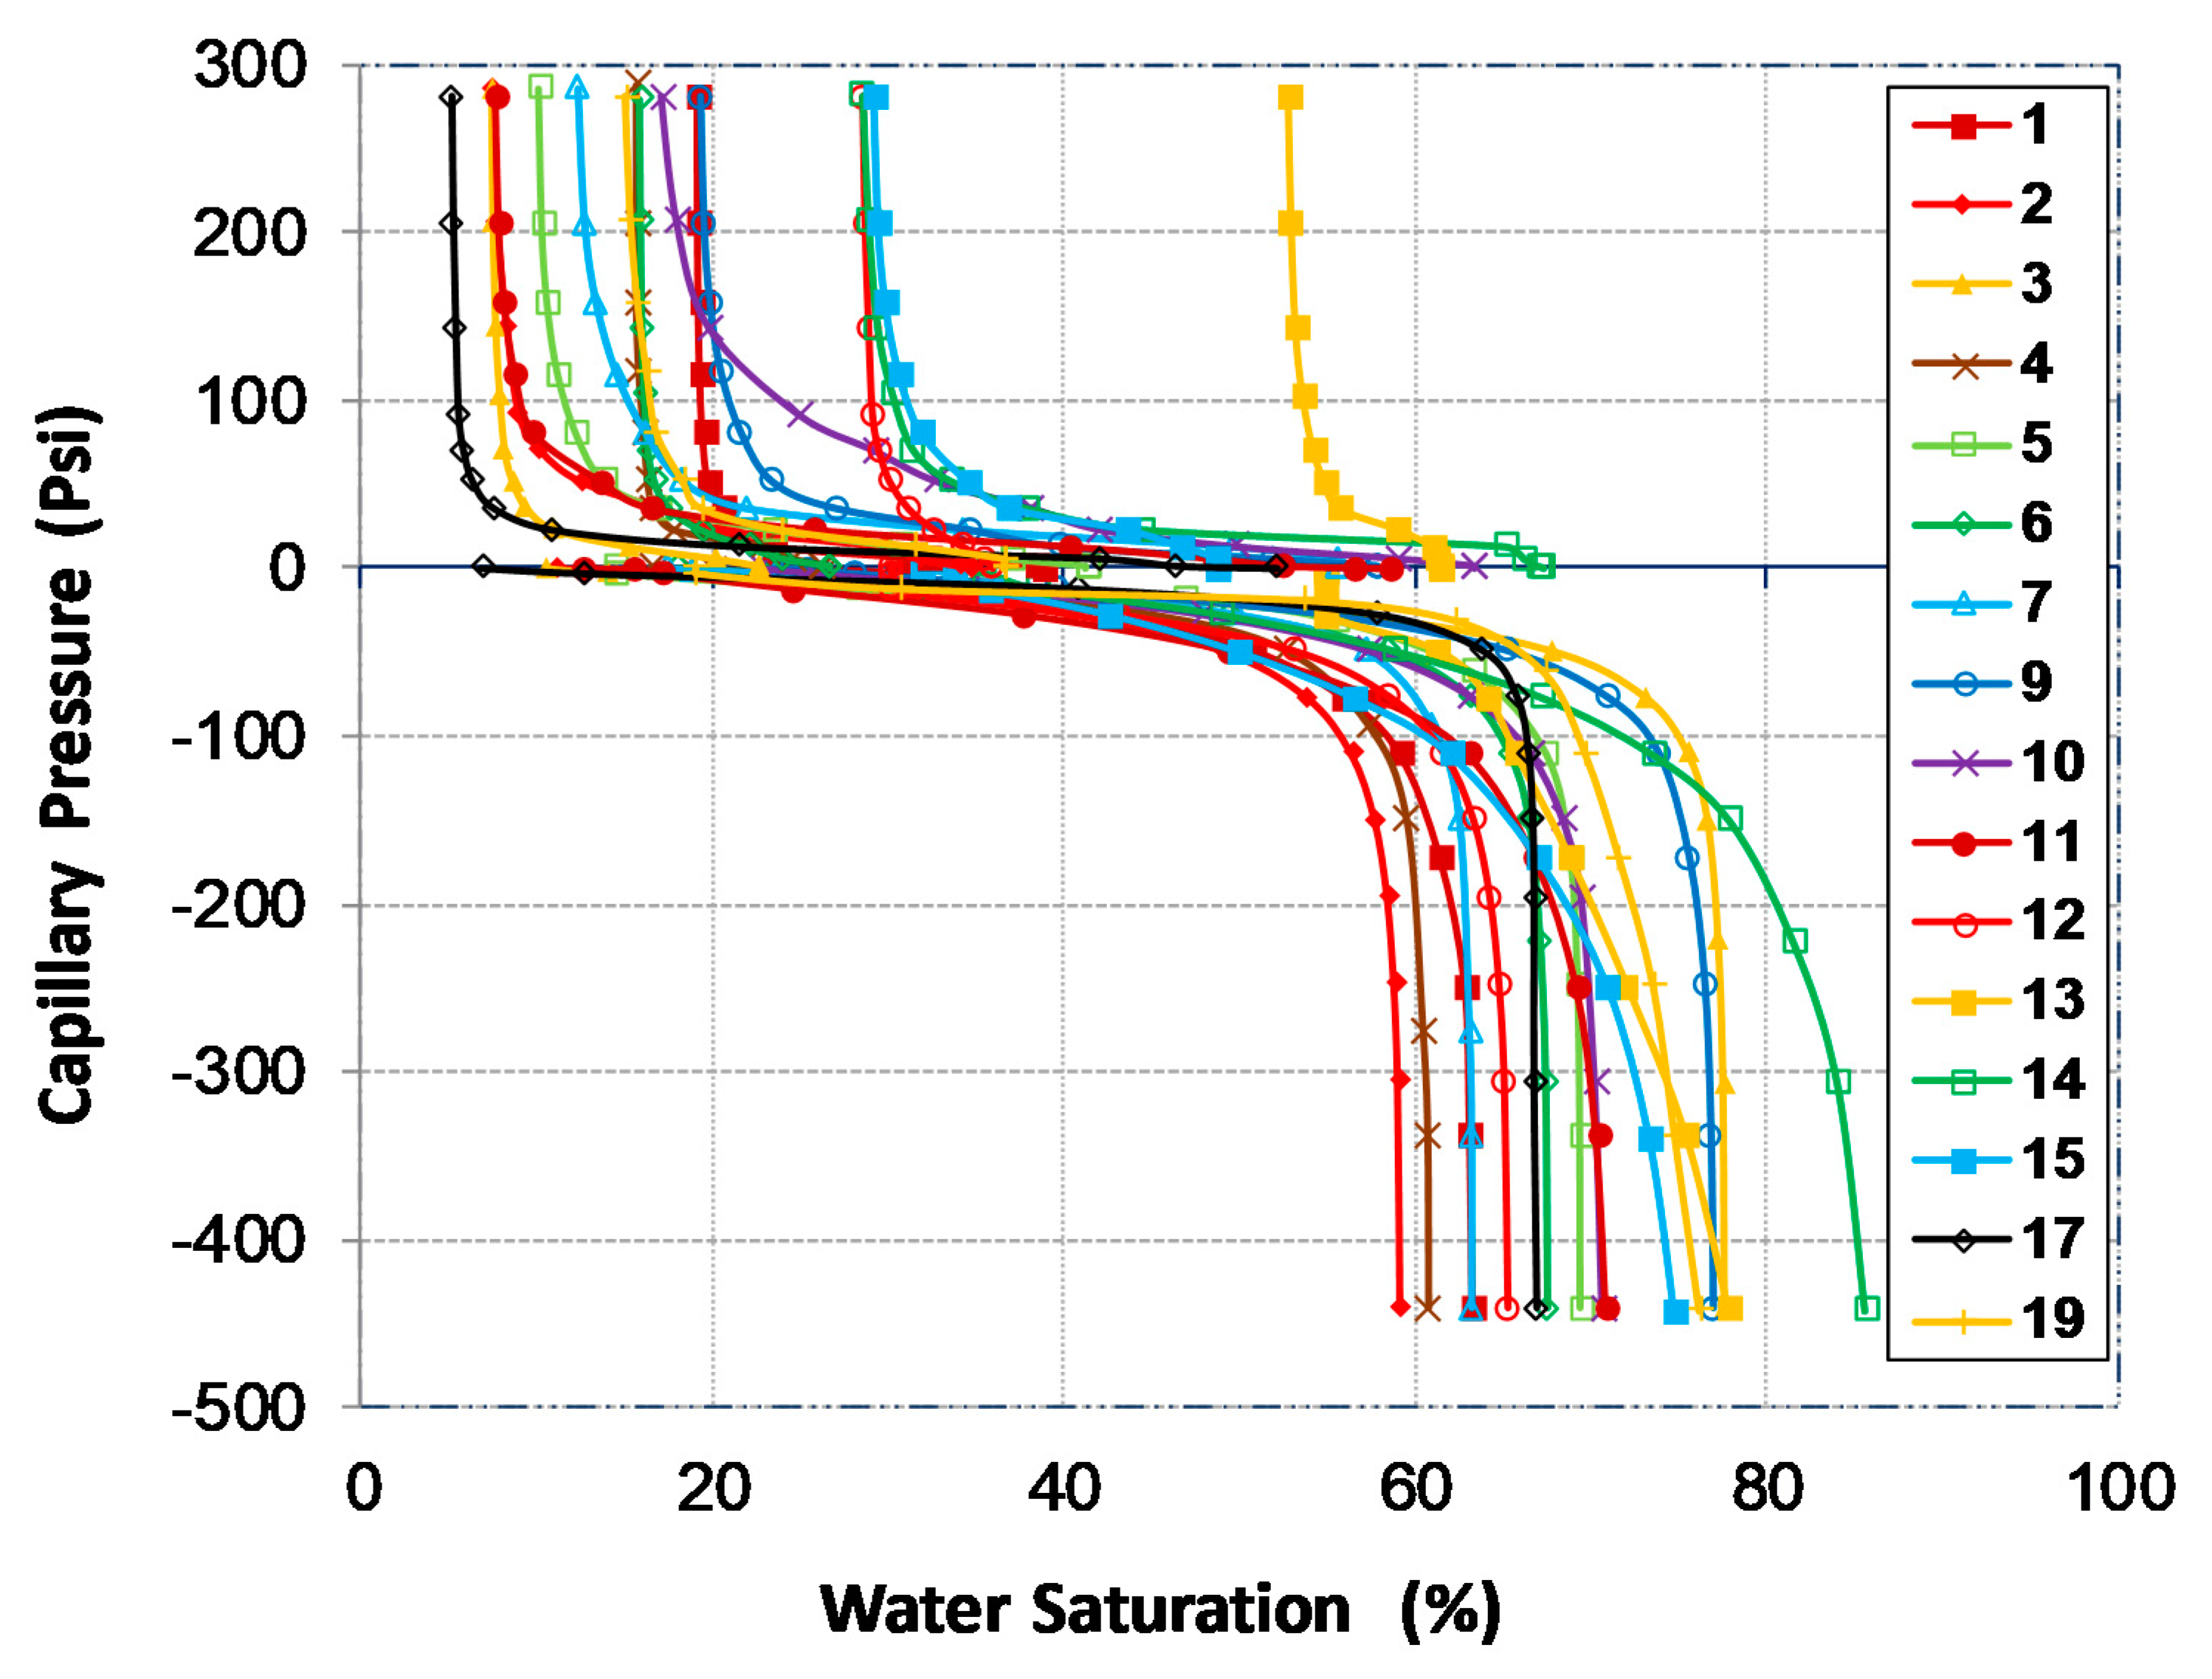
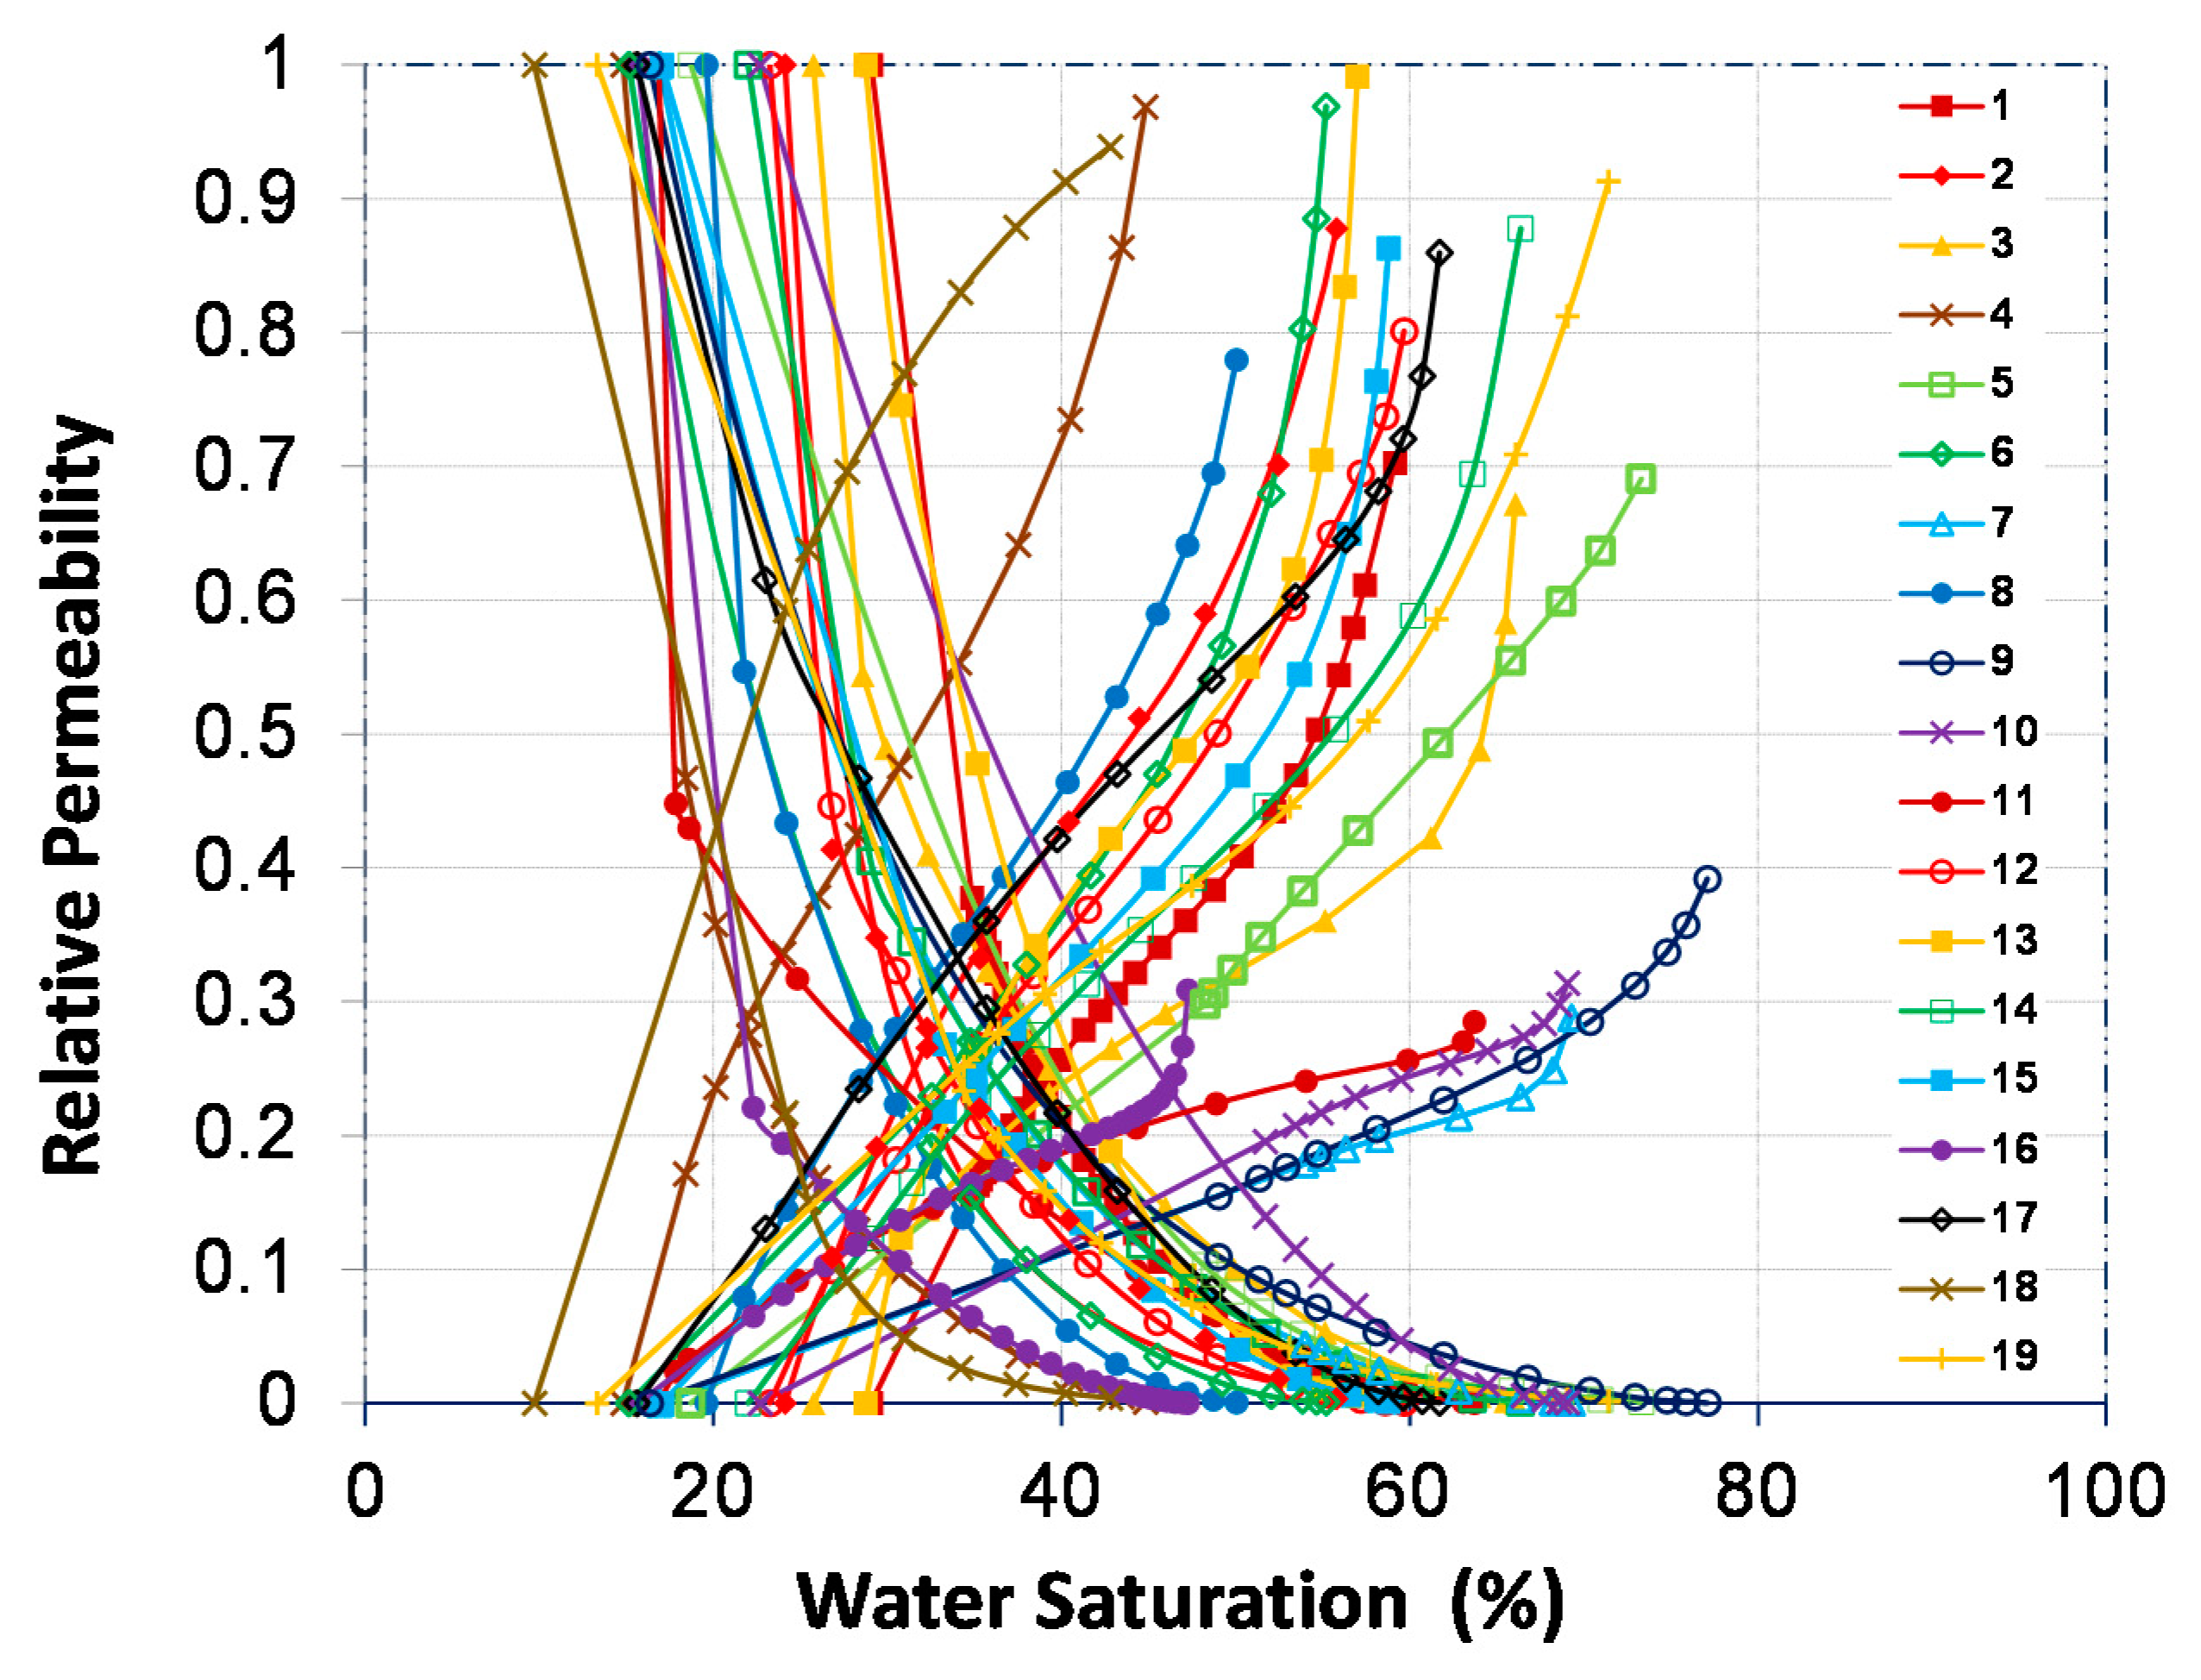
3.2. SCAL Tests and Fluids

Plugs were first saturated with a synthetic brine, i.e., a NaCl solution with salinity of 190 g/liter. They were then kept in the brine for at least ten days to reach ionic equilibrium conditions between the rock sample and the brine. Several pore volumes of brine were next injected at a constant pressure. The recorded data were used to calculate the absolute permeability of the samples by employing Darcy’s law. After that, the primary drainage water-oil capillary pressure curve tests were conducted at 50 °C using the centrifuge method where dead crude displaced the brine at a series of centrifuge speeds until reaching the irreducible brine saturation. Next, the core plugs were kept in the crude oil at the reservoir temperature of 70 °C for almost two weeks to restore their native-state wettability. We flushed the cores twice with the crude oil during the aging process to enhance a uniform wettability in the samples. To alleviate the injectivity issues and possible permeability impairment phenomena that were likely in the next-step flooding tests, the dead reservoir oil was replaced by a synthetic oil (n-Decane). We injected decalin as a buffer fluid between synthetic oil and crude oil to prevent any potential asphaltene precipitation and deposition. Consequently, the unsteady-state brine displacing oil tests were conducted at room temperature and continued until no more oil was produced. The collected data were used to calculate the relative permeability curves using the method of Jones and Roszelle [73].
After the relative permeability tests, the core plugs were centrifuged at room temperature where synthetic oil displaced water to attain irreducible brine saturation. Afterwards, spontaneous and forced displacement processes were carried out. The volume of brine freely imbibed into the plug was measured in the Amott cell, followed by brine displacing oil centrifugal displacement at several rotational speeds to reach the residual oil saturation where forced displacement capillary pressure curves were also determined. Then, the volume of oil freely imbibed into the plug was measured in the Amott cell, followed by oil displacing brine centrifugal displacement at several rotational speeds to reach irreducible water saturations where the corresponding forced displacement capillary pressure curves were also determined. Measurements on three samples (plugs no. 8, 16, and 18) had questionable results that were rejected after quality control. The properties of the fluids used are shown in Table 2.

4. Results and Discussion

Figure 2 shows the measured forced displacement capillary pressure curves. In this figure, the positive curves correspond to secondary drainage process where the negative ones represent primary imbibition displacement. The area below each curve was determined to calculate the USBM and USBM* indices using Equations (4) and (5), respectively. The Amott index of oil, Equation (1), and water, Equation (2) as well as the Amott–Harvey index Equation (3) were also calculated using the variations in saturation corresponding to the spontaneous and forced displacements.
Table 3 summarizes the calculated values of the Amott, Amott–Harvey, USBM, and USBM* indices. As indicated in Table 3, for three samples (8, 16, and 18) the capillary pressure curves were not available, for which Iw, Io, IAH, IUSBM and IUSBM* were not reported. For the remaining 16 samples, we found general agreement among these five indices. Results showed oil-wet conditions for 14 samples and intermediate-wet conditions for samples 7 and 10.
Figure 3 shows the oil and water relative permeability curves measured on the 19 core samples. Although the oil relative permeability curves are similar in terms of shape (upward curvature), the water relative permeability curves are diverse representing a wide range of behaviors. Figure 4 shows the normalized water fractional flow data, Equation (7), against the normalized water saturation, Equation (8). As can be seen, most data points are above the 1:1 line, which indicates oil-wetness of the samples.
The relative permeability measurements were used to evaluate Craig’s rules of thumb and the modified Craig’s second rule, plot the normalized water fractional flow curves, and calculate the values of Lak and modified Lak indices (Table 4). As Table 4 indicates, the results of Craig’s second rule and those of the modified Craig’s second rule are in agreement for all samples except samples 7 and 10. For these two samples other indicators show water-wet conditions. While Craig’s second rule characterizes these samples as oil-wet, the modified Craig’s second rule labels them as water-wet. Furthermore, Craig’s third rule also provided results inconsistent with the others. Although Craig’s third rule predicted water-wet conditions, other indices recommend oil-wet. Such inconsistencies have been previously reported by Mirzaei–Paiaman [15]. Since the results of Craig’s second and third rules are inconsistent with those of other approaches, we excluded them from further analyses.
Results of the relative permeability-based methods implied that the qualitative and quantitative indices consistently predicted oil-wet conditions for 14 samples (all samples excluding 7, 9, 10, 11, and 16). Such methods indicated almost water-wet conditions for samples 7 and 10. For samples 9, 11, and 16 there was no agreement among the different methods. For samples 9 and 16, while qualitative methods characterized oil-wet rocks, quantitative indices showed intermediate-wet conditions. For sample 11, while Craig’s first rule indicated that the rock sample should be water-wet, the modified Craig’s second rule and normalized water fractional flow curve recommended oil-wet. For this sample the Lak and modified Lak indices represented intermediate-wet rock. Comparing the results of the relative permeability-based methods with those of the Amott, Amott–Harvey, USBM, and USBM* techniques showed generally good agreements among these approaches, despite their difference in terms of concepts and methodologies.
We also investigated possible correlations and trends among the wettability indices. Cross-plots of different wettability indices studied here are shown in Figure 5 in which the dashed line represents the 1:1 line and the solid red line denotes the linear equation fitted to the data. As mentioned earlier, while USBM is an unbounded index it is usually mistakenly assumed to vary over the range of −1 to 1 and compared with other indices. Comparison between USBM and other indices may cause erroneous interpretations due to dissimilar ranges of variation (other indices vary in the range of −1 to 1). In this study, we therefore used USBM* as a replacement of the traditional USBM index [66] in the comparative analysis. USBM* varies over the range of −1 to 1, similar to other indices. Although the trends are similar (as one index increases another one increases as well), the correlation coefficient R2 varies from one plot to another. The highest correlation coefficient values belong to the USBM*–Amott–Harvey (see Figure 5a) and Lak–Modified Lak (see Figure 5b) plots. The high R2 value between the Lak and modified Lak indices might be because these two methods apply the same concepts based on relative permeability measurements. The relatively high correlation coefficient between Amott–Harvey and USBM* indices (R2 = 0.70), given that they are based on different concepts, might be due to lack of spatial heterogeneity in the database studied here. Recall that the carbonate rock samples were collected along a well from a single carbonate reservoir. Analyzing samples from different geologic formations might lead to higher level of heterogeneity and accordingly lower correlation coefficients. The modified Lak index, IML, was correlated to the USBM* and Amott–Harvey indices with R2 = 0.44 (Figure 5c,f). However, the Lak index, IL, was slightly more correlated to IUSBM* with R2 = 0.48 and IAH with R2 = 0.52 (Figure 5d,e).
In the literature, there exist various approaches for rock typing. For recent reviews see [74,75]. To explore the trends among wettability indices and rock quality indicators, we calculated RQI and FZI values based on Equations (13) and (14), respectively. The Winland R35 [76], as one of the widely used rock quality indicators, was also determined from the porosity and permeability measurements as follows
log ( R 35 ) = 0.732 + 0.588 log k 0.864 log ( 100 ϕ )
where R35 is in microns. Figure 6 displays the quantitative wettability indices I A H (Amott–Harvey), I U S B M * (USBM*), I L (Lak), and I M L (modified Lak) against the reservoir quality indicators FZI, RQI, and Winland R35. In general, as rock quality indicators increase (or rock quality improves), the wettability indices decrease, meaning that the rocks become more oil-wet. Results showed that the USBM* and Amott–Harvey indices, I U S B M * and I A H , were weakly correlated to the rock quality indicators (0.03 < R2 < 0.2). Although the Lak and modified Lak indices, I L and I M L , were intermediately correlated to the rock quality indicators RQI and Winland R35 (0.41 < R2 < 0.50), they were weakly correlated to FZI (R2 = 0.27 for I L and 0.14 for I M L ). As shown by Mirzaei–Paiaman et al. [74], while FZI is a function of grain diameter, the value of RQI is mainly controlled by pore-throats and their sizes. Winland R35 is also a function of pore-throat radii [76]. Since the Lak and modified Lak indices are based on the relative permeability measurements, they are strongly affected by wetting characteristics of larger pore throats, which control fluid flow through rocks. The network of larger pore throats also controls rock quality. However, the USBM* and Amott–Harvey indices take into account the effect of both small and large pore throats. This could be the reason for relatively high correlations between Lak and modified Lak indices and rock quality indicators RQI and Winland R35. However, the number of samples used in this study is limited to 19 core plugs and the dataset is rather homogeneous (samples were collected along one well in a carbonate reservoir). Adding more samples from different formations may result in more scatter in the data. Further investigations are required to address the trend between wettability indices and rock quality indicators.

5. Conclusions

In this study, a set of capillary pressure and relative permeability curves measured on 19 carbonate rock samples was used to analyze and compare different wettability indices, such as Amott, Amott–Harvey, and USBM* as well as the relative permeability-based wettability measurement methods of Craig’s rules of thumb, modified Craig’s second rule, normalized water fractional flow, Lak, and modified Lak. The following conclusions can be drawn from this study based on 19 core plugs from a single well in a carbonate reservoir:
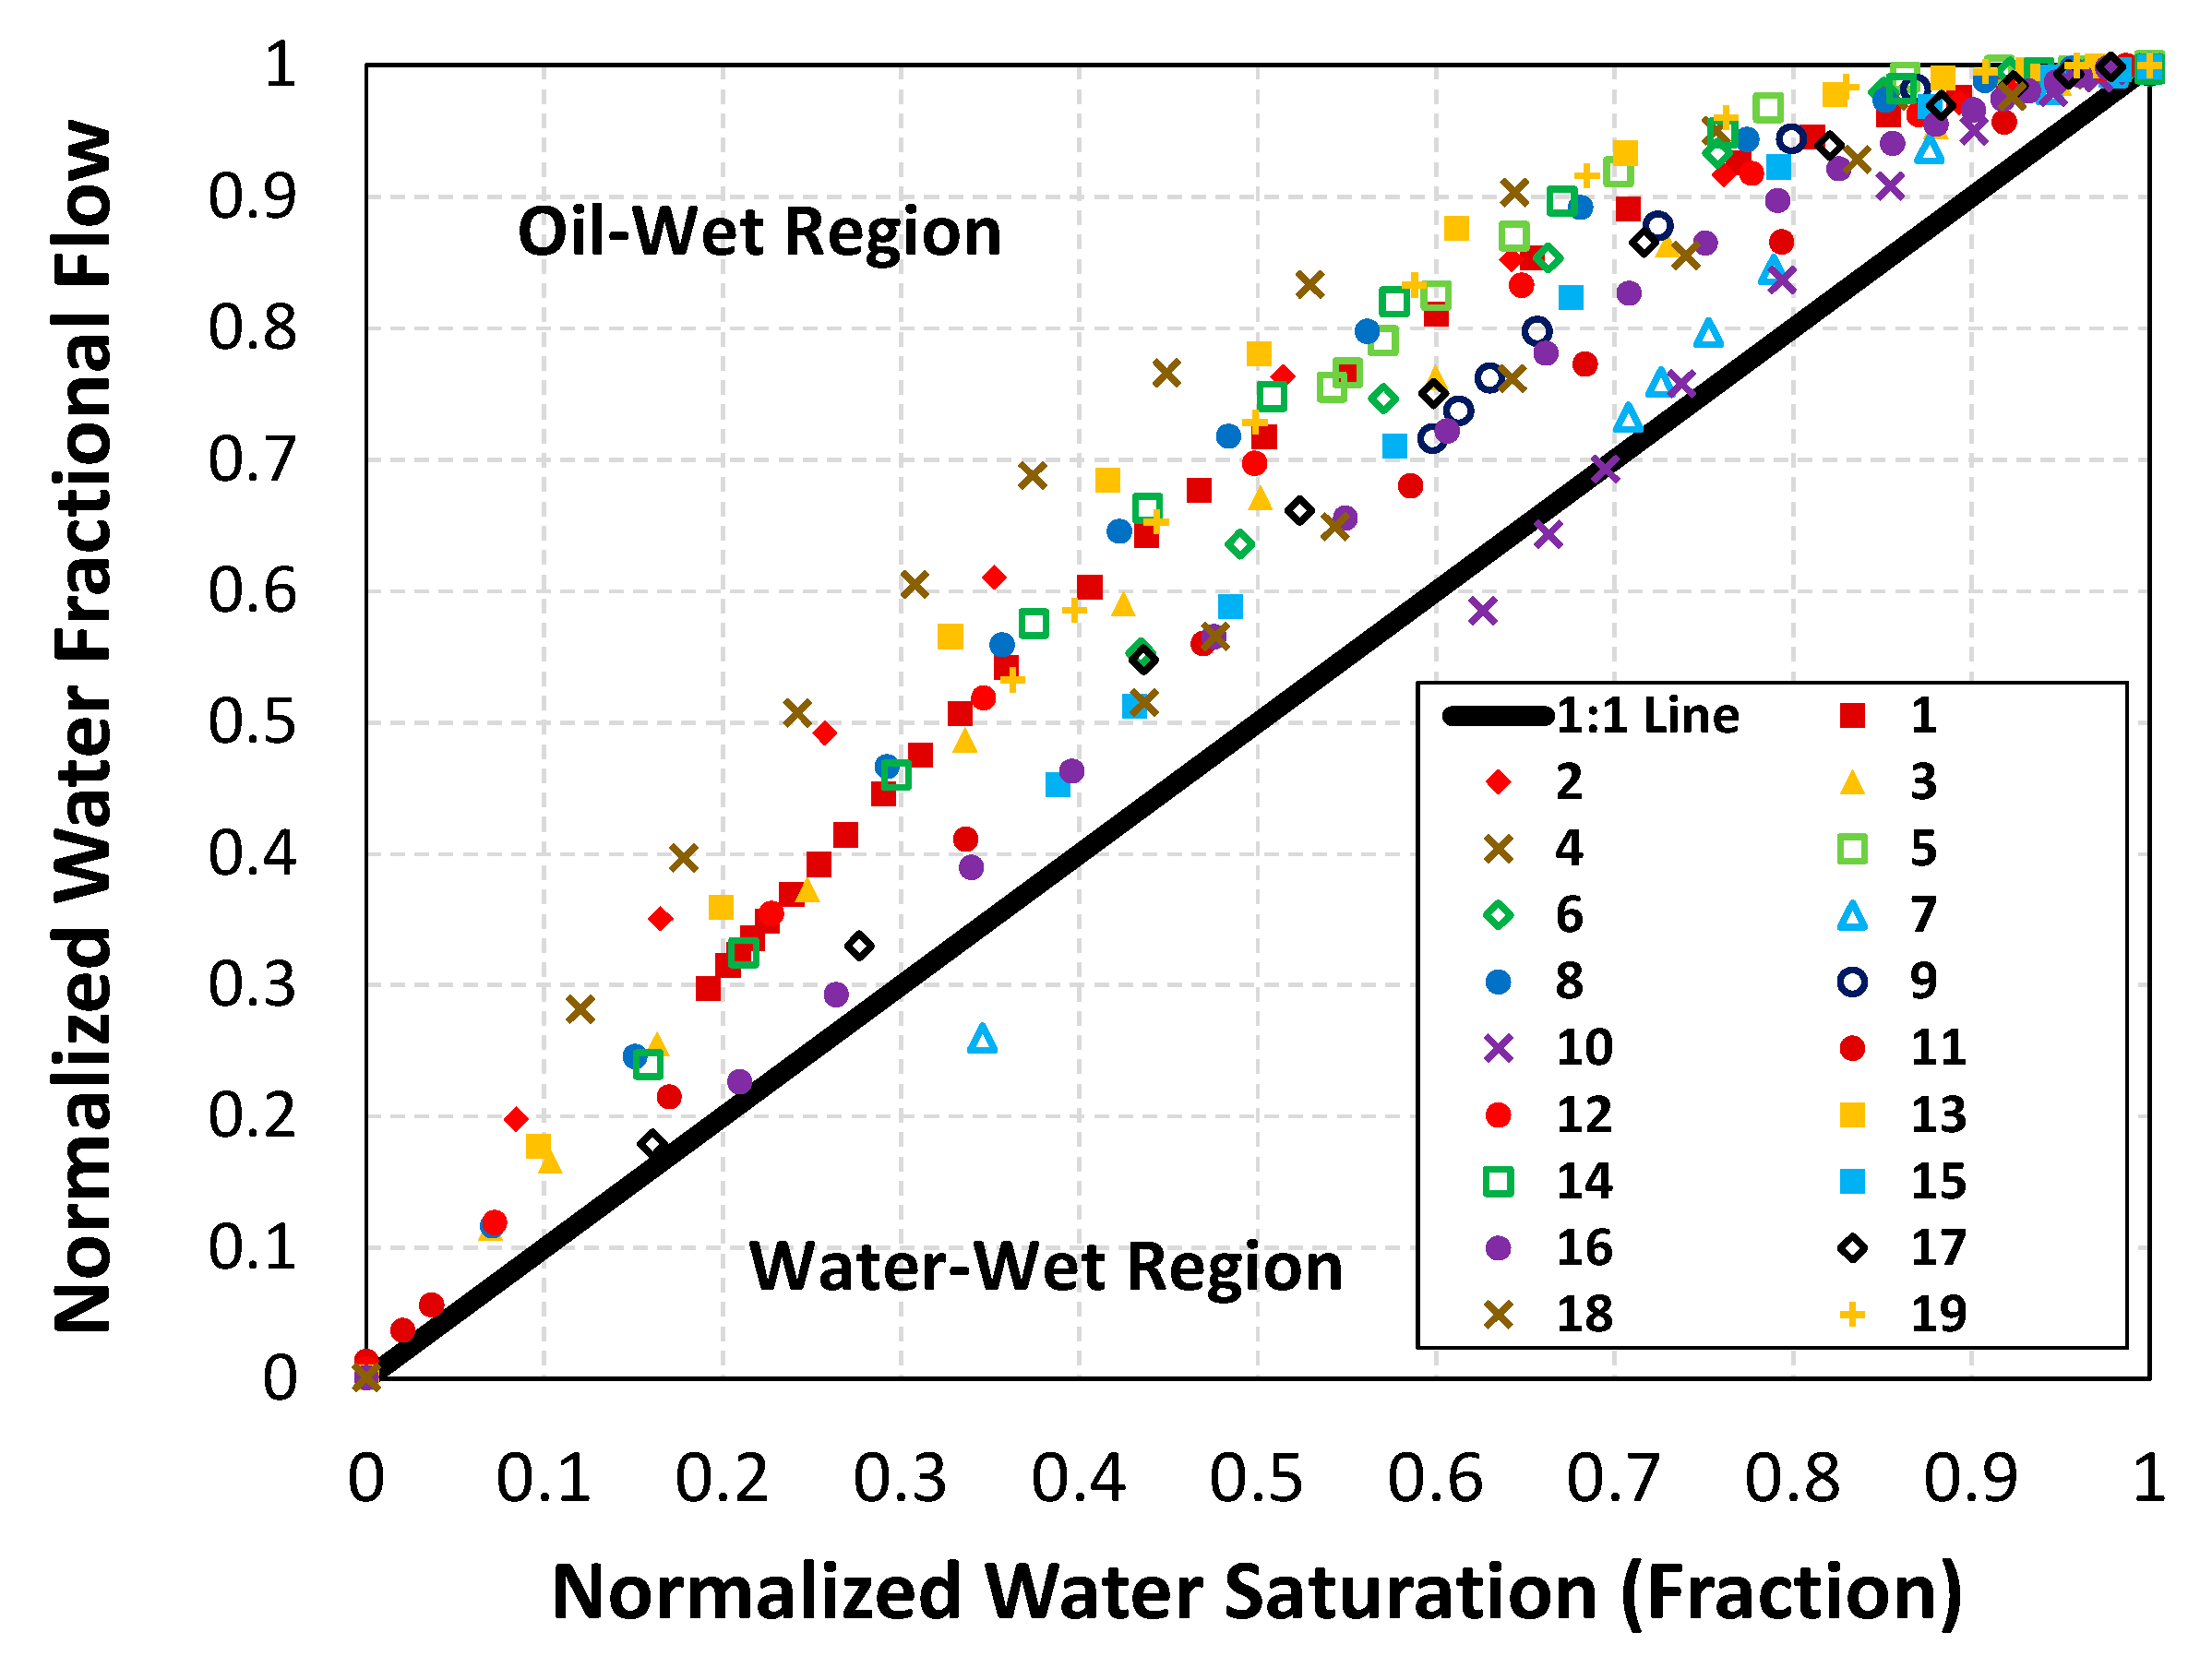
  • Generally speaking, good agreement was obtained between the relative permeability-based methods and Amott, Amott–Harvey, and USBM* techniques in identifying the wetness of carbonate samples, despite such methods being based on different concepts and physics. Thus, it is convenient to use relative permeability-based methods when the required data for the Amott–Harvey and USBM* methods are not available.
  • There was a good correlation between the USBM* and the Amott–Harvey methods as well as between the Lak and the modified Lak approaches. Intermediate correlations were observed among the other methods.
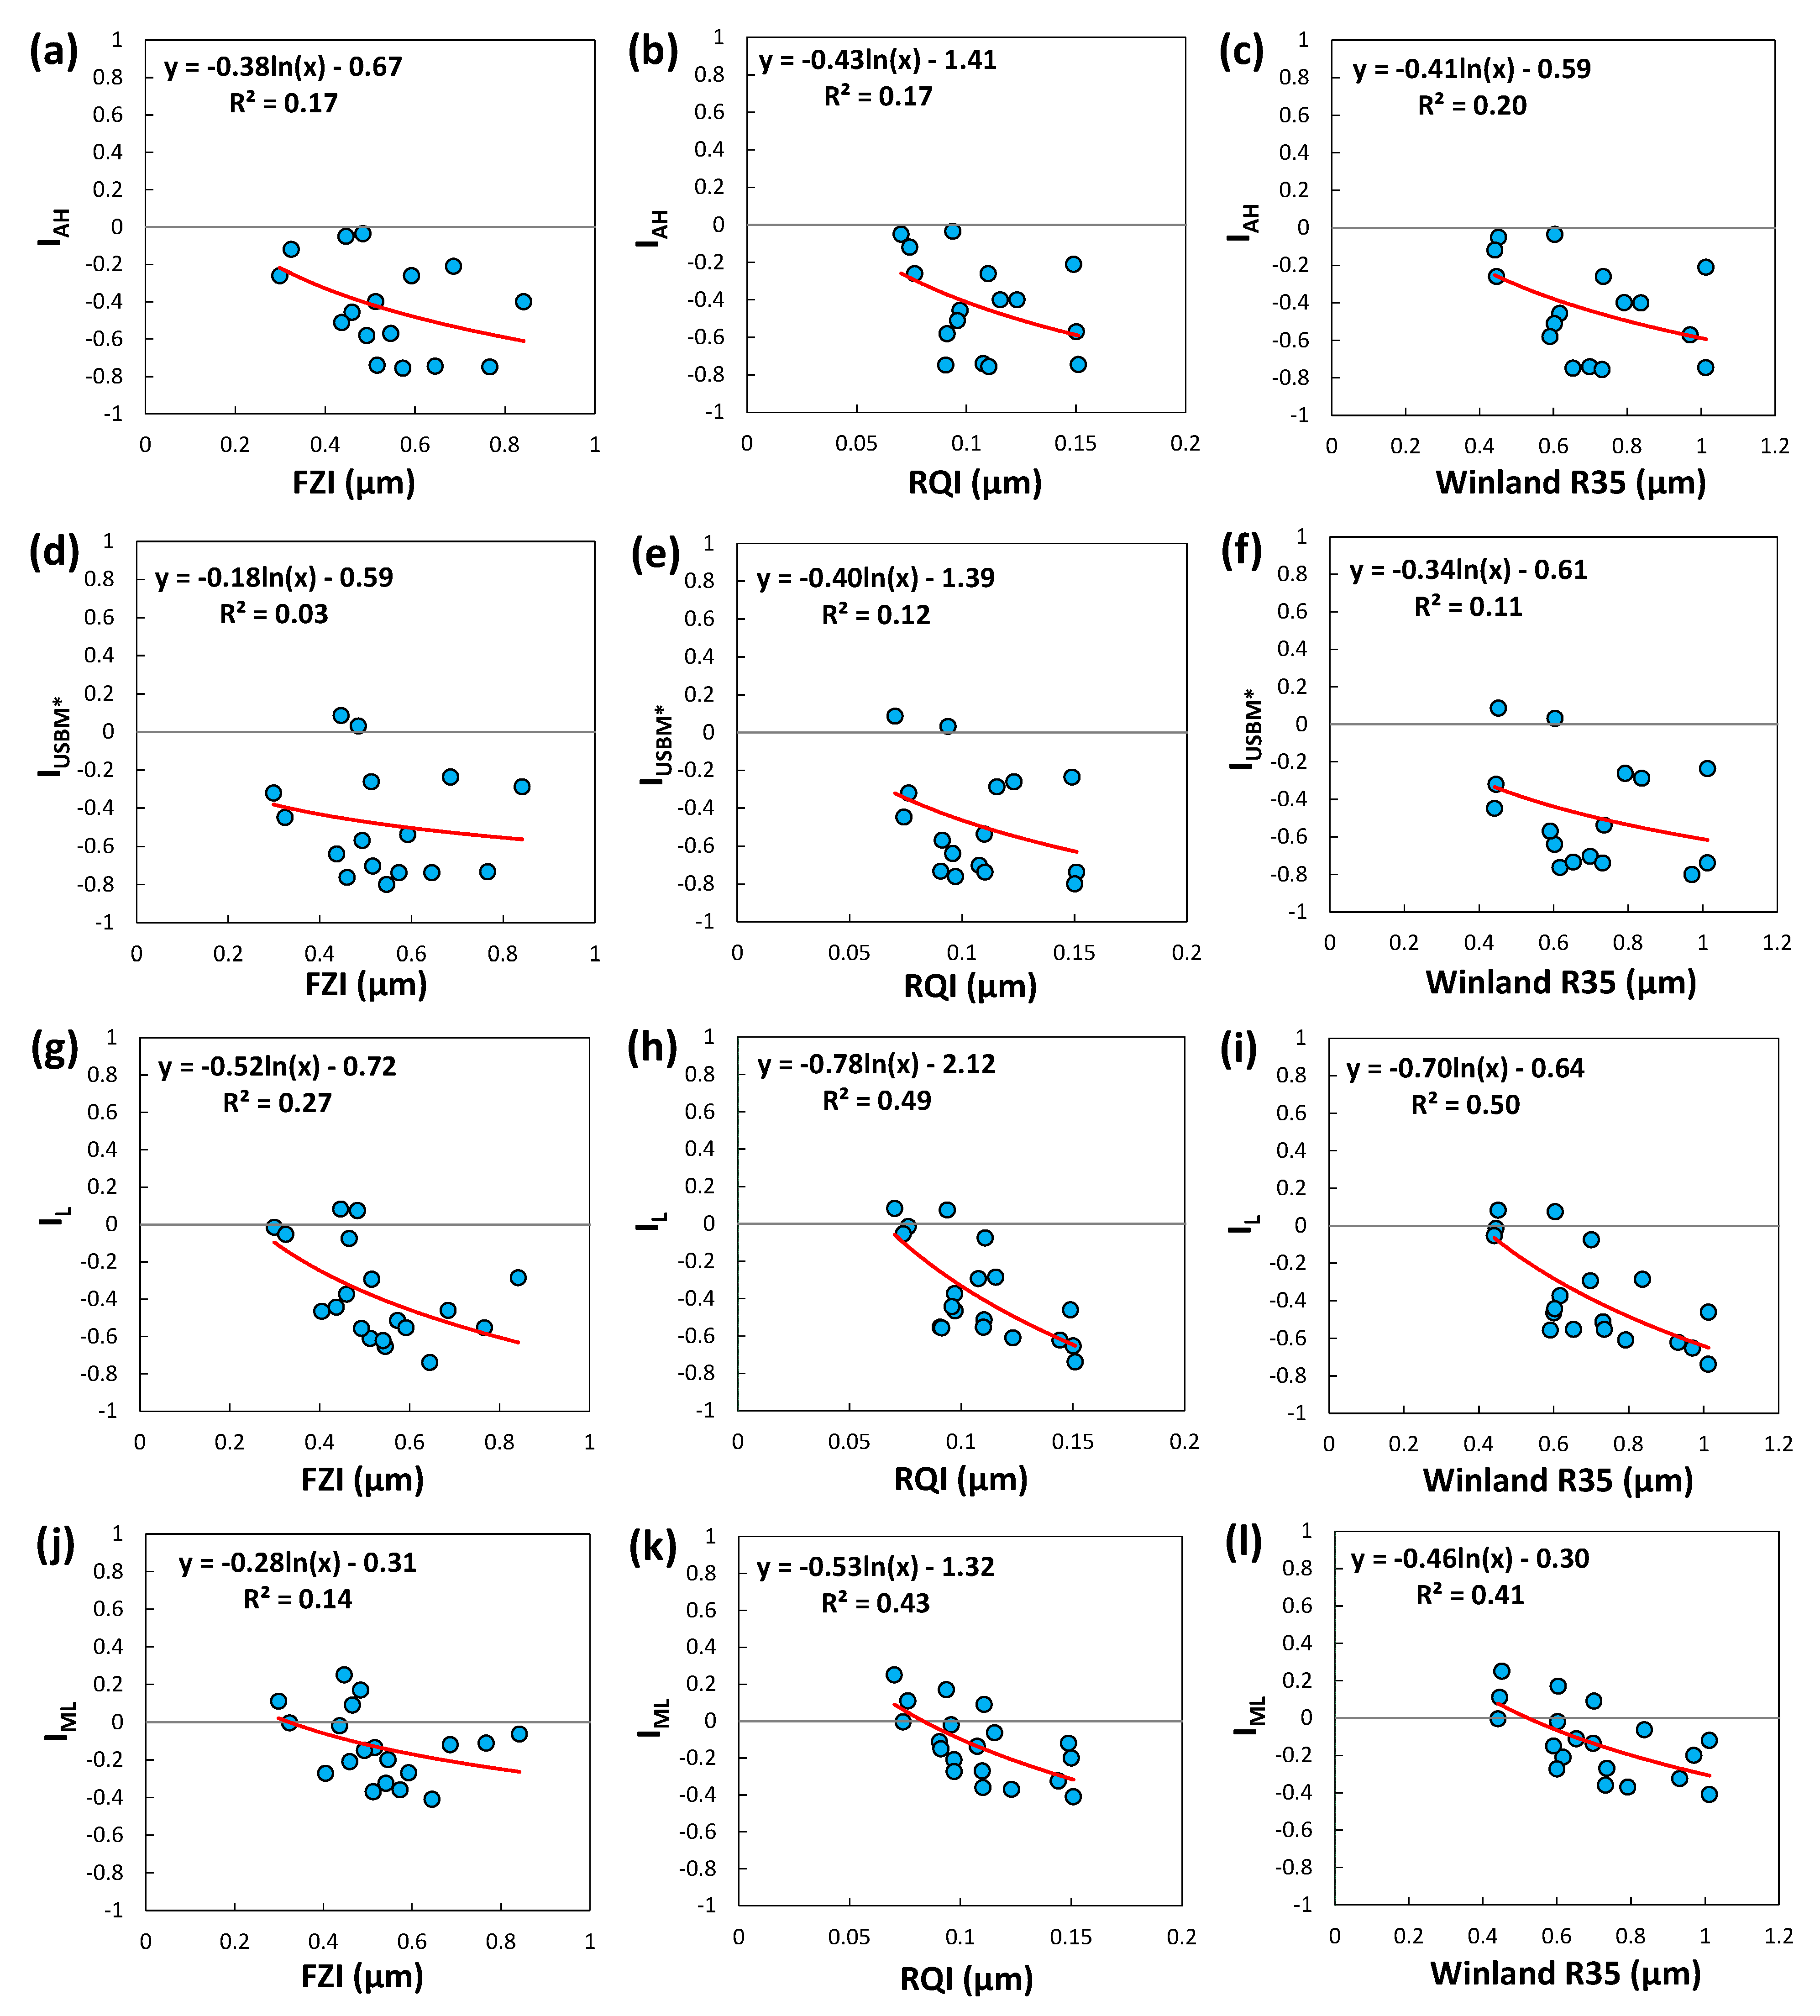
  • Comparing the wettability indices with rock quality indicators showed that as FZI, RQI, and Winland R35 increased (or rock quality improved), samples became more oil-wet.
  • Rock quality indices RQI and Winland R35 that are mainly a function of pore throats and their sizes were correlated with wettability indices higher than the FZI.
  • The Lak and modified Lak indices, as two quantitative relative permeability-based wettability techniques, provided higher correlations with rock quality indicators than the Amott–Harvey and USBM* indices. Those wettability indices strongly affected by wetting characteristics of larger pore throats were higher correlated to rock quality indicators than indices taking into account the effect of both small and large pore throats.

Author Contributions

Conceptualization, M.F.-P. and A.M.-P.; methodology, M.F.-P. and A.M.-P.; software, M.F.-P.; validation, M.F.-P., A.M.-P. and B.G.; formal analysis, M.F.-P., A.M.-P. and B.G.; investigation, M.F.-P., A.M.-P., S.A.G. and B.G.; resources, M.F.-P.; data curation, M.F.-P., A.M.-P. and B.G.; writing—original draft preparation, M.F.-P., A.M.-P., S.A.G. and B.G.; writing—review and editing, M.F.-P., A.M.-P., S.A.G. and B.G.; visualization, M.F.-P., A.M.-P., S.A.G. and B.G.; supervision, A.M.-P. and B.G.; project administration, M.F.-P., A.M.-P. and B.G. All authors have read and agreed to the published version of the manuscript.

Funding

This research received no external funding.

Institutional Review Board Statement

Not applicable.

Informed Consent Statement

Not applicable.

Data Availability Statement

Data available on request from A.M.-P.

Acknowledgments

Behzad Ghanbarian is grateful to Kansas State University for supports through faculty start-up funds.

Conflicts of Interest

The authors declare no conflict of interest.

References

  1. Anderson, W.G. Wettability literature survey-part 1: Rock/oil/brine interactions and the effects of core handling on wettability. J. Pet. Technol. 1986, 38, 1125–1144. [Google Scholar] [CrossRef]
  2. Anderson, W.G. Wettability Literature Survey-Part 3: The Effects of Wettability on the Electrical Properties of Porous Media. J. Pet. Technol. 1986, 38, 1371–1378. [Google Scholar] [CrossRef]
  3. Anderson, W.G. Wettability literature survey-part 4: Effects of wettability on capillary pressure. J. Pet. Technol. 1987, 39, 1283–1300. [Google Scholar] [CrossRef]
  4. Anderson, W.G. Wettability literature survey part 5: The effects of wettability on relative permeability. J. Pet. Technol. 1987, 39, 1453–1468. [Google Scholar] [CrossRef]
  5. Anderson, W.G. Wettability literature survey-part 6: The effects of wettability on waterflooding. J. Pet. Technol. 1987, 39, 1605–1622. [Google Scholar] [CrossRef]
  6. Liaw, S.-P.; Dhir, D.V.K. Effect of surface wettability on transition boiling heat transfer from a vertical surface. In Proceedings of the International Heat Transfer Conference, San Francisco, CA, USA, 17–22 August 1986. [Google Scholar]
  7. Zhou, D.; Stenby, E.H. A Percolation Study of Wettability Effect on the Electrical Properties of Reservior Rocks. Transp. Porous Media 1997, 29, 85–98. [Google Scholar] [CrossRef]
  8. Wen, D.S.; Wang, B.X. Effects of surface wettability on nucleate pool boiling heat transfer for surfactant solutions. Int. J. Heat Mass Transf. 2002, 45, 1739–1747. [Google Scholar] [CrossRef]
  9. Hsu, C.-C.; Chen, P.-H. Surface wettability effects on critical heat flux of boiling heat transfer using nanoparticle coatings. Int. J. Heat Mass Transf. 2012, 55, 3713–3719. [Google Scholar] [CrossRef]
  10. Beltrán, A.; Hernández-Díaz, D.; Chávez, O.; García, A.; Mena, B.; Zenit, R. Experimental study of the effect of wettability on the relative permeability for air–water flow through porous media. Int. J. Multiph. Flow 2019, 120, 103091. [Google Scholar] [CrossRef]
  11. Rücker, M.; Bartels, W.B.; Bultreys, T.; Boone, M.; Singh, K.; Garfi, G.; Scanziani, A.; Spurin, C.; Yesufu-Rufai, S.; Krevor, S.; et al. Workflow for Upscaling Wettability from the Nanoscale to Core Scale. Petrophysics SPWLA J. Form. Eval. Reserv. Descr. 2020, 61, 189–205. [Google Scholar]
  12. Armstrong, R.T.; Sun, C.; Mostaghimi, P.; Berg, S.; Rücker, M.; Luckham, P.; Georgiadis, A.; McClure, J.E. Multiscale Characterization of Wettability in Porous Media. Transp. Porous Media 2021, 140, 215–240. [Google Scholar] [CrossRef]
  13. Mirzaei-Paiaman, A.; Faramarzi-Palangar, M.; Djezzar, S.; Kord, S. A new approach to measure wettability by relative permeability measurements. J. Pet. Sci. Eng. 2022, 208, 109191. [Google Scholar] [CrossRef]
  14. Farahani, M.; Aghaei, H.; Asadolahpour, S.R. Sensitivity of unsteady-state gas-water relative permeability to experimental artefacts and interpretation techniques; case study from a gas reservoir in south Iran. J. Nat. Gas Sci. Eng. 2019, 71, 102998. [Google Scholar] [CrossRef]
  15. Mirzaei-Paiaman, A. New methods for qualitative and quantitative determination of wettability from relative permeability curves: Revisiting Craig’s rules of thumb and introducing Lak wettability index. Fuel 2021, 288, 119623. [Google Scholar] [CrossRef]
  16. Torsaeter, O. A comparative study of wettability test methods based on experimental results from North Sea reservoir rocks. In Proceedings of the SPE Annual Technical Conference and Exhibition, Houston, TX, USA, 2–5 October 1988. [Google Scholar]
  17. Lake, L.W. Enhanced Oil Recovery; Prentice Hall: Englewood Cliffs, NJ, USA, 1989. [Google Scholar]
  18. Jadhunandan, P.; Morrow, N.R. Effect of wettability on waterflood recovery for crude-oil/brine/rock systems. SPE Reserv. Eng. 1995, 10, 40–46. [Google Scholar] [CrossRef]
  19. Morrow, N.R. Wettability and Its Effect on Oil Recovery. J. Pet. Technol. 1990, 42, 1476–1484. [Google Scholar] [CrossRef]
  20. Rao, D.N. Wettability Effects in Thermal Recovery Operations. SPE Reserv. Eval. Eng. 1999, 2, 420–430. [Google Scholar] [CrossRef]
  21. Agbalaka, C.C.; Dandekar, A.Y.; Patil, S.L.; Khataniar, S.; Hemsath, J. The Effect Of Wettability On Oil Recovery: A Review. In Proceedings of the SPE Asia Pacific Oil and Gas Conference and Exhibition, Perth, Australia, 20–22 October 2008. [Google Scholar]
  22. Iglauer, S.; Pentland, C.H.; Busch, A. CO2 wettability of seal and reservoir rocks and the implications for carbon geo-sequestration. Water Resour. Res. 2015, 51, 729–774. [Google Scholar] [CrossRef] [Green Version]
  23. Arif, M.; Abu-Khamsin, S.A.; Iglauer, S. Wettability of rock/CO2/brine and rock/oil/CO2-enriched-brine systems:Critical parametric analysis and future outlook. Adv. Colloid Interface Sci. 2019, 268, 91–113. [Google Scholar] [CrossRef]
  24. Daryasafar, A.; Keykhosravi, A.; Shahbazi, K. Modeling CO2 wettability behavior at the interface of brine/CO2/mineral: Application to CO2 geo-sequestration. J. Clean. Prod. 2019, 239, 118101. [Google Scholar] [CrossRef]
  25. Bennion, D.B.; Thomas, F.B.; Sheppard, D.A. Formation Damage Due to Mineral Alteration and Wettability Changes During Hot Water and Steam Injection in Clay-Bearing Sandstone Reservoirs. In Proceedings of the SPE Formation Damage Control Symposium, Lafayette, LA, USA, 26–27 February 1992. [Google Scholar]
  26. Schembre, J.M.; Kovscek, A.R. Thermally Induced Fines Mobilization: Its Relationship to Wettability and Formation Damage. In Proceedings of the SPE International Thermal Operations and Heavy Oil Symposium and Western Regional Meeting, Bakersfield, CA, USA, 16–18 March 2004. [Google Scholar]
  27. Zhang, X.; Ge, J.; Kamali, F.; Othman, F.; Wang, Y.; Le-Hussain, F. Wettability of sandstone rocks and their mineral components during CO2 injection in aquifers: Implications for fines migration. J. Nat. Gas Sci. Eng. 2020, 73, 103050. [Google Scholar] [CrossRef]
  28. Zhou, X.; Morrow, N.R.; Ma, S. Interrelationship of wettability, initial water saturation, aging time, and oil recovery by spontaneous imbibition and waterflooding. SPE J. 2000, 5, 199–207. [Google Scholar] [CrossRef]
  29. Graue, A.; Aspenes, E.; Bognø, T.; Moe, R.; Ramsdal, J. Alteration of wettability and wettability heterogeneity. J. Pet. Sci. Eng. 2002, 33, 3–17. [Google Scholar] [CrossRef] [Green Version]
  30. Zhang, Y.; Zeng, J.; Qiao, J.; Feng, X.; Dong, Y. Investigating the Effect of the Temperature and Pressure on Wettability in Crude Oil–Brine–Rock Systems. Energy Fuels 2018, 32, 9010–9019. [Google Scholar] [CrossRef]
  31. Salathiel, R.A. Oil Recovery by Surface Film Drainage In Mixed-Wettability Rocks. J. Pet. Technol. 1973, 25, 1216–1224. [Google Scholar] [CrossRef]
  32. Anderson, W.G. Wettability literature survey-part 2: Wettability measurement. J. Pet. Technol. 1986, 38, 1246–1262. [Google Scholar] [CrossRef]
  33. Amott, E. Observations relating to the wettability of porous rock. Trans. AIME 1959, 216, 156–162. [Google Scholar] [CrossRef]
  34. Boneau, D.; Clampitt, R.L. A surfactant system for the oil-wet sandstone of the North Burbank Unit. J. Pet. Technol. 1977, 29, 501–506. [Google Scholar] [CrossRef]
  35. Trantham, J.; Clampitt, R.L. Determination of oil saturation after waterflooding in an oil-wet reservoir the North Burbank Unit, Tract 97 Project. J. Pet. Technol. 1977, 29, 491–500. [Google Scholar] [CrossRef]
  36. Donaldson, E.C.; Thomas, R.D.; Lorenz, P.B. Wettability determination and its effect on recovery efficiency. Soc. Pet. Eng. J. 1969, 9, 13–20. [Google Scholar] [CrossRef]
  37. Sharma, M.; Wunderlich, R. The alteration of rock properties due to interactions with drilling-fluid components. J. Pet. Sci. Eng. 1987, 1, 127–143. [Google Scholar] [CrossRef]
  38. Craig, F.F. The Reservoir Engineering Aspects of Waterflooding; Henry L. Doherty Memorial Fund of AIME: New York, NY, USA, 1971; Volume 3. [Google Scholar]
  39. Ferreira, F.C.; Pairoys, F.; Klemin, D.V.; Baser-Langenau, B.; Safonov, S.; Dinariev, O.; Evseev, N.; Silva, M.D.; Carneiro, G.D.F. Innovative Workflow for Grouping, Averaging, End-Point Scaling and Assessing Uncertainty of Water-Oil Relative-Permeability Curves, Considering Corresponding Normalized Water-Fractional-Flow Curves, Reservoir-Rock Types and Wettability Indexes. In Proceedings of the Abu Dhabi International Petroleum Exhibition & Conference, Abu Dhabi, United Arab Emirates, 13–16 November 2017. [Google Scholar]
  40. Ma, S.M.; Zhang, X.; Morrow, N.R.; Zhou, X. Characterization of Wettability From Spontaneous Imbibition Measurements. J. Can. Pet. Technol. 1999, 38. [Google Scholar] [CrossRef]
  41. Mirzaei-Paiaman, A.; Masihi, M.; Standnes, D.C. Index for characterizing wettability of reservoir rocks based on spontaneous imbibition recovery data. Energy Fuels 2013, 27, 7360–7368. [Google Scholar] [CrossRef]
  42. Mirzaei-Paiaman, A.; Saboorian-Jooybari, H.; Masihi, M. Incorporation of viscosity scaling group into analysis of MPMS index for laboratory characterization of wettability of reservoir rocks. J. Pet. Explor. Prod. Technol. 2017, 7, 205–216. [Google Scholar] [CrossRef] [Green Version]
  43. Denekas, M.; Mattax, C.; Davis, G. Effects of crude oil components on rock wettability. Trans. AIME 1959, 216, 330–333. [Google Scholar] [CrossRef]
  44. Ghedan, S.G.; Canbaz, C.H. Theory and experimental setup of the new Rise in Core reservoir wettability measurement technique. In Proceedings of the IPTC 2014: International Petroleum Technology Conference, Doha, Qatar, 19–22 January 2014. [Google Scholar]
  45. Fleury, M.; Deflandre, F. Quantitative evaluation of porous media wettability using NMR relaxometry. Magn. Reson. Imaging 2003, 21, 385–387. [Google Scholar] [CrossRef]
  46. Al-Mahrooqi, S.; Grattoni, C.; Muggeridge, A.; Zimmerman, R.W.; Jing, X. Pore-scale modelling of NMR relaxation for the characterization of wettability. J. Pet. Sci. Eng. 2006, 52, 172–186. [Google Scholar] [CrossRef]
  47. Chen, J.; Hirasaki, G.; Flaum, M. NMR wettability indices: Effect of OBM on wettability and NMR responses. J. Pet. Sci. Eng. 2006, 52, 161–171. [Google Scholar] [CrossRef]
  48. Looyestijn, W.; Zhang, X.; Hebing, A. How Can NMR Assess the Wettability of a Chalk Reservoir. In Proceedings of the International Symposium of the Society of Core Analysts, Vienna, Austria, 27 August–1 September 2017. [Google Scholar]
  49. Tandon, S.; Newgord, C.; Heidari, Z. Wettability Quantification in Mixed-Wet Rocks Using a New NMR-Based Method. SPE Reserv. Eval. Eng. 2020, 23, 0896–0916. [Google Scholar] [CrossRef]
  50. Dick, M.J.; Veselinovic, D.; Bonnie, R.J.M.; Kelly, S. NMR Quantification of Wettability and Water Uptake in Unconventionals. In Proceedings of the SPE/AAPG/SEG Unconventional Resources Technology Conference, Houston, TX, USA, 26–28 July 2021. [Google Scholar] [CrossRef]
  51. Treiber, L.E.; Owens, W.W. A Laboratory Evaluation of the Wettability of Fifty Oil-Producing Reservoirs. Soc. Pet. Eng. J. 1972, 12, 531–540. [Google Scholar] [CrossRef]
  52. Chilingar, G.V.; Yen, T.F. Some Notes on Wettability and Relative Permeabilities of Carbonate Reservoir Rocks, II. Energy Sources 1983, 7, 67–75. [Google Scholar] [CrossRef]
  53. Al-Yousef, H.Y.; Lichaa, P.M.; Al-Kaabi, A.U.; Alpustun, H. Wettability Evaluation of a Carbonate Reservoir Rock from Core to Pore Level. In Proceedings of the Middle East Oil Show, Manama, Bahrain, 11–14 March 1995. [Google Scholar]
  54. Webb, K.J.; Black, C.J.J.; Namba, T. Resolving Wettability in a Giant Carbonate Reservoir. In Proceedings of the Abu Dhabi International Petroleum Exhibition and Conference, Abu Dhabi, United Arab Emirates, 13–16 October 1996. [Google Scholar]
  55. Marzouk, I. Wettability and Saturation in Abu Dhabi Carbonate Reservoirs. In Proceedings of the Middle East Oil Show and Conference, Manama, Bahrain, 20–23 February 1999. [Google Scholar]
  56. Okasha, T.M.; Funk, J.J.; Al-Enezi, S.M.; Al-Rashidi, H.N. Fifty years of wettability measurements in the arab-d carbonate. In Proceedings of the International Symposium of the Society of Core Analysts, Abu Dhabi, United Arab Emirates, 5–9 October 2004. [Google Scholar]
  57. Okasha, T.M.; Funk, J.J.; Rashidi, H.N. Fifty Years of Wettability Measurements in the Arab-D Carbonate Reservoir. In Proceedings of the SPE Middle East Oil and Gas Show and Conference, Manama, Bahrain, 11–14 March 2007. [Google Scholar]
  58. Al-Attar, H.H.; Mahmoud, M.Y.; Zekri, A.Y.; Almehaideb, R.; Ghannam, M. Low-salinity flooding in a selected carbonate reservoir: Experimental approach. J. Pet. Explor. Prod. Technol. 2013, 3, 139–149. [Google Scholar] [CrossRef] [Green Version]
  59. Bakhshi, E.; Torab, F.M. Determining Wettability of Fractured Carbonate Reservoirs. Nat. Resour. Res. 2016, 25, 211–225. [Google Scholar] [CrossRef]
  60. Chen, S.-Y.; Kaufman, Y.; Kristiansen, K.; Seo, D.; Schrader, A.M.; Alotaibi, M.B.; Dobbs, H.A.; Cadirov, N.A.; Boles, J.R.; Ayirala, S.; et al. Effects of Salinity on Oil Recovery (the “Dilution Effect”): Experimental and Theoretical Studies of Crude Oil/Brine/Carbonate Surface Restructuring and Associated Physicochemical Interactions. Energy Fuels 2017, 31, 8925–8941. [Google Scholar] [CrossRef]
  61. Faramarzi-Palangar, M.; Mirzaei-Paiaman, A. Investigating dynamic rock quality in two-phase flow systems using TEM-function: A comparative study of different rock typing indices. Pet. Res. 2021, 6, 16–25. [Google Scholar] [CrossRef]
  62. Burkhardt, J.A.; Ward, M.B.; McLean, R.H. Effect of Core Surfacing and Mud Filtrate Flushing on Reliability of Core Analysis Conducted on Fresh Cores. In Proceedings of the Fall Meeting of the Society of Petroleum Engineers of AIME, Houston, TX, USA, 5–8 October 1958. [Google Scholar]
  63. Mohanty, K.K. Multiphase Flow in Porous Media: III. Oil Mobilization, Transverse Dispersion, and Wettability. In Proceedings of the SPE Annual Technical Conference and Exhibition, San Francisco, CA, USA, 5–8 October 1983. [Google Scholar]
  64. Strand, S.; Standnes, D.C.; Austad, T. New wettability test for chalk based on chromatographic separation of SCN− and SO42−. J. Pet. Sci. Eng. 2006, 52, 187–197. [Google Scholar] [CrossRef]
  65. Dixit, A.B.; Buckley, J.S.; McDougall, S.R.; Sorbie, K.S. Core wettability: Should I AH equal I USBM. In Proceedings of the International Symposium of the SCA, The Hague, The Netherlands, 14–16 September 1998. [Google Scholar]
  66. Mirzaei-Paiaman, A. Analysis of the bounded and unbounded forms of USBM wettability index. Energy Geosci. 2022, 3, 94–102. [Google Scholar] [CrossRef]
  67. Mirzaei-Paiaman, A.; Asadolahpour, S.R.; Saboorian-Jooybari, H.; Chen, Z.; Ostadhassan, M. A new framework for selection of representative samples for special core analysis. Pet. Res. 2020, 5, 210–226. [Google Scholar] [CrossRef]
  68. Leverett, M. Capillary behavior in porous solids. Trans. AIME 1941, 142, 152–169. [Google Scholar] [CrossRef]
  69. Xu, C.; Torres-Verdín, C. Saturation-height and invasion consistent hydraulic rock typing using multi-well conventional logs. In Proceedings of the SPWLA 53rd Annual Logging Symposium, Cartagena, Colombia, 16–20 June 2012. [Google Scholar]
  70. Mirzaei-Paiaman, A.; Saboorian-Jooybari, H.; Pourafshary, P. Improved Method to Identify Hydraulic Flow Units for Reservoir Characterization. Energy Technol. 2015, 3, 726–733. [Google Scholar] [CrossRef]
  71. Corbett, P.W.M.; Potter, D.K. Petrotyping: A basemap and atlas for navigating through permeability and porosity data for reservoir comparison and permeability prediction. In Proceedings of the International Symposium of the Society of Core Analysts, Abu Dhabi, United Arab Emirates, 5–9 September 2004. Paper SCA2004-30. [Google Scholar]
  72. Amaefule, J.O.; Altunbay, M.; Tiab, D.; Kersey, D.G.; Keelan, D.K. Enhanced Reservoir Description: Using Core and Log Data to Identify Hydraulic (Flow) Units and Predict Permeability in Uncored Intervals/Wells. In Proceedings of the SPE Annual Technical Conference and Exhibition, Houston, TX, USA, 3–6 October 1993. [Google Scholar]
  73. Jones, S.C.; Roszelle, W.O. Graphical Techniques for Determining Relative Permeability From Displacement Experiments. J. Pet. Technol. 1978, 30, 807–817. [Google Scholar] [CrossRef]
  74. Mirzaei-Paiaman, A.; Ostadhassan, M.; Rezaee, R.; Saboorian-Jooybari, H.; Chen, Z. A new approach in petrophysical rock typing. J. Pet. Sci. Eng. 2018, 166, 445–464. [Google Scholar] [CrossRef] [Green Version]
  75. Ghanbarian, B.; Lake, L.W.; Sahimi, M. Insights Into Rock Typing: A Critical Study. SPE J. 2018, 24, 230–242. [Google Scholar] [CrossRef]
  76. Kolodzie, S., Jr. Analysis Of Pore Throat Size And Use Of The Waxman-Smits Equation To Determine Ooip In Spindle Field, Colorado. In Proceedings of the SPE Annual Technical Conference and Exhibition, Dallas, TX, USA, 21–24 September 1980. [Google Scholar]
Figure 1. Permeability against porosity for the 19 carbonate rock samples as well as the ten preset classes shown by different GHE* curves. Each line on the template corresponds to a given RQI value and describes the lower boundary of a prebuilt reference GHE* class. As can be seen, the plug samples have been distributed in GHE* classes 3 and 4.
Applsci 12 00131 g001
Figure 2. The measured forced displacement capillary pressure curves for 16 samples studied here.
Applsci 12 00131 g002
Figure 3. The oil and water relative permeability curves measured on 19 carbonate rock samples studied here.
Applsci 12 00131 g003
Figure 4. Normalized water fractional flow, Equation (7), against normalized water saturation, Equation (8), for all the 19 samples studied here. The solid black line indicates the 1:1 line.
Applsci 12 00131 g004
Figure 5. Correlations among different wettability indices calculated on core samples studied here. (a) USBM* vs. Amott–Harvey, (b) Lak vs. modified Lak, (c) USBM* vs. modified Lak, (d) USBM* vs. Lak, (e) Amott–Harvey vs. Lak, and (f) Amott–Harvey vs. modified Lak.
Applsci 12 00131 g005
Figure 6. Different wettability indices versus rock quality indicators for the carbonate rock samples used in this study. (a) Amott-Harvey vs. FZI, (b) Amott-Harvey vs. RQI, (c) Amott-Harvey vs. Winland R35, (d) USBM* vs. FZI, (e) USBM* vs. RQI, (f) USBM* vs. Winland R35, (g) Lak vs. FZI, (h) Lak vs. RQI, (i) Lak vs. Winland R35, (j) modified Lak vs. FZI, (k) modified Lak vs. RQI, (l) modified Lak vs. Winland R35.
Applsci 12 00131 g006
Table 1. Characteristics of the rock samples used in the experiments.
Plug No.Depth (m)Porosity (%)Air Permeability (mD)RQI (μm)GHE* Class
12775.6717.451.670.0973
22776.0819.382.980.1234
32781.2617.272.030.1083
42799.4818.984.390.1514
52802.0512.061.630.1153
62804.3310.570.880.0913
72807.7613.590.680.0703
82824.5419.381.860.0973
92830.4120.351.200.0763
102834.616.231.450.0943
112839.7718.631.040.0743
122843.7416.141.990.1103
132843.8021.574.930.1504
142846.0015.661.920.1103
152846.1518.011.680.1113
162850.6619.222.390.1494
172850.7217.844.010.1444
182851.2321.054.440.0913
192856.8215.631.320.0963
Table 2. Fluid characteristics used in the primary drainage and imbibition/secondary drainage experiments.
PropertyWater Density (gr./cc)Oil Density (gr./cc)Interfacial Tension (dyne/cm)Water Viscosity (cp)Oil Viscosity (cp)
Test
Primary drainage capillary pressure at 50 °C1.1250.85726.79-3.29
Imbibition/secondary drainage capillary pressure at 25 °C1.1450.731-1.362.44
Relative permeability at 25 °C1.1450.731-1.362.44
Table 3. The calculated values of the Amott, Amott–Harvey, USBM, and USBM* indices based on fluid displacement through imbibition and/or drainage processes.
Plug No.Amott Water Index
I w
Amott Oil Index
I O
Amott–Harvey Index
I A H
USBM Index
I U S B M
USBM* Index
I U S B M *
10.090.55−0.46−0.87−0.76
20.070.47−0.40−0.23−0.26
30.040.78−0.74−0.76−0.70
40.020.76−0.74−0.82−0.74
50.070.47−0.40−0.26−0.29
60.040.79−0.75−0.81−0.73
70.100.15−0.050.080.09
8N.A.N.A.N.A.N.A.N.A.
90.070.33−0.26−0.29−0.32
100.100.14−0.040.030.03
110.080.20−0.12−0.42−0.45
120.040.80−0.76−0.82−0.74
130.080.65−0.57−0.95−0.80
140.060.32−0.26−0.52−0.54
150.060.57−0.51−0.68−0.64
16N.A.N.A.N.A.N.A.N.A.
170.030.24−0.21−0.21−0.24
18N.A.N.A.N.A.N.A.N.A.
190.070.65−0.58−0.56−0.57
Table 4. Results of wettability evaluation by the relative permeability-based methods.
Sample k r w   at
S o r *
CS (%) S w c ( % ) S o r ( % ) RCS (%)Qualitative MethodsQuantitative Methods
Craig’s First RuleCraig’s Second RuleCraig’s Third RuleModified Craig’s Second RuleNormalized Water Fractional Flow CurveILIML
10.7038.929.140.944.1OWOWWWOWOW−0.37−0.21
20.8831.324.144.240.0OWOWWWOWOW−0.61−0.37
30.6741.025.834.045.9OWOWWWOWOW−0.29−0.14
40.9721.714.855.229.8OWOWOWOWOW−0.74−0.41
50.6940.818.726.746.0OWOW-OWOW−0.29−0.06
60.9731.815.244.835.2OWOW-OWOW−0.55−0.11
70.2946.516.930.743.1WWOW-WWWW0.080.25
80.7829.219.650.034.8OWOW-OWOW−0.46−0.27
90.3945.816.422.946.7-OW-OWOW−0.020.11
100.3149.322.731.045.9-OWWWWWWW0.070.17
110.2836.616.936.340.3WWOW-OWOW−0.050.00
120.8033.723.340.341.5OWOWWWOWOW−0.51−0.34
130.9938.328.743.042.9OWOWWWOWOW−0.65−0.20
140.8836.422.033.644.2OWOWWWOWOW−0.55−0.27
150.8634.617.141.237.9OWOW-OWOW−0.44−0.02
160.3129.115.752.731.5-OW-OWOW−0.080.09
170.8634.015.638.338.7OWOW-OWOW−0.46−0.12
180.9420.29.757.226.3OWOWOWOWOW−0.62−0.33
190.9134.013.328.642.4OWOWOWOWOW−0.56−0.15
* krw: water relative permeability; Sor: residual oil saturation; CS: crossover saturation; Swc: interstitial water saturation; RCS: reference crossover saturation; IL: Lak wettability index; IML: modified Lak wettability index; OW: oil-wet; WW: water-wet.
Publisher’s Note: MDPI stays neutral with regard to jurisdictional claims in published maps and institutional affiliations.

