1. Introduction
Designing a floor plan is one of the common tasks performed by architects. For thousands of years, this process was manually conducted and supported by different methods that consider the environment around the building, room types and sizes, room connections, as well as climate, culture, and other influencing rules. In recent years there is a great need for automation of this process considering the digitalization of this industry. This trend applies not just in the field of architecture, but also in the media and video game industries where flexible rule-based rapid model generation is essential.
Rapid generation of city environments consists of repetitive tasks which can be achieved more efficiently using procedural modeling techniques. These techniques are based on automatic or semi-automatic systems for procedural modeling such as shape grammar, cellular automata, L-systems, fractals, etc. These systems are often highly specialized for segmented design procedures using a narrow framework for a specific task.
The general specification of any system includes functional and non-functional requirements, where the latter addresses the constraints under which the former have to be applied. The implementation of non-functional requirements is generally more demanding. The majority of scientific boundary generators are focused on the functional usage of the interior spaces usually resulting in simple building boundaries. The form of the building acts as a container for the interior space but it is not solely defined or influenced by it.
Functionality is not a key component in the digital and video game industry where residential building simulations mainly create a recognizable style. The contemporary design in real-world architecture directly influenced the research approach presented in this article.
In the presented approach, the focus is on the restrictions implied by external non-functional influencers, like contemporary building design, wind comfort, building-lot design, or even aesthetic factors and so on, as the driving force for shaping the designed residential building. This was the main reason why the adopted approach ignores the interior functionality in order to enable the rapid generation of building boundary variations that are compliant with the external restrictions, to which the interior functionality impact, as the other side of the same coin, may be added afterward (on demand).
This paper is focused on residential-type buildings which usually have more complex borders than other types such as office buildings, factories, supermarkets, schools, etc. In the verification phase of our methodology, we have used real examples of complex building boundaries.
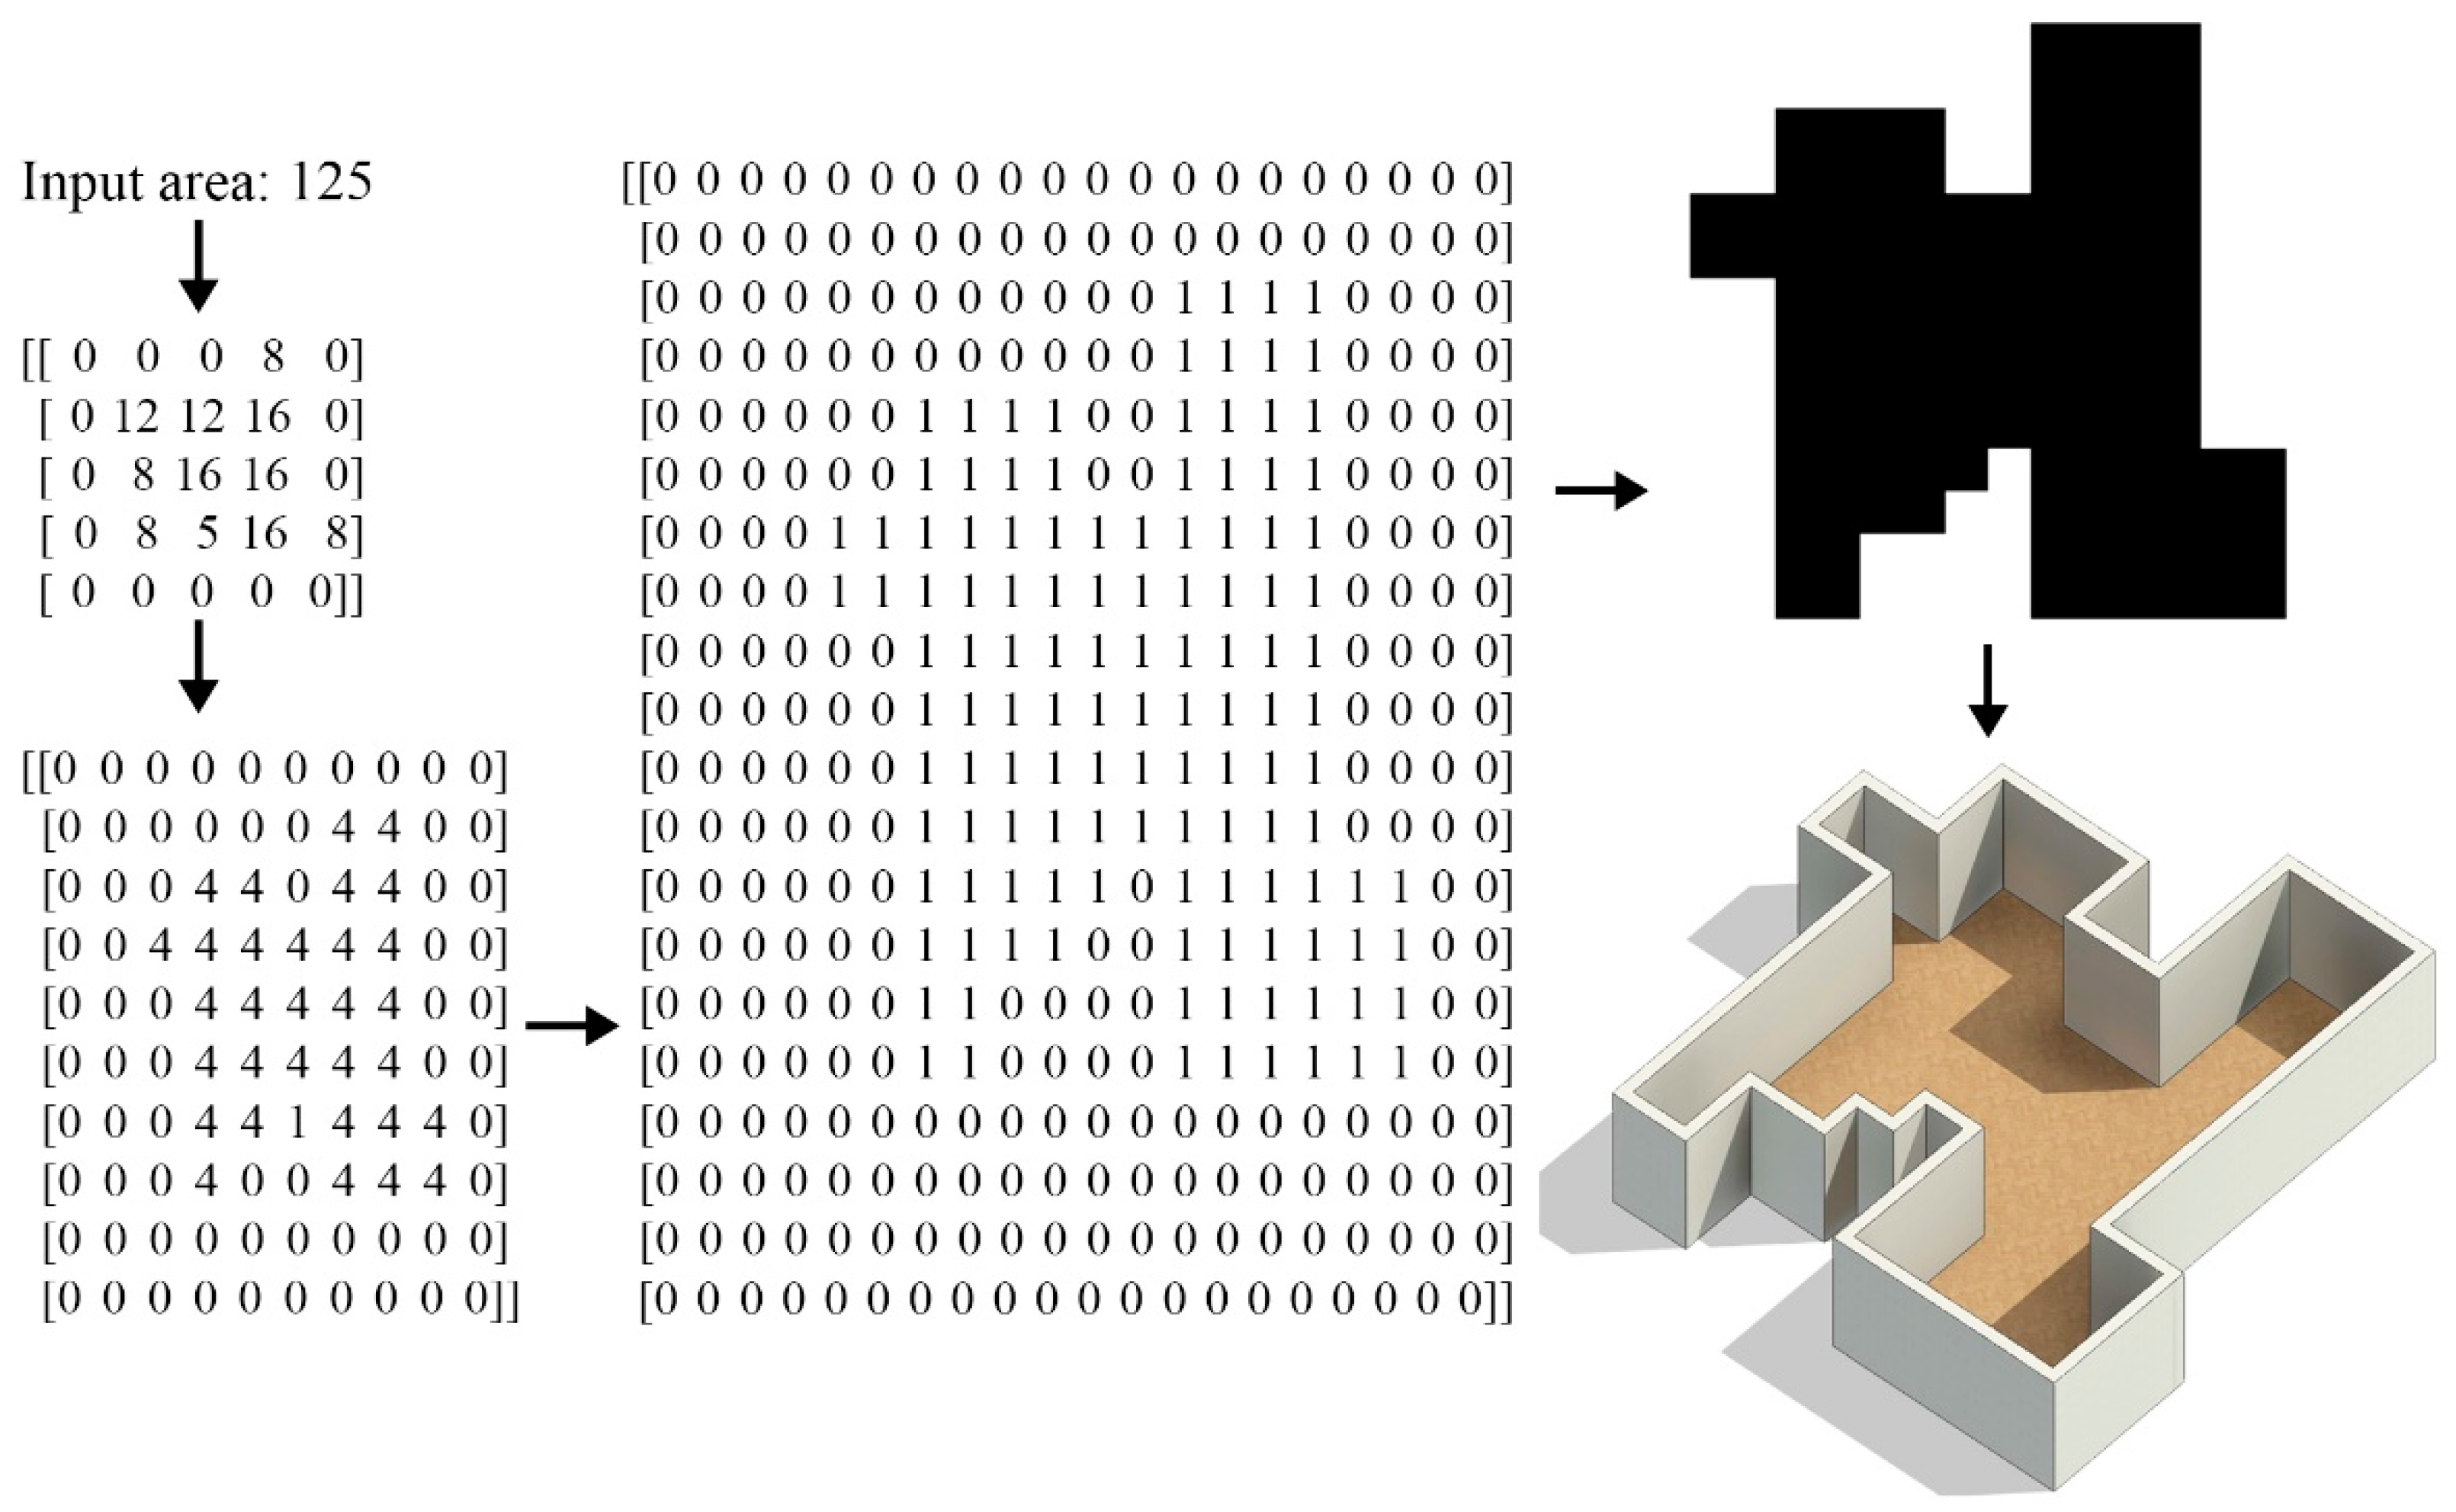
The prototyped solution to the problem of automatic residential building border design by observing its floor plans as a grid system has been achieved by using a simple rule-based algorithm that accepts the area of the building as an input and generates complex shapes that represent different versions of residential floor plan border. The developed algorithm generates floor plans by observing buildings in the form of a two-dimensional array (grid) with respect to lot area and fixed building boundary size, through successive transformation steps leading to the completely connected cells model (see
Figure 1).
The algorithm validity is checked via the application of prototyped software on a selected set of real residential building examples. The derived results have been used for algorithm adjustments and code refactoring that were used in order to raise the level of abstraction and enable the development of a software framework conceptual model that may be used in further method, algorithm, and software tool refinements. The rest of the paper is organized as follows.
Section 2 presents a brief survey of different approaches related to the research topic. In
Section 3, a brief overview of methods and goals is presented together with the conceptual model of extendible software framework intended to serve as an umbrella for future improvements of methodology implementation refinements.
Section 4 contains a detailed description of the algorithm and several representative examples that illustrate the way the algorithm is developed and refined. In
Section 5 the cross-reference analysis of the proposed method and algorithm performance compared to related work references are presented.
Section 6 addresses the discussion, and the possible directions of future research are presented in
Section 7. The list of referenced literature is presented in the finishing part of the article.
2. Related Work
In the current literature, there are a number of proposed systems suitable for automatic building generation based on different geometry concepts. The layout of rectangular floor plans was introduced by Shekhawat [
1]. Kozminski et al. [
2] presented an algorithm for architectural floor plan generation using rectangular planar graphs. Bhasker et al. [
3] proposed a similar approach using triangular planar graphs. This system was further developed by Wang et al. [
4], who introduced an approach to generate floor plans from room adjacencies obtained from existing plans. All of these methods only generate rectangular rooms based on predefined (existing) graph structures.
Martin [
5] has developed an algorithm to generate residential floor plans using the Monte Carlo method for room distribution. Flemming et al. [
6] have applied an expert system for solving building layouts, introducing many serious disadvantages. As a consequence of the fact that the completeness and consistency of the system are not known to the user, it takes an intolerably lot of time to converge resulting in bad response time. Additionally, real building boundaries usually vary in shape and these variations are ignored in both Martin’s [
5] and Flemming et al.’s [
6] approach. The boundaries are rectangular because they are derived from the internal constraints where all of the rooms have s rectangular shape, (which is not very common in contemporary architectural practice).
Del Rio-Cidoncha et al. [
7] based the research approach on an expert system where optimization is performed through the use of artificial intelligence. Nauata et al. [
8] developed a method for house layout generation using relational generative adversarial networks. The presented solution satisfies the majority of addressed problem aspects but generated building boundaries are dominantly simple, due to the fact that rectangular forms are derived from rectangular rooms in most discussed cases. For the generation of building layouts within a known boundary, Peng et al. [
9] used a linear programming system of deformable tile templates. The exterior building boundary is the input while the interior layout is divided into tiles that are labeled as rooms. This is one of the research works that use the building boundary as an input that drives function within the object that, in a broader sense, shares a similar idea as the approach presented in this paper. Wu et al. [
10] proposed a solution that automatically generates layout designs based on a MIQP (mixed integer quadratic programming) formulation.
Nonlinear programming techniques have been used for floor layout problems by Li et al. [
11]. However, the solutions are derived for rectangular shape buildings only. Harada et al. [
12] developed a model for interactive manipulation of layouts by the use of shape grammar. The results are within the simple form of building boundary and constant interactive input from a user is required. Wang et al. [
13] proposed a framework for the automatic generation of floor plans using graph grammar formalism. The system can reproduce good results, but for each deviation from a rectangular building, interactive user input is required. Duarte [
14] presented an interactive system for layout generation based on discursive grammar incorporating programming grammar and designing grammar. The described solutions include the 3D aspect and layout of the design space, but, due to the recognizable architectural style that has been analyzed, only produce rectangular forms. Some of the researchers found the solution for house layout automation through the use of genetic algorithms [
15,
16,
17]. Wu et al. [
18] proposed a data-driven method for generating floor plans for residential buildings. They utilized a dataset of floor plans of real buildings in order to construct a neural network for layout generation. This research shows that, with extensive layout database and adequate neural network training, the problem of automatically generation of building layouts can be solved using existing boundaries as an input.
Merrel et al. [
19] used a Bayesian network trained on real-world data to design an architectural program that generates floor plans using stochastic optimization. The described solution enables the generation of simple and complex building forms, but with low levels of complexity. The basic approach, described in this paper, is focused on the creation of very complex forms instead. That is why the former related work reference is used for the comparative analysis of derived results, presented in detail in
Section 5.
Hua [
20] proposed a method for automatic construction of irregular floor plans from the graphical patterns as an input where the accuracy of the input area of the rooms in the described results is not of great importance. The boundary is derived from the input image of an object shape. Al Omani [
21] used natural graphic images to generate a building layout plan. Bao et al. [
22] developed a method for exploring different building layouts based on simulated annealing.
Procedurally generating building shapes with grid-based constraints based on the cellular automata approach is widely adopted in the field of architectural and urban design based on the cellular automata approach. Patterns generated by cellular automata systems are used in architectural design for form exploration [
23,
24,
25,
26]. Several methods have been developed based on cellular automata systems. Anzalone and Clarke [
27] developed a system for the generation of 3D buildings based on Conway’s Game of Life system [
28]. Araghi and Stouffs [
29] use cellular automata for the generation of high-density residential buildings, addressing density, accessibility, and natural light. Some researchers explored cellular automata generation results as the first step and developed architecture form enveloping some cells or the entire form [
30,
31].
However, the application of cellular automata systems in the domain of architectural design is faced with several limitations. According to [
26,
32,
33], the degree of complexity for even simple architectural outcomes suggests that generating a complete architectural design in this manner is resource-demanding and, in general, probably even not possible. The main challenge is to find the solution that preserves an acceptable balance between complexity in architectural design and formal rules of cellular automata systems.
Summarizing the current state-of-the-art analysis it is possible to conclude that there are several approaches used as a foundation to specification, modeling, and design of tools for automated generation of building boundaries, with emphasis on 2D or 3D building geometry layout inclusion.
The comparative analysis of related work relevant to this article topics, with respect to selected key factors (dimensionality, interior layout inclusion, and boundary type) is presented in
Table 1.
The analyzed results, however, show that the prevalent trend mainly focuses on the simple boundary type forms because either complex forms appeared challenging for the particular approach or they were not considered at all.
3. Overview
From the methodology point of view, the starting point of the research, presented in this paper, was to derive the foundations of an extendible rule-based framework model that may be used to derive either formal procedures or a family of software tools addressing the problem of building boundary generation.
There are two main framework features that have to be explicitly addressed, extendibility and persistency.
Extendibility is the most important characteristic of any formal procedure or software system. It means that new concepts may be introduced at any instance of time without impact on any previously added (existing) concepts. It is especially important in software engineering where it is known as an Open/Close quality design principle [
34]. In our case, it is essential to support the extendibility of applied strategy (Inner-Bounded, Outer-Bounded, or even the combination of them), method (the collections of rules), and algorithm (rule-based limited set of steps needed to reach an arbitrary problem solution).
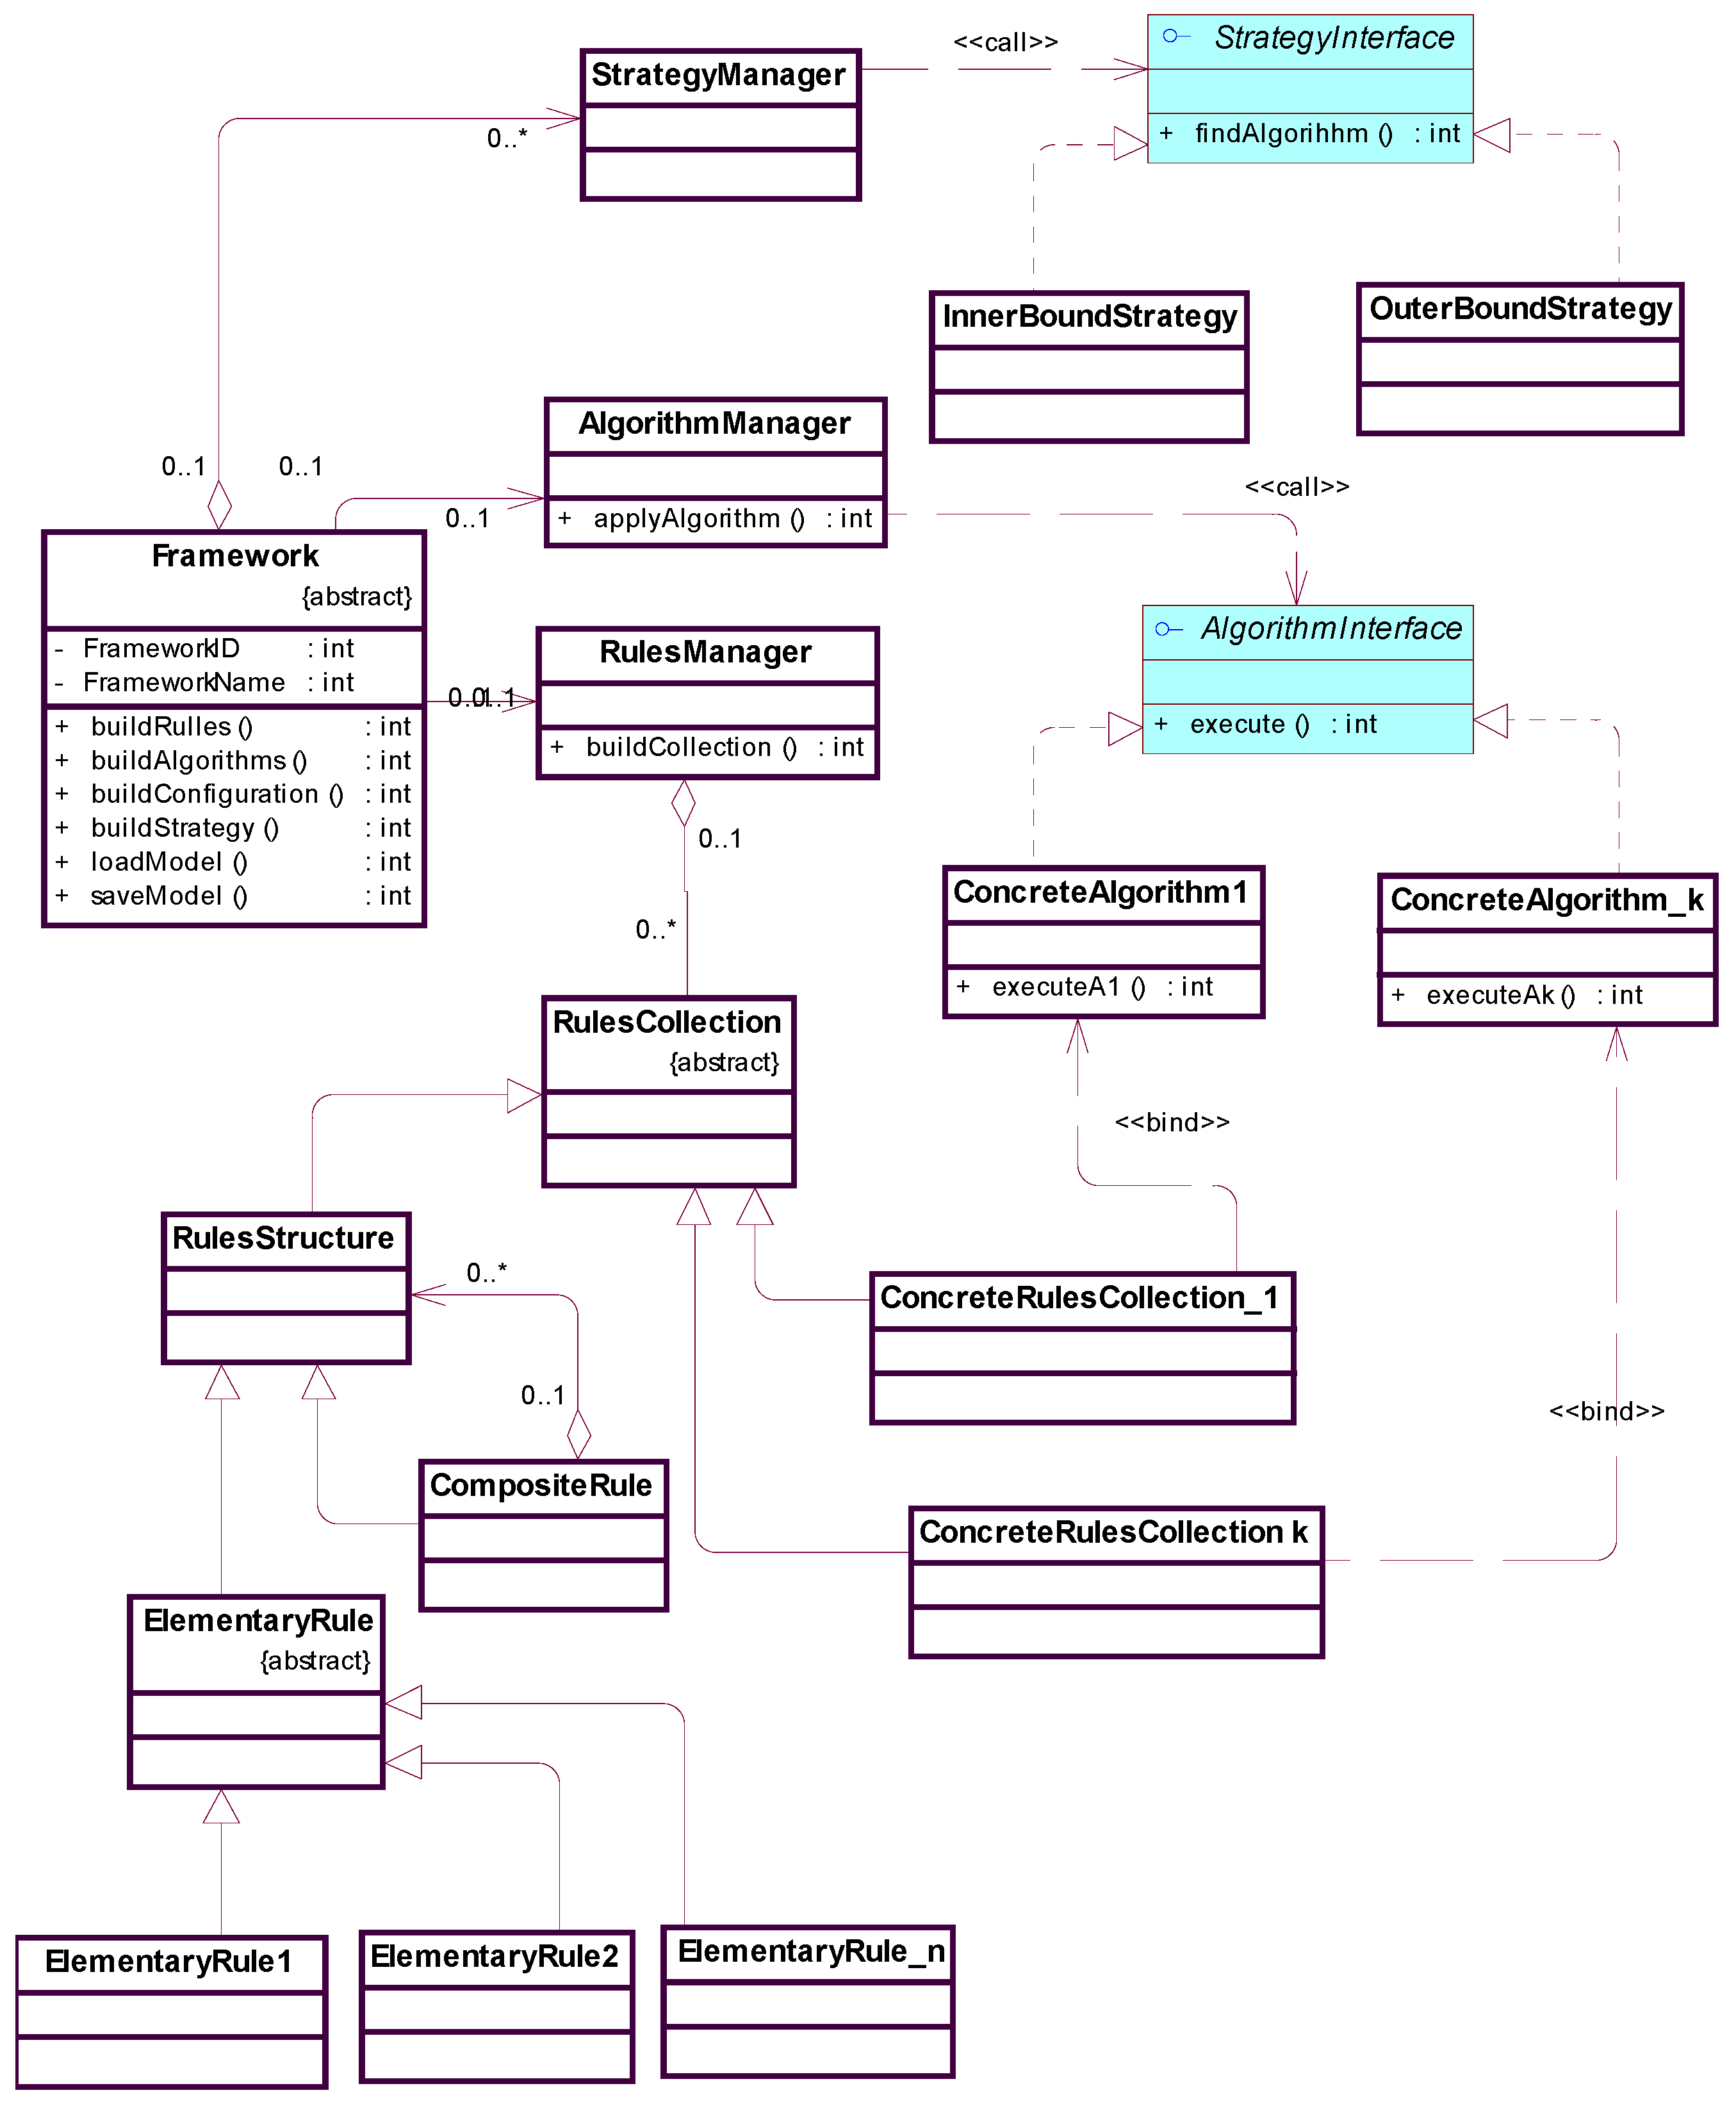
The initial conceptual framework model, in the form of an object-oriented diagram, is presented in
Figure 2.
The Framework is a concept to which the interoperability concerns are allocated. It delegates the extendible point handling to StrategyManager, AlgorithmManager, and RulesManager components with the extending points: Strategy Interface, Algorithm Interface, and ElementaryRule fabric respectively (see
Figure 2).
The explicit dependency between each ConcreteAlgorithm and corresponding ConcreteRulesCollection has to be maintained in order to enable the analysis of algorithm-rules correlation (see
Figure 2).
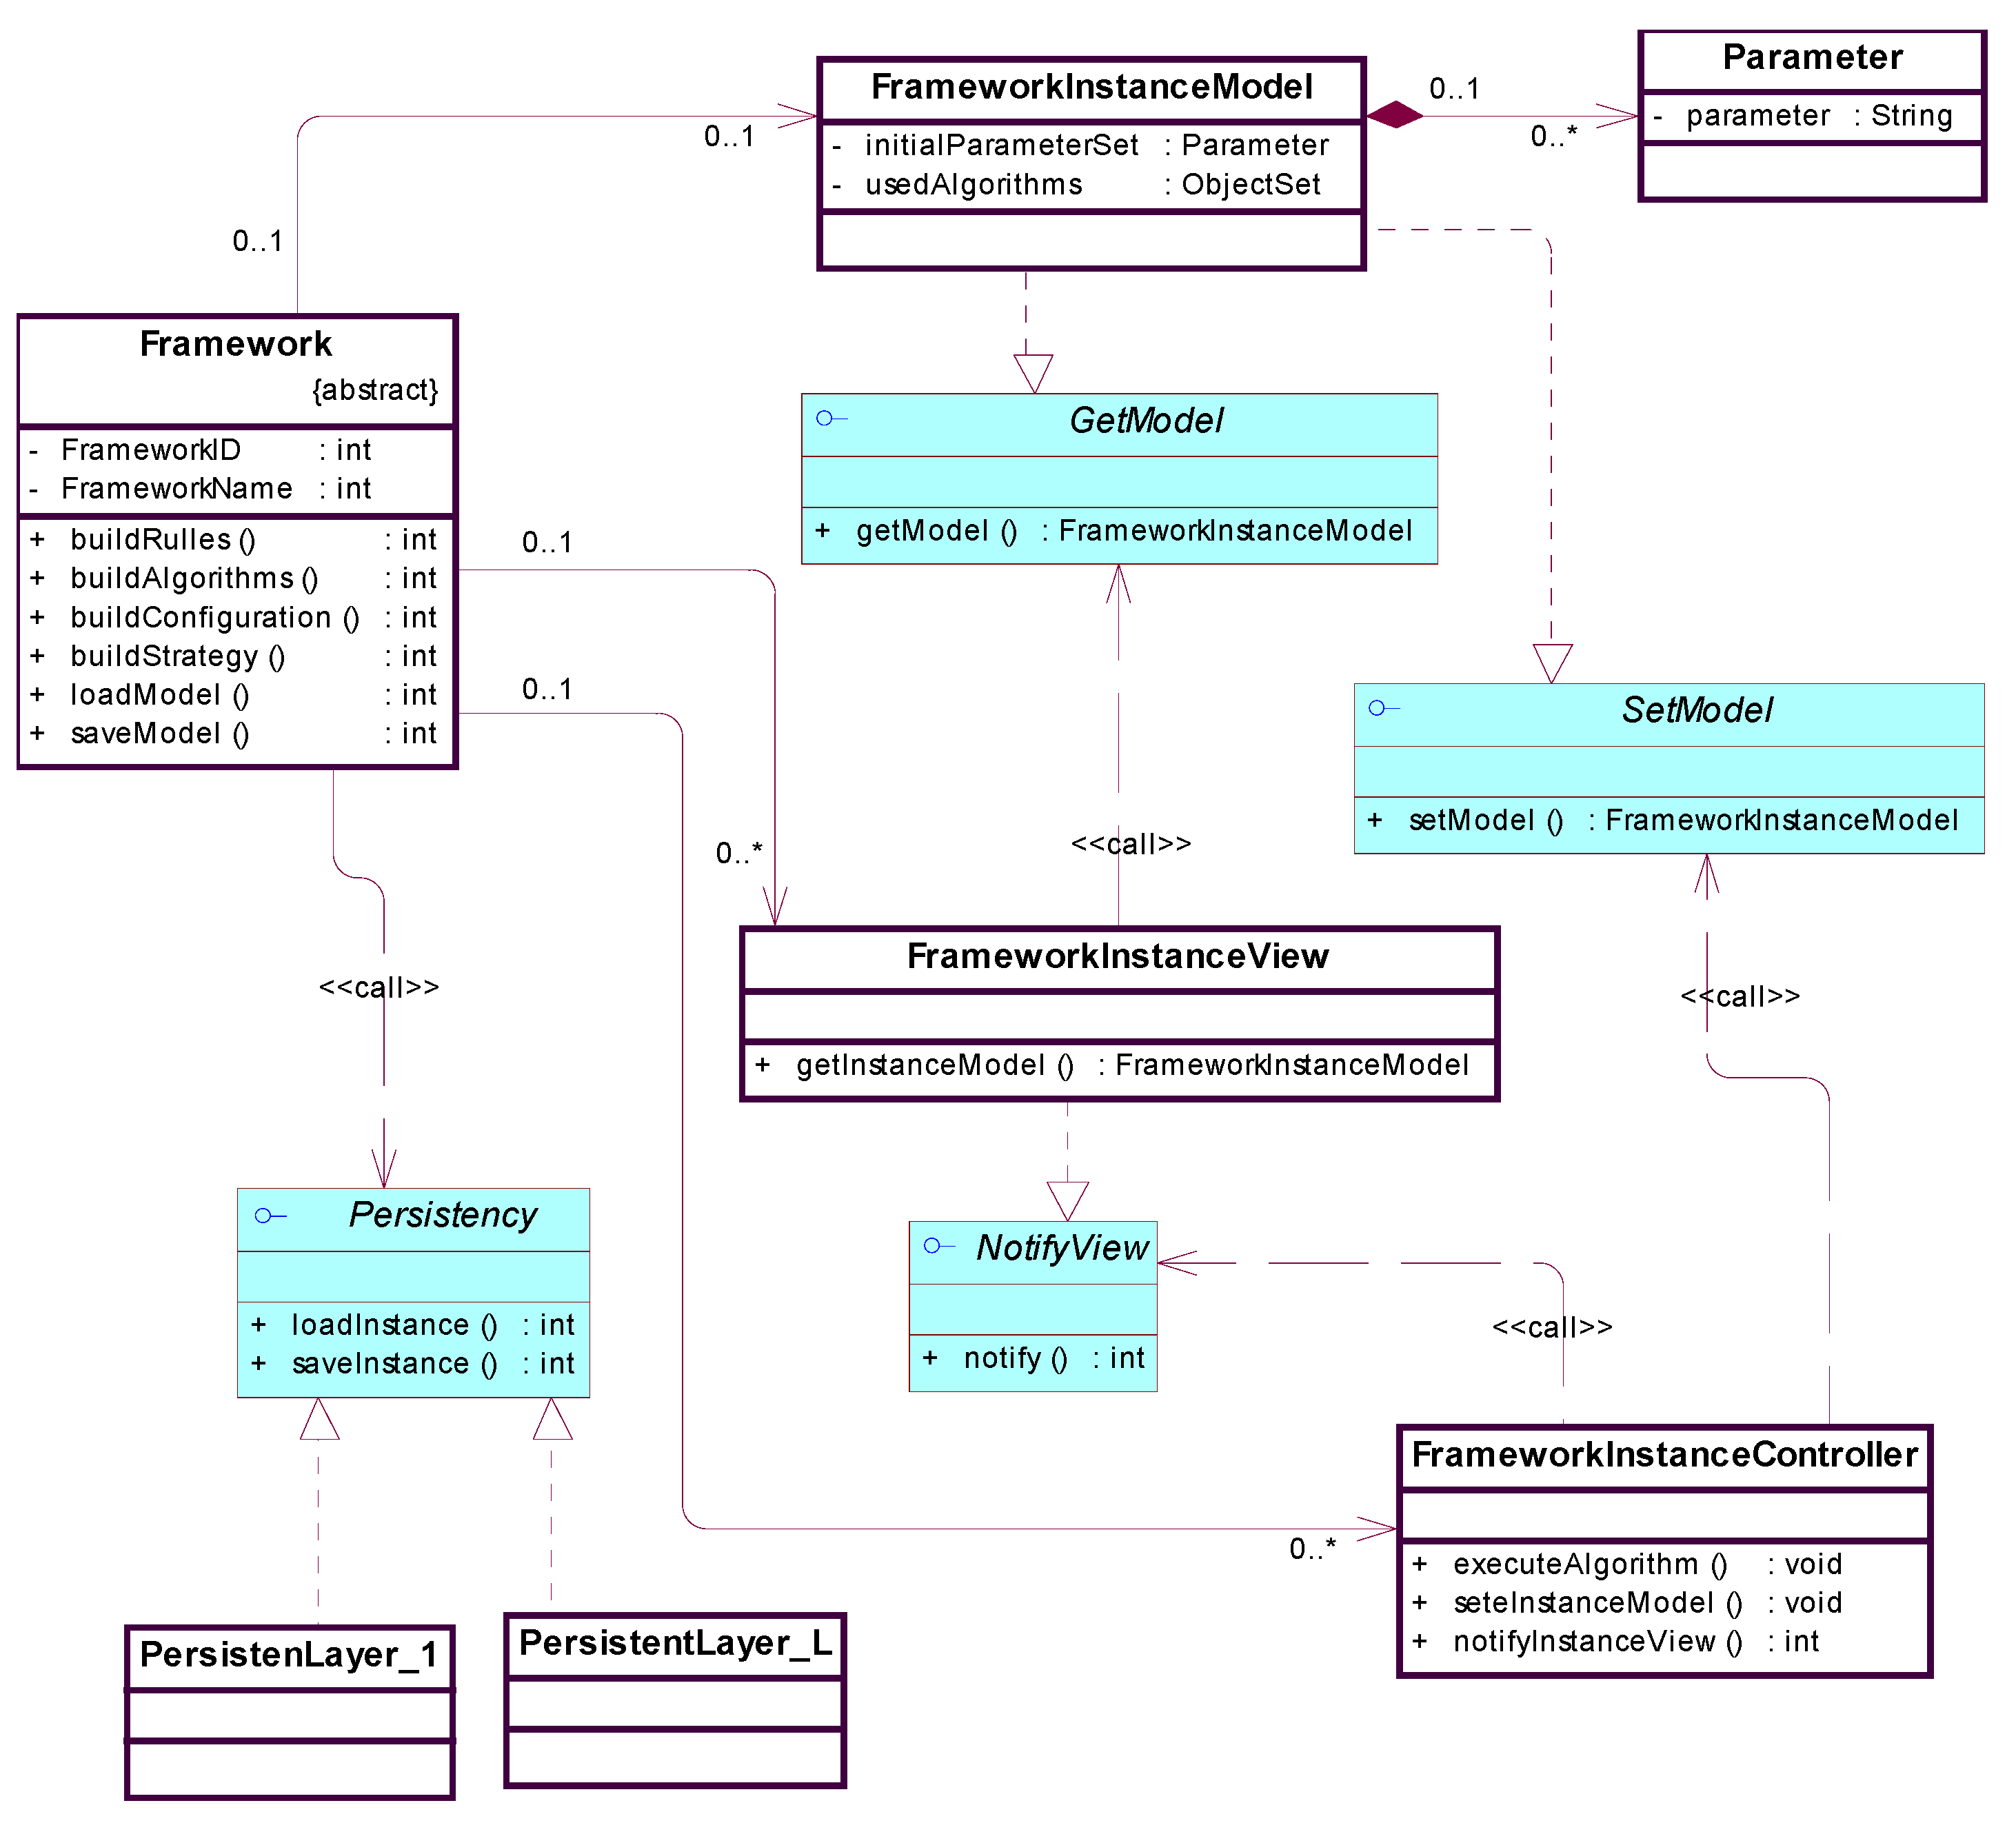
The other essential point of framework specification is the way of preserving concrete products (generated set of building boundaries) joined with a particular instance of Strategy, Algorithm, and Parameter combination data.
The initial conceptual framework model from the persistency aspect is presented in
Figure 3 in the form of an object-oriented diagram.
The role of the Framework concept is the same.
The Persistency interface concept enables the extendibility of vide variety of persistent forms and structure handlers used to store a large volume of data usually created in the particular processing. It isolates the persistent layer from its dynamic management.
The Framework delegates the internal data structure concerns to the FrameworkInstanceModel concept. It is loaded and saved through the Persistency interface methods implementation.
The Framework delegates the visualizations concerns of internal data structure to the FrameworkInstanceView concept and data structure transformation actions concerns to the FrameworkInstanceControler concept.
The role of GetModel, SetModel, and NotifyView interfaces is to relax dependences of FrameworkInstanceModel, FrameworkInstanceView, and FrameworkInstanceControler concepts.
The method used in the proposed solution receives the area of a building as an input in the form of two-dimensional grid representation (particularly 1 × 1 m cells) and varies available algorithms in order to, if possible, generate corresponding building boundaries that satisfy initial constraints (lot and building size) preserving the grid cells interconnection principle. This approach is chosen to initially simplify the overall shape thereby generating particular solutions that:
can be, for verification purposes, easily compared with other methods
are suitable for further enhancements and development in the domain of building’s layout design.
Boundary shape can be either rudimentary with a small number of variations, or quite complex just as is the case in the real examples examination. The primary focus of the proposed method is the focus on complex building boundaries. As the boundary complexity directly influences algorithm complexity and the time for analytical calculation, the method is exercised through the application of different spatial grid transformation algorithms, described in the algorithm section of the article. These variations had a direct impact on criteria that restricts the number of lines composing the particular floor plan. This calculated number is used as a metric for comparative analysis and the evaluation of the proposed method with regards to other published solutions.
The resolution of 1 m of the final image was chosen because in related work research smaller cells of the system caused the generation of buildings that are too complex compared to real buildings and larger cells composed results that are simple and similar to related work findings.
This paper method is applied to building boundary generation for a 20 × 20 m lot size because typical residential buildings are in this category. Expanding the boundaries of the lot did not improve the algorithm in the experimental phase of this research.
The rule-based system is chosen because it allows the writing of algorithms that are reasonably fast for a rapid generation. They are also adjustable to better suit the needs for the task of creating images that represent building boundaries. Through an extensive trial and error process, the rules for the proposed method are formulated and described in the algorithm section of this paper.
The method described in this paper is derived in a way that it can be compared with the real buildings of complex boundary shape to confirm that there is a need for such a generator. Next, the method is compared with different results of other methods described in the related work section and the discussion section of this article.
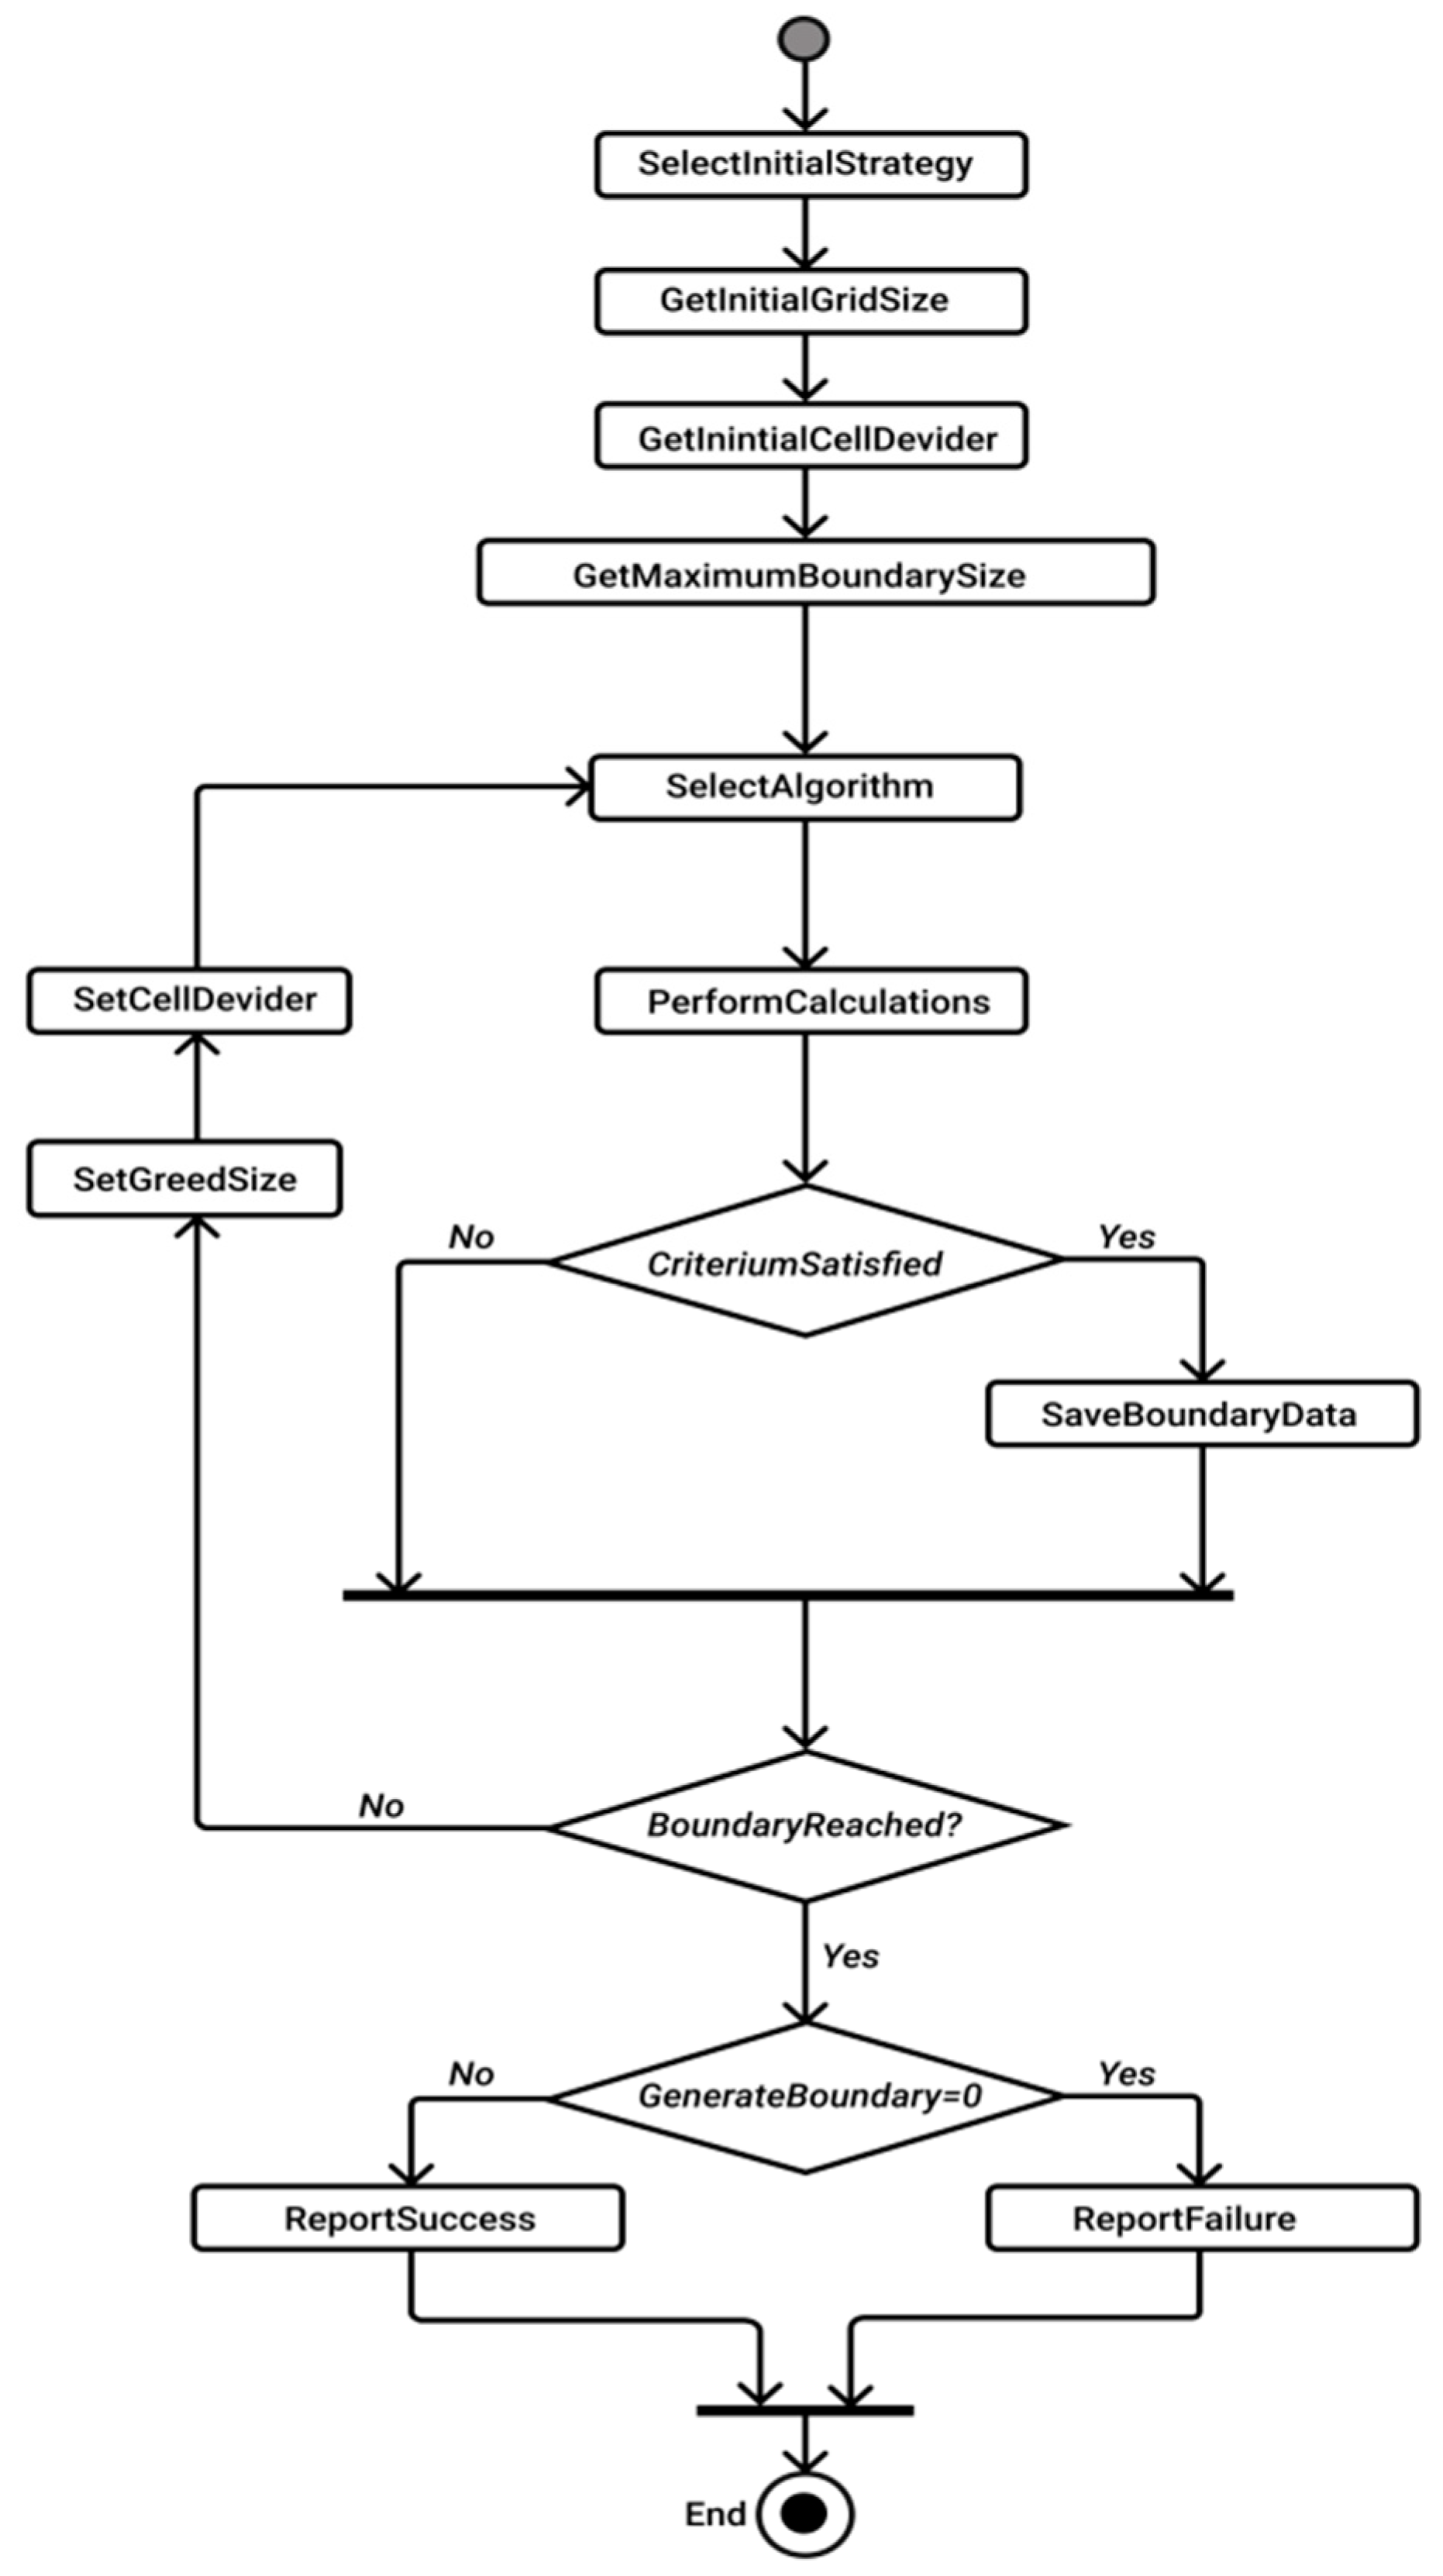
4. Algorithm
The general algorithm used to illustrate and refine the proposed method is presented in
Figure 4.
In the rest of the section, there is a detailed explanation of the steps that have been used in the algorithm and method refinement process.
The shape of a building layout
L is defined by the label of the array with 20 columns and 20 rows. Each cell of the array represents space of 1 m by 1 m that can be either part of the building—B or part of the empty space around it—E. The number of cells that represent built space
N is the value that corresponds to the desired area of the house. Value
N is the area of the building in square meters. A valid shape should satisfy two constraints first, all B labels are connected into a single shape; second, there are no E labels inside layout
L.
The algorithm starts from the simplest case where the floor plan is represented as an array of five columns and five rows where random values describe the overall shape. Next, the transformation of the results into a 10 by 10 matrix with specific rules that are applied. Finally, from previous results, a 20 by 20 array is formed. In this final step sets of rules are applied.
The algorithm can be applied for generating buildings that are square-shaped and have a maximum area of 400 square meters. It can give results for houses that are in the range of 40 to 360 square meters.
4.1. Generation of 5 by 5 Array
The first stage of the method generates a random array using a random number generator. The only input into the algorithm is the desired area of the building. In the first stage, that number is divided into a 5 by 5 array.
In order to get valid results, new rules are applied. Every cell of the 5 by 5 array will be transformed into 16 cells in the final 20 by 20 solution. The first rule applied states that any cell cannot have a value greater than 16 or less than 0. If one cell of this array is
c(x,y) then we can use the expression:
The next constraint is that the middle cell of the array
Lf(2,2) is always 16. This means that in the final array the middle of the layout is always labeled as part of the building (expression (3)).
As the consequence, in the final 20 by 20 array, not all corners will be labeled as part of the building. In the 5 by 5 array the corner cells are as
C = {
C1,
C2,
C3,
C4} and 8 middle cells as
M = {
M1,
M2,
M3,
M4} as in showed in expression (2).
Their corresponding values are
Cv for the sum of
C1,
C2,
C3, and
C4 and
Mv for the sum of
M1,
M2,
M3, and
M4 = Relationship of values of all corner cells
Cv and middle cells
Mv is defined by the formulas:
where
N represents the area of the building. The next step was to get unique random solutions for the layout. This is solved by the generation of four random real numbers
r1,
r2,
r3, and
r4 where
which is applied in order to get values of cells in four corners of the array.
Cv1,
Cv2,
Cv3, and
Cv4 are values of cells
C1,
C2,
C3, and
C4 respectively. Their value is calculated by the formula:
This will determine where the most cells labeled as built are in the final solution. If
Cvn is bigger than 49, then the value is 49 and the difference is added to the other cells. The next step is to fill
Cvn values into corner cells of a 5 by 5 array. This is accomplished by forming a set of 4 numbers {
cvn1,
cvn2,
cvn3,
cvn4} which sum is the value of the cell
Cn. They are calculated by the rules in the equation:
This list is then transformed so the biggest values are closest to the middle of the array, and the lowest is at the corners. The other two cells are randomly placed in the other two places for
Cn values. This is illustrated by the next formula:
By these steps, only the middle cells of M are left to be filled. The algorithm was formulated to firstly fill the middle cells that are surrounded by at least two 16 cells. In that case, the cell is filled with value 16. Secondly, if the values of the cells orthogonally 1 cell away are bigger than 32, if other conditions are met, then the cell value is 12. The rest of the middle cells are filled with the number 8 until the sum of the array is the same as the input number of built cells N.
There is a possibility that the sum of the array is less than
N. The difference is calculated and represented as
D. In that case, the rest of the sum is split into values depending on the value
D and the number of possible cells to be filled. These values are filled in cells which value is zero. Finally, if the values of the middle cells
M that are in the first or the last column or row
m15-i not zero, and the values of the middle cells
M that are connected to them
m34-i are not 16, then values of these cells are recalculated by the rule:
An example is shown in expression (11). Value
m15-i = 12 and value
m34-i = 5. In this case,
m15-i >
m34-i, and therefore new values are recalculated. Without this step, empty cells would appear inside the borders of the building.
By these rules, all problems are solved and the next step is transforming the 5 by 5 array to a 10 by 10 array using different rules.
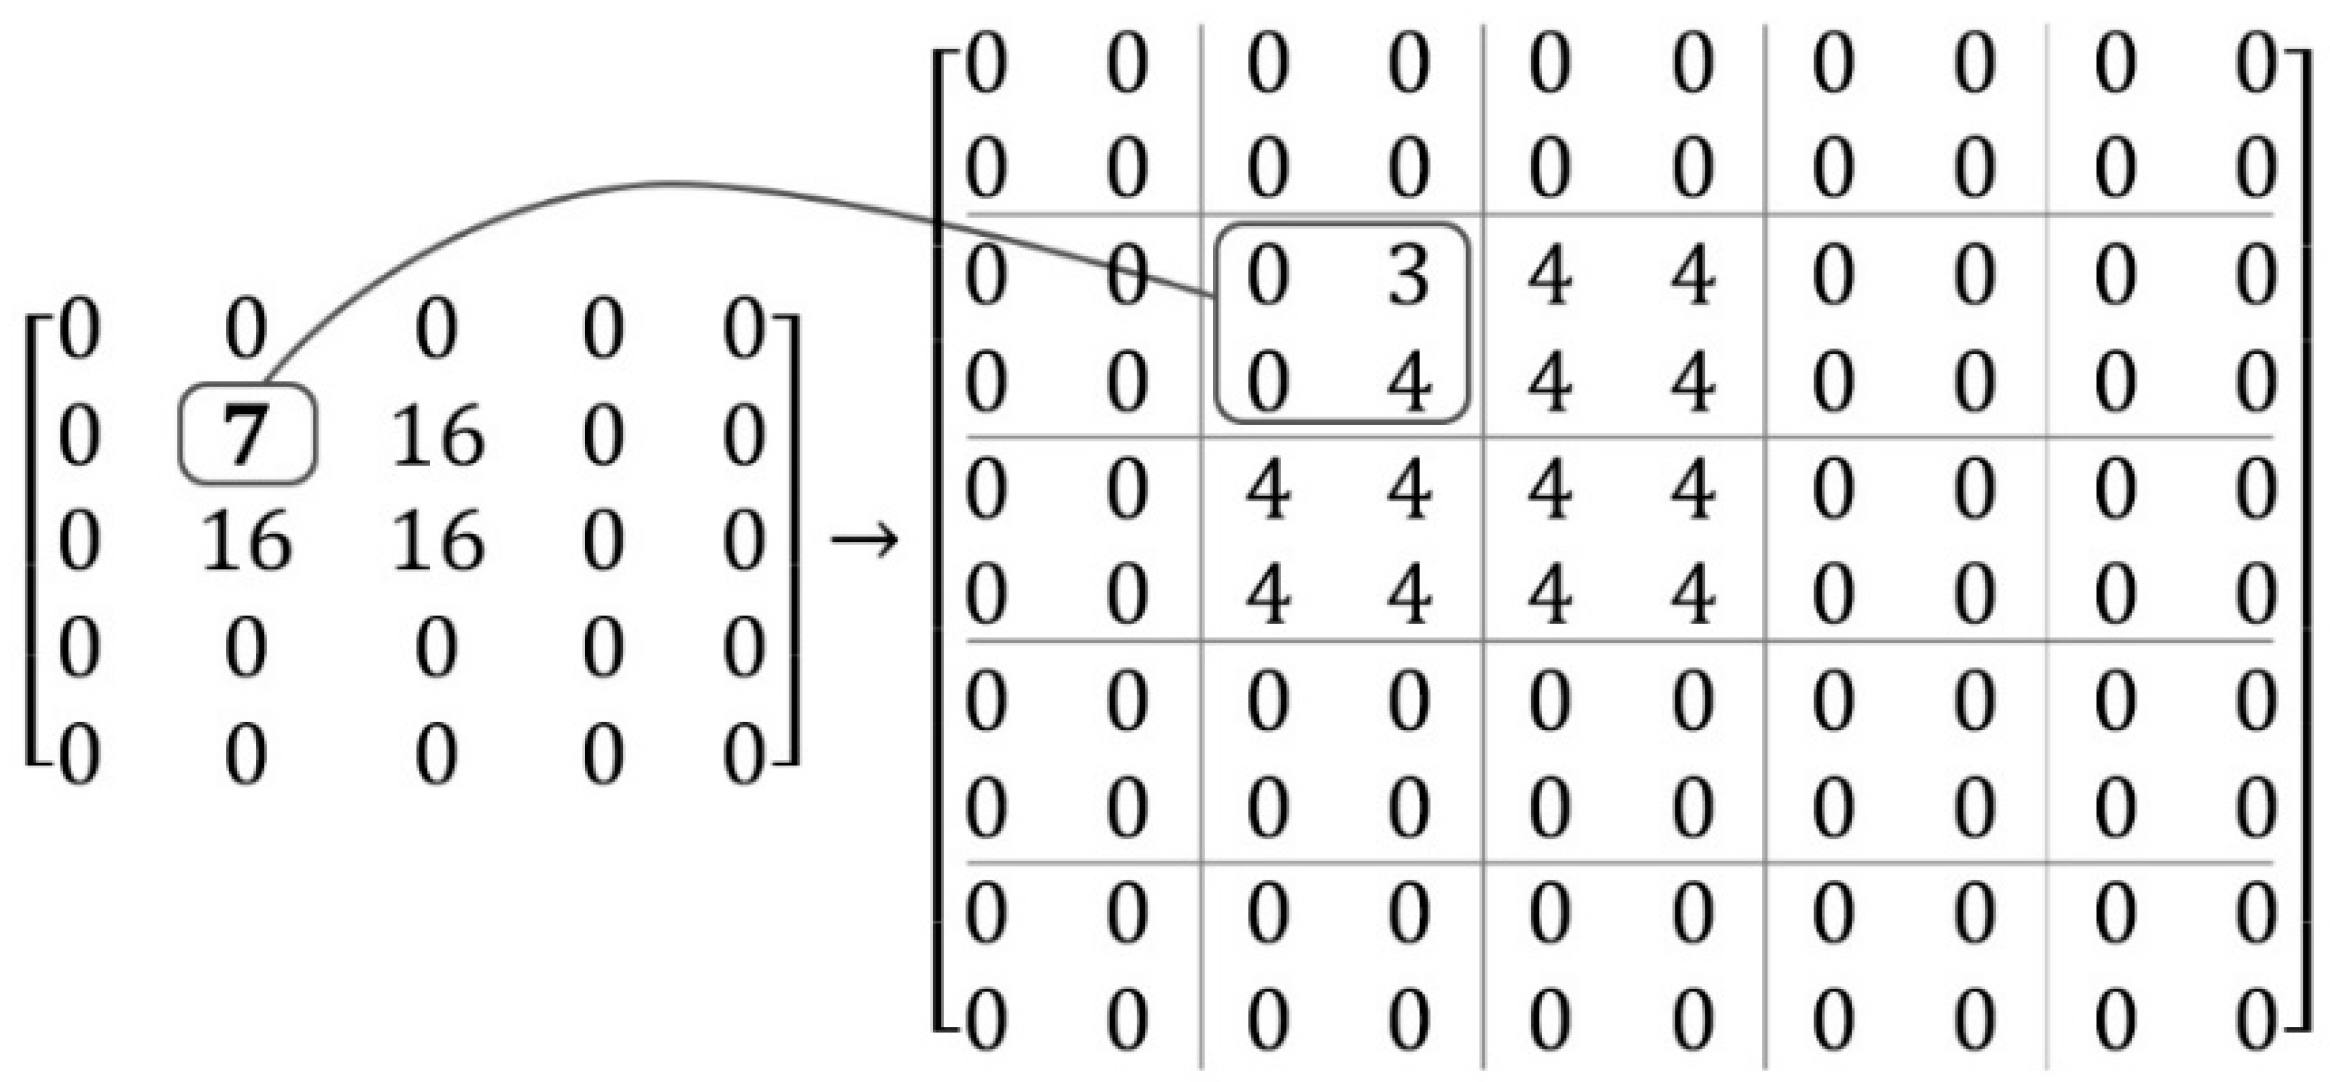
4.2. Generation of 10 by 10 and 20 by 20 Arrays
This array is the middle step between generating the first sketch and the final array. Every cell value is split into four values as shown in the array:
Isolating one cell from the 5 by 5 array transformation can be presented as:
In this case value of the cell c(0,0) is equal to the sum of values cx(0,0), cx(1,0), cx(0,1), and cx(1,1). If the value of the 5 by 5 cell is zero then four values corresponding to this value in a 10 by 10 array are 0. Similarly, if the same value is 16, then all four values are equal to 4. When the value is between 0 and 16 first step is to split the number with the rule then no 10 by 10 cell can have a value greater than 4. In order to have a solution without empty cells in the middle of the grid, cells values are preferably 4 or 0. Only one cell out of four per transformation can have a value that is different than 0 or 4.
A list of four values is then applied in the 10 by 10 array based on the surrounding cells. If the values of cells around the observed cells are 16 and 0, then minimal values from the list are positioned close to other 0 values, and maximum values of the list are positioned close to cells with value 16. An example of this method is presented in
Figure 5.
The next step is the transformation of a 10 by 10 array into a 20 by 20 array by simple transformation rules. This method for generating the final array has rules similar to the rules from the previous chapter. Every cell of 10 by 10 array is transformed into 4 cells of 20 by 20 array. A value of 0 means all cells are zero. A value of 4 means that all four cells have a value of 1. Values between 0 and 4 are written as a list of four numbers that are either 0 or 1. The sum of the list is equal to the value of the cell from the 10 by 10 array. Similar to the solution shown in
Figure 5, minimum values are placed near adjacent cells with a value of 0, and maximum values are placed near cells with a value of 4.
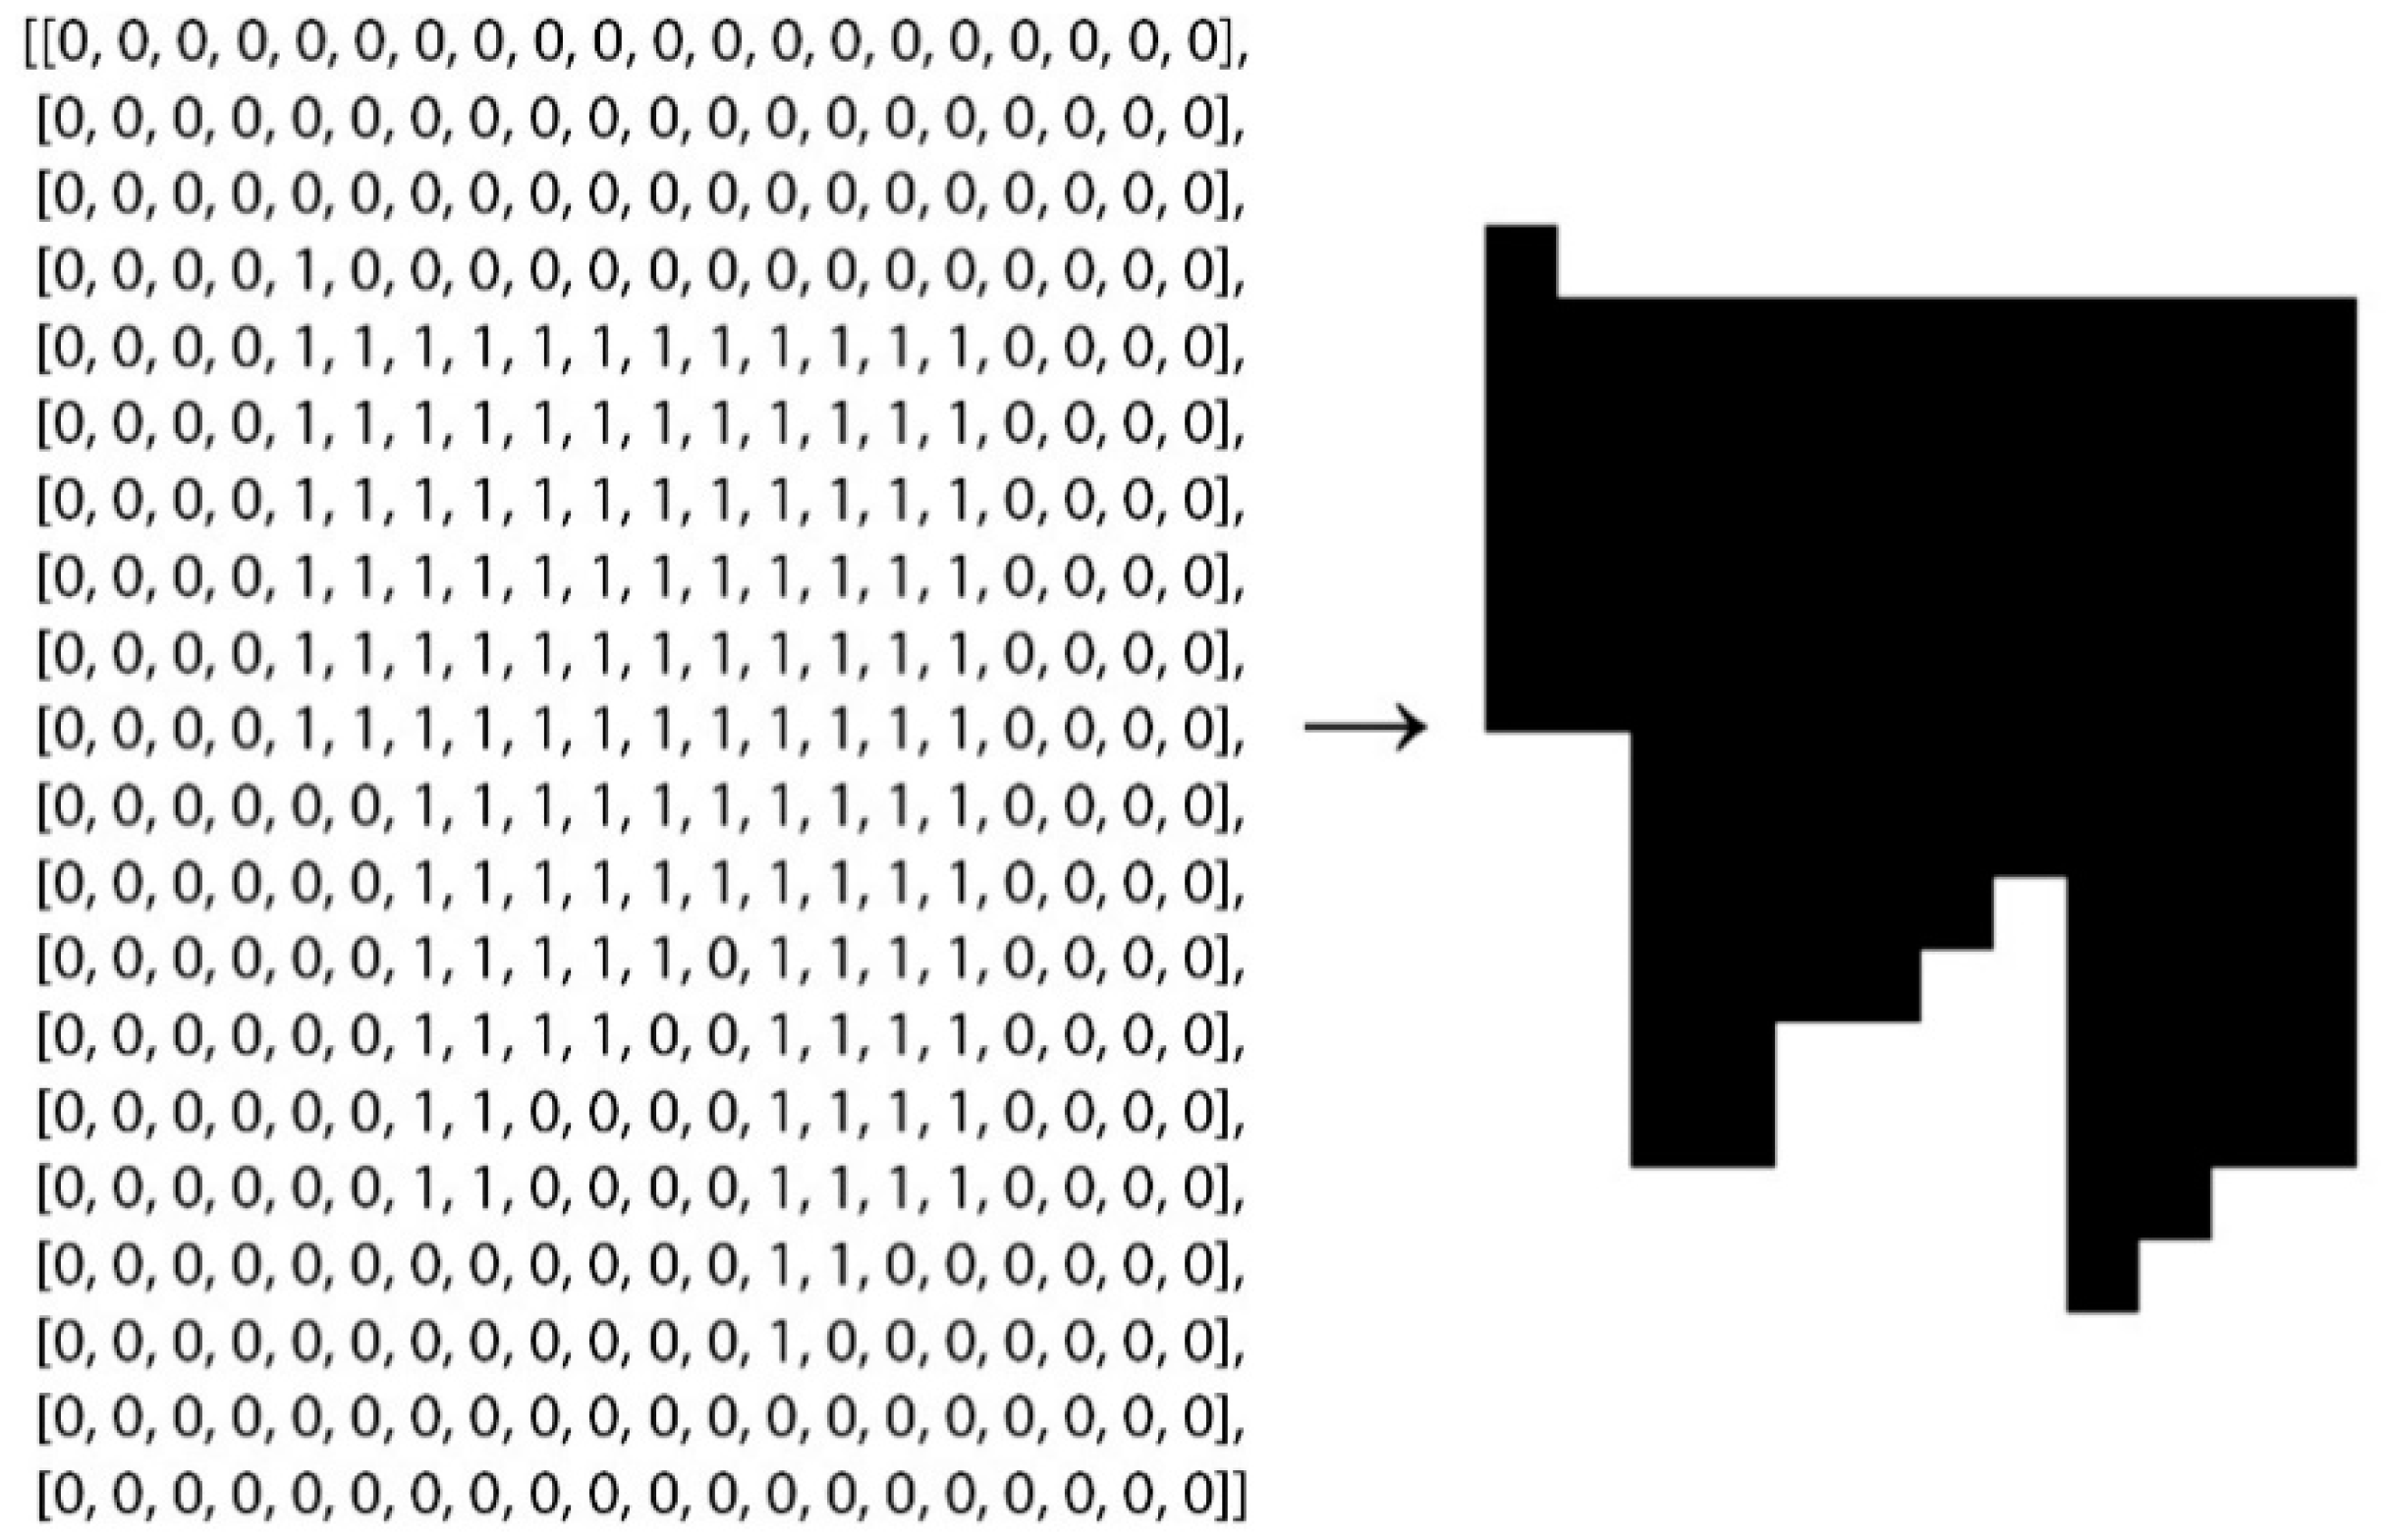
The algorithm was designed to validate the final array where solutions that have empty cells in the middle of the building, solutions that are split in more than one building, and solutions that have a different sum of the array from the input number are excluded. The last step is labeling cells with a value of 1 as built and others, with a value of 0, as empty. Solutions are represented as an orthogonal grid of pixels and the image is created as presented in
Figure 6.
5. Results
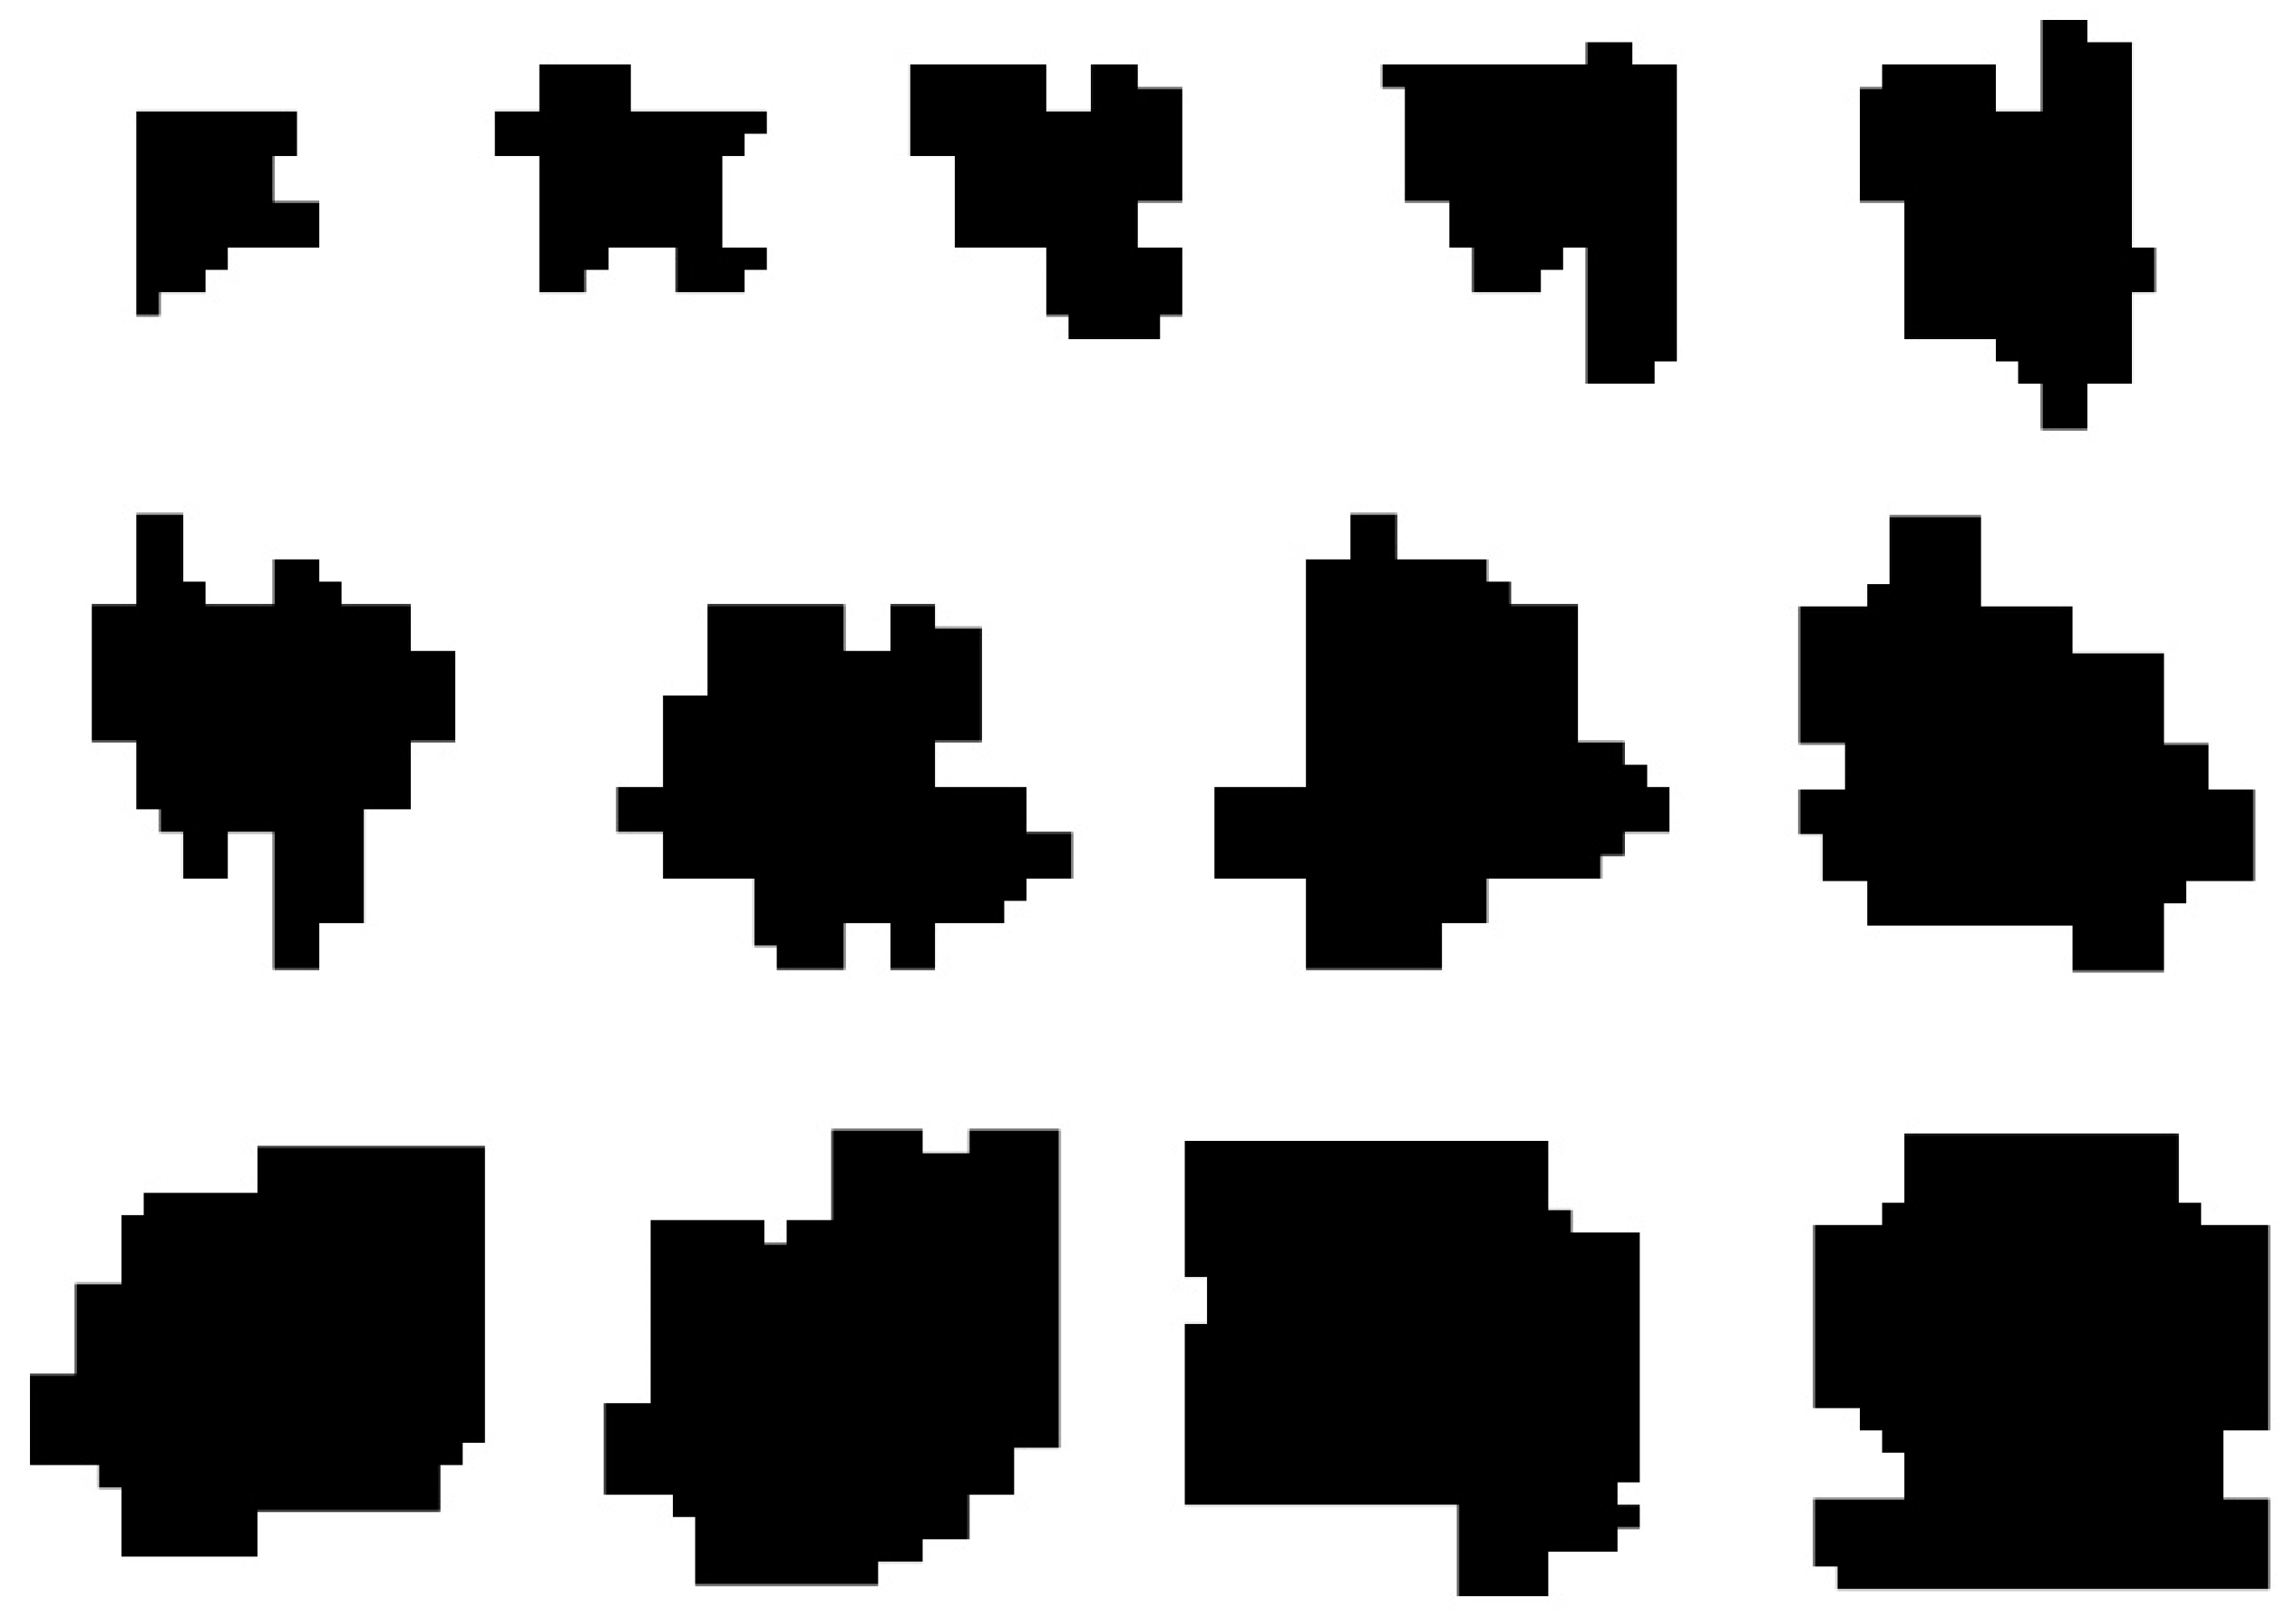
The prototype implementation of the algorithm is in Python language. All tests are done on a 3.1 GHz Intel Core I5 with 8 GB RAM. The inputs to the algorithm are numbers that represent the area of the building and the number of different generated solutions. Outputs of the algorithm are images of the layout and arrays exported in text form. In
Figure 7, the results are illustrated by randomly generated layouts from using the method described in the previous chapter.
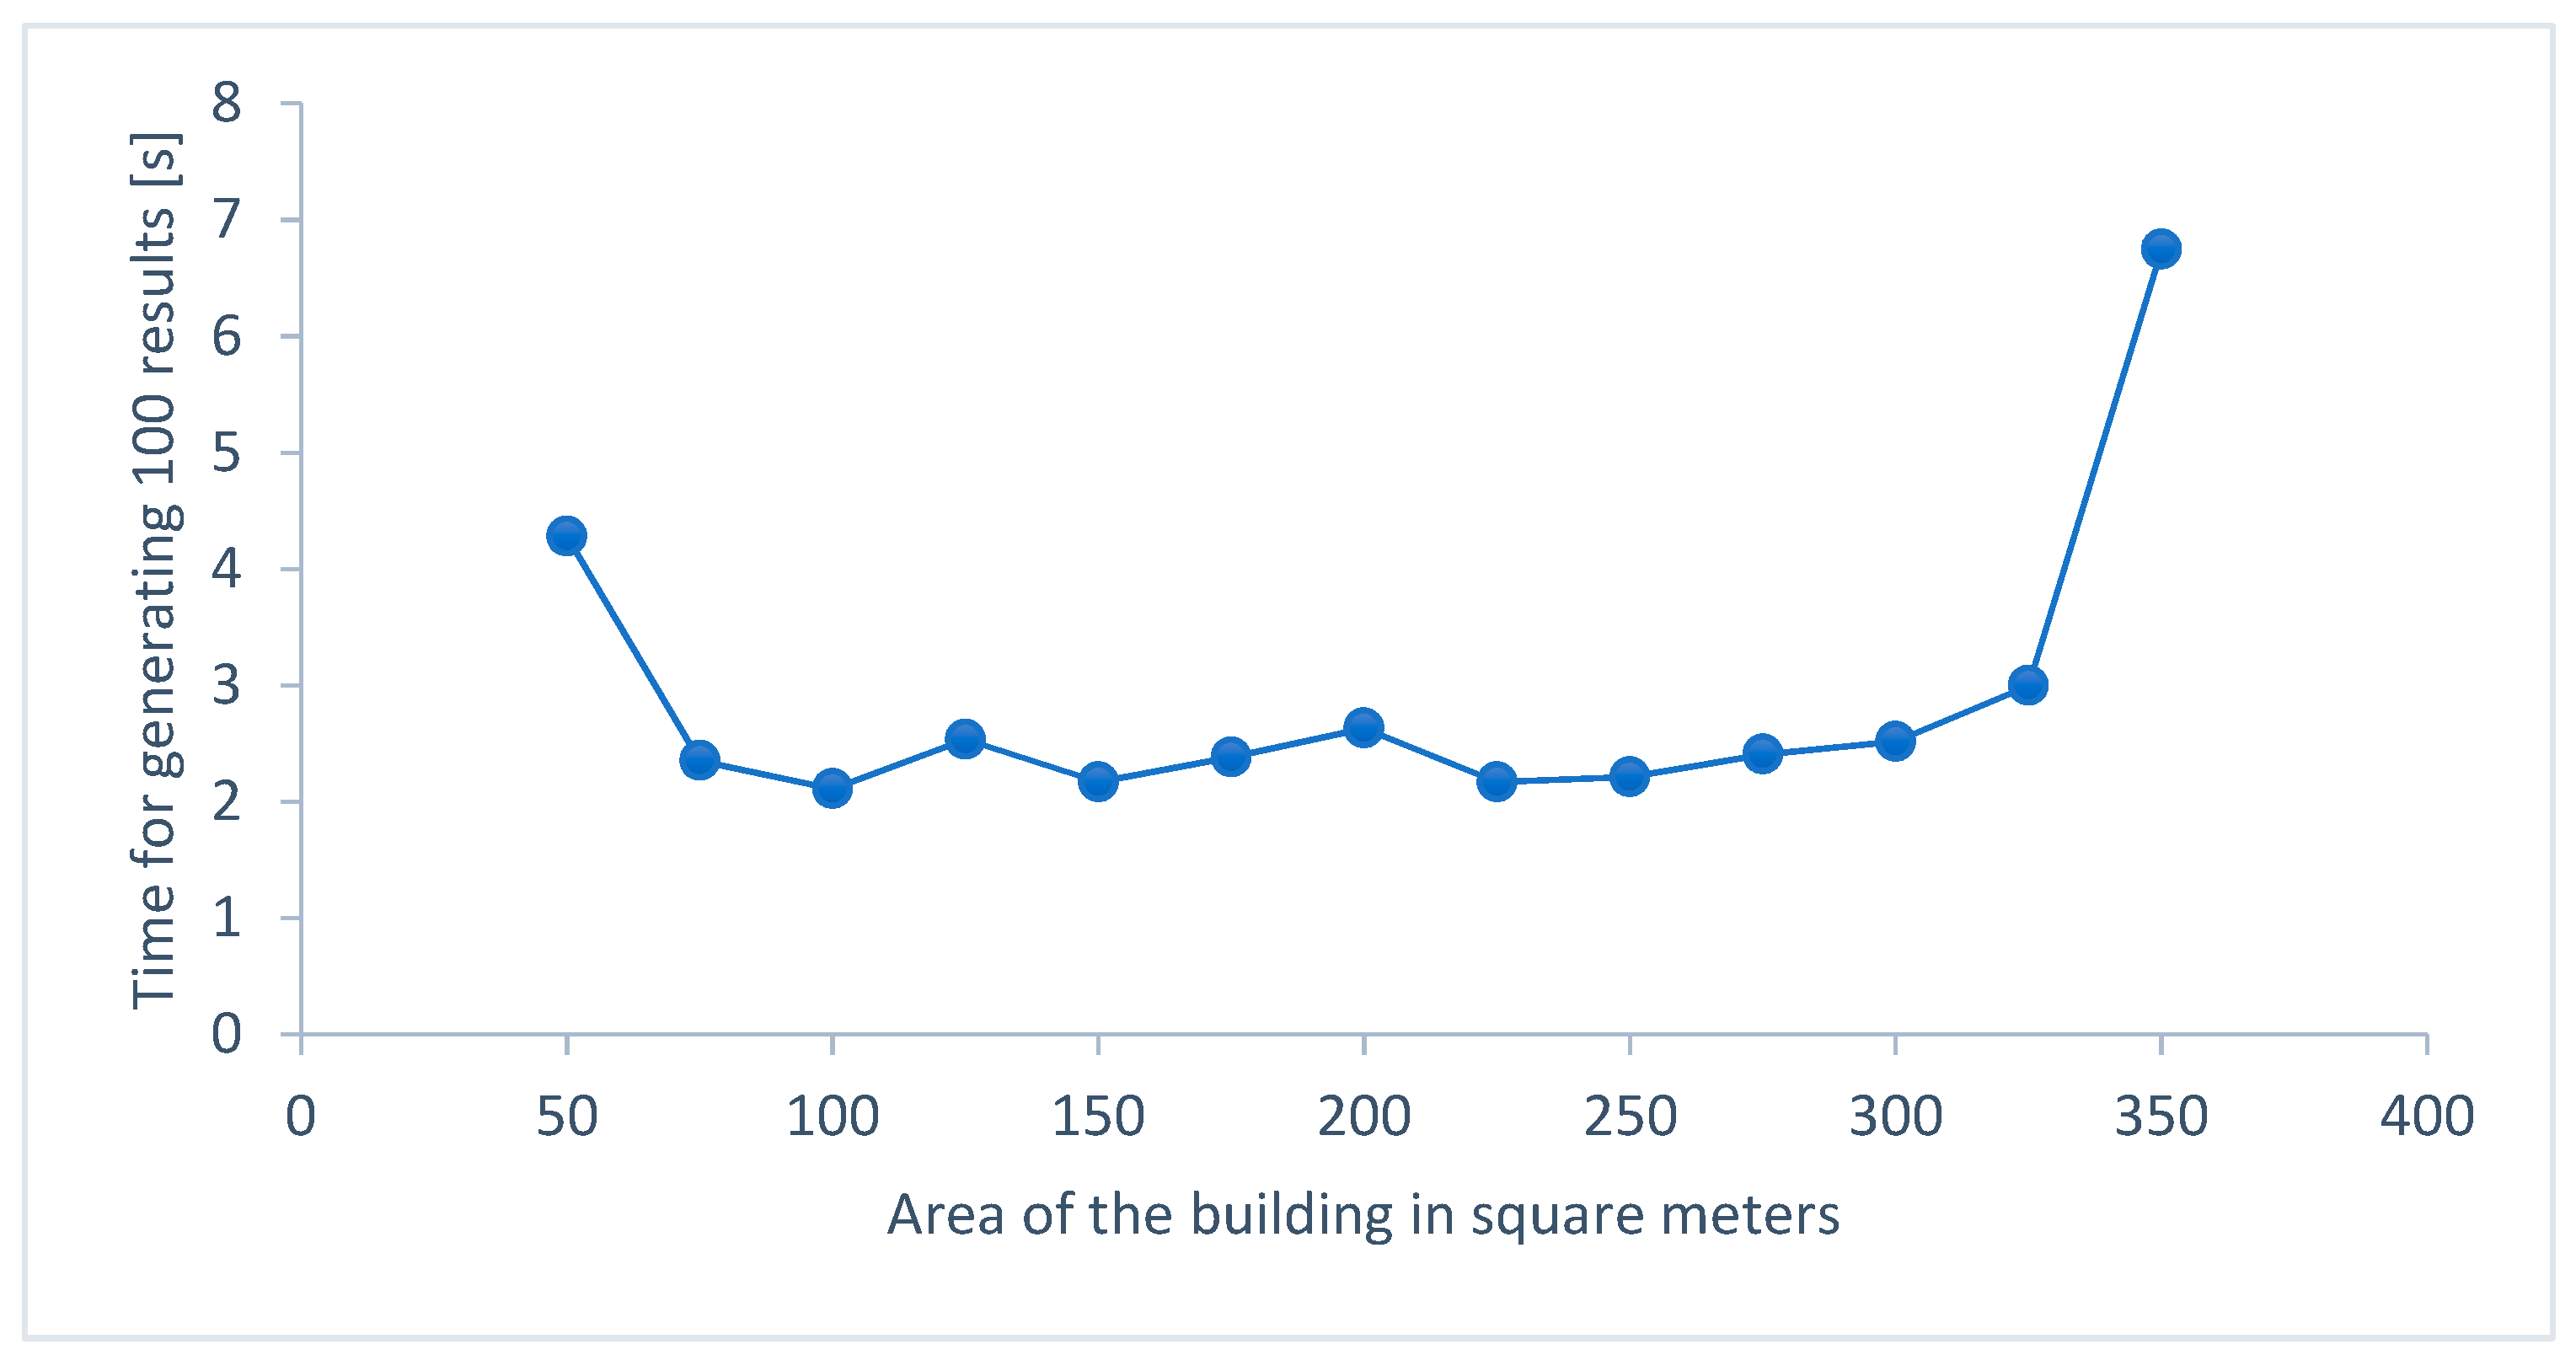
This method is evaluated by producing 100 different building layout shapes for each area input. Input numbers that represent the area of the building in square meters are values from 50 to 350 by increasing the number by 25 for overall 13 different inputs. The average time for this task is calculated and the results are presented in
Figure 8. For most of the input values, N calculations of 100 valid layouts takes between 2 and 3 s. For the bordering values of N, the time for calculation is higher.
Results are measured by the number of edges necessary to draw the border of the building. Borders of the buildings generated by our method show that the number of edges can be a minimum of 12 and a maximum of 54. The distribution of the results is presented in
Figure 9. The average values vary corresponding to the input parameter of the building area.
The results are compared to the results of other methods [
10,
13,
18,
19] and real buildings with complex borders by the same criteria. Building floor plans are converted into a grid of the 1 by 1 m squares through the simple algorithm that is developed in order to have uniform results. The number of edges before and after conversion is the same except in some cases the area of the buildings changed no more than 5%, which we considered tolerable.
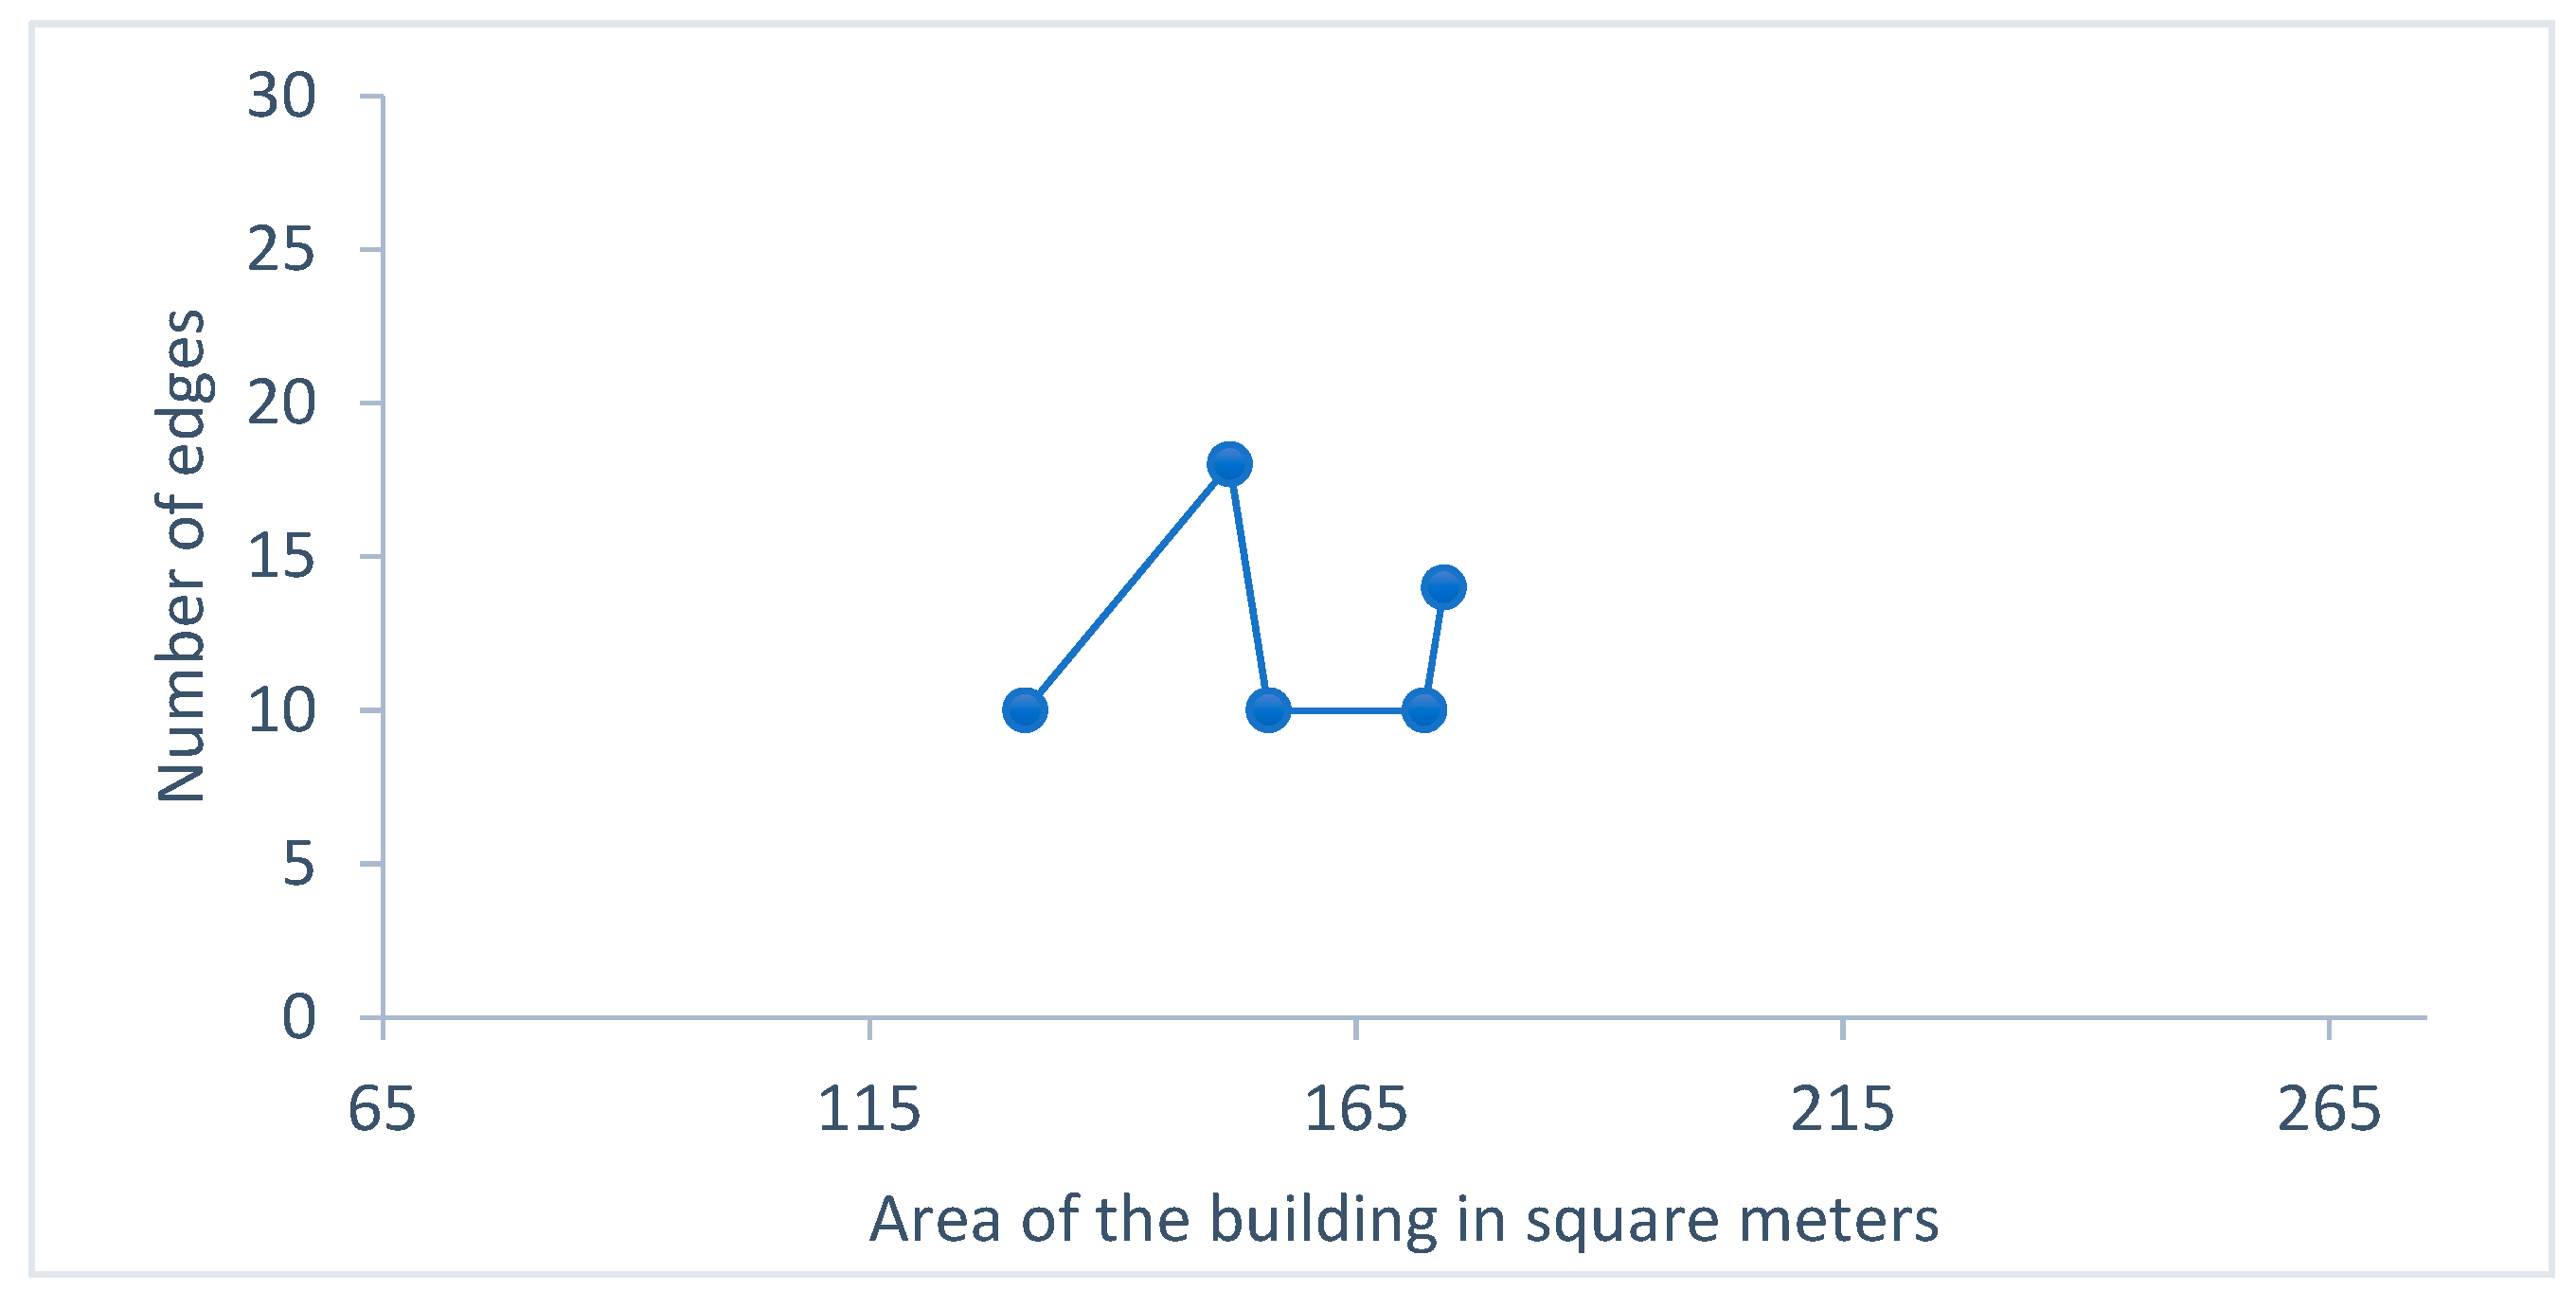
First, the described method is compared to the research by Merrell et al. [
19]. Only complete computer-generated solutions are considered. The maximum value of edges is 18 for the house with an area of 152 square meters.
Figure 10 shows the distribution of the results.
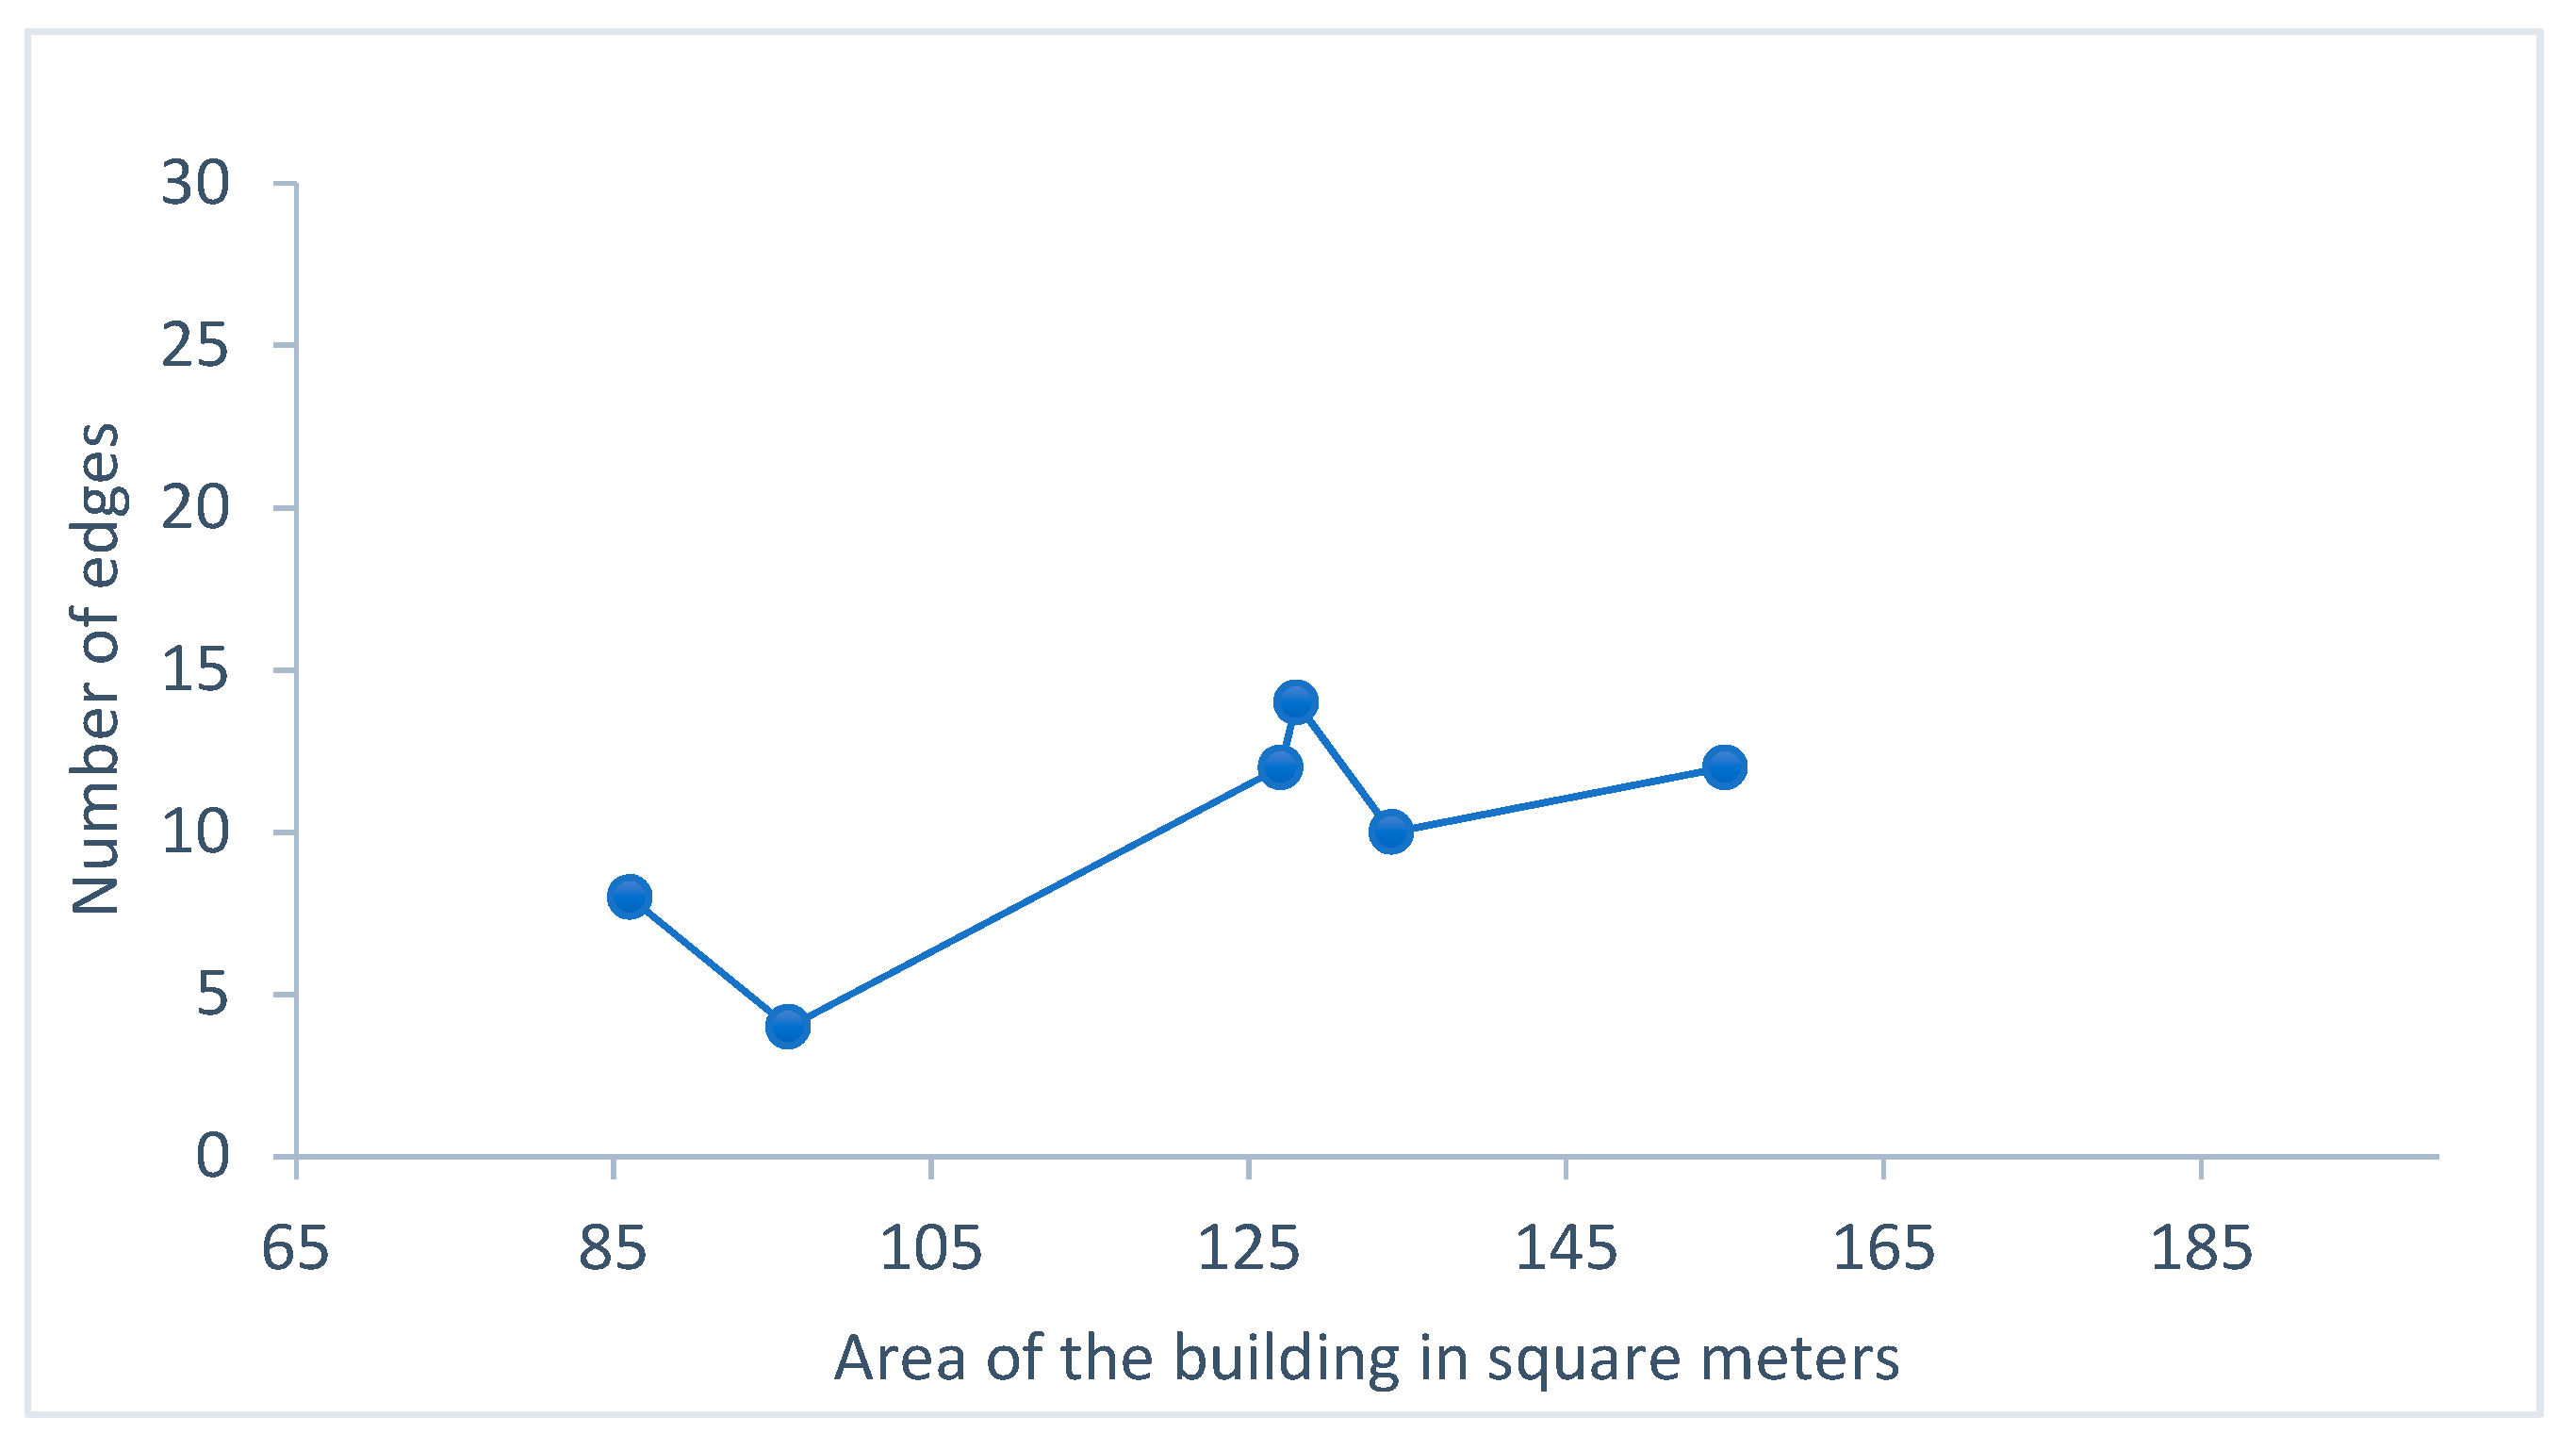
Next, the results from the research of Wang et al. [
13] are evaluated area of buildings in this research is between 85 and 155 square meters. The highest number of edges in this paper is 14 and the average value is 10. Results are presented in
Figure 11.
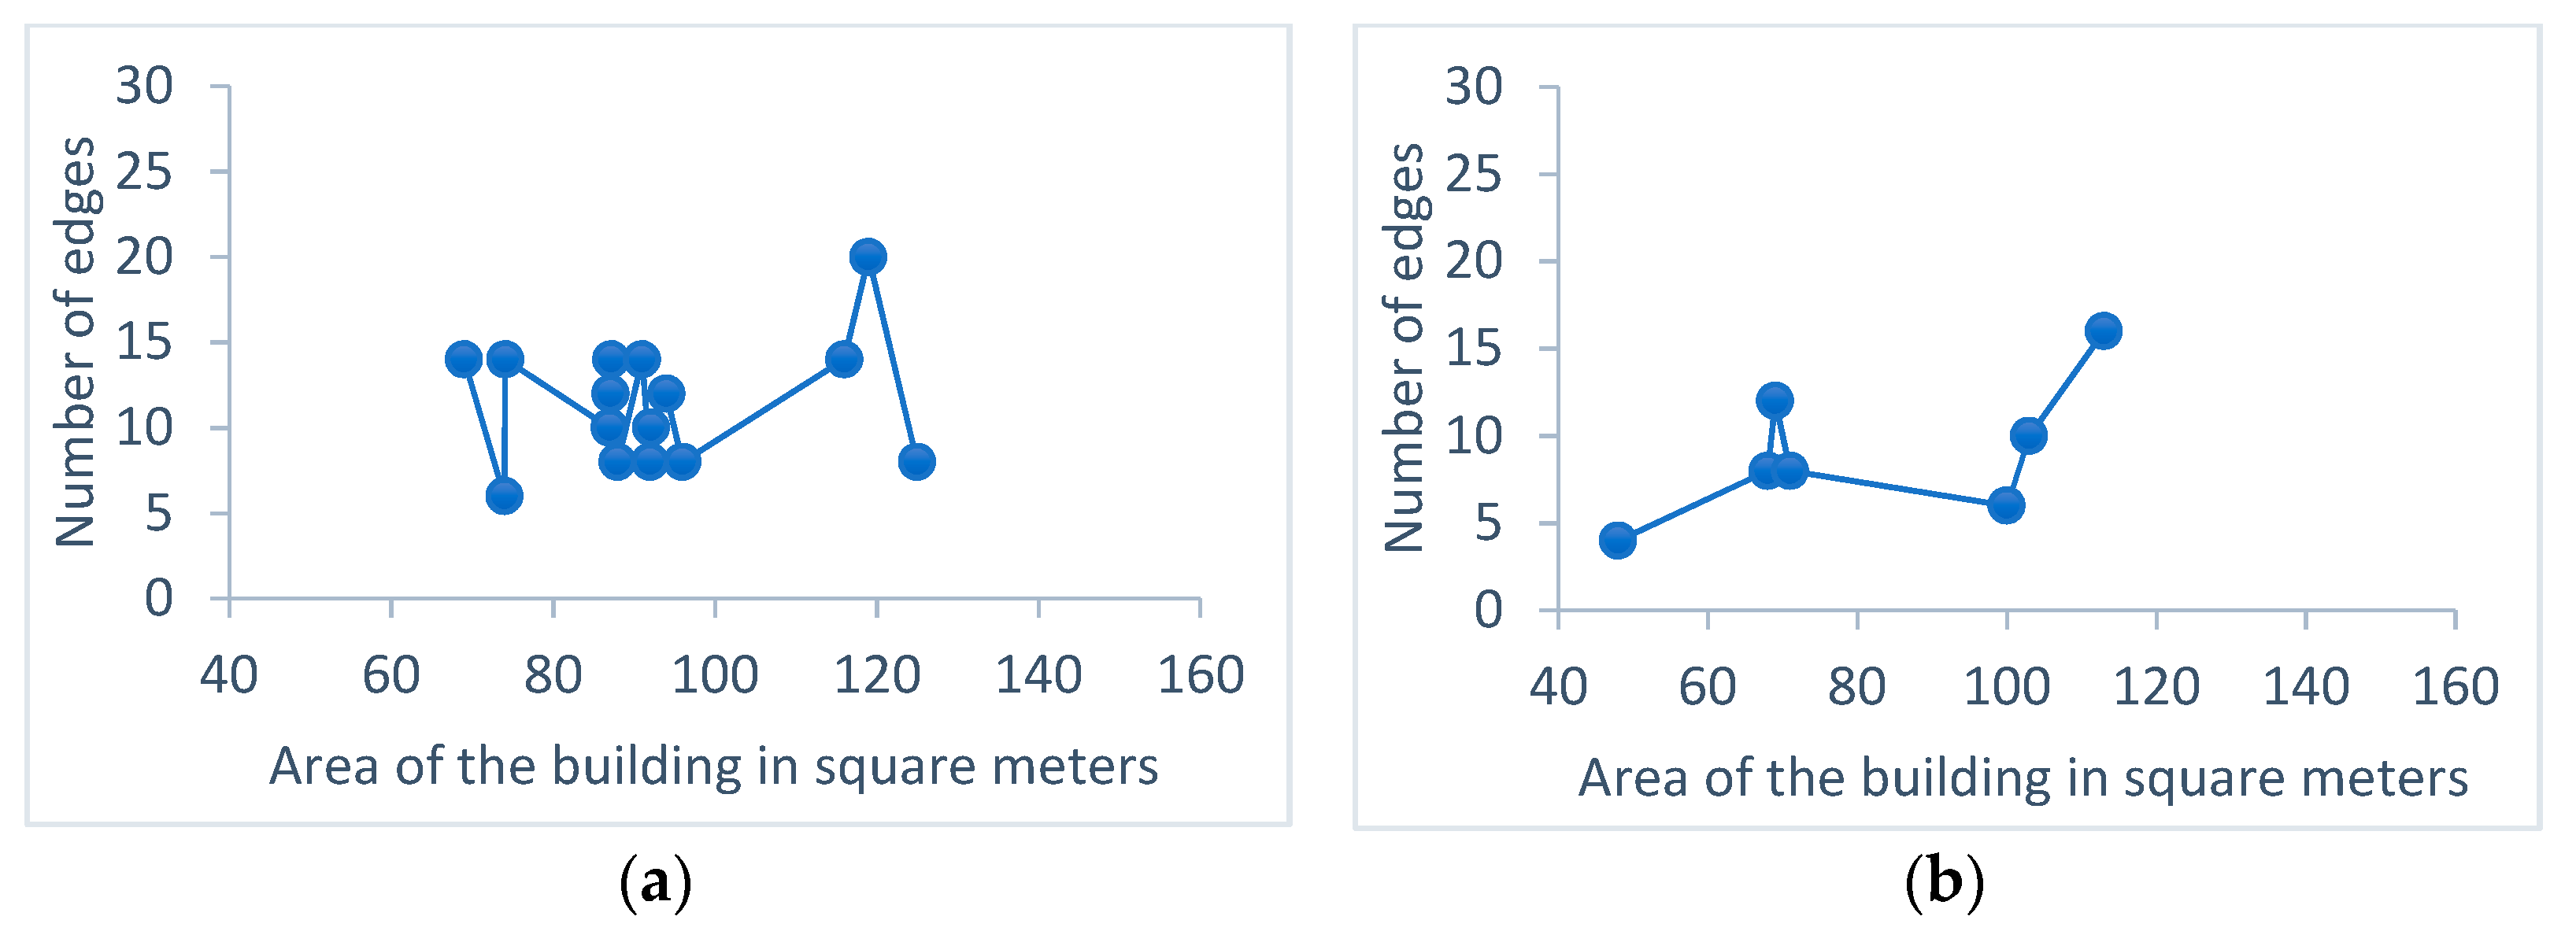
The research of Wu et al. [
10,
18] can be observed from two aspects. The first aspect is the analysis of the floor plans from traced from the real world [
18] where examples are shown in area range of 75 to 125 square meters. The maximum value is 20, and the average is 11.46 edges per building. The second aspect is the analysis of the MIQP-based computer-generated layout [
10]. This research presented a similar area range as previously mentioned, but the maximum value of edges is 16, and the average is 7. Results are shown in
Figure 12.
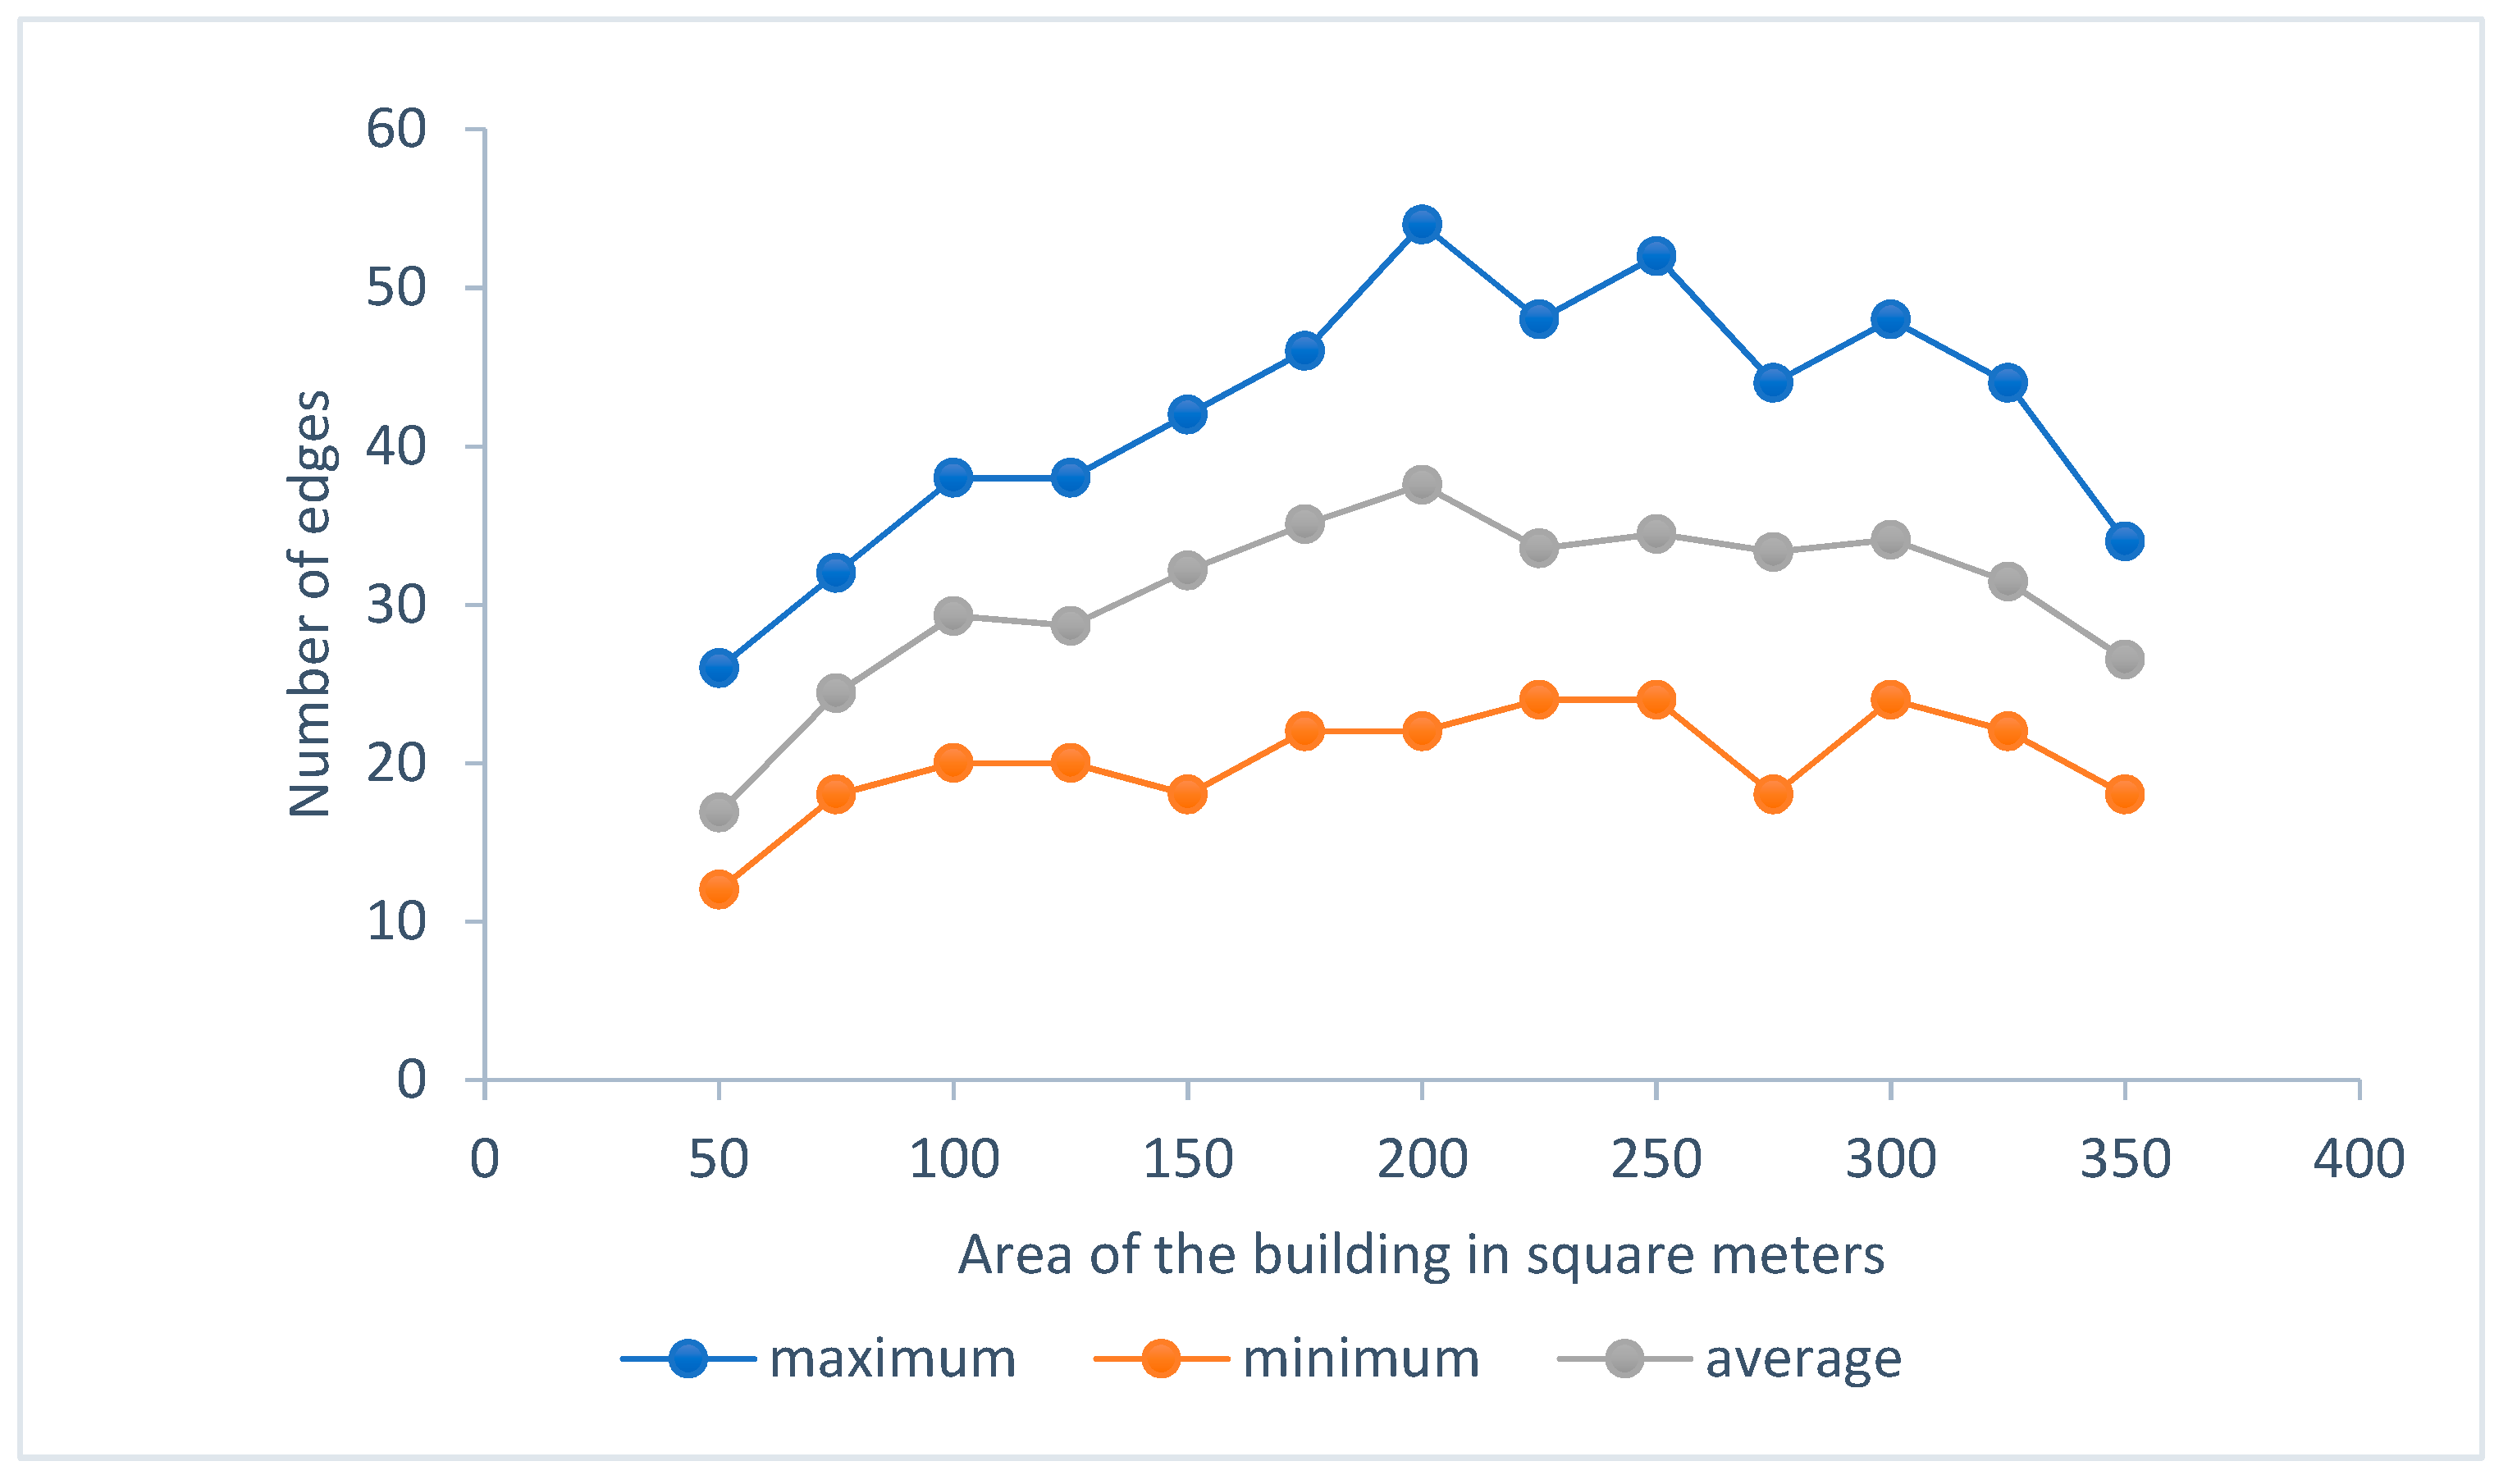
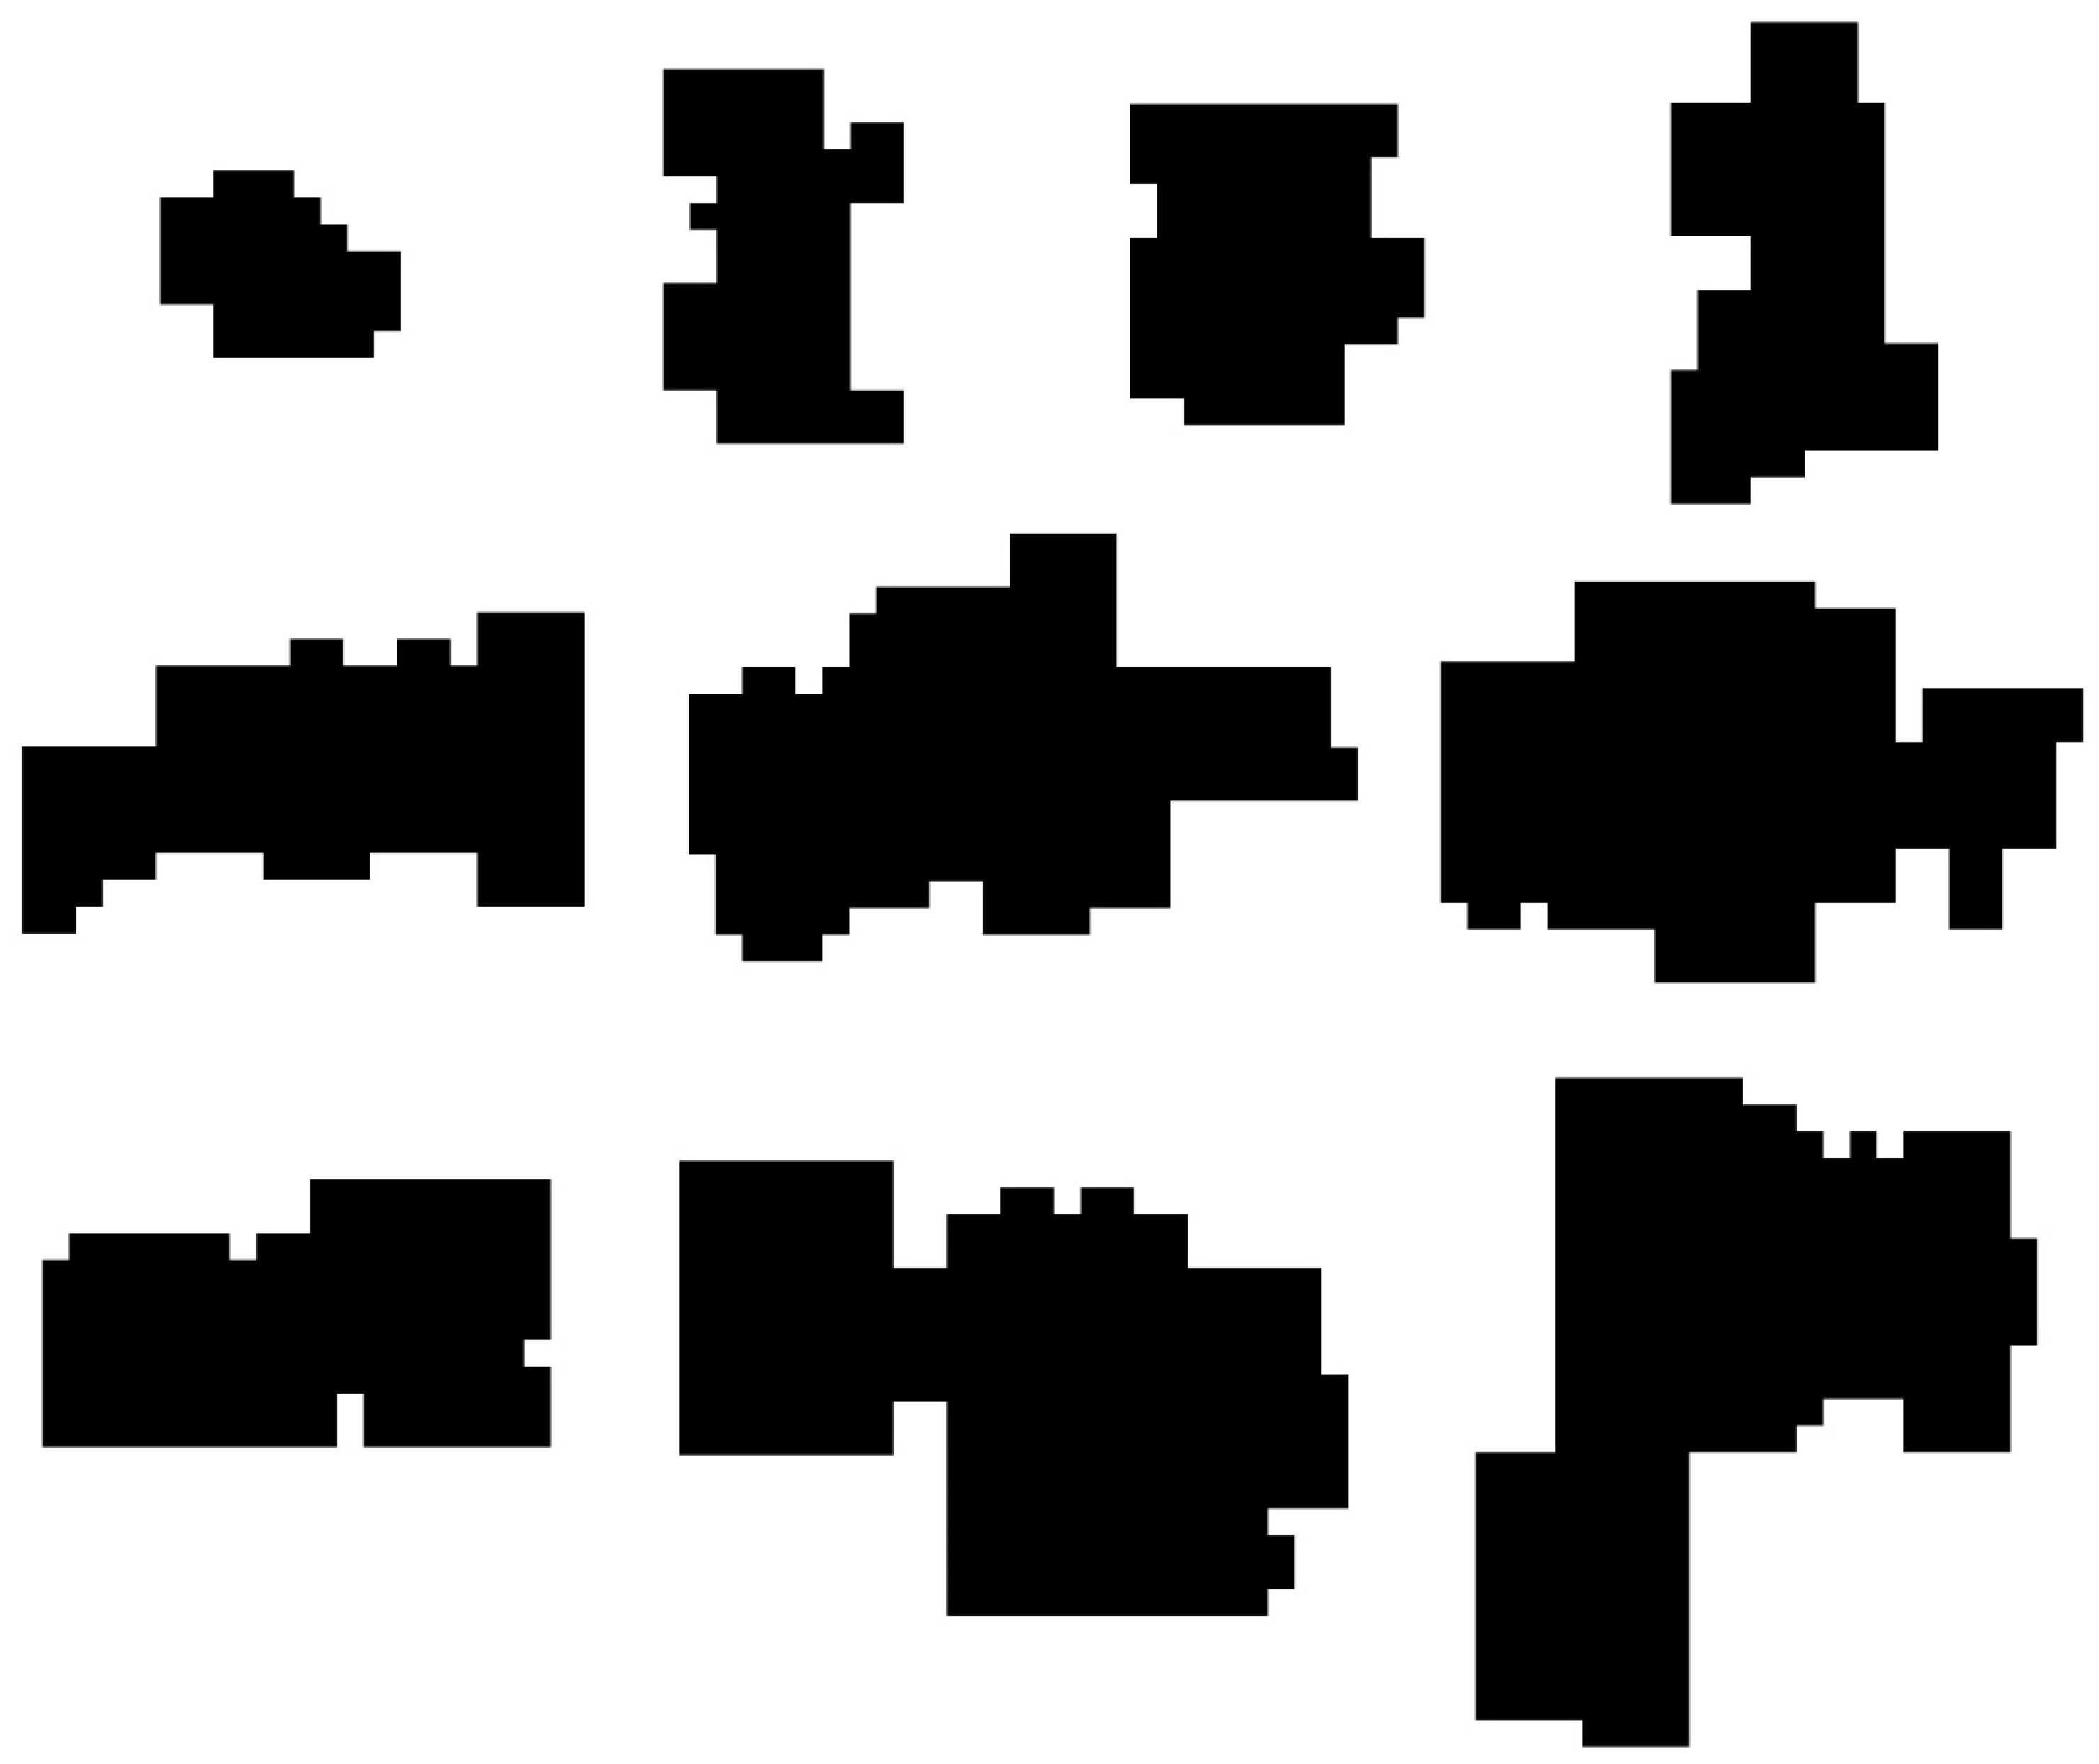
Finally, the Internet databases were searched for the real buildings that have complex border shapes in order to make the comparison with the described algorithm. In this process floor plans of buildings with a simple form that can easily be found in different databases were eliminated. The focus was on the buildings in the area range similar to our research results from better comparison. In
Figure 13 examples of real building floor plans are shown. The range of an area is from 50 to 350 square meters. The maximum value is 34 and the average value is 24.73.
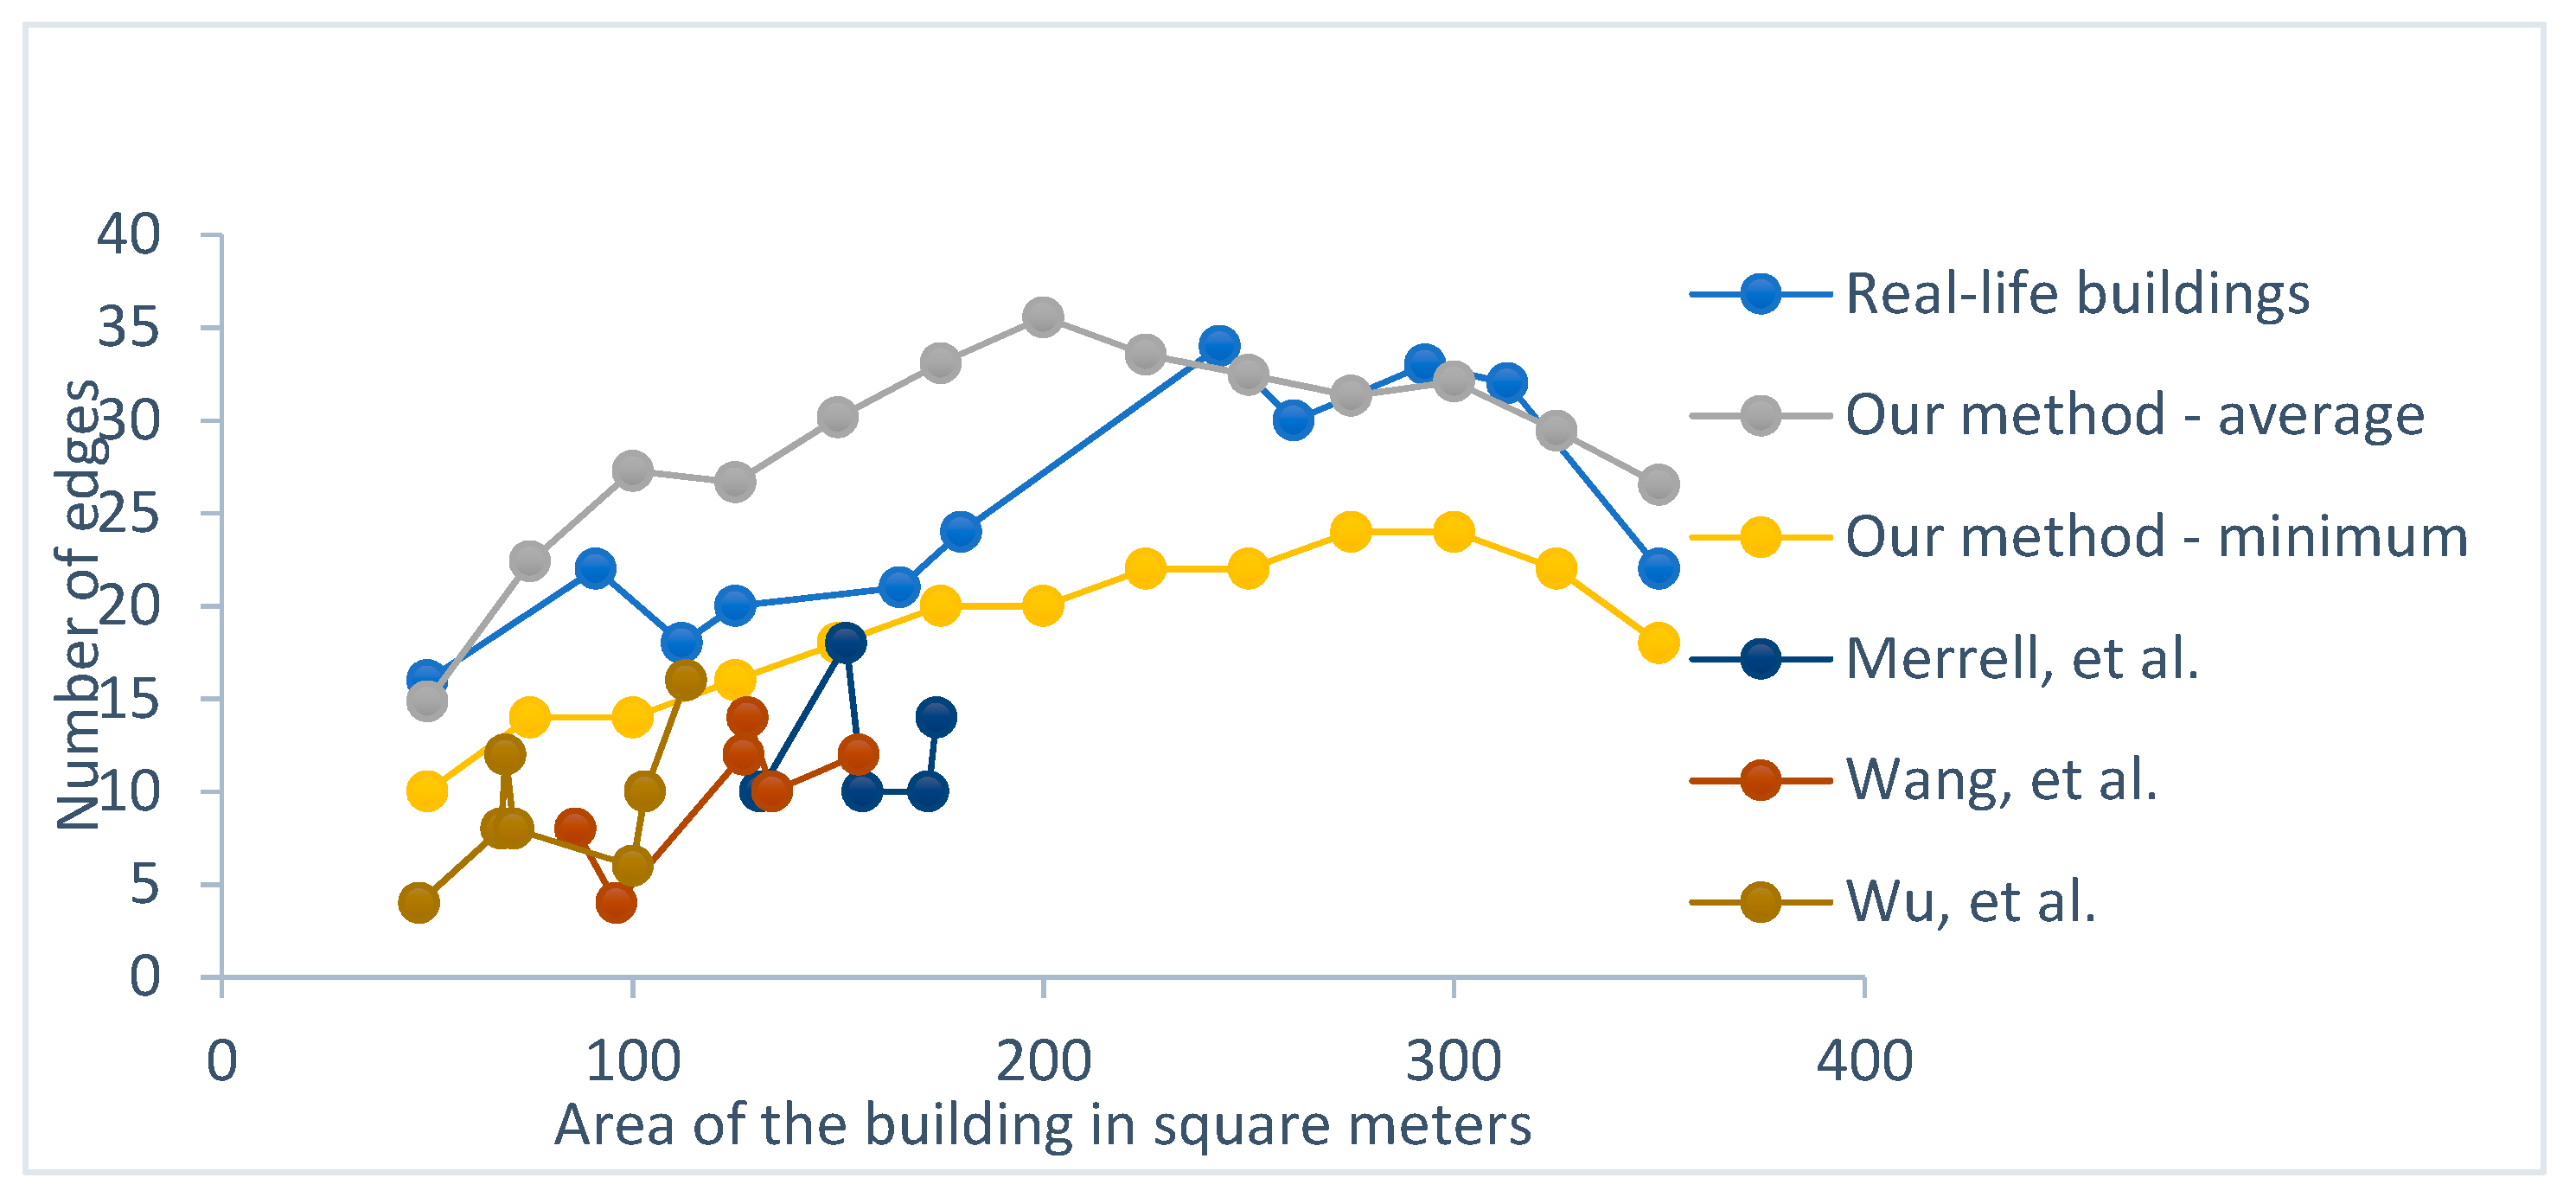
All the results are compared and presented in
Figure 14. Differences in the results of different method applications can be observed based on the parameter of the number of edge counts. The overall average of edges per building is 24.73 for selected real buildings, 28.88 for the method described in the paper, and 10.33 for other methods.
6. Discussion
The problem of building boundary generation is widely addressed in contemporary research and publications. In the referenced publications discussed methodologies, methods, algorithms, and more or less automated frameworks and software tools tend to cluster into coherent groups that use the related principles but with different impacts on the abstraction level and generality of proposed solutions.
One cluster is mainly oriented to simple regular building boundaries development that solely serves as the container of internal. They are usually constrained by the internal functionality disposition. For this group, the main focus appears to be the building floor plan layout or the architectural style they analyzed observed is not contemporary or visually challenging by the form. A few of those researches argue the possibility of combining simple building boundary shapes to get more complex variations or offer low-resolution results, but most of them are significantly limited in the number of variations achieved in a specific time frame. The external constraints are more or less ignored and do not represent a driving force of the automatic building boundary generation process.
The other cluster, with a significantly lower number of research works, focuses on relatively complex building boundaries generation that makes them suitable for cross-reference performance comparison with the approach described in this article. The results of three research works from this group are compared with regard to the presented novel approach. They were selected because their algorithms produced results that are more complex compared to others, listed in
Section 2 making them an ideal validation benchmark.
The smallest research cluster uses external boundary constraints as the driving force of building boundaries generation but different methods used (knowledge-based system) were the main obstacle in strict comparisons.
There were no research works seriously focusing on the methodology, methods, and algorithms that support the production of complex boundary shapes in large quantities within a reasonable time frame.
The results of the research methods of the papers used as benchmarks for validation [
10,
13,
19] are derived from a maximum of a 174 square meter building area. The results for larger buildings could not be obtained from the current examples. The algorithm presented in this paper produces results for buildings up to 350 square meters. The possibility of other methodologies generating similar results is currently highly unlikely but may be possible in further development.
The main obstacle of the methodology presented in research papers [
10,
13,
19] was the heavy internal functionality interrelations and dependencies that are computationally demanding. That is why the inherent limitation of variations is understandable.
The goal of this paper is to create the building boundaries in the form of constraints influenced by outer forces but not to completely exclude the premises of interior functionality either. There are research works [
9,
18] that can produce building layouts if the border constraint of the building is provided. The expanded version of the methodology applying grid systems, used in this paper, is also planned to be upgraded for the internal layout generation in the future.
Figure 11 summarizes the advantages and disadvantages of the benchmark set with regard to the proposed method and algorithm. Almost all of the compared research methods produce results that are below the minimum value of the algorithm presented in this paper. The results clearly show that the novel method, proposed by this paper, fills in the current research gap in the referenced scientific field. The area of interest is a specific type of building boundary generator with a capacity for creating numerous design variations. The uses for these results are numerous in the specific fields of architecture, gaming, generative design, etc.
For example, the most common of the real-life complex building boundary has borders with the number of edges that are mostly between the minimal and average results of our algorithm. The analyzed buildings are not average but rather common examples of the real-life set mainly because the basic rectangular and simple shape boundaries are more commonly seen than the complex ones. Although not such common, buildings with complex boundary shapes are the mainstream of the presented approach.
The internal function-based approach usually results in basic and simple shapes of boundary layers. On the contrary, contemporary architecture is sometimes strongly influenced by outer factors like adapting to the force of the wind or the increase of daylight insulation or even dominant visual message making the building a recognizable environmental marker.
Concerning system sciences, the general specification of any system includes functional and non-functional requirements, where the latter addresses the constraints under which the former have to be applied. The implementation of non-functional requirements is generally much more demanding. The trend of automatic generation of residential buildings applies not just in the field of architecture, but also in the media and video game industries where flexible rule-based rapid model generation is essential. The is that the functionality is not a key component in the digital and video game industry residential building simulations. The emphasis is on the recognizable visual style and game narrative. The form of the building acts as a container for the interior space but it is not solely defined or influenced by it.
This was the main reason to ignore the interior functionality in the proposed approach in order to enable the rapid generation of building boundary variations into which the interior functionality may be included afterward.
7. Conclusions
The automatic generation of complex building boundaries, in contemporary research and engineering projects and practices, is heavily processing and data volume bounded. Even with the available processing power and storage capacity of commercial computer systems nowadays the interactive and reactive design is rather limited. The main challenge is the rapid generation of a large number of complex building boundaries in a reasonable time frame.
The other dominant obstacle is that the majority of methods rely on the interior functional constraints as a driving force dominantly resulting in a low level of variability and simple rectangular geometry of generated building boundaries.
As a basis for the automated generation of various building boundaries, the solution presented in this paper introduces a novel approach that ignores the internal (functional) and focuses only on the external (non-functional) impacts. The primary orientation on external impacts may be, at any instance, extended by suitable complementary traditional methodology. The applied research methodology and presented method rely on a developed extendible rule-based system that simplifies building boundaries creation by recursive application of formulated spatial grid generation algorithm. Based on starting parameter values (mainly the lot and building area spaces) the algorithm tends to create a set of grids that satisfy initial constraints by marking the individual grid cells as part of the building or empty.
The presented conceptual framework model served as a foundation for creating a prototype software application that supports the experimental generation of grid arrays that are transformed into readable images of residential building boundaries. For the initial validation of the developed methodology, method, and algorithm, the concrete parametric resolution is set to 1 m.
The comparative analysis has shown that the presented approach overcomes some of the limitations of previous related research that generate building boundaries in simple rectangular form or with limited variability. The proposed method, in its current stage, outperforms discussed existing methods concerning complex building boundary shape generation.


