Article

Space-Time Effect Prediction of Blasting Vibration Based on Intelligent Automatic Blasting Vibration Monitoring System

1
Power China Road Bridge Group Co., Ltd., Beijing 100000, China
2
College of Engineering, Ocean University of China, Qingdao 266100, China
3
School of Civil Engineering, Tongji University, Shanghai 200433, China
4
School of Humanities, Shanghai University of Finance and Economics, Shanghai 200433, China
5
SGIDI Engineering Consulting (Group) Co., Ltd., Shanghai 200433, China
6
College of Marine Geosciences, Ocean University of China, Qingdao 266100, China
7
School of Civil Engineering, Qingdao University of Technology, Qingdao 266100, China
*
Author to whom correspondence should be addressed.
Appl. Sci. 2022, 12(1), 12; https://doi.org/10.3390/app12010012
Submission received: 10 October 2021 / Revised: 30 November 2021 / Accepted: 14 December 2021 / Published: 21 December 2021

Abstract

:
The vibration produced by blasting excavation in urban underground engineering has a significant influence on the surrounding environment, and the strength of vibration intensity involves many influencing factors. In order to predict the space-time effects of blasting vibration more accurately, an automatic intelligent monitoring system is constructed based on the rough set fuzzy neural network blasting vibration characteristic parameter prediction model and the network blasting vibrator (TC-6850). By setting up the regional monitoring network of monitoring points, the obtained monitoring data are analyzed. An artificial intelligence model is used to predict the influence of stratum condition, excavation hole, and high-rise building on blasting vibration velocity and frequency propagation. The results show that the artificial intelligence prediction model based on a rough set fuzzy neural network can accurately reflect the formation attenuation effect, hollow effect, and building amplification effect of blasting vibration by effectively fuzzing and standardizing the influencing factors. The propagation of blasting vibration in a soil–rock composite stratum is closely related to the surrounding rock conditions with a noticeable elastic modulus effect. The hollow effect is regional, which has a significant influence on the surrounding ground and buildings. Besides, the blasting vibration of the excavated area is stronger than that of the unexcavated area. The propagation of blasting vibration on high-rise buildings was complicated, of which the peak vibration velocity is maximum at the lower level of the building and decreased with the rise of the floor gradually. The whip sheath effect appears at the top floor, which is related to the blasting vibration frequency and the building’s natural vibration frequency.

1. Introduction and Related Works

With the acceleration of urbanization, drilling and blasting methods have been widely used in tunnel excavation in hard rock areas due to its high economic and construction efficiency [1]. However, the energy waves, noise, flying stones, and vibration generated by the drilling and blasting seriously affect the lives of residents and the surrounding environment [2], especially in large and medium-sized cities with dense populations and rapid economic development [3]. Damage to existing pipelines, structures, and buildings caused by blasting vibration seriously threatens the safety of society. The environmental impact of blasting vibration is the focus of much research [4,5]. Numerical simulation and theoretical analysis are commonly used to study the attenuation law of certain blasting vibration [6,7]. However, they cannot accurately reflect the actual situation of blasting vibration due to the complex and changeable influence factors of blasting vibration, so on-site monitoring is the primary method to directly feedback the environmental impact of blasting vibration [8].
With the development of computer microprocessing technology and digital recording technology, the digital vibration measurement system has been widely used because of its advantages of portability, flexibility, simple operation, and high precision of test data [9]. The digital monitoring system generally obtains data outdoors, and automatically stores the data in the recorder, and then goes back indoors to the computer for analysis and processing [10]. Some of the instruments can even be read directly in the field and monitor for 24 h. Test results can also be transmitted wirelessly to the monitoring personnel, which improves work efficiency and feedback speed [11,12]. With the rapid development of blasting monitoring technology, blasting vibration recording instruments are also being updated. The blasting vibration recorder has experienced the first generation, the second generation, the third generation, and now the blasting vibration recorder with the function of the Internet of things. The data obtained on site can be sent to the Internet wirelessly and in real-time, and users can easily obtain blasting information by logging in the relevant network address. The traditional vibration measuring instruments, such as TC-4850 and TC-4850N, are used in Qingdao metro construction, but fail because the management mode of the traditional blasting vibration monitoring instruments needs a lot of effort and equipment investment [13]. Zhongke Measurement and Control developed a TC-6850 network blasting vibration instrument to realize the functions of real-time transmission, high integration, and free networking, which adopts the most advanced intelligent sensors and has the advantages of small size and easy installation [14]. At present, the application of the TC-6850 network blasting vibrometer is relatively limited. It only monitors the key buildings within the influence range of blasting face and does not make full use of the network function of dynamometer. However, the impact of blasting vibration on the environment is regional and spatial, and it is inevitable that it will ignore some critical issues and cause irreparable losses when monitoring only essential buildings. Amnieh, Shen, Xu, and Mohamed et al. used neural network to predict the peak vibration of blasting vibration, and the results showed that the peak vibration velocity of blasting vibration predicted by neural network method was closer to the measured value than that predicted by traditional regression method, indicating the superiority of neural network method in blasting vibration intensity prediction [15,16,17].
In this paper, a digital and information-based automatic monitoring system for blasting vibration is developed, and a blasting environmental impact prediction model is constructed. Through data collection, analysis, and prediction, the space-time effect of blasting vibration is studied. The system can provide reference for subway blasting construction and help further standardize the safety construction of construction projects so as to carry out blasting management more efficiently and intelligently, and strictly control the impact of blasting vibration.

2. Construction of Intelligent Automatic Blasting Vibration Monitoring System

2.1. Configuration of the Data Acquisition Device

To realize the timely and effective collection of massive blasting vibration data, the new generation of network vibration meter TC-6850 developed by CST is selected, as shown in Figure 1. TC-6850 uses the most advanced intelligent sensors. The sensor and the main engine are integrated to make the whole volume small. Besides, it has a built-in WIFI/4G/3G communication module, forming a LAN for wireless control of multiple instruments on site.
The TC-6850 is powered by solar energy or directly from the nearby port. In the case of no vibration, the instrument is in the standby state. Moreover, when the vibration exceeds the trigger value, the data will be automatically recorded and transmitted. The automatic feature of TC-6850 realizes unattended blasting vibration data acquisition. Table 1 describes the parameters of the TC-6850.

2.2. Neural Network Model Based on the Fuzzy-Rough Set

The neural network based on fuzzy-rough set uses the ability of rough set to find rules from a large amount of data, determine the initial topology structure of FNN, reduce the scale of the network, and improve the training speed of the network, whose effectiveness has been verified in various fields [18,19].
The topology of the fuzzy neural network can be divided into five layers. The first layer is the input layer, and the input vector is the precise numerical vector or fuzzy quantity. The second layer is the fuzzy layer, which uses Gaussian Function as the membership function. The j node related to xi can be expressed as
μ i j x i = exp x i m i j 2 / σ i j 2
The third layer is the normalized layer. Assuming that xi has ni term vertices used for fuzzy division, the normalized output of μij(xi) can be expressed as μij(xi)
μ i j x i = μ i j x i / k = 1 n i μ i j x i
The fourth layer is the regularization layer, which connects normalized nodes with output nodes. Each rule node is connected to only one normalized node. The output of the j rule node can be expressed as
z j = i = 1 n μ i j x i
The fifth layer is the defuzzification layer, which realizes the central average anti-fuzzification operation of rule nodes to obtain the numerical output:
y = j = 1 m G j i = 1 n μ i j x i
In this paper, the blasting parameters, construction parameters, and site parameters were reduced and fuzzy. A rough set fuzzy neural network model for blasting parameters prediction is constructed through the practice of a large number of data to realize the prediction of blasting parameters.
In this paper, to test the time-space effect of blasting vibration propagation, the blasting vibration data of R-Station, Y-Station, and H-Station of an individual line of Qingdao metro were collected. R-Station is an underground station with multiple high-rise buildings on both sides. Data collection points are located on the ground floor of the building on the 2nd, 6th, 12th, and 20th floors. The inclined well of Y-Station is adjacent to a foundation pit; the closest distance is 15 m. The foundation pit is 25 m deep, and three lithologies are exposed. From top to bottom, lithologies are, respectively, mixed fill, highly weathered granite, and moderately weathered granite. The data collection point is installed on the surrounding structure of the near tunnel side 2 m, 10 m, and 20 m deep. The underground air shaft of H-Station is inclined to the highway of the city, and many pipelines are distributed on the highway’s both sides. Data collection points are arranged on both sides of the highway with an arrangement distance of 20 m. Two data collection points are arranged on both sides of the tunnel’s central axis.
We selected an appropriate installation position to fix the monitoring instrument at the blasting site, and then left the site after turning on the power supply. If the installation position is indoors, we use an indoor AC power supply. If the installation position is outdoors, we use solar panels and batteries to supply power. The remote computer in the background control is used to set the relevant parameters and start the acquisition mode, and then the instrument is put into the working state. When the blasting vibration signal is transmitted, the dynamic waveform is transformed into digital signal and transmitted to the server. The users can transmit data to local display, conduct operation analysis and blasting vibration data processing through terminal software, and monitor the working state of the system in real-time.
Based on the construction situation of each site, the formation attenuation effect [20], hollow effect [21], and high-rise building amplification effect of blasting vibration propagation law were under consideration [22]. The maximum quantities for the detonating period, total quantity for detonating period, horizontal distance, vertical distance, the shortest distance from packet to the free surface, differential time, the integrity of excavated and unexcavated layer, transmission medium, and types of explosive were selected as the condition attributes (a–i). Peak velocity of vibration was in X direction, peak velocity of vibration was in Y direction, peak velocity of vibration was in Z direction and master frequency were taken as decision properties (X, Y, Z, F).
The Slowinski (S method) method is relatively simple and can be divided into non-overlapping intervals according to the distribution characteristics of data, which has a small amount of calculation and reduces the calculation workload. One-hundred groups of measured data were selected and discretized to make a reduction according to the rules in Table 2 [23,24], with the Slowinski method (S method).
According to the rough set theory, the sensitivity or dependence of the decision on the conditional attribute and the blasting vibration parameters’ sensitivity to the blasting conditions can be reflected with the discordant rate. The dissonance rate of the conditional attribute Ci can be expressed as
N C i = U H C C i / W
where C is the conditional attribute: C = {C1, C2, , Cn}; W is the field: W = {A1, A2 …, Ak}; AiW, I = 1, 2, …, k. C−{Ci} is to remove attribute Ci from conditional attribute; UH|C−{Ci}| is the uncoordinated cardinality; and |W| is the base.
With Equation (4), the blasting vibration data of R station, Y station, and H station of an individual line of Qingdao metro are selected to calculate each factor’s discordance rate, as shown in Table 3.
It can be seen from Table 3 that the coordination between decision conditions and attribute conditions is different under different sites, which means that blasting vibration parameters have different sensitivities to various control factors. As for the vibration velocity of peak particle, the uncoordinated rate of each influencing factor is c > a > d > b = e = g = i > f = h. It can be concluded that the horizontal straight-line distance between the explosion source and the monitoring point has the greatest influence on it. The secondary influencing factors are section charge, total charge, and elevation difference. The size of the resistance line has relatively little influence on the rock integrity coefficient, while the time of slight difference of blasting and the medium condition of propagation site have the least influence.
For the dominant frequency of blasting vibration, the uncoordinated rate of all factors is c > d = i > a = g > e > b = f = h. It can be concluded that the horizontal straight-line distance between the explosion source and the monitoring point has the greatest influence on it; the secondary influencing factors are elevation difference and explosive type, the segment charge and rock integrity coefficient have relatively little influence; while the total charge, the time of slight difference of blasting, and the medium condition of the propagation site have the least influence on it.
For the duration of blasting vibration frequency, the uncoordinated rate of size is in the following order: b > a > d = g > c > e = f = h = i. It can be concluded that the total charge of blasting construction has the greatest influence on it, the secondary influencing factors are elevation difference and section charge, the horizontal straight distance and rock integrity coefficient have relatively little influence, while the size of resistance line, blasting time and medium condition of the propagation site have the least influence.
Therefore, among all the conditional attributes, the micro-difference time and propagation medium have the least influence on the three decision attributes of blasting vibration, so it is not considered in the parameter prediction of blasting vibration.
To achieve the optimal prediction model establishment, three artificial neural network models were respectively constructed according to the site conditions. The topological structures of Model-Stratum, Model- Hollow, and Model- Building are shown in Figure 2.
Among all the input parameters, the integrity of excavated and unexcavated rock, the relative position of the measuring point, and the excavated space and the relative height of the floor are fuzzy, which means, the data category needs to be fuzzy.
(1)
The fuzzification of excavated and unexcavated rock’s integrity
This paper uses the integrity coefficient Kv to quantify the integrity of rock mass, which can effectively reflect the development degree of rock mass structure.
K v = V p m / V p r 2
where Vpr is the compressional wave velocity of rock acoustic waves and Vpm is the compressional wave velocity of rock mass acoustic waves.
This paper describes the surrounding rock integrity x1 as three fuzzy nodes, which are fewer fractures, ordinary fractures, and fragmentation. Furthermore, based on the three nodes, the membership functions of rock integrity x1 after fuzzification were established.
μ l x 1 = 1 x 1 = 0 0.55 x 1 / 0.55 0 < x 1 < 0.55 0 x 1 0.55
μ o x 1 = 0 0.75 x 1 / 0.2 x 1 0.35 / 0.2 0 x 1 0.75 0.55 x 1 < 0.75 0.35 x 1 < 0.55 x 1 < 0.35
μ f x 1 = 1 x 1 = 1 0.55 x 1 / 0.45 0.55 < x 1 < 1 0 x 1 0.55
(2)
The fuzzification of the relative position between the measuring point and the face
Regarding the center point of the excavated surface as the coordinate origin, the polar axis is established in the direction of the tunnel face. The relative position x2 between the tunnel face and the measuring point can be represented by the angle value of the measuring point and the palm surface. The relative position between the measuring point and the palm surface can be described as the front area of the tunnel face and back area of the tunnel face. The membership function of the relative position of the palm surface and measuring point can be established.
μ f x 2 = 0 x 2 = 0 ° 1 0 ° < x 2 < 180 ° 0 180 ° x 2 360 °
μ b x 2 = 1 x 2 = 0 ° 0 0 ° < x 2 < 180 ° 1 180 ° x 2 360 °
(3)
The fuzzification of the relative height of building floors
The relative ratio of high-rise buildings floors (greater than 15 floors) is introduced as the number of references to evaluate the relative height of floors to represent the relative position of n-story buildings.
x 3 = n / n t o t a l
where n is the floor where the measurement point is located and ntotal is the number of floors of the building.
The factor can be expressed in the fuzzy language of the bottom layer, middle layer, and high layer, and the membership function is established as follows:
μ L x 3 = 1 x 3 = 0 0.3 x 3 / 0.3 0 < x 3 0.3 0 0.3 < x 3
μ o x 3 = 0 0.8 x 3 / 0.8 x 3 0.3 / 0.3 0 x 3 > 0.8 0.5 x 3 < 0.8 0.3 < x 3 < 0.5 x 3 0.3
μ f x 3 = 1 x 3 = 1 1 x 3 / 1 0.8 < x 3 < 1 0 x 3 0.8
To test the accuracy of the new rough set fuzzy neural network, a network for neural network training is created with 100 sets of data selected in each site. The training times were set at 1000 times, the training target was 0.005, and the learning rate was 0.1. After the training, another 50 sets of new data in each site were selected to predict the characteristic amount of blasting. Figure 3 shows the calculating results and the measured data. After the training, 50 sets of new data were selected from each site to predict the characteristic amount of blasting, and the results were compared with the measured data, as shown in Figure 3.
It can be seen from Figure 3 that the relative errors of the established models are all below 50%, where the Peak Velocity-X/Y has a relatively large error of over 30% on average, and the error fluctuates greatly. The relative error between the Peak Velocity-Z and the Master Frequency is relatively small, ~20% on average, and the error fluctuation is relatively slow, indicating that the established model has a good prediction of the Peak Velocity-Z and the Master Frequency, and a relatively poor prediction of the Peak Velocity-X/Y. Therefore, the Peak Velocity-Z and the Master Frequency measurement and prediction were emphasized in this paper.

2.3. Development of Intelligent Data Analysis and Prediction Software

The intelligent data analysis and prediction software were written in C++ based on the application of TC-6850, including wireless data receiving interface (provided by CST), data FFT analysis MATLAB interface, data HHT analysis MATLAB interface, rough set fuzzy neural network model MATLAB interface, and parameter writing interface. When the blasting vibration data are received with the TC-6850, the data will be uploaded to the designated database of the cloud server through 4G or WIFI signals, and the software will be called. On the one hand, the software automatically performs time-frequency processing on the received data and obtains the spectrum data, HHT spectrum data and instantaneous energy data, which are stored in the database. On the other hand, the software automatically calls the corresponding rough set fuzzy neural network model for data training according to the location of the data site and stores the training data in the server. When users open the software, the service data will be automatically uploaded to the client. When making data prediction, the tester shall input the parameters into the software in advance. After the software receives the input data, the corresponding rough set fuzzy neural network model will be called according to the users’ setting to predict the specified blasting vibration characteristic value automatically. The predicted data can be displayed on the first page and alerted according to the set threshold. With the software and hardware, the intelligent automatic blasting vibration monitoring system is built (see Figure 4).

2.4. The Effectiveness of the Intelligent Automatic Blasting Vibration Monitoring System

The R station was selected to test the effectiveness of the intelligent automatic blasting vibration monitoring system; the purpose was to test the validity of data collection of TC-6850 and the operability of the system software.
The TC-6850 and the traditional TC-4850 developed in this paper were placed at the same location on the ground near the blasting site, and both were fixed to the ground and buildings near the blasting site utilizing plaster cement, as shown in Figure 5. The blasting vibration data of two sensors were collected to analyze the sensitivity difference between the two sensors, as shown in Figure 6.
It is schematically shown in Figure 6 that the difference between the blasting vibration speeds measured on the ground near the blasting point is not evident (see Figure 6a). The blasting vibration data collected by TC-4850 are slightly larger than that collected by TC-6850 on buildings. The overall data are not much different, with a maximum difference of 0.21 cm/s, mainly because TC-4850 is closer to the blasting points. However, during the monitoring process, the TC-4850 sensor has untriggered points, the rate of which reaches 46% (see Figure 6b). The TC-6850 monitoring can usually trigger, indicating that its use is relatively stable. The comparison of TC-6850 network vibration meter and the traditional TC-4850 blasting vibration meter are shown in Table 4.
In the test, the software ran well and could effectively collect, analyze, and predict data (see Figure 7). The accuracy of mid-range prediction decreases with the increase of data acquisition, indicating that the system can be used effectively in both hardware and software.

3. Results and Discussions

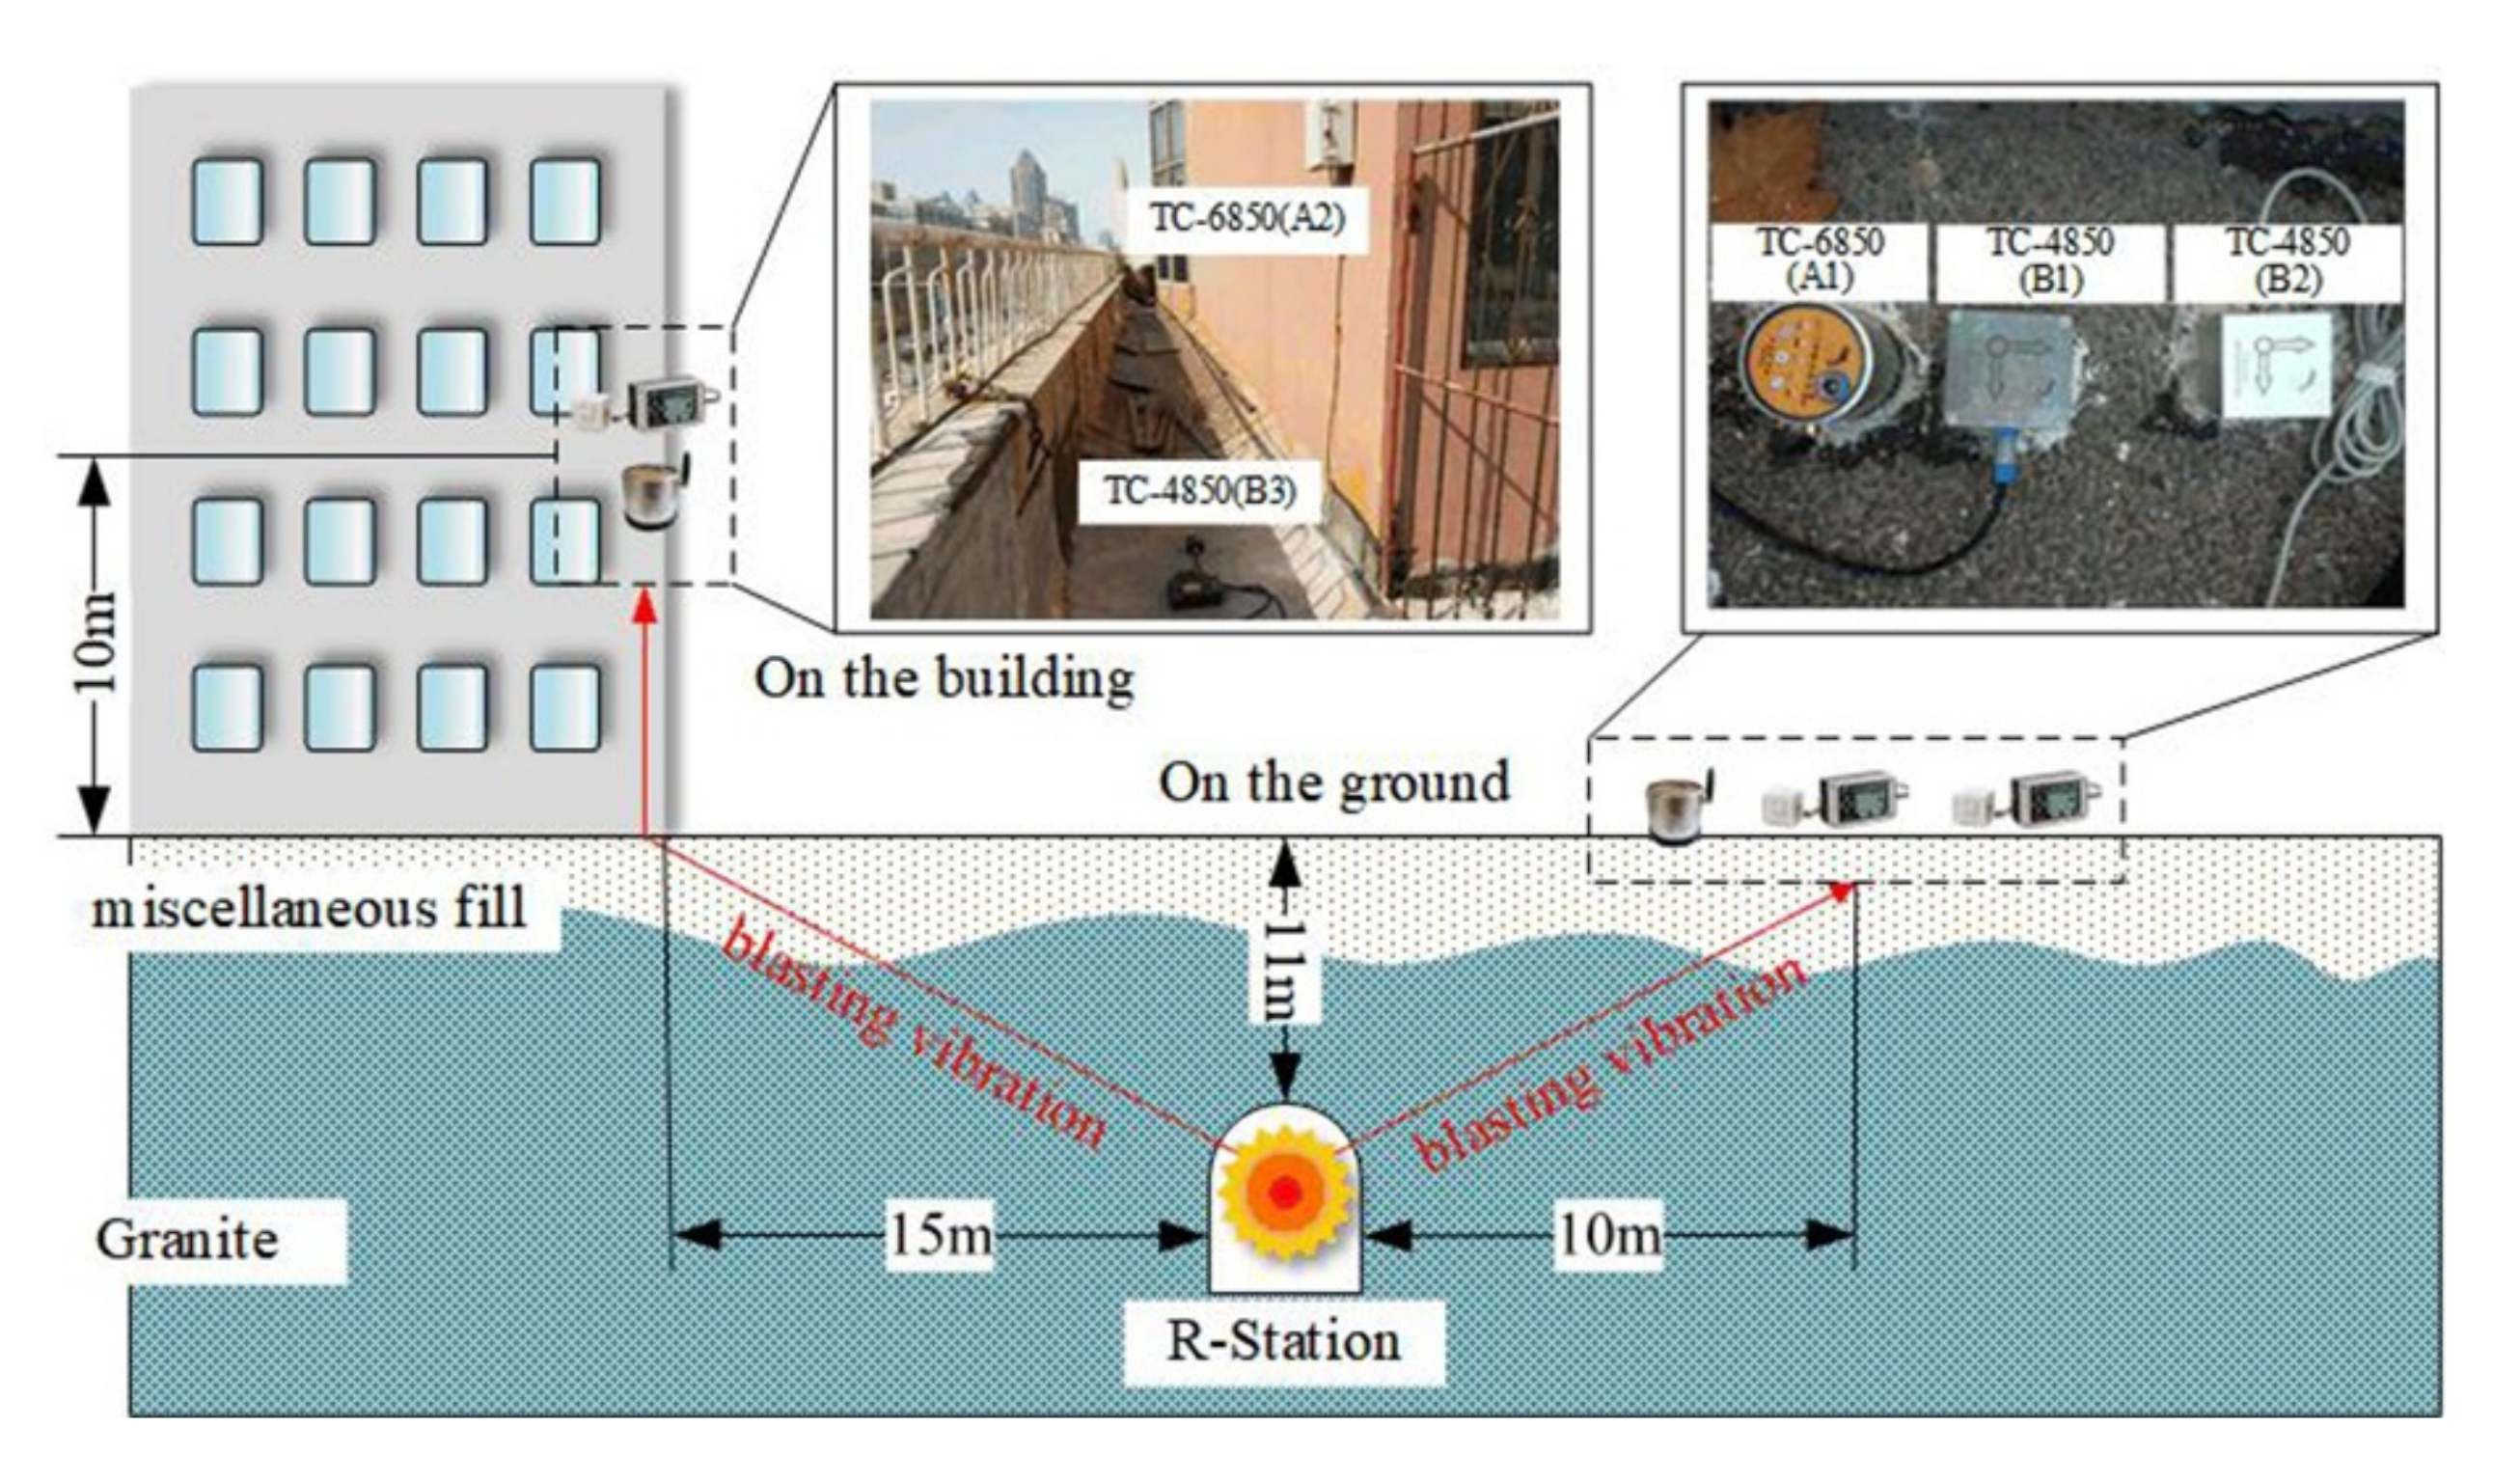
3.1. Arrangement of Data Acquisition Device

The geological type of Qingdao is a typical “upper-soft-low-hard” soil–rock composite stratum, where the tectonic layer of the subway is mainly granite and the rock is relatively hard [25,26], meaning that most sections and stations need the blasting method.
In this paper, data collection points were set up at Y-Station, R-Station, J-station, T-Station, C-Station, N-station, and H-station. Moreover, the seven sites are divided into three categories: the foundation pit area near the tunnel, the high-rise building area, and the ground near the blasting vibration. As shown in Figure 8, three area sensors are installed in three areas within the blasting influence area, and the propagation law of blasting vibration in different area spaces under the same blasting conditions is studied. A suitable installation location is chosen to fix the monitoring instrument at the blasting site.
The specific layout of the sensor is as follows:
  • Step 1. Adjacent to the area of the foundation pit, the upper part is a mixed soil layer, the middle section is a soft rock formation, and the lower part is a hard rock formation. Sensors are placed on the surrounding rock in the foundation pit near the blasting point. A sensor is set every 5 m on the surrounding rock wall.
  • Step 2. The ground near the palm surface is blasted, and four sensors are arranged on the ground in front of and behind the blasting palm with the same distance between each sensor.
  • Step 3. High-rise building area, from −2 to 20 floors, each floor is equipped with a sensor, each measuring point is placed on the load-bearing wall of the room, each floor is set at the same location, and each sensor is kept on the same straight line.

3.2. Analysis of Monitoring Results of Near Foundation Pit

During the tunneling process, the drilling and blasting method will inevitably affect the surrounding structure. The blasting vibration wave contacts the surrounding rock first, making that different surrounding rock conditions have different propagation and attenuation laws of the blasting vibration. The line tunnel’s influence on the excavation distance from the adjacent foundation pit and the propagation law of blasting vibration along different surrounding rock conditions were studied. Table 5 shows the surrounding rock conditions of the J-Station line near the foundation pit.
The sensors are sequentially arranged in different lithologies, and the blasting monitoring is performed five times. The monitoring experiment whose test number is from T1 to T5 is carried out to study the difference in blasting vibration speed of different lithologies. As illustrated in Figure 9, different types of surrounding rocks have different responses to blasting vibrations. From J1 to J6, the surrounding stones’ nature ranges from soil to slightly weathered granite. The lithology transitions from weak stratum to hard rock. The blasting vibration speed gradually decreases from the hard rock area to the soil layer. At the interface between the soft rock and the hard rock, the blasting vibration speed decreases slowly but decreases sharply at other strata. The amplitude is not much different. It is shown that the blasting vibration attenuation law is different under different lithological conditions, especially at the boundary between soft and hard rocks. Blasting vibration speed changes significantly, mainly because that the blasting vibration wave attenuates quickly in the hard rock area. In contrast, the rock area’s attenuation speed becomes slower, causing the blasting vibration speed in soft rock to decrease rapidly. However, the elastic modulus and the blasting vibration speed gradually decreases from the hard rock to the soft rock, indicating that the rock vibration speed affected by the blasting vibration is proportional to the elastic modulus of rock.
The prediction of Peak Velocity-Z is consistent with the variation trend of measured data, with an overall error of ~20%. Model-Stratum can effectively reflect the mutation of real data in the transition section of hard and soft rock, indicating that the established model and its monitoring system can effectively predict the vibration propagation law.

3.3. Analysis of Monitoring Results of the Hollow Effect

The tunneling blasting hollow effect refers to the phenomenon that the cavity formed in the excavated area causes the blasting vibration velocity above the ground surface to be higher than the vibration velocity of the surface above the unexcavated region. This phenomenon of blasting vibration propagation increases the impact of blasting vibration on the ground. The paper uses the intelligent automatic blasting vibration monitoring system for blasting vibration to study the hollow effect on the environment caused by tunneling.
The N5 above the metacarpal surface was selected as the central point, and four measuring lines were set radially (eight points in every line, total 33 monitoring points), with the 45° between each measuring line, as shown in Figure 10. The line of the tunnel axis is the focus of the tests, the location of monitoring points (N14–N17) is above the tunnel, and there is a facing surface, while the location of monitoring points (N10–N13) is a solid rock body with no facing surface. Figure 11a shows that the peak blast velocity on the excavated area’s surface is significantly higher than that of the unexcavated area. Therefore, the control of the blasting vibration effect should depend on the excavated area and the vibration monitoring in the upper part of the excavation area should be successful.
Monitoring points are densely arranged on the surface near the blasting source to study the propagation law of blasting vibration by the hollow effect. The regional propagation characteristics of blasting vibration on the surface are studied with averaging multiple experiments. As illustrated in Figure 11b, the closer the blasting vibration frequency is to the palm face, the greater the frequency, the higher the density of the contours, and the faster the frequency decays, while the farther away from the source of the blasting, the sparser the shapes and the lower the frequency of the blasting vibration. The contours in the excavated area of the tunnel are depressed toward the source of the blast, indicating that the frequency in the tunnel part is relatively large. Therefore, the hollow effect affects the attenuation of the blasting vibration frequency, leading to an immense blasting vibration speed.
The predicted and measured values of Peak Velocity-Z and Master Frequency have the same spatial and temporal distribution characteristics, and the overall error is within 20%. Model-Hollow can effectively reflect the vibration and frequency characteristics of the measuring points in the excavation space, which indicates that the established model and its monitoring system can effectively predict the vibration propagation law.

3.4. Analysis of Monitoring Results of High-Rise Buildings

The building can be divided into the upper structure, the basic structure, and the rock or soil below the basic structure from top to bottom. The seismic wave generated by blasting is very complicated because different blasting parameters will affect blasting vibration. Therefore, this paper studies the attenuation law of blasting vibration on high-rise buildings at the same blasting conditions and structures.
A total of six blasting vibration monitoring instances were carried out for the same high-rise residential building. The position of the palm surface is far from the residential building. The palm surface of the T3 test is consistent with the blasting vibration monitoring closest to the building. When the blasting stress wave propagates through the rock and soil to the building, it will cause vibration [27,28]. A large amount of literature indicates that the blasting vibration speed plays an essential role in blasting earthquake damage to the building [29], and the effect is continuous. Therefore, the attenuation law of blasting vibration velocity on buildings has been studied [30]. As shown in Figure 12a, the variation trend of blasting peak vibration velocities monitored six times is consistent with the increase of layers. From −2 to 20 layers, the blasting vibration speed increases first, then decrease and finally appears, where the blasting vibration speed of the −2 to 3 layers changes significantly. The blasting vibration speed has two peaks, and the first peak is higher. However, different blasting vibration tests reach a peak at different floors. T2–T4 reach the peak value of blasting vibration speed on the first floor, while T1 and T5 are on the second floor, and T6 is on the third floor, indicating the most significant impact on the lower floors of the building (−2 to 3 floors) caused by blasting vibration, whose speed has remained stable in the middle and upper floors (4 to 17 floors). The blasting vibration velocity reaches the maximum at the −1 layer, because the −1 layer is relatively close to the blasting, and the blasting vibration is mainly propagated in the stratum. According to the rules in the figures, the center of the explosion can affect the position of the maximum vibration velocity of the blast on the floor. In a specific floor range, the farther the blasting distance is, the higher the floor where the maximum blasting vibration speed appears.
The blasting vibration damage to a building is closely related to the frequency of the seismic wave generated by the blasting. It is generally believed that the frequency of the blasting seismic wave determines its energy level. Therefore, it is usually believed that the structure of the building is likely to be damaged when subjected to high-frequency waves. It is proposed that the impact of blasting vibration on the building is related to the building’s natural frequency. Once the blasting vibration frequency is equal to or close to the building’s natural frequency, it is possible to cause resonance of the building, causing damage to the building. According to the attenuation law of the blasting vibration frequency, the blasting vibration frequency decreases rapidly with the increase of the distance. The low-frequency portion gradually decreases because the low-frequency portion is close to the natural frequency of the medium. Generally, the dynamic coefficient β value is used to represent the responsiveness of a building to blasting vibrations, which can be described as following [31,32].
β = 1 1 T 0 T + r 2 T 0 2 T 2
where r is the attenuation coefficient, which is generally higher than or equal to 0.2; T0 is the natural vibration period of the building; and T is the primary vibration period of the blasting vibration.
The natural frequency of different buildings may be slightly different. Therefore, it is difficult to measure the natural frequency of multi-story buildings. The natural vibration period of the building is calculated with an empirical formula [33]:
T = K × 0.04 N
where N is the number of floors, K is the foundation coefficient, and the rock foundation is 0.7.
Analysis of the floor and height of the newly built 20-story residential building with brick–concrete structure shows that its natural vibration coefficient period is 0.56 s, and its natural vibration frequency is ~1.79 Hz. In this paper, the blasting vibration frequency is monitored with the automatic monitoring system. As illustrated in Figure 12b, the blasting vibration frequency is gradually attenuated with the height of the floor, and the blasting vibration frequency is attenuated at different speeds with different blast center distances. However, the low-level zone (−2 to 3 layers) is a fast attenuation zone, whose attenuation speed is fast. The middle and upper layers (4 to 16 layers) are slow attenuation zones. The blasting vibration frequency of top layers (17 to 20 layers) has been attenuated to the lowest value, which has remained stable at ~10 Hz. During the T6 tests, the lowest value of the top layer’s blasting vibration frequency is ~8 Hz. By calculation, it is found that the dynamic coefficient β is ~1.3, indicating that the blasting vibration frequency of the top layer is close to the building’s natural frequency, which causes the building’s blasting vibration speed to increase, and the top-level amplification effect.
Through the prediction of the intelligent system, it is found that the predicted value of Peak Velocity−Z can reflect the high-level amplification effect to a certain extent, and the error value is controlled within 10%. The average relative error between blasting vibration velocity and measured value calculated by Satovsky equation is 26.47%, and the prediction error is large. It can be seen that the artificial neural network prediction model established by the automatic blasting monitoring system has a more reliable blasting vibration velocity prediction effect. In engineering applications, the blasting vibration velocity can be predicted more accurately in the future, so as to remind construction units to adjust parameters in time and avoid serious environmental damage.

4. Conclusions

In this paper, a rough set fuzzy neural network model is constructed to predict blasting vibration parameters. On this basis, an intelligent automatic monitoring system for blasting vibration is built, and the space-time effect of blasting vibration is studied.
The blasting peak vibration velocity was selected as the evaluation standard, and the Satovsky equation was used to construct the environmental impact prediction model, and the errors of the model were compared to optimize the prediction model.
For the blasting peak vibration velocity, the horizontal straight-line distance between the explosion source and the monitoring point has the greatest influence on it, and the secondary influencing factors are section charge, total charge, and elevation difference. The size of resistance line has little influence on the rock integrity coefficient, while the time of slight difference of blasting and the medium condition of propagation site have the least influence. For the dominant frequency of blasting vibration, the horizontal straight-line distance between the explosion source and the monitoring point has the greatest influence on it, and the secondary influencing factors are elevation difference and explosive type. The effect of section charge and rock integrity coefficient is relatively small, while the total charge, the time of slight difference of blasting and the medium condition of the propagation site have the least influence on it.
The rough set the parameters of the fuzzy neural network-based prediction model has better precision, need to input conditions for effective elaboration and classification, to reflect the special propagation characteristics of blasting vibration, in the single parameter prediction model between the predicted and the measured values is higher, fully satisfy the project need, thus establish forecasting warning system is feasible.
Through the field application of the newly developed automatic blasting monitoring system, it is found that the blasting vibration attenuation law is different under different lithology conditions, especially at the boundary of soft and hard rock, the blasting vibration velocity decreases slowly. The main reason why the blasting vibration velocity changes significantly is that the blasting vibration wave attenuates faster in the hard rock area. The attenuation velocity of rock area slows down, resulting in the rapid decrease of blasting vibration velocity in soft rock area. From hard rock to soft rock, the elastic modulus and blasting vibration velocity gradually decrease, indicating that the impact of blasting vibration on rock vibration velocity is proportional to the elastic modulus of rock. Due to the hollow effect of blasting vibration, the blasting effect on the excavated surface is more significant than that on the unexcavated surface. Vibration monitoring should be carried out on the upper part of excavation zone to control the influence of buildings and vibration effect.
The impact of blasting vibration on buildings on the surface is more complex, mainly showing that the blasting vibration velocity reaches the maximum when it is close to the lower level of the surface. Then it diminishes, with a slight amplification at the top. In a certain range, when the frequency of blasting vibration is close to that of the building, the top whip sheath effect will appear, and the hollow effect will also have a special effect on the attenuation of blasting vibration in the building.

Author Contributions

During the whole thesis writing process, F.C. did the conception and draft of the whole thesis. G.H. and S.D. (Shun Dong) mapped the whole paper, polished the language, and analyzed some data. S.Z., X.L., and B.Z. were responsible for hardware equipment procurement, software development and debugging, and feasibility study of software and Matlab. N.Q. is responsible for the installation and management of field instruments. L.S. and J.Z. are responsible for the revision and logical thinking adjustment of the first draft of the paper. S.D. (Shenggui Deng) funded the entire study. All authors have read and agreed to the published version of the manuscript.

Funding

This work is supported by the Fundamental Research Funds for the Central Universities (201962011); the Laboratory for Marine Geology, Qingdao National Laboratory for Marine Science and Technology (MGQNLM-KF201804); and the National Natural Science Foundation of China (No.41672272, 41702320). At the same time, we appreciate anonymous reviewers who gave comments to revise the paper.

Conflicts of Interest

The authors declare no conflict of interest.

References

  1. Agrawa, H.; Mishra, A.K. Modified scaled distance regression analysis approach for prediction of blast-induced ground vibration in multi-hole blasting. J. Rock Mech. Geotech. Eng. 2019, 11, 202–207. [Google Scholar] [CrossRef]
  2. Jayasinghe, B.; Zhao, Z.; Chee, A.G.T.; Zhou, H.; Gui, Y. Attenuation of rock blasting induced ground vibration in rock-soil interface. J. Rock Mech. Geotech. Eng. 2019, 11, 770–778. [Google Scholar] [CrossRef]
  3. Chu, H.; Yang, X.; Li, S.; Liang, W. Experimental study on the blasting-vibration safety standard for young concrete based on the damage accumulation effect. Constr. Build. Mater. 2019, 217, 20–27. [Google Scholar] [CrossRef]
  4. Gou, Y.; Shi, X.; Qiu, X.; Zhou, J.; Chen, H.; Huo, X. Propagation Characteristics of Blast-Induced Vibration in Parallel Jointed Rock Mass. Int. J. Géoméch. 2019, 19, 04019025. [Google Scholar] [CrossRef]
  5. Sheykhi, H.; Bagherpour, R.; Ghasemi, E.; Kalhori, H. Forecasting ground vibration due to rock blasting: A hybrid intelligent approach using support vector regression and fuzzy C-means clustering. Eng. Comput. 2017, 34, 357–365. [Google Scholar] [CrossRef]
  6. Ongen, T.; Karakus, D.; Konak, G.; Onur, A.H. Assessment of blast-induced vibration using various estimation models. J. Afr. Earth Sci. 2018, 145, 267–273. [Google Scholar] [CrossRef]
  7. Zhang, Z.-Y.; Jin, X.-G. Prediction of peak velocity of blasting vibration based on artificial neural network optimized by dimensionality reduction of FA-MIV. Math. Probl. Eng. 2018, 2018, 1–12. [Google Scholar] [CrossRef]
  8. Shahri, A.A.; Asheghi, R. Optimized developed artificial neural network based models to predict the blast induced ground vibration. Innov. Infrastruct. Solut. 2018, 3, 34. [Google Scholar] [CrossRef]
  9. Li, A.; Fang, Q.; Zhang, D.; Luo, J.; Hong, X. Blast vibration of a large-span high-speed railway tunnel based on microseismic monitoring. Smart Struct. Syst. 2018, 21, 561–569. [Google Scholar] [CrossRef]
  10. Xue, X. Neuro-fuzzy based approach for prediction of blast-induced ground vibration. Appl. Acoust. 2019, 152, 73–78. [Google Scholar] [CrossRef]
  11. Kostić, S.; Perc, M.; Vasović, N.; Trajković, S. Predictions of experimentally observed stochastic ground vibrations induced by blasting. PLoS ONE 2013, 8, e0082056. [Google Scholar] [CrossRef]
  12. Taheri, K.; Hasanipanah, M.; Golzar, S.B.; Majid, M.Z.A. A hybrid artificial bee colony algorithm-artificial neural network for forecasting the blast-produced ground vibration. Eng. Comput. 2017, 33, 689–700. [Google Scholar] [CrossRef]
  13. Yang, N.-H.; Xue, L.; Lin, S.-X. Remote monitoring system for blasting vibration and its application. Eng. Blasting 2012, 18, 71–74. (In Chinese) [Google Scholar]
  14. Zhu, M.; Wei, P.-G.; Zhang, J.-G.; Si, X.-D. Research on Automatic Monitoring System of Blast Vibration Based on TC-6850 and Its Application. In Proceedings of the Blasting Engineering Technology Exchange (Engineering Society of China Railway Society: China Railway Society), Beijing, China, 29 August 2018; pp. 262–272. [Google Scholar]
  15. Muhammad, W.; Hart, G.R.; Nartowt, B.; Farrell, J.J.; Johung, K.; Liang, Y.; Deng, J. Pancreatic Cancer Prediction Through an Artificial Neural Network. Front. Artif. Intell. 2019, 2. [Google Scholar] [CrossRef] [Green Version]
  16. Xu, Z.; Li, W.; Wang, Y. Robust Learning Control for Shipborne Manipulator with Fuzzy Neural Network. Front. Neurorobotics 2019, 13. [Google Scholar] [CrossRef] [PubMed]
  17. Zhou, Y.-C.; Wu, L.; Yuan, Q.; Ma, C.-Y. Blasting Vibration Prediction based on Rough Set-Fuzzy Neural Network Method. Blasting 2016, 33, 127–131. (In Chinese) [Google Scholar]
  18. Wang, Z.; Wen, G.-G.; Qiu, X.-L. Stock Prediction Research Based on Rough Set and Dynamic Fuzzy Neural Network. Comput. Digit. Eng. 2020, 48, 517–522. (In Chinese) [Google Scholar]
  19. Homer, E.R.; Hensley, D.M.; Rosenbrock, C.W.; Nguyen, A.H.; Hart, G.L.W. Machine-Learning Informed Representations for Grain Boundary Structures. Front. Mater. 2019, 6. [Google Scholar] [CrossRef] [Green Version]
  20. Zhang, Y.-X.; Zhang, Y.-H. Research on vibration velocity responses of surface building under the condition of blasting excavation in tunnel. Earthq. Eng. Eng. Vib. 2010, 30, 112–119. (In Chinese) [Google Scholar]
  21. Li, H.-T.; Shu, D.-Q.; Lu, W.-B.; Zhu, C.-Y. Response characteristics of a structure to different frequency components in blasting vibration energy. J. Vib. Shock. 2010, 29, 154–158. (In Chinese) [Google Scholar]
  22. Ma, H.; Zhong, M.; Li, X.; Xie, Q.; Zhou, Y.; Yin, Q. Experimental and Numerical Simulation Study on the Shock and Vibration Effect of OD1422-X80 Mainline Natural Gas Pipeline Explosion. Shock. Vib. 2019, 2019, 1–13. [Google Scholar] [CrossRef]
  23. Shi, X.-Z.; Lin, D.-N.; Chen, S.-S. Blasting-vibration-induced damage prediction by rough set-based fuzzy-neural network. Explos. Shock. Waves 2009, 29, 401–407. (In Chinese) [Google Scholar]
  24. Shi, X.-Z.; Xue, J.-G.; Chen, S.-S. A fuzzy neural network prediction model based on rough set for characteristic variables of blasting vibration. J. Vib. Shock. 2009, 28, 73–76+213. (In Chinese) [Google Scholar]
  25. Liu, D.; Lu, W.; Liu, Y.; Chen, M.; Yan, P.; Sun, P. Analysis of the Main Factors Influencing the Dominant Frequency of Blast Vibration. Shock. Vib. 2019, 2019, 1–17. [Google Scholar] [CrossRef]
  26. Liu, T.; Huang, Y.-L.; Lei, G. Analysis of the Optimum Support Dismantling Scheme for Shallow Bored Subway Stations in a Soil-Rock Compound Stratum. Mod. Tunn. Technol. 2015, 52, 131–137. (In Chinese) [Google Scholar]
  27. Zhang, G.-C.; Liu, T. Monitoring and analysis of deformation of foundation pits in strata with rock-soil combination. Chin. J. Geotech. Eng. 2010, 32, 550–553. (In Chinese) [Google Scholar] [CrossRef]
  28. Monjezi, M.; Baghestani, M.; Faradonbeh, R.S.; Saghand, M.P.; Armaghani, D.J. Modification and prediction of blast-induced ground vibrations based on both empirical and computational techniques. Eng. Comput. 2016, 32, 717–728. [Google Scholar] [CrossRef]
  29. Huo, R.; Li, S.; Song, Z.; Fujii, Y.; Lei, S.; Mao, J.; Tian, S.; Miao, Z. Analysis of vibration response law of multi-story building under tunnel blasting loads. Adv. Civ. Eng. 2019, 2019, 1–16. [Google Scholar] [CrossRef]
  30. Gu, W.; Wang, Z.; Liu, J.; Xu, J.; Liu, X.; Cao, T. Water-Depth-Based Prediction Formula for the Blasting Vibration Velocity of Lighthouse Caused by Underwater Drilling Blasting. Shock. Vib. 2017, 2017, 1–9. [Google Scholar] [CrossRef] [Green Version]
  31. Song, K.-I.; Oh, T.-M.; Cho, G.-C. Precutting of tunnel perimeter for reducing blasting-induced vibration and damaged zone—numerical analysis. KSCE J. Civ. Eng. 2014, 18, 1165–1175. [Google Scholar] [CrossRef]
  32. Xie, L.; Lu, W.; Gu, J.; Wang, G. Excavation Method of Reducing Blasting Vibration in Complicated Geological Conditions. Shock. Vib. 2018, 2018, 1–12. [Google Scholar] [CrossRef]
  33. Yu, L. Safety influence of blasting vibration on multistory building. J. Railw. Eng. Soc. 2015, 32, 86–89. [Google Scholar]
Figure 1. (a) The network vibrometer: TC-6850; (b) The site installation of TC-6850.
Applsci 12 00012 g001
Figure 2. The topology of fuzzy neural network in different sites.
Applsci 12 00012 g002
Figure 3. (a) Relative errors between predicted values and measured data of Model-Stratum. (b) Relative errors between predicted values and measured data of Model-Hollow. (c) Relative errors between predicted values and measured data of Model-Building.
Applsci 12 00012 g003
Figure 4. Schematic diagram of the intelligent automatic blasting vibration monitoring system.
Applsci 12 00012 g004
Figure 5. Sensor mounting position diagram of TC-4850 and TC-6850.
Applsci 12 00012 g005
Figure 6. (a) The comparison of monitoring data between TC-4850 and TC-6850 on the ground. (b) The comparison of monitoring data between TC-4850 and TC-6850 on the building.
Applsci 12 00012 g006
Figure 7. (a) The ‘home’ page of the intelligent automatic blasting vibration monitoring system. (b) The ’FFT analysis’ page of the intelligent automatic blasting vibration monitoring system. (c) The ’HHT analysis’ page of the intelligent automatic blasting vibration monitoring system. (d) The ‘training and prediction of artificial neural network’ page of the intelligent automatic blasting vibration monitoring system.
Applsci 12 00012 g007aApplsci 12 00012 g007b
Figure 8. Network topological map of the monitoring system.
Applsci 12 00012 g008
Figure 9. Variation of blasting vibration on the surrounding rock of the foundation pit.
Applsci 12 00012 g009
Figure 10. The arrangement of test points in N-Station.
Applsci 12 00012 g010
Figure 11. (a) Change of mean value of peak vibration velocity in the tunnel axis line. (b) Frequency distribution of blasting vibration.
Applsci 12 00012 g011
Figure 12. (a) The curve of the blasting vibration speed with time on a building. (b) Variation of the primary frequency of vertical vibration of blasting with floor.
Applsci 12 00012 g012
Table 1. The parameters of the TC-6850.
ParameterTechnical Description
Number of channelsX/Y/Z
Frequency5–300 Hz
Range (speed)0–25 cm/s
Range (acceleration)±16 g
Sample rate6.4 KSps
Sample time1/2/5/10/15 s
Storage capacity1 GB
Measurement accuracy0.1 cm/s, 0.02 g
Short-message warningSupport
System error<5%
Working time>72 H
Stand-by time>240 H
Battery capacity6400 mAH
Operating temperature−20 °C to +70 °C
Table 2. The reduction of decision and attribute.
Guideline of Attribute (Units)Description of Decision
012
a(kg)<3030~50>50
b(kg)<200200~300>300
c(m)<20≥20
d(m)<1010~20>20
e(m)<0.5≥0.5
f(ms)<0.50.5~0.7>0.7
g<0.50.5~0.7>0.7
h0~180>180
i(m)<0.30.3~0.8>0.8
X(cm/s)<0.50.5~1>1
Y(cm/s)<0.50.5~1>1
Z(cm/s)<0.50.5~1>1
F(Hz)<100100~200>200
a: maximum quantity for detonating period; b: total quantity for detonating period; c: horizontal distance; d: vertical distance; e: the shortest distance from packet to the free surface; f: differential time; g: the integrity of excavated and unexcavated layer; h: transmission medium; i: types of explosive.
Table 3. Calculation sheet for coordination rate of each factor.
LocationNciXYZF
R-Stationa35/10015/10022/10032/100
b23/10021/10015/10031/100
c26/10012/10016/10019/100
d3/10018/10025/10021/100
e15/10012/10019/1006/100
f2/1005/1002/1001/100
g1/1002/1003/1002/100
h3/1007/10015/1004/100
i15/10010/10034/10023/100
Y-Stationa32/10012/10019/10029/100
b20/10018/10013/10023/100
c21/10017/10011/10024/100
d15/10018/10025/10021/100
e15/10012/10019/1006/100
f12/10018/10016/10021/100
g25/10029/10032/10025/100
h10/1002/1008/10013/100
i0/1000/1000/1000/100
H-Stationa35/10015/10022/10032/100
b23/10021/10015/10031/100
c26/10012/10016/10019/100
d3/10018/10025/10021/100
e15/10012/10019/1006/100
f4/1009/1001/1000/100
g5/1006/1009/1001/100
h21/10015/10018/10028/100
i0/1000/1000/1000/100
Table 4. Comparison of TC-4850 and TC-6850.
ItemTC-4850TC-6850
ShapeSquareCylindrical
Size168 mm × 99 mm × 64 mmD = 81 mm, H = 80 mm
Weight1 kg0.56 kg
IntegrationSeparate sensor and hostCombined sensor and host
Working temperature−10~75 °C−20~75 °C
Sealing, waterproof and dustproofPoorGood
Data transmissionUSBWIFI/4G/3G
PowerLithium batteryLithium battery/Solar energy
OperationWiredWireless
Data acquisitionManualAutomatic
Data outputPCPC & Mobile phone
Parameters outputVelocityVelocity & Acceleration
Data viewingPaper reportNetwork data platform
Table 5. Lithology distribution of surrounding rock of foundation pit in J-Station.
Sensor NumberOrigin of the AgeGeotechnical NameLayer Thickness/m
J1Q4mlPlain fill1.85
J2Q4mlMiscellaneous fill2.11
J3γ53Strongly weathered granite5.44
J4γ53Middle weathered granite3.69
J5γ53Slightly weathered granite7.15
J6γπ53Slightly weathered granite porphyry4.76/excavated
Publisher’s Note: MDPI stays neutral with regard to jurisdictional claims in published maps and institutional affiliations.

