1. Introduction
The end of the 1980s brought radical changes for the Kurds and other ethnic groups in northern Iraq. During the Iraq-Iran war, the former Iraqi Baathist government began a series of systematic attacks against the Kurdish fighters. The first attacks, which would later lead to the al-Anfal campaign, started in the year 1986. The al-Anfal campaign included ground offensives, aerial bombing, systematic destruction of settlements, mass deportation, firing squads, and the use of chemical warfare [
1,
2]. In the period from 23 February 1988 to 6 September 1988, in eight attacks (seven of them targeting areas controlled by the Patriotic Union of Kurdistan), thousands were killed, and about 4500 Kurdish and 31 Assyrian Christian villages were destroyed, and over one million people were displaced in the area of northern Iraq.
The al-Anfal campaign led to many demographic changes. The power and resistance of the Iraqi Kurds was destabilized but not suppressed. One of the main aims of the al-Anfal campaign was to displace Kurdish people from areas with high strategic importance (oil field areas) and replace them with Arabs from southern Iraq. This process caused extensive changes in the history of the human population in northern Iraq and also led to a massive restructuring of settlements in northern Iraq [
1]. Operation al-Anfal caused the discontinuity of village settlement on an unprecedented scale, and it is necessary to study how this turning point was reflected in the morphology of the villages that were repopulated. This research can reveal significant changes in the long-term stable settlement structure of Kurdistan and draw attention to changes not only in settlement units, but also in the social structure of the population. The violent interference in many centuries-old settlements during the al-Anfal campaign demonstrates how quickly the stability of the long-term settlement and any associated lifestyles can be disrupted. The morphological aspects of rural settlement directly reflect the social structure of the population, its connection to the landscape, and especially its use of natural resources, which are the basic prerequisites for the creation of a stable and self-sufficient settlement unit in these areas.
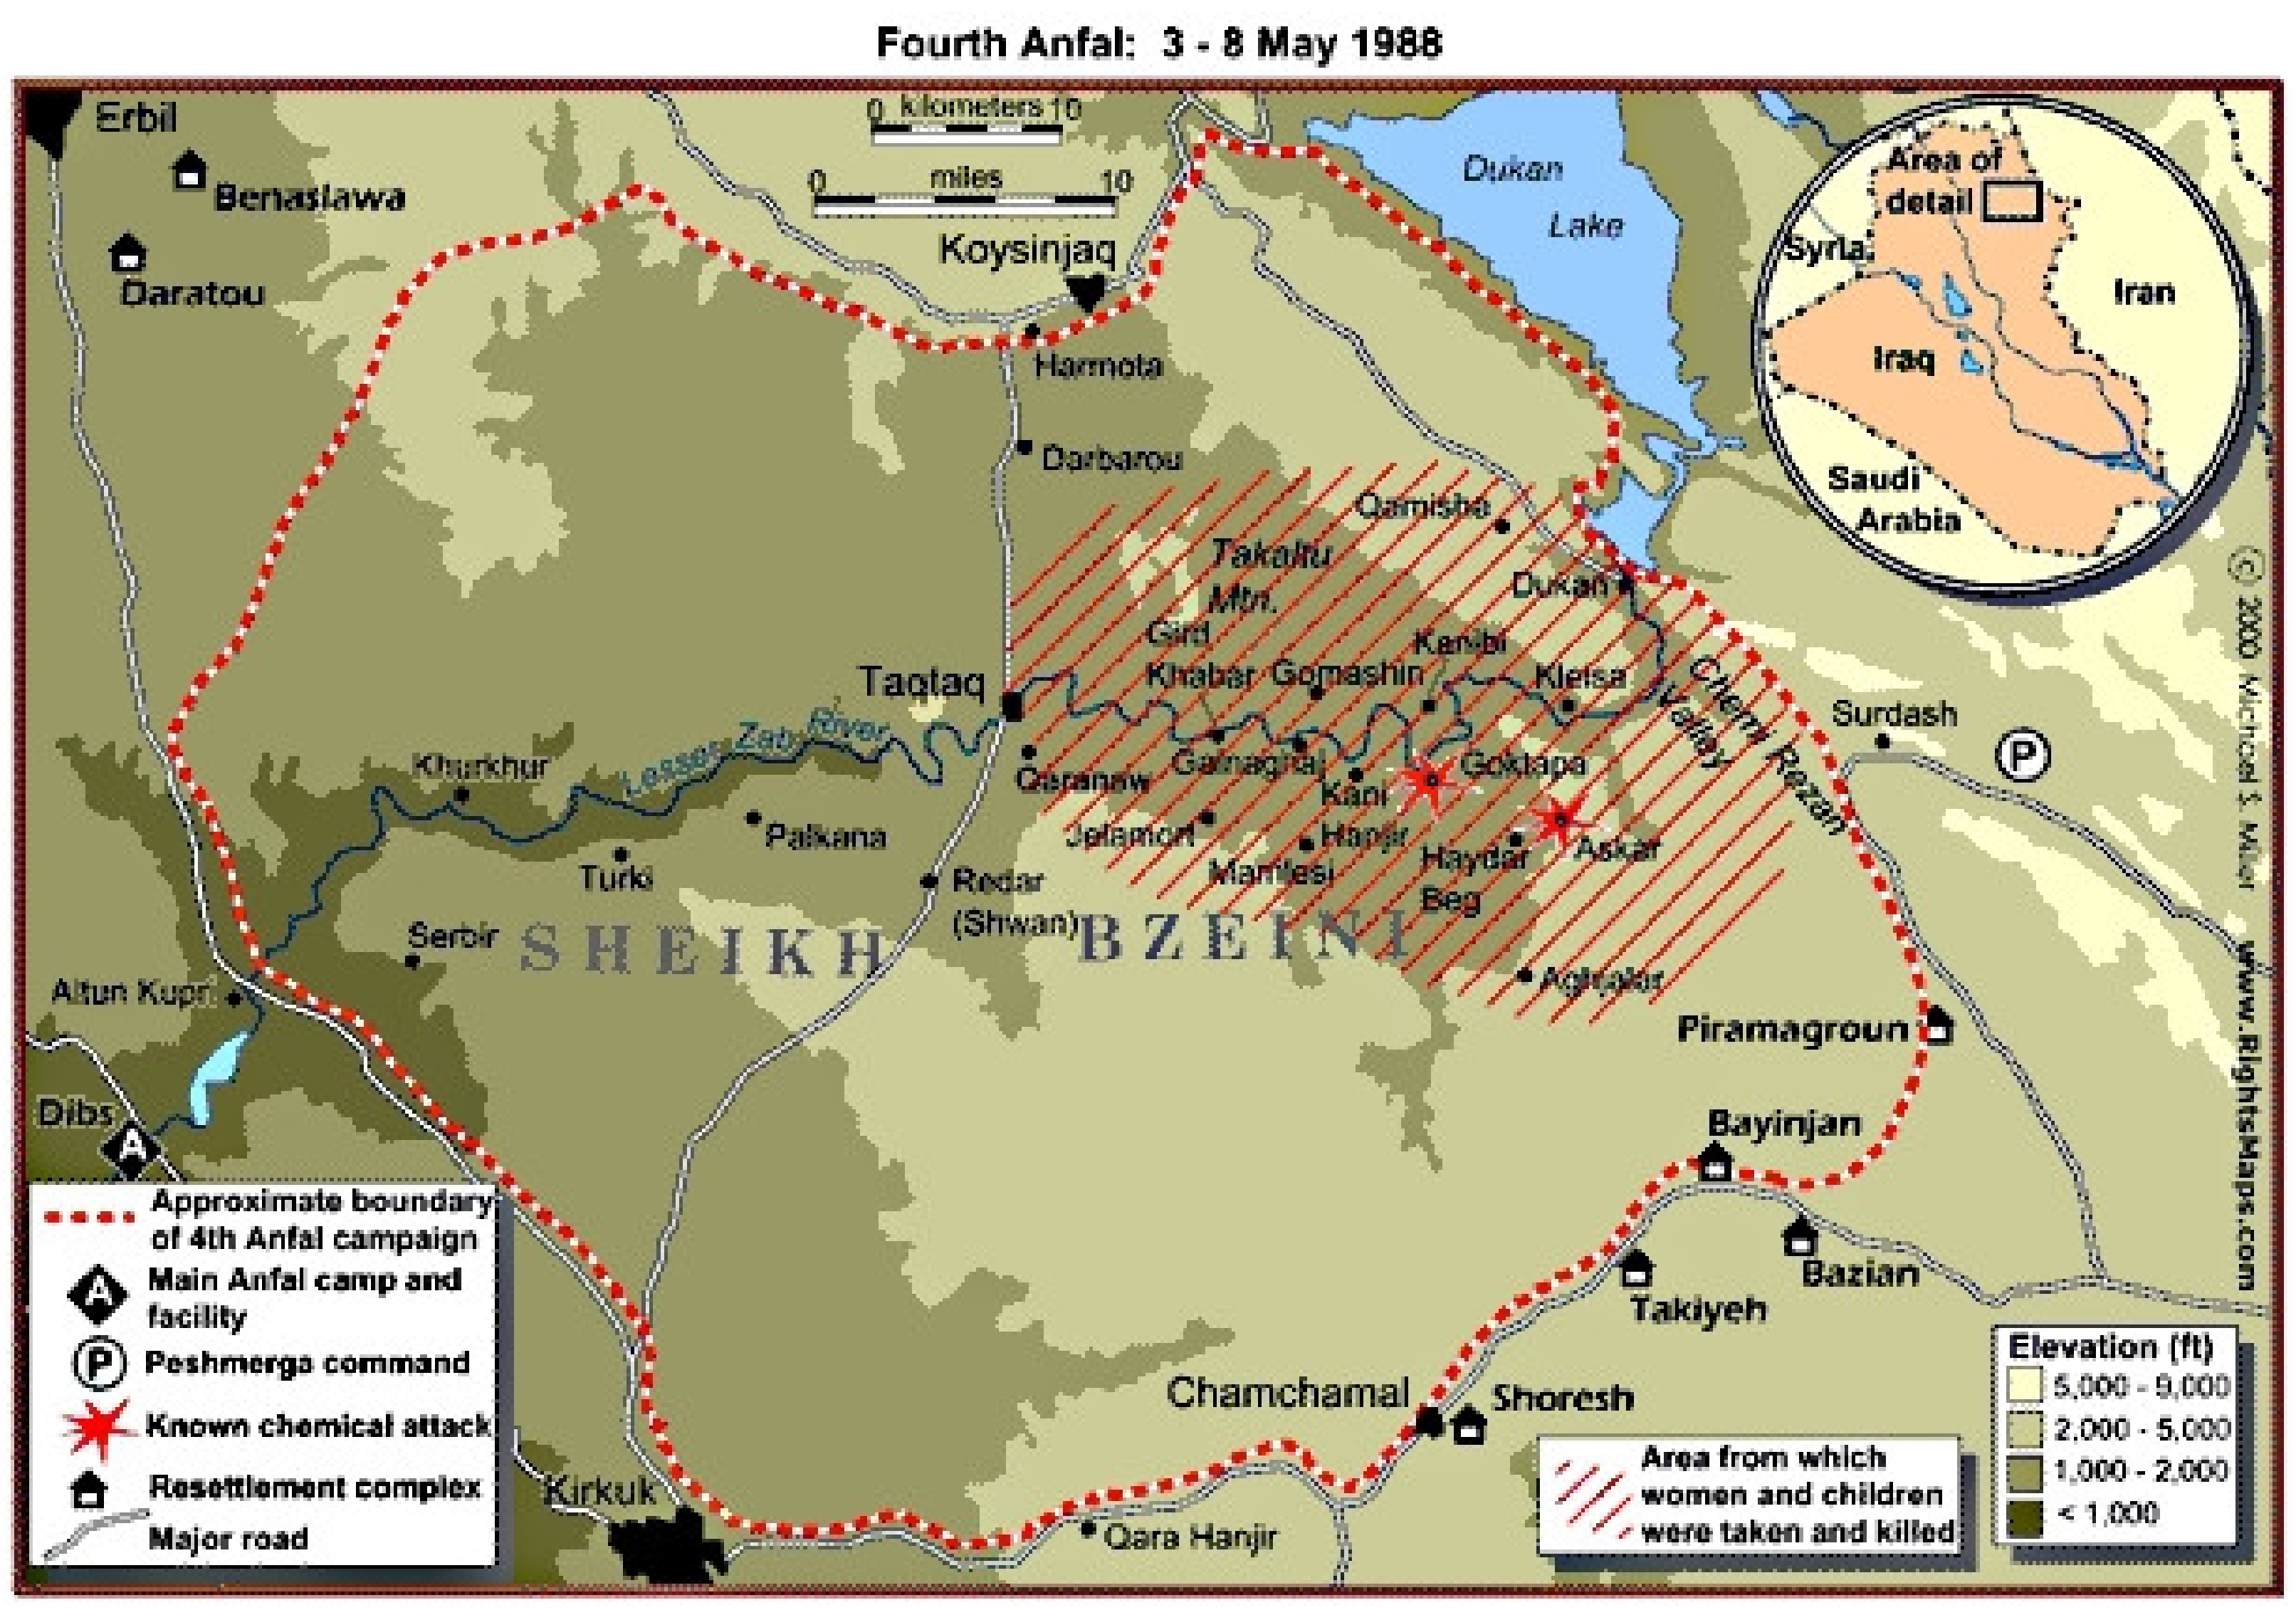
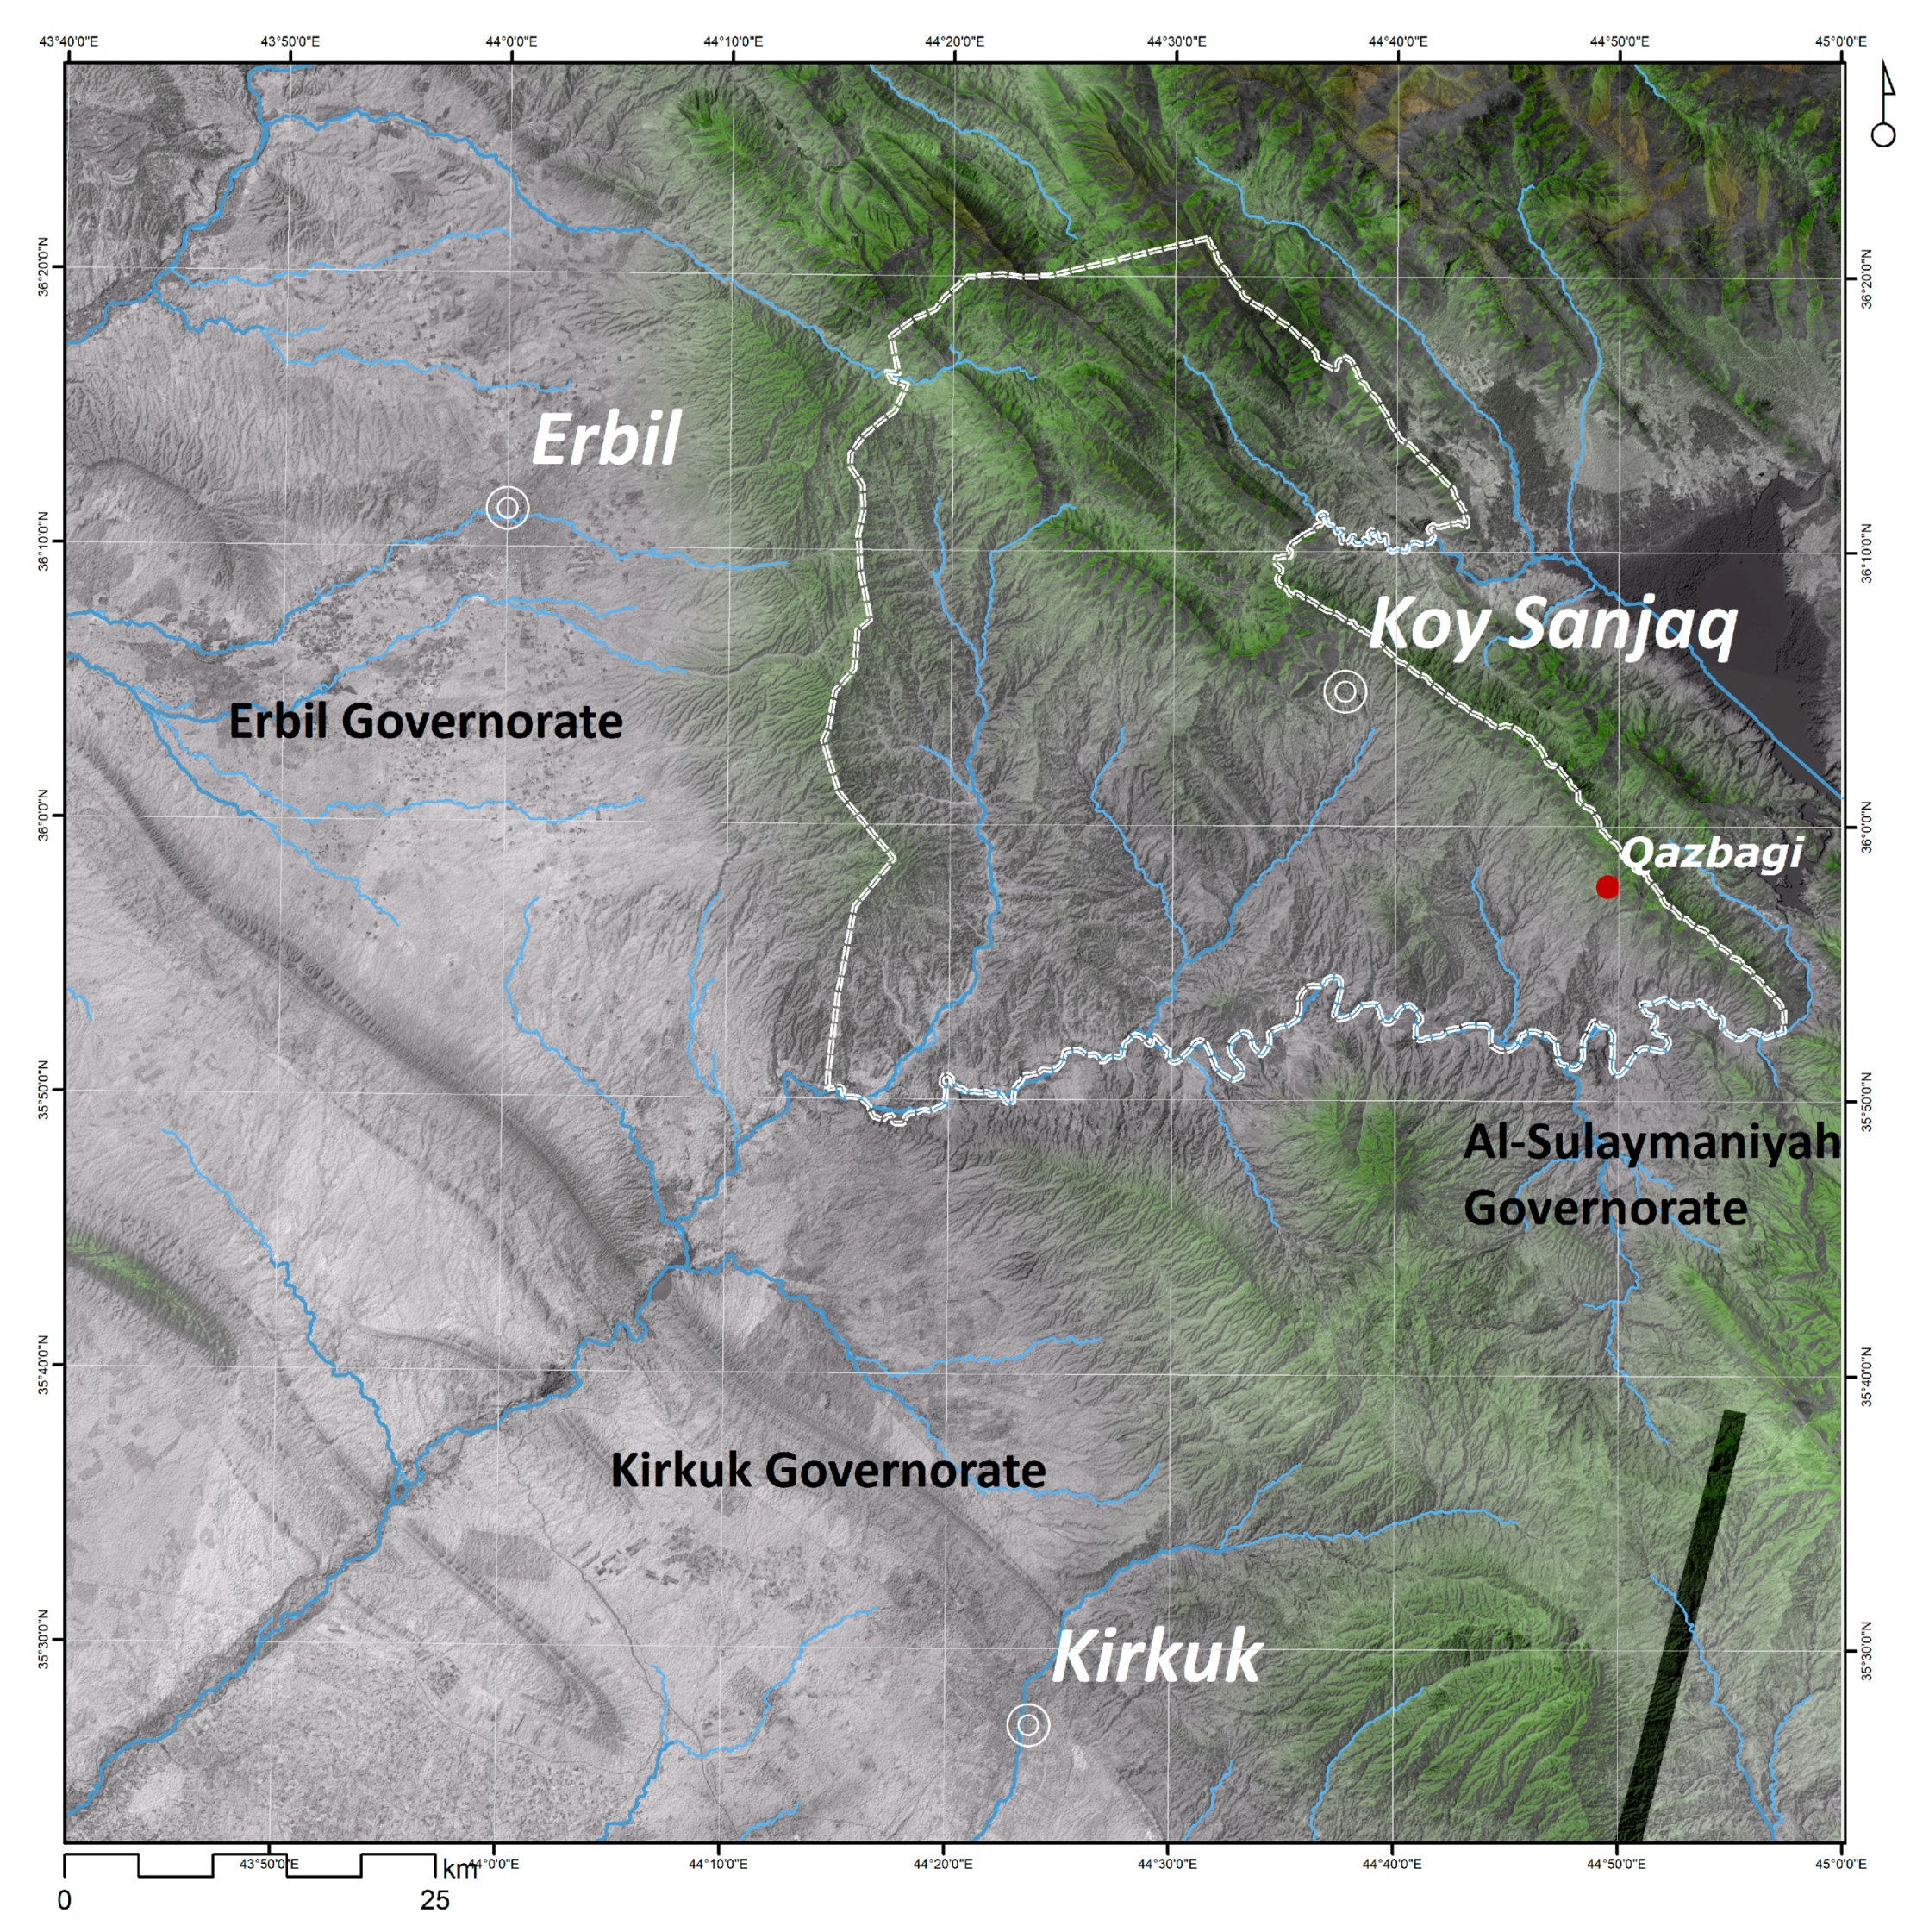
This study thus addresses the topic of recent transformations in the agricultural landscape, set in motion by the genocide in the 1980s. The model situation is represented by one partly abandoned village, Qazbagi (قزبكي), located in the foothills of the Zagros Mountains in Iraqi Kurdistan. This area was affected by the fourth stage of the al-Anfal campaign, which lasted from 3 May 1988 to 8 May 1988 (
Figure 1).
The Qazbagi village belongs to the area of the ongoing archaeological research project, Archaeological Survey of Koi Sanjaq/Koya (ASK), led by Cinzia Pappi since 2016. Archaeological research, conducted within the field work of the ASK project, provided surface evidence for the analysis of the local socio-economic processes, reflecting political episodes of the recent past. The case of the village of Qazbagi is one of the several examples of “archaeology of the contemporary past” or “contemporary archaeology” [
3]. In recent years, this specialization has come to the forefront of research on 20th-century conflicts around the world—so-called combat archeology [
4]. There are more ways to categorize this type of research, but the history of al-Anfal remains chronically understudied in present-day Iraq. The only other archaeological contributions to the forensic study of the Kurdish genocide appeared very recently [
5,
6].
Research Aims
This paper will focus mainly on the analysis of landscape changes, settlement structure, and social changes. A detailed analysis of a series of historical and contemporary satellite images using a multi-temporal approach makes it possible to examine the development trends of rural settlements patterns in recent times. The set of images dates from the years 1967–2019 (
Table 1). It is necessary to emphasize that this relatively short interval is only the last phase in the long-term development of settlements, which is characterized by stages of nucleation and dispersion. In northern Iraq, examples of this kind of research employing archaeological techniques are not yet available, but research on agricultural villages in Jordan provides a model situation [
7]. Based on remote sensing data, the development of settlement topography can be analyzed rather statically, in certain sections, without the possibility of a closer interpretation of the social background of the village, property relations, or demographic factors, or of the consequences of developmental changes. Topographic changes are a reflection of social processes that need to be examined on the basis of other sources. These are mainly anthropological research (oral history), field verification, geodetic-topographic surveys, and historical sources, which verify the results obtained by remote access and, above all, put them into direct historical context.
2. Materials and Methods
To follow the whole process of demographic and landscape transformation, a multi-disciplinary approach is required. Three main data sources are used:
Historical remote sensing data
Anthropological research (based on the collection of oral sources)
Archaeological fieldwork research
In the Middle East, historical satellite and aerial images are used as a basic documentation tool and as an information source in most archaeological excavation and landscape research. Their importance is amplified by the fact that they constitute the only available source capable of reflecting the historic landscape. The parameters and properties of individual source collections differ significantly from each other. To prospect and map archaeological sites in an open landscape, a very wide range of sources of variable resolution and accuracy can be used [
8,
9,
10,
11,
12], (pp. 184–203) [
13], (p. 278) [
14], (pp. 243–262) [
15].
The situation is different in areas that can be called urban landscapes. To use a remote archaeological survey in urban areas, we most often need data with a very high spatial resolution [
15,
16,
17,
18,
19,
20,
21,
22,
23,
24]. In the Middle East, the most frequently used images of remote sensing are those acquired through the CORONA satellite system. These images are suitable for the primary detection of archaeological sites, for their simple topographic analysis, and especially for prospecting their environment [
25,
26,
27,
28,
29,
30,
31,
32]. However, this type of data is not of sufficient quality to be employed in detailed analyses and documentation of the internal layout of built-up areas. Until recently, these collections were the only source of freely available historical satellite images. This changed at the end of 2020, when a collection of historical satellite images of a very high resolution (acquired using the KH-9 Hexagon system) in the form of digitized images was released for public use. The ideal situation for exploring the urban environment is a situation where we are able to use and combine both types of remote sensing data (high and low resolution) to create a comprehensive picture of the site and its surroundings over periods of many years (multi-temporal GIS).
The USGS archive
https://earthexplorer.usgs.gov/, (accessed on 21 February 2021) was used as the main source of historical satellite images in this project. The lowest-resolution images were collected by the CORONA system, an American spy system operated from September 1967 to May 1972. In addition to the standard satellite data of the CORONA KH-4B category (1.8 m resolution), images from the collection of historical commercial images of the OrbView-3 system were also used and processed. The OrbView-3 system was the first commercial high-resolution imagery space system, which operated from 2003 to 2007 [
33]. The resolution of 1 m is not an absolutely ideal resolution for urban areas; however, in this case it is fully sufficient for the analysis of the chronological development of the locality. To identify and separate individual features based on their morphological attributes, it would be necessary to work with a truly high-resolution dataset—ideally at a resolution of 0.5 m or higher. Indeed, the images captured by this system represent a certain historical milestone in the analysis of topographic changes.
The most suitable collection of satellite images for topographic analyses of the urban environment is that acquired by the KH-9 Hexagon system. This system was originally created to replace previous CORONA systems. Ground image resolution is 0.5–0.6 m. KH-9 Hexagon carried out 20 missions from June 1971 to April 1986 and operated with two telescopic, high-resolution cameras. This spy system was declassified quite recently (in 2011) and fully digitized and made available to the public in 2020 (p. 54) [
29], (pp. 261–282) [
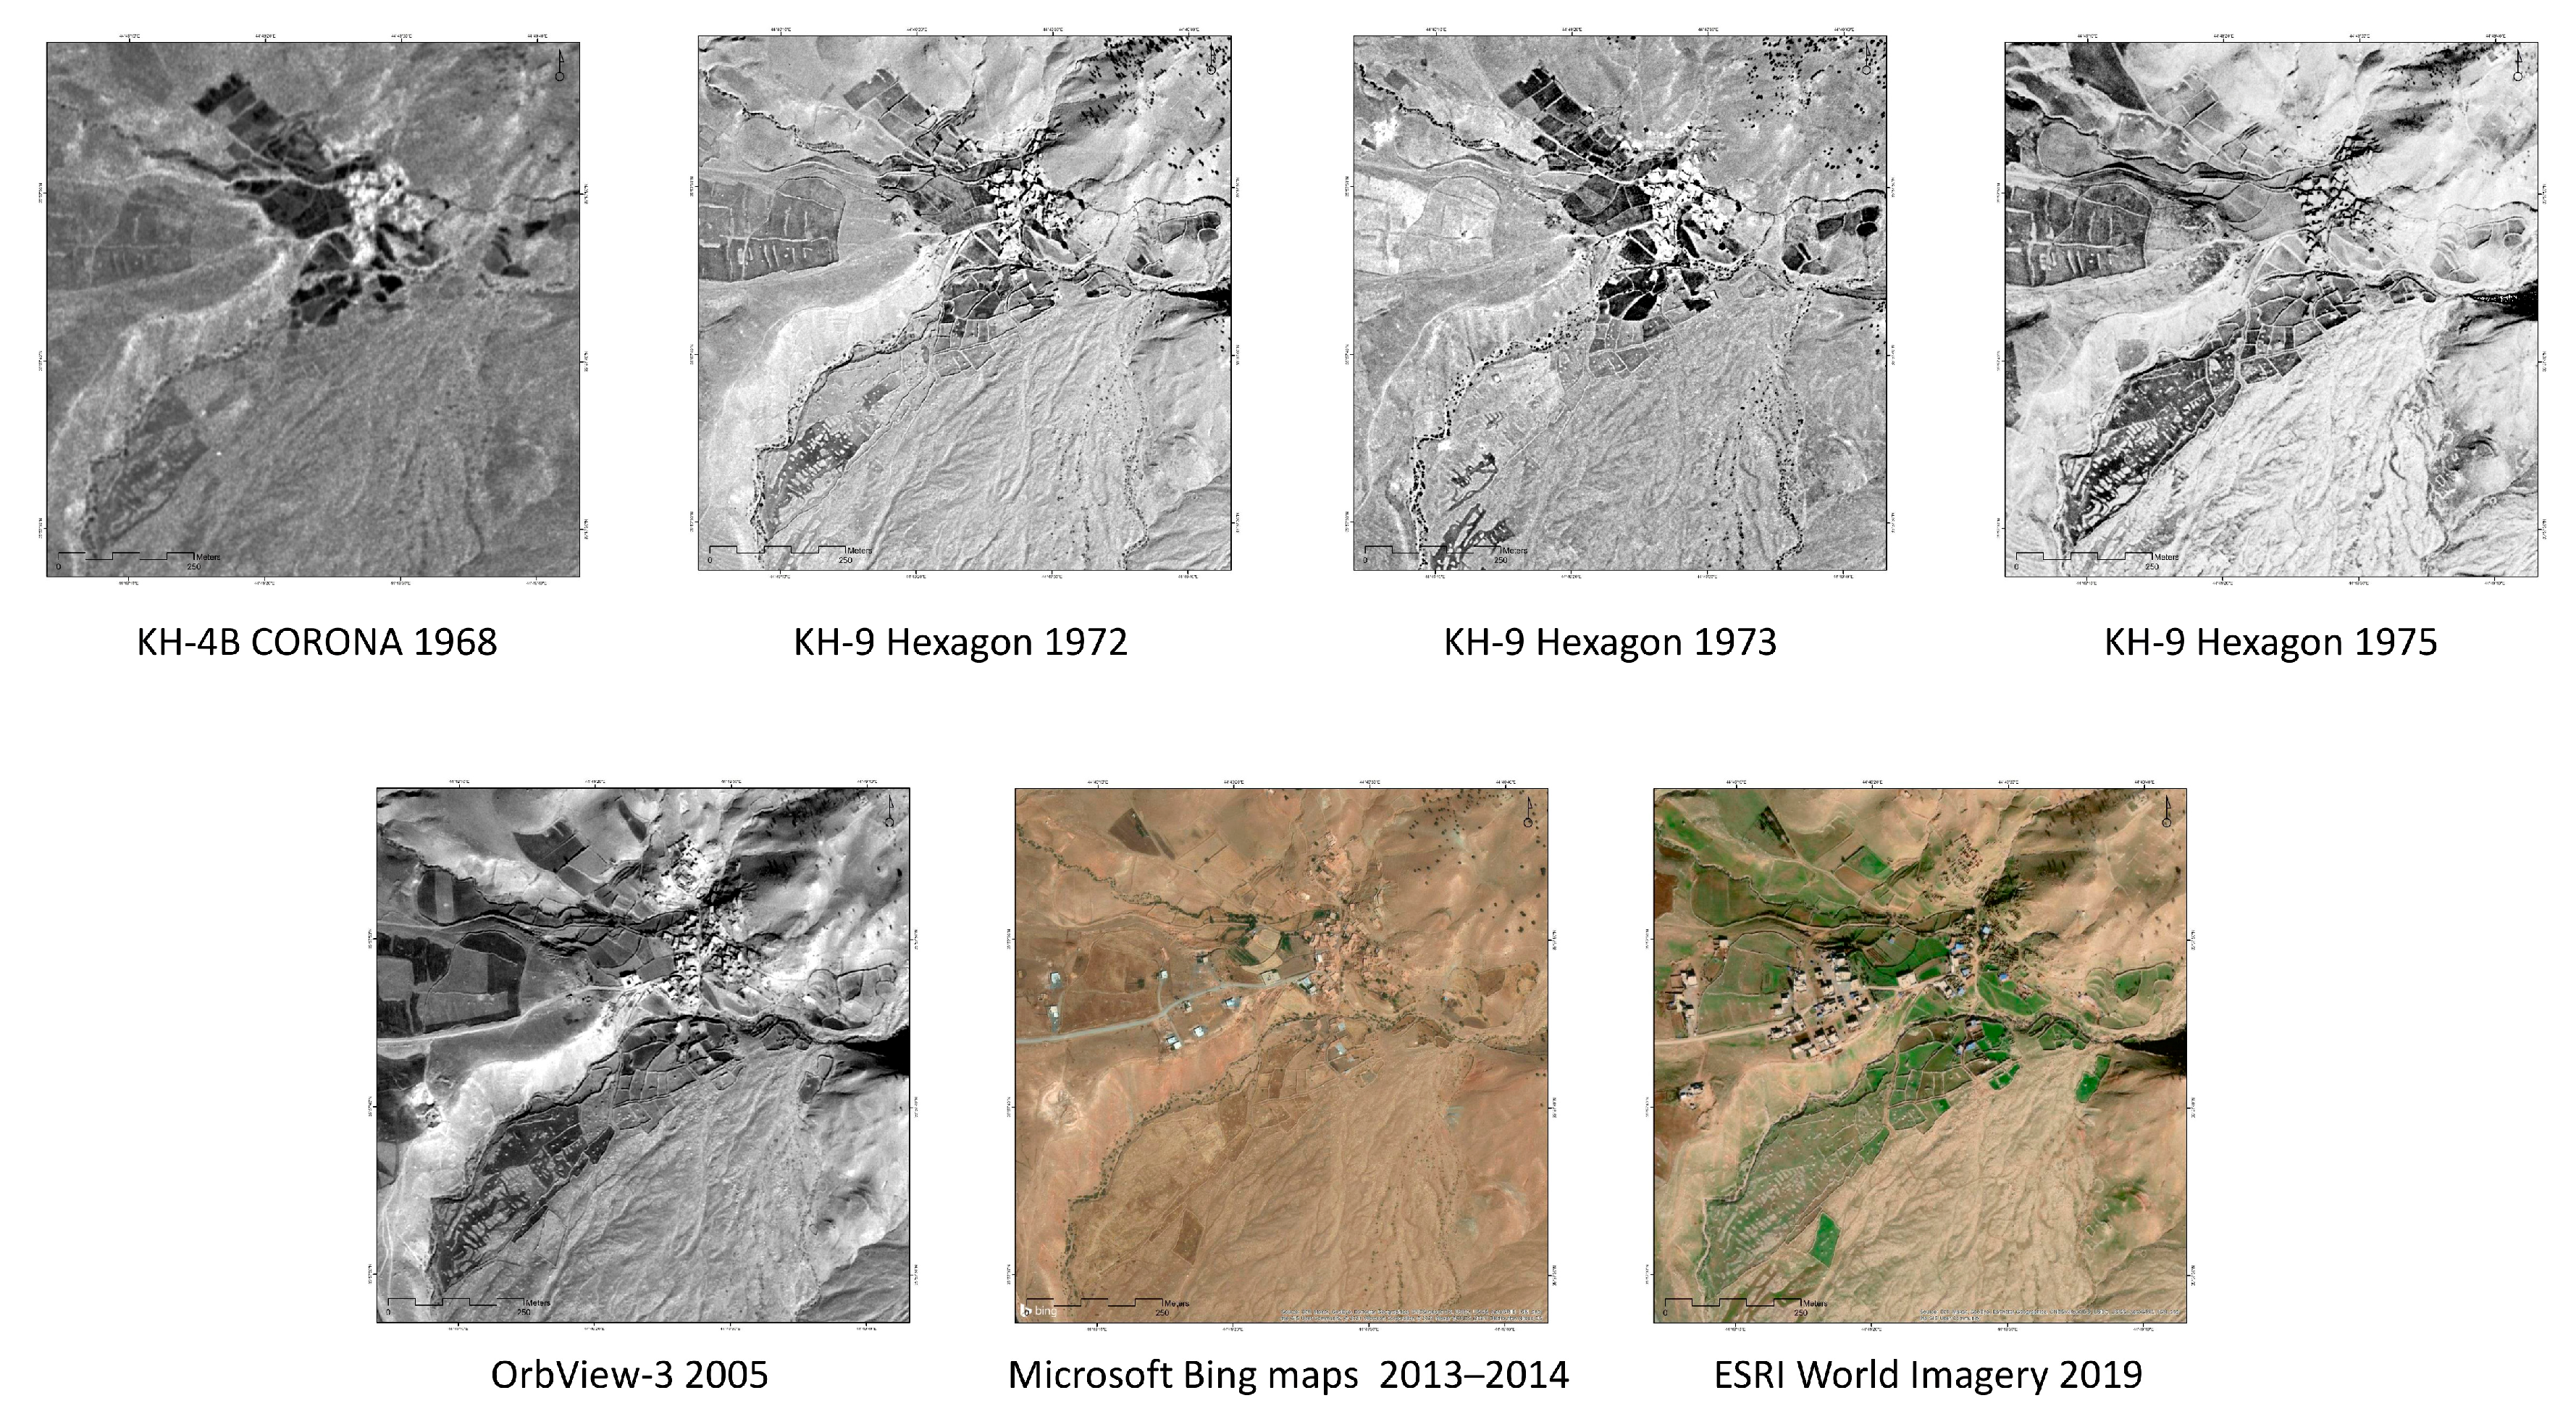
34]. Thanks to its resolution, this source quickly attracted the attention of archaeologists and is gradually attaining a similar position as indispensable source data for remote sensing to that previously held by the CORONA images. Within the data analysis of this project, five images captured by the KH-9 Hexagon system from the years 1972–1975 were used. The category of current satellite images in this case is represented by freely available data in the form of aerial views of the distributors Microsoft Bing maps and ESRI. Their respective resolutions of 0.3 m and 0.5 m is fully sufficient to create a topographic plan, reflecting the current state of the site (
Figure 2).
In addition to satellite sources, topographic maps of the area were also used as base interpretation layers. Due to the fact that large-scale topographic maps are not available for Iraqi Kurdistan, the available sources of historical medium-scale and small-scale topographic maps were used as an additional tool to understand the landscape context of the site. These sources, due to their low resolution, were not used in the phase of detailed topographic analysis of the village of Qazbagi. These map outputs are a common part of information reports describing individual operations, their characteristics, and a list of affected villages [
1].
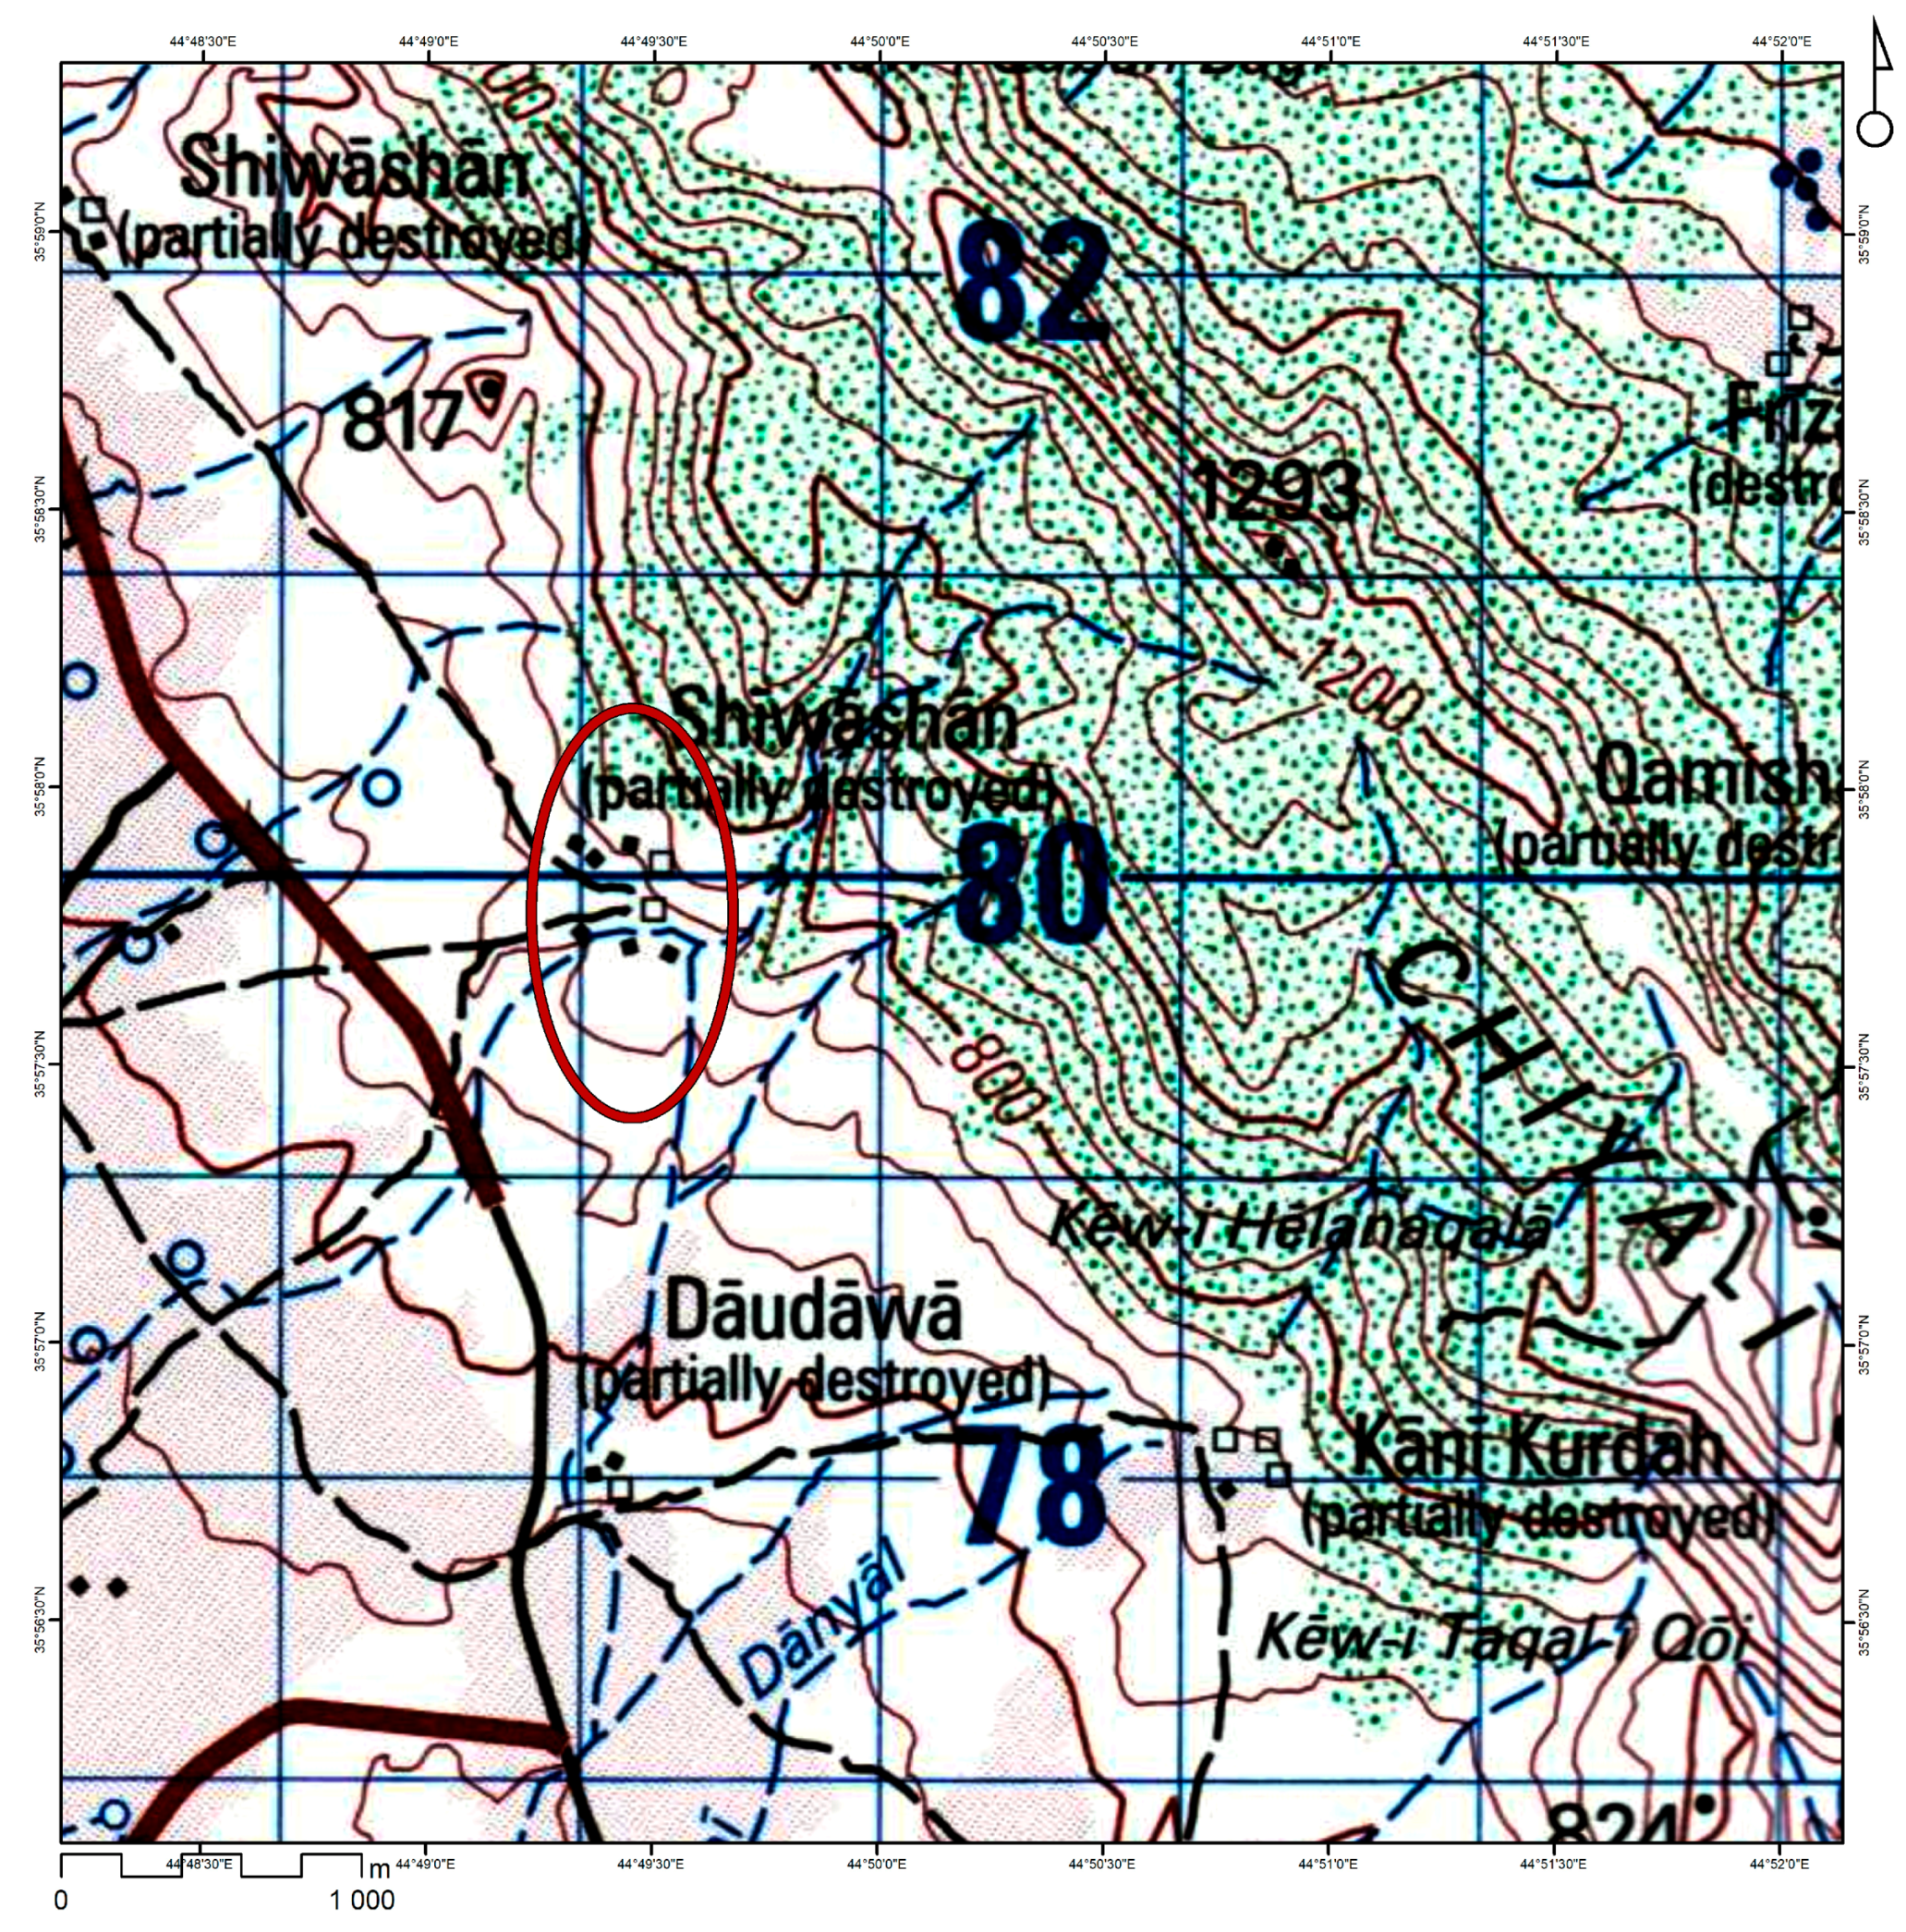
Medium-scale topographic maps are represented by a historical map at a scale of 1:100,000, created by the National Imagery and Mapping Agency from the 1990s. Such map materials not only represent topographical features but also elevation in the form of contour lines. Small-scale map sources include collections of Soviet military topographic maps at a scale of 1:200,000, collections of USGS maps at a scale of 1:250,000, and the historical maps of the Army Map Service, Washington, DC, which have a scale of 1:253,440 (
Figure 3).
Freely available digital surface models (DSMs) of SRTM (available via the portal of the United States Geological Survey, USGS) at a resolution of 30 m and DEM ALOS Palsar (created and distributed through the Alaska Satellite Facility) at a resolution of 12.5 m were used as the digital elevation base layer. The DEM was heavily based on the latter in order to obtain the most accurate result in the orthorectification of raster data.
The research was carried out in several phases.
Analysis of the remote sensing data (current and historical satellite imagery), detection of important locations within Qazbagi village, and its mapping. The historical satellite images from the spy systems are the most suitable source of information. The CORONA and KH-9 Hexagon systems (1960s and beginning of 1970s) (p. 53) [
29] recorded the landscape before the al-Anfal campaign, so all the villages that were later destroyed are easy to identify, and it is possible to reconstruct the settlement zones.
Research on the ground in the form of a field survey and terrestrial mapping of detected remains. The research was non-destructive. The field survey focused on the selected situation of deserted villages and was connected to a basic anthropological survey (oral history). Questions regarding the resettlement of villages and prospective changes in their pattern were included. This phase was done during the 2019 spring season of the Archaeological Survey of Koi Sanjaq/Koya ASK project [
35].
Analysis of a geodatabase, filled during phases A and B.
Reconstruction of maps, as one of the main project outputs is the creation of a series of maps depicting the spatial development of the village in time sections before and after al-Anfal. Their comparison with the current topographical maps will show the extent of the landscape changes, which were the consequence of unnatural behavior in the past. By creating this series of chronological maps, these changes can be effectively monitored and interpreted in relation to the complex changes of modern Iraqi society and rural settlement patterns.
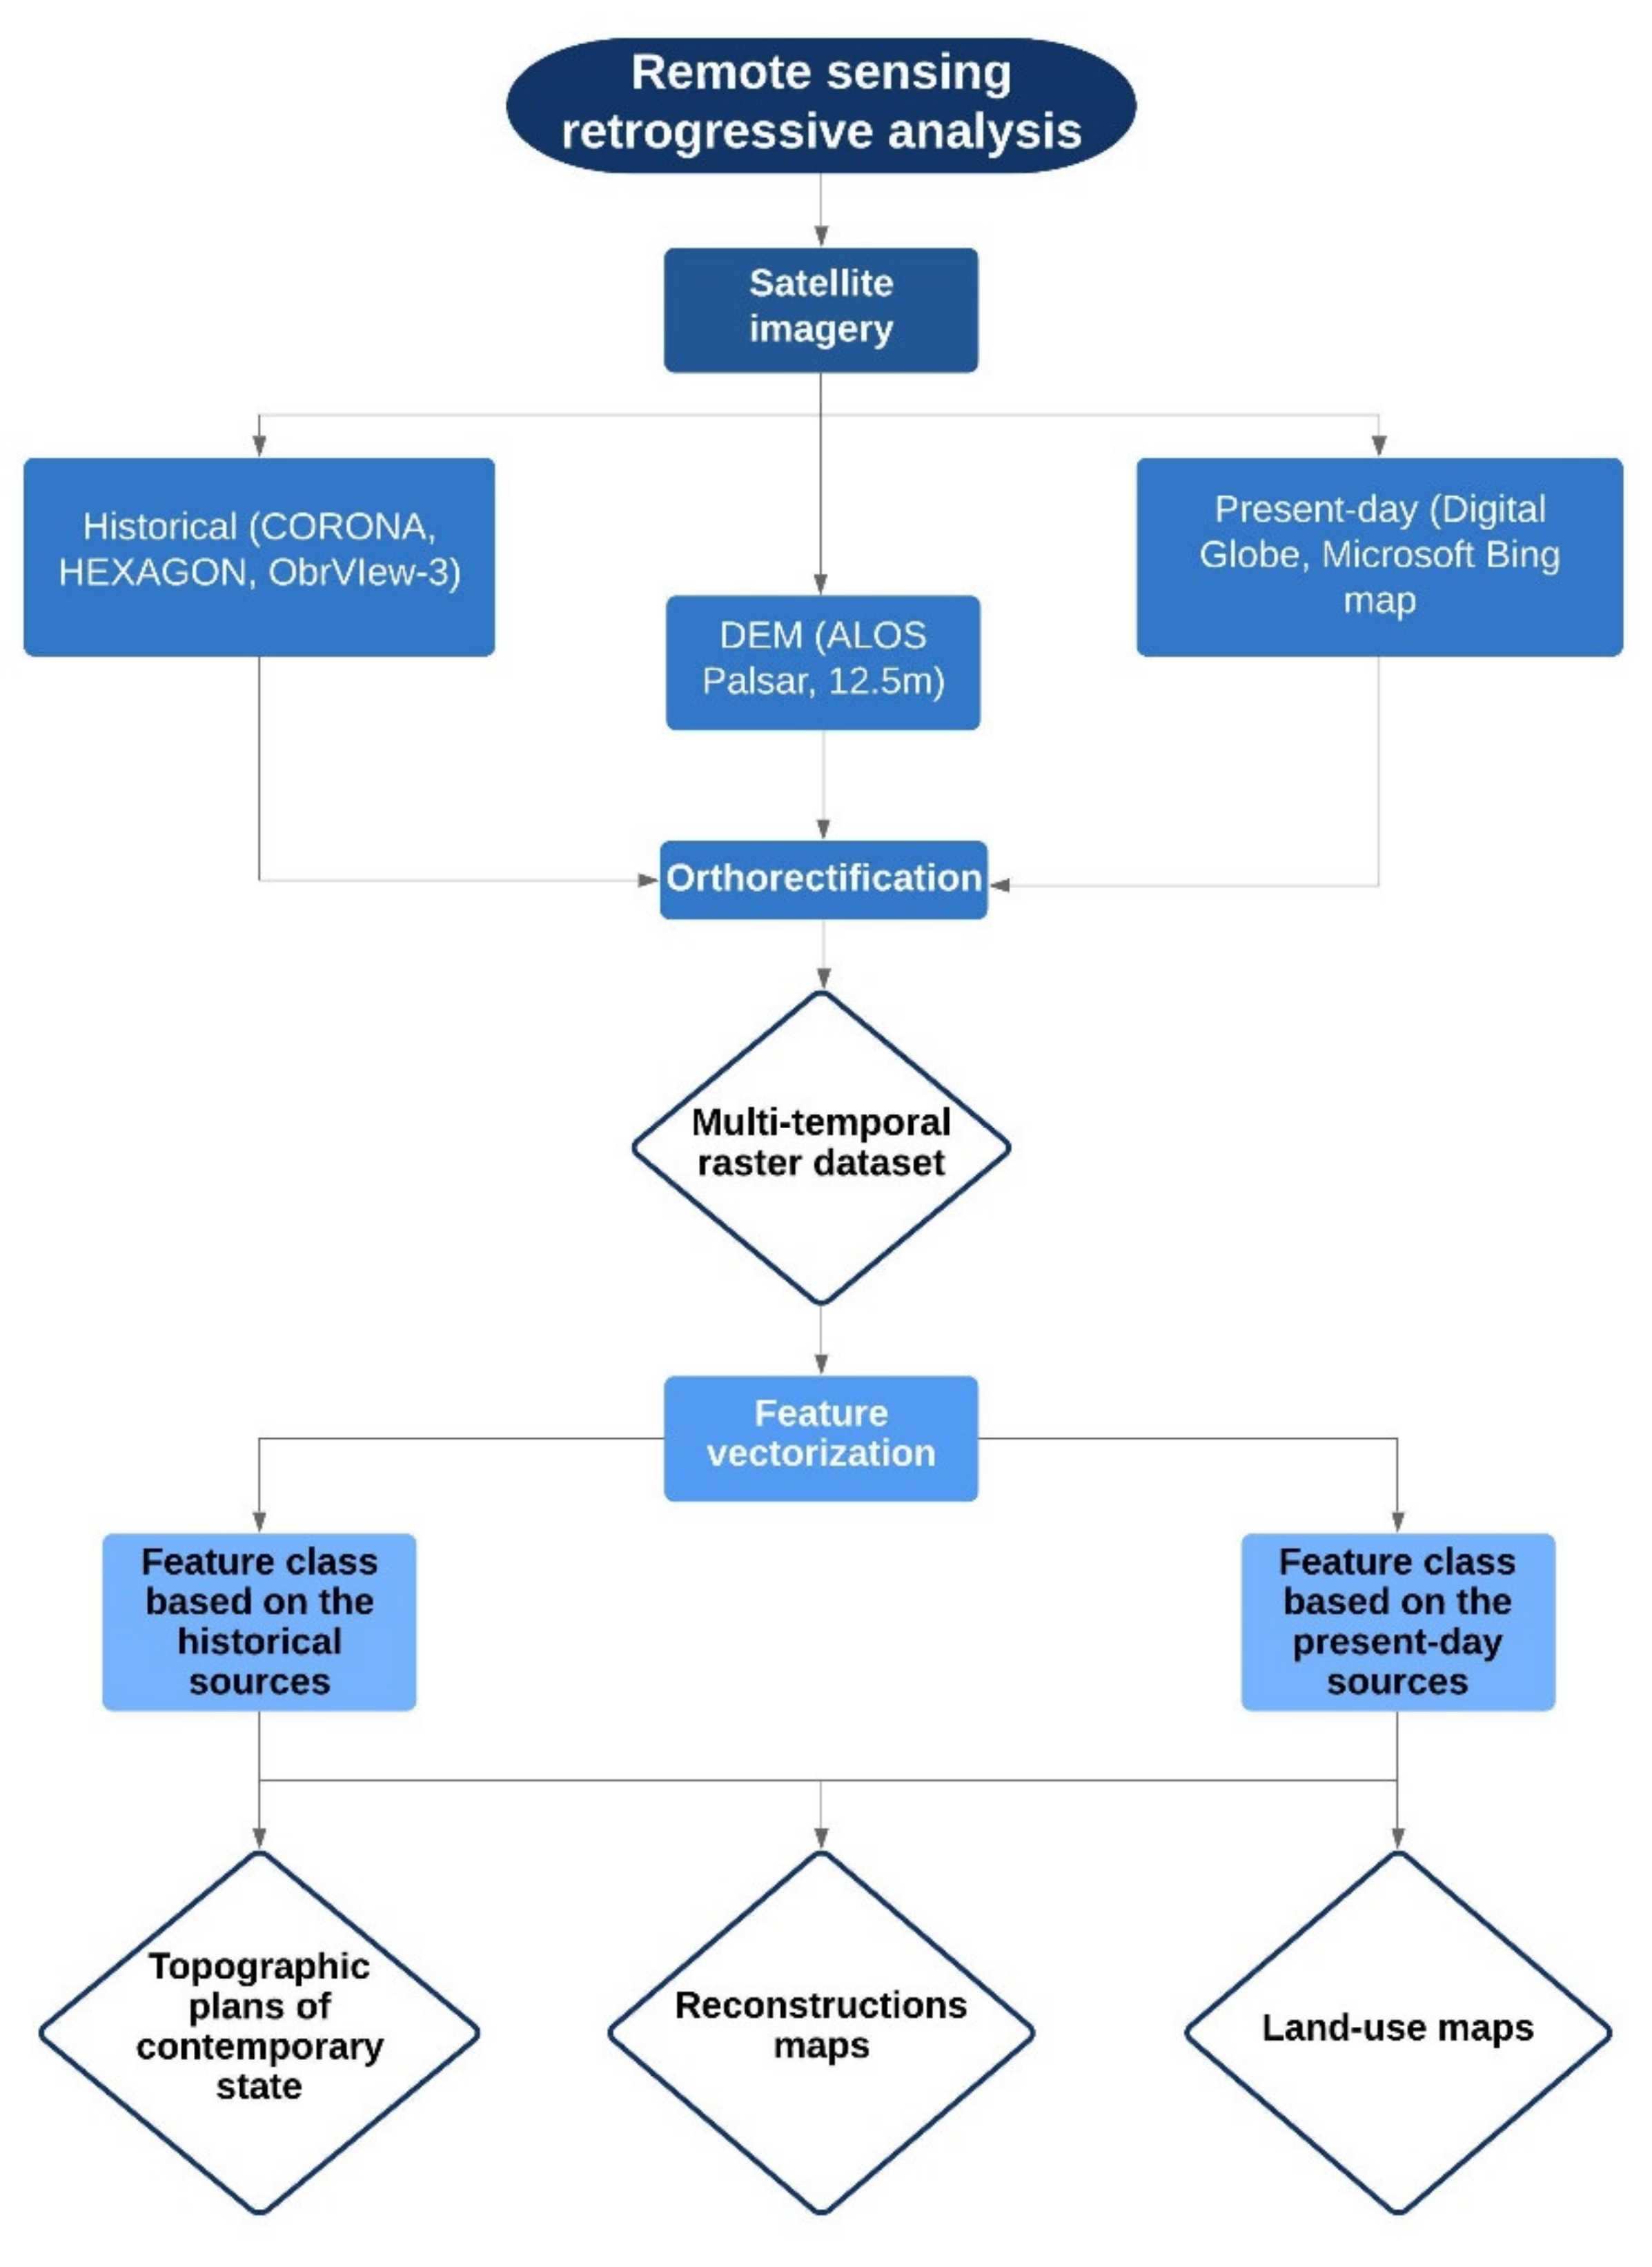
To obtain the most accurate chronological topographic plans of the village, we adopted the so-called multi-temporal approach. In this procedure, mapping and topographic analysis of images are performed on several mutually combined data of different resolutions [
36,
37,
38,
39]. Lower-resolution images are used to analyze the background (rural area) of the village core itself, while very high-resolution images are used to map the urban area (
Figure 4).
3. Case Study—The Partly Deserted Village of Qazbagi (Iraqi Kurdistan)
The Qazbagi village (also known as Qāzbakī, Qazyakan, Qazbatya, قزبكي; 35.9636147 N, 44.8243258 E) lies at an altitude of 700–750 m above sea level, in the region of the Koya (Koisnjaq) district, Erbil Governorate, Iraq. The village is located about 20 km southeast of the city of Koya and 8 km north of the Little Zaab river at the foot of the Haibat Sultan Dagh mountain range, under a massive Proluvial gravel-sand cone. The topography of the village of Qazbagi can be characterized as that of an agricultural village of irregular cluster plan with a central road that leads to the village from the west and turns north (
Figure 5).
Preprocessing of the input data collection primarily involved preparation and editing of historical satellite images. All the images, obtained via the USGS Earthexplorer platform in digital form, first had to be clipped to a size that covered only the area of interest, thus significantly reducing the demands on hardware requirements for high-volume data processing (KH-9 Hexagon images have a 6–7 GB size per single image). This step was followed by a phase of georeferencing and orthorectification of partial images onto the base layer and DEM. The satellite image (2019), freely available from the ESRI portal, was chosen as the background layer for georeferencing. DEM Alos Palsar (resolution 12.5 m) was used for orthorectification. In the context of research into the urban environment and in an effort to obtain the most accurate background layers for analyses, this distinction is not very appropriate but, in our case, it is (currently) the only one available. Georeferencing and orthorectification were applied manually in the ArcGIS Pro software environment.
When georeferencing data of various origins and resolutions, it is always necessary to confront the issue of positional deviation of images, which is caused by the extensive variability of image skew according to the parameters during acquisition. Especially in the case of large-format KH-9 Hexagon images, the position of the area of interest within the image is crucial. If it occurs at the edge of an image, the amount of distortion is skewed by 20° or more. It is necessary to deal with this issue during the preparation of the dataset and consider the effectiveness of using an image with such a high degree of distortion of topographic data outside the image center. As part of the analysis of the topographic development of the Qazbagi village settlement, images in which the village was captured at an angle of inclination of more than 10° were excluded. The resulting dataset for topographic mapping had a total of six underlying rasters. Five images represented the outputs of the KH-9 Hexagon system in chronological order from the oldest to the most recent (1972–1975) and one was generated by the OrbView-3 system. Very high-resolution images of freely available map systems were used to create a layer of the current appearance of the village. Vectorization (digitization) of surface anthropogenic relics in this case was implemented manually was implemented manually. Semi-automated pixel-based analysis and object-based analysis were excluded due to the high variability of the morphological aspects of features. Within the vectorization, it was necessary to combine all the available views of the area of interest to achieve the most comprehensive result. In this regard, the need to use a multi-temporal approach with remote sensing datasets is readily apparent (
Figure 6).
Individual features were digitized according to two basic categories: chronological and functional classification (buildings, field system, water streams, roads). The resulting descriptive system in the form of a personal geodatabase thus enabled the creation not only of interpretive plans of the village, but also of chronological topographic plans of the built-up part of the settlement area, reflecting developments and dynamic changes from the 1970s to the present. The main goal was, of course, to capture changes in the settlement structure of a nucleated village.
4. Results
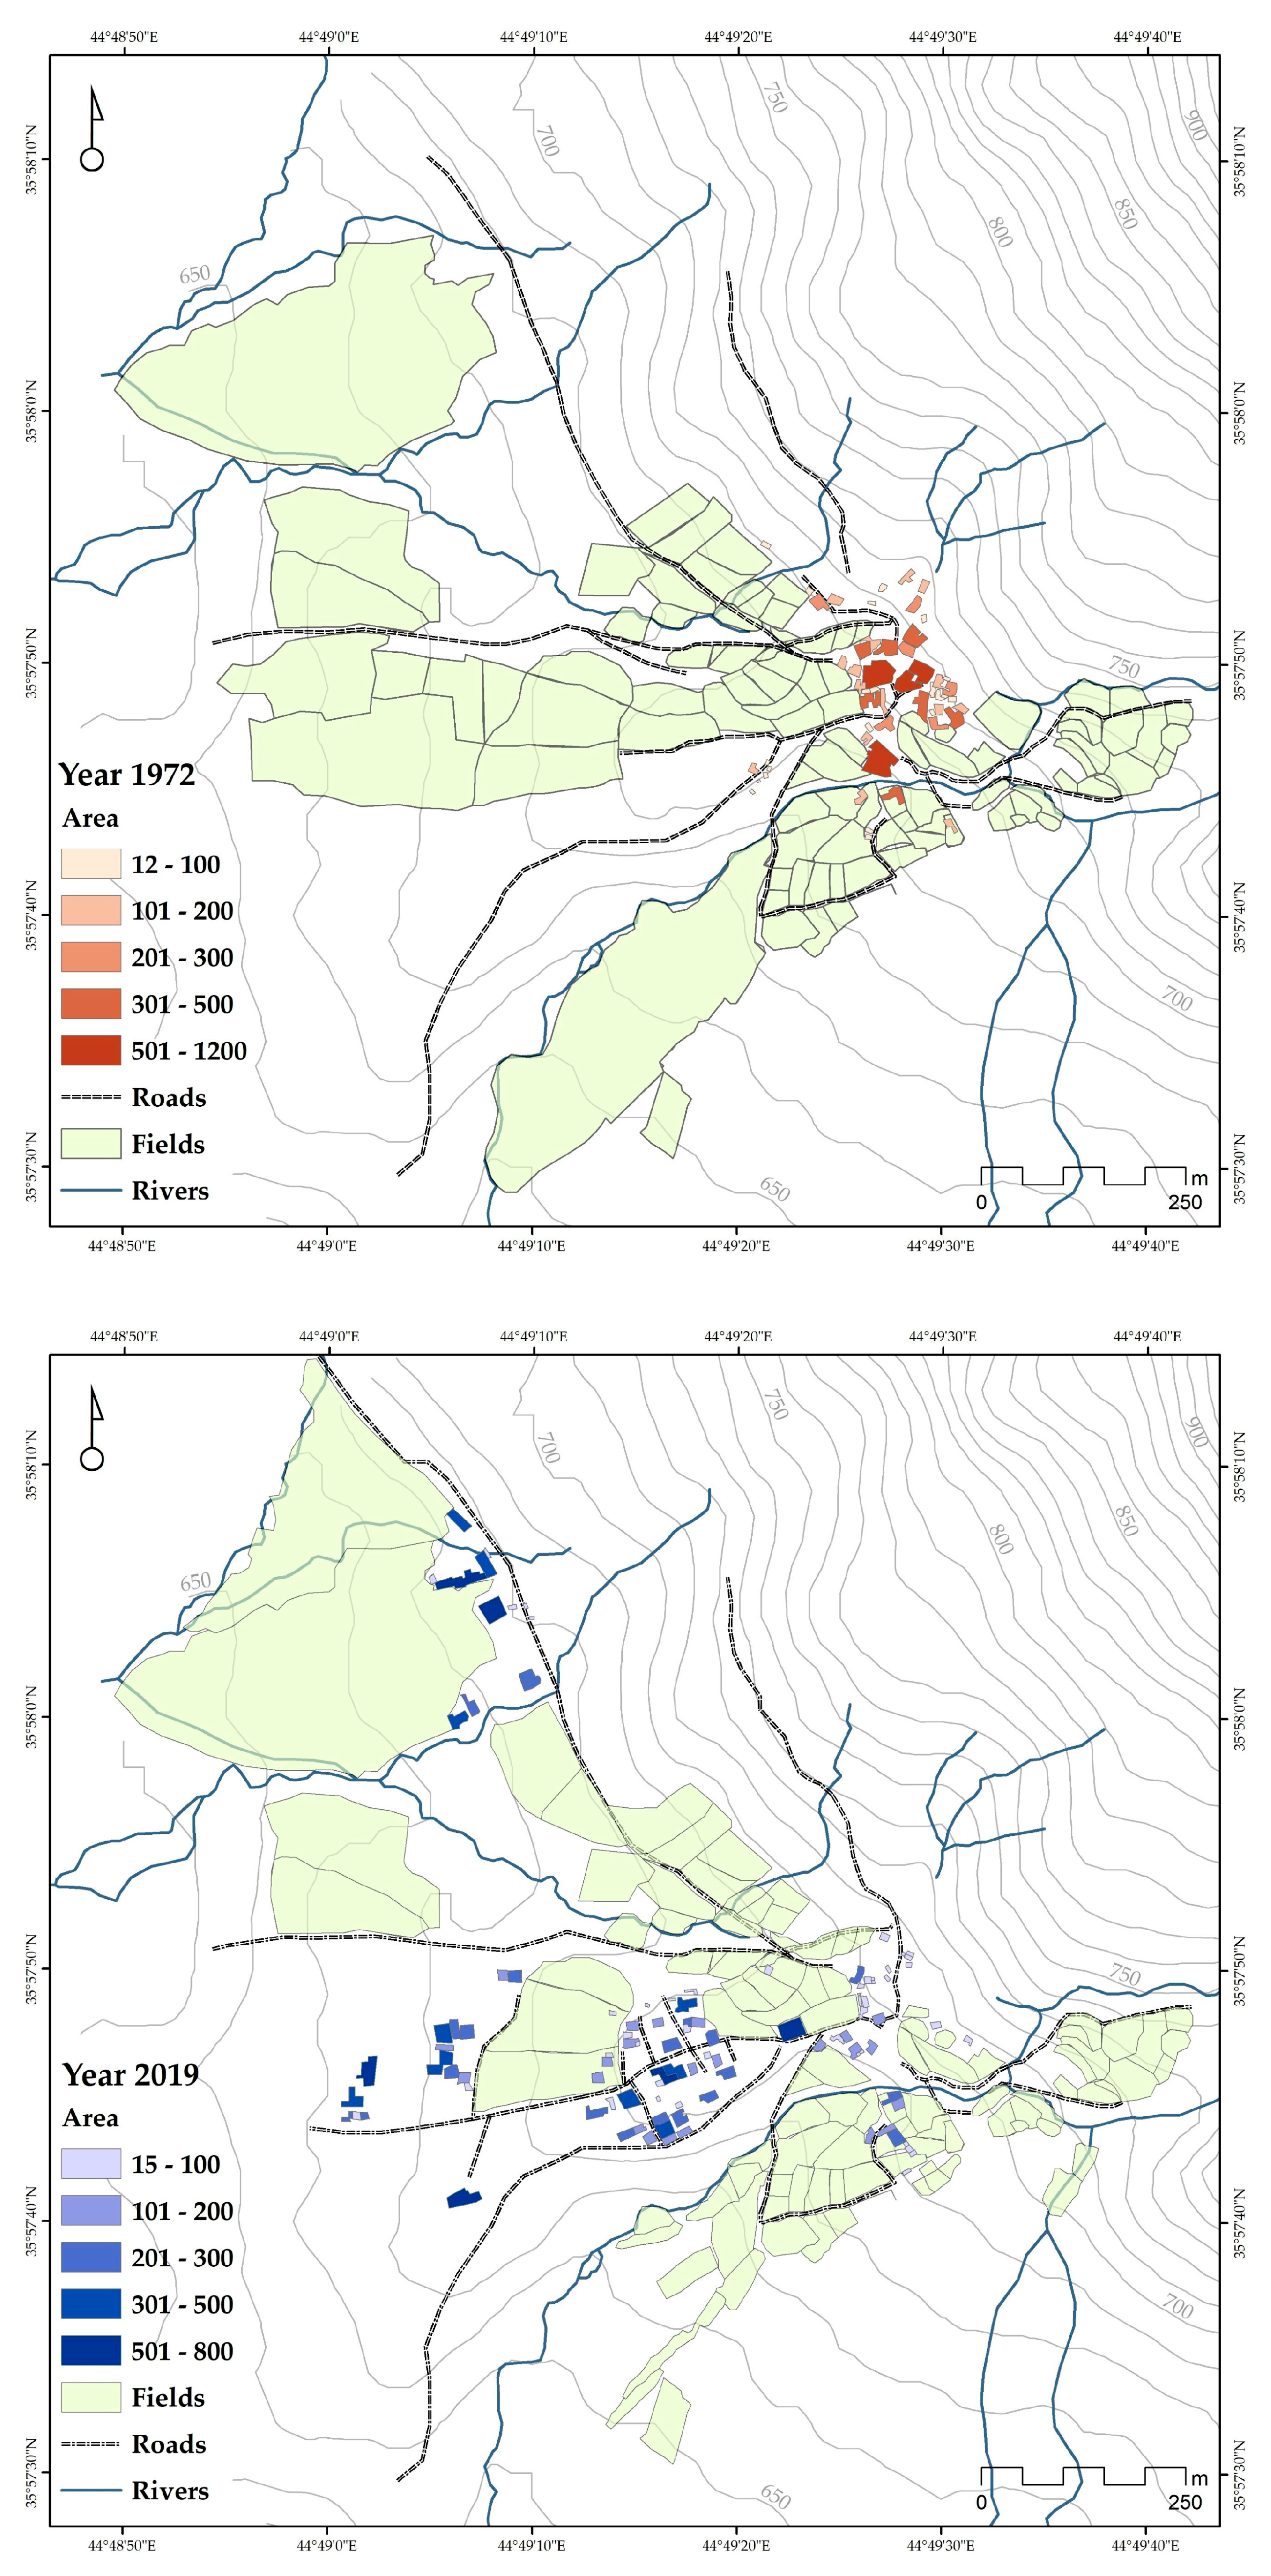
The oldest historical satellite images (KH-9 Hexagon system, 1970s) offer a view of the village and its layout before the period of massive landscape changes due to the al-Anfal campaign. In these images, the village of Qazbagi can be characterized as a medium-sized settlement unit with approximately 30 homesteads and a complex built-up area of 10,924 m2. The size of the buildings ranges from 12 m2 (farm extensions) to 500–1000 m2 (central buildings in the village core). The village has a disorganized cluster plan, oriented north–south. Three parallel main roads extend from the western part of the urban area and end in the village. The remaining roads are closely related to field systems, with a rather local-economic function. The position of the village is adapted to the morphological conditions of the landscape—it is situated in the depression at the foot of the ridge, around the confluence of two branches of the stream, protected from the north and partly from the east by the Haibat Sultan Dagh mountain massif. On the southern, western, and southeastern sides of the urban area, the landscape provides sufficient space for agrarian farmland. This farmland, composed of irregular plots which are grouped into strips according to the morphological situation, is limited in the south by a barren Proluvial cone. The field systems in a radius of 1 km from the center of the village cover an area of 41 hectares. The size of the fields varies. Closer to the village center, we find fertile areas with a radius of about 0.2–0.3 ha (probably vegetable gardens). In more remote areas, the sizes of the fields are up to around 5–8 ha.
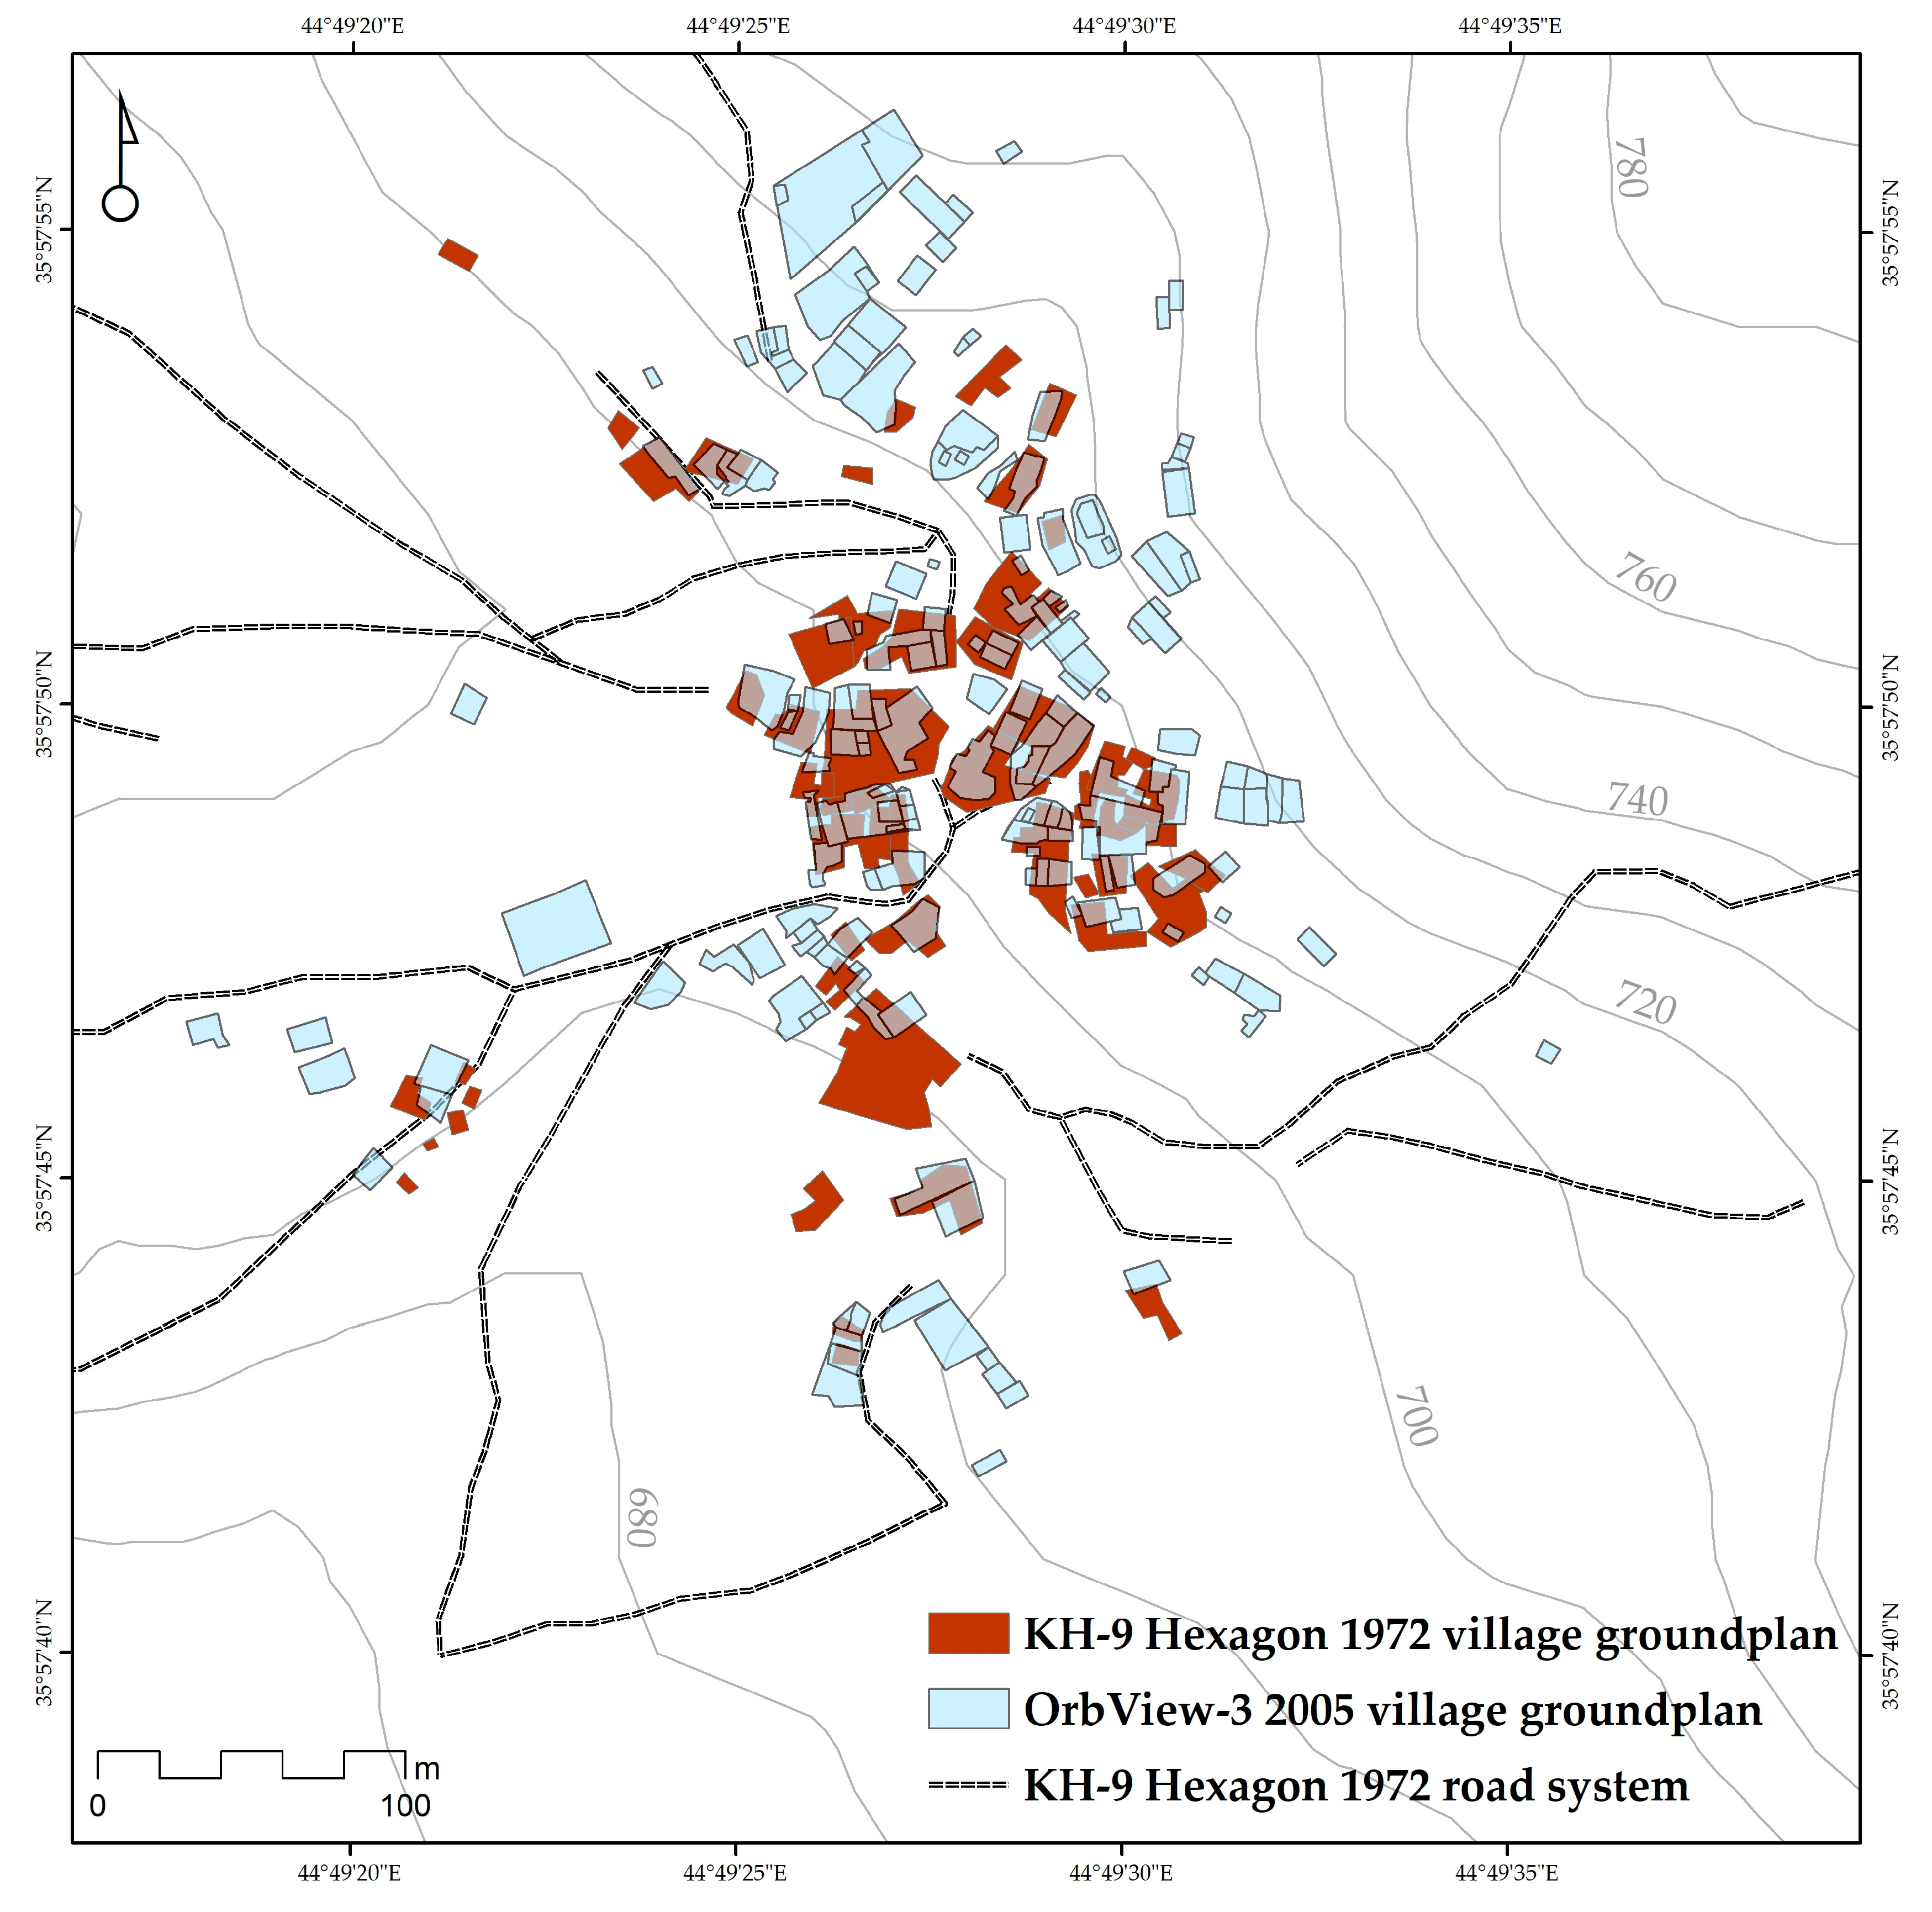
The change in the settlement structure in the modern period (after the year 2000) can be determined by comparing images captured at three different times. The earliest image comes from the OrbView-3 collection and dates from 2005. The second is taken from the Microsoft Bing maps distributor and was acquired in 2013–14. The third is a recent satellite image from 2019. According to OrbView-3 (2005), the layout of the village area has undergone significant changes, but to analyze the immediate impact of the military operation in 1988, it is necessary to add older images to the dataset. The initial presumption of the impact of Operation al-Anfal on the village of Qazbagi was confirmed by comparing the images. The irregular ground plan of the village is preserved, but its arrangement, the ground plans of the buildings, and the number of homesteads have completely changed. Only three of four newly built homesteads can be identified based on the ground plans of the original buildings, but it is unclear whether these are the preserved cores of the original houses or new houses with a layout and position very close to those of their predecessors. The village core expands to the steep slope of the ridge to the north and northeast of the original development. Other newer constructions can be recorded in the western part, but also in the southern part—in the locations of the original field plots. The extent of the inhabited area has increased to a total area of 17,712 m2.
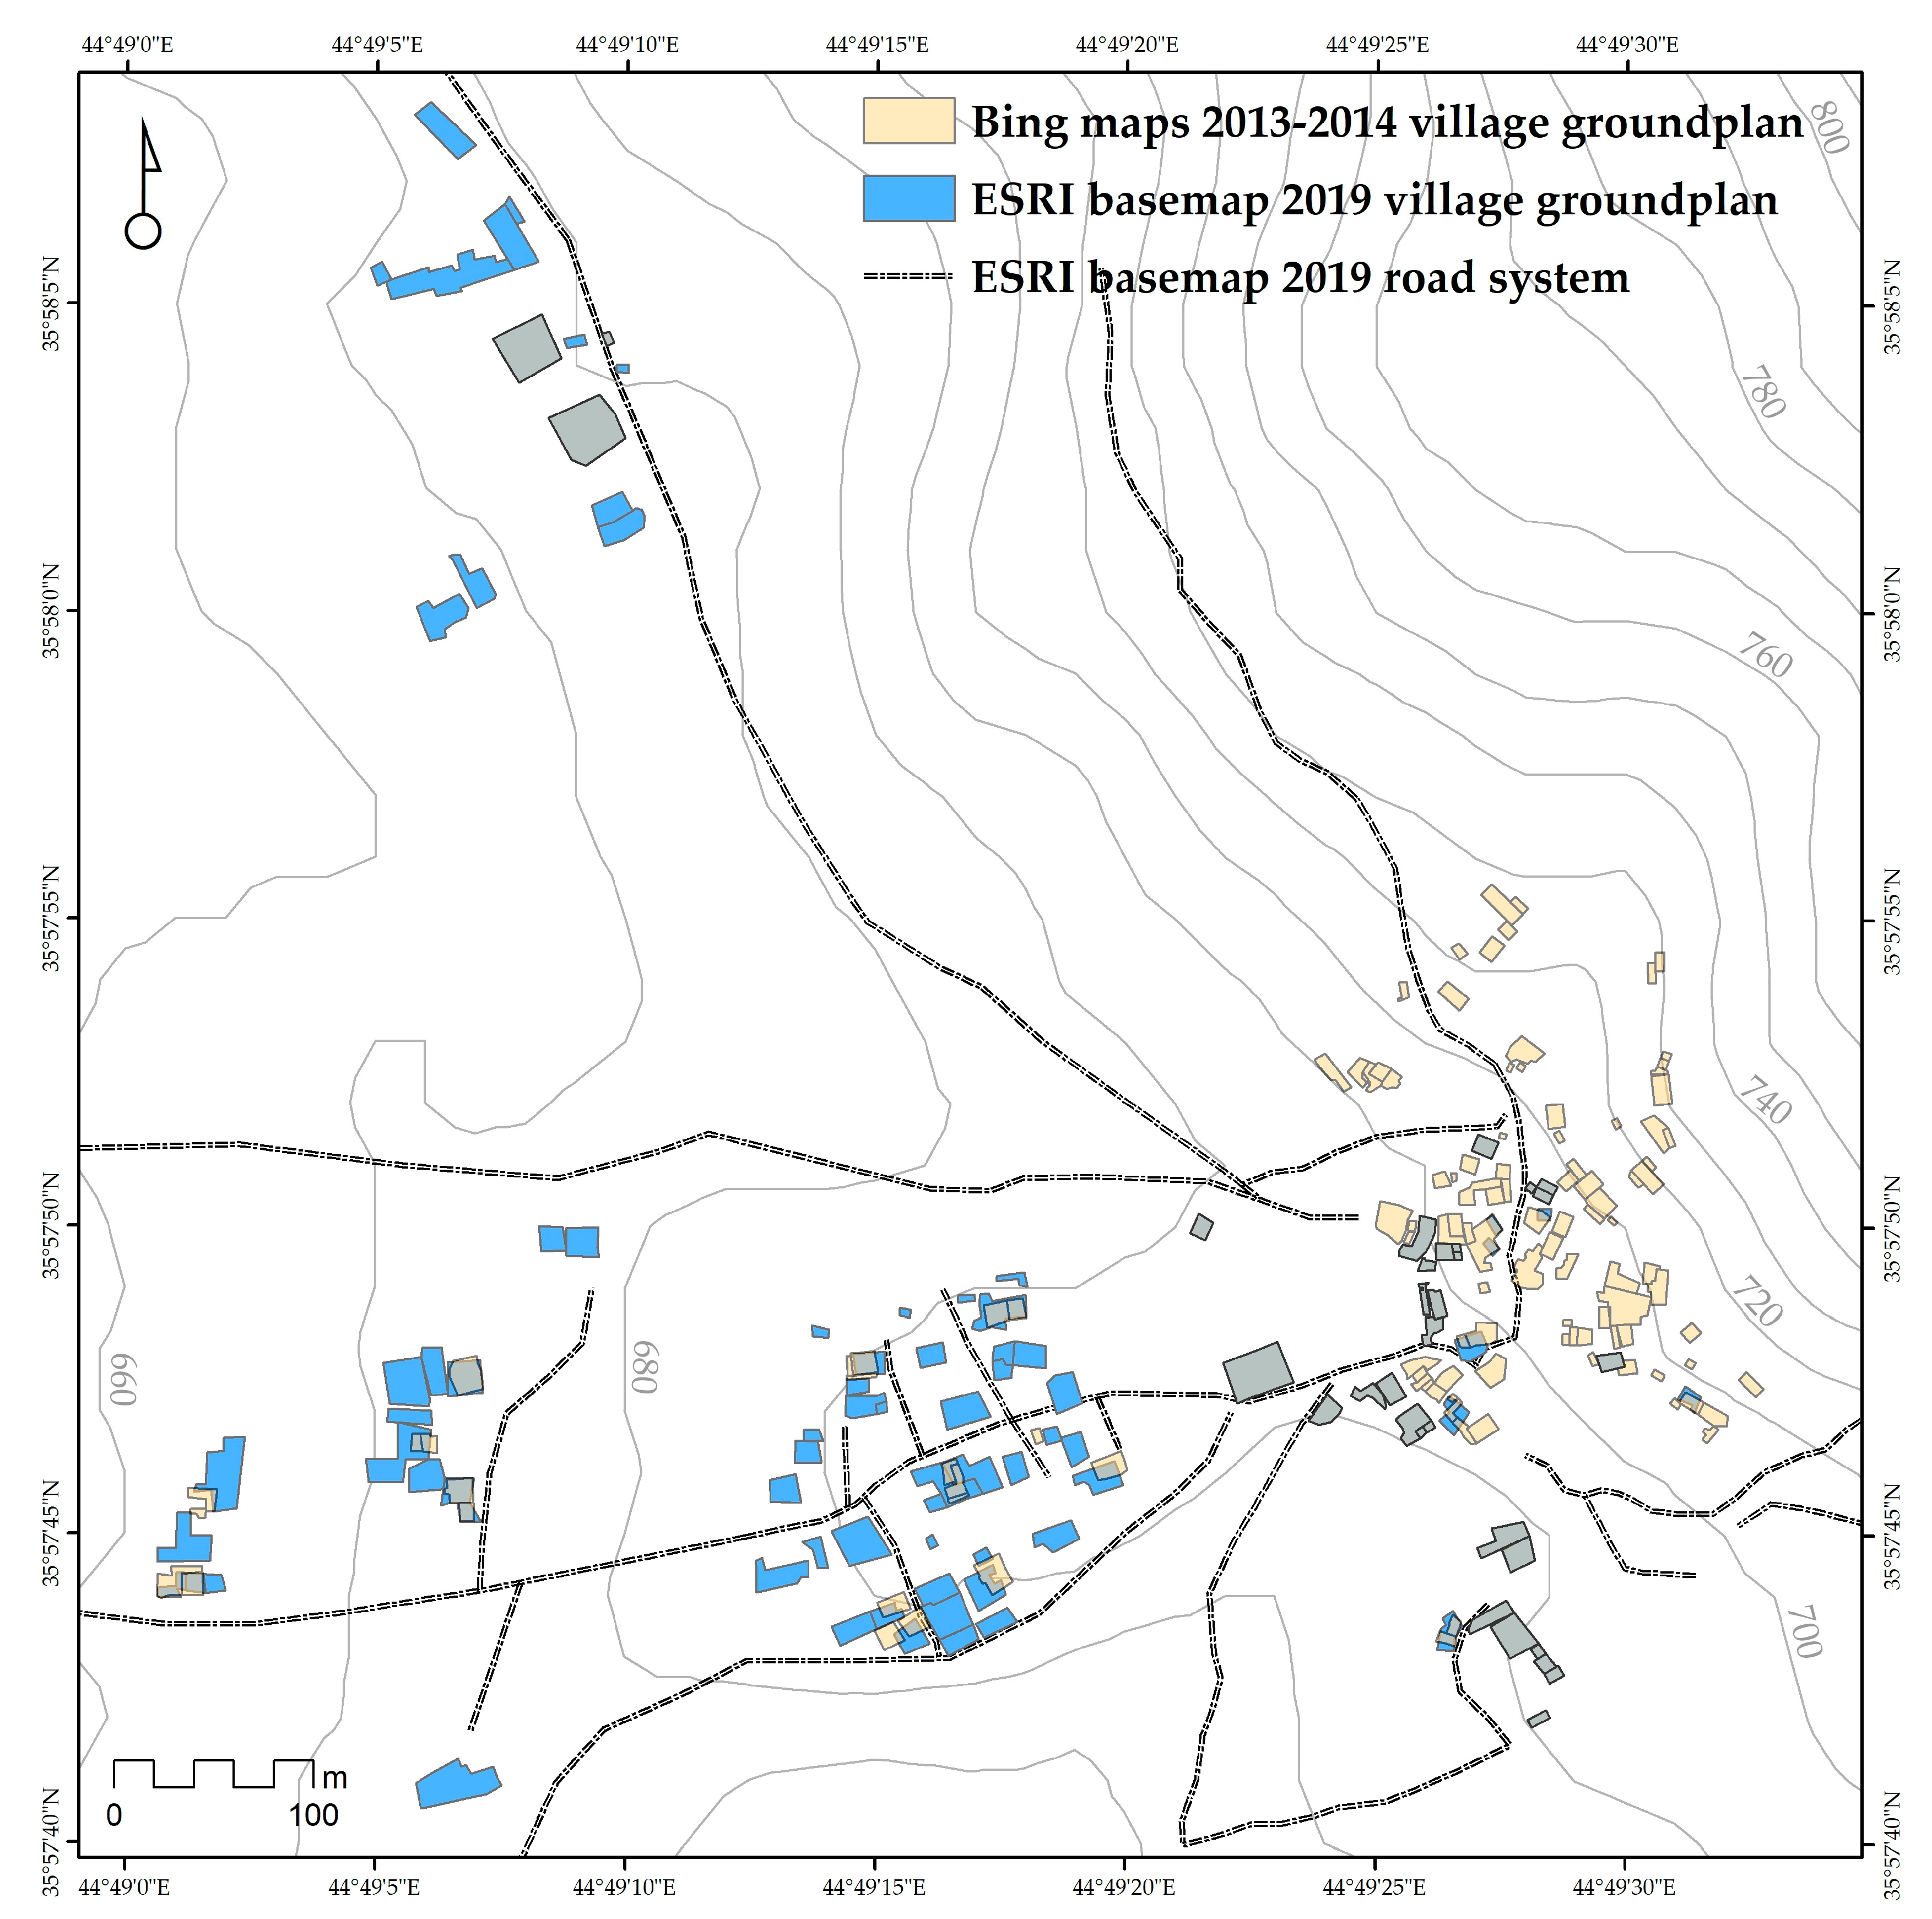
A freely available, very high-resolution image from the Microsoft Bing maps distributor, dating from 2013–2014, shows the ongoing transformation of the Qazbagi development. Most of the buildings on the northern edge, visible in the 2005 image, are abandoned, as is the distinctive building (or complex of buildings) on the easternmost side of the village. At the same time, abandoned and partially demolished buildings can be observed in the core of the village. New construction of buildings continues mainly in the western area along the road connecting the village with the main road in the region, and two new homesteads can be detected as separate units approximately 650 m northwest of the village (
Figure 7).
The last, most recent satellite image from 2019 proves that within five years of the previous image having been captured, the transformation of the village’s core was complete. The original core of the village, restored after 1988, is almost completely abandoned, and the development has moved west from its original site to what had been cultivated land. Here, a new village core was established. Of the original homesteads of the village core, only fractions are still standing. Most of the houses were destroyed and dismantled. The area of the current village is 19,108 m
2, and the difference is most visible in the original center, where the area fell from an original size of 6242 m
2 in the years 2013–2014 to a new value of 1798 m
2. The new development is concentrated in two areas, which are connected via the main road to the main regional expressway (
Figure 8).
According to the analysis of the images, the rural area of the village was not affected by these dynamic changes to the same extent as the village core. The disposition and size of the field systems of the oldest period (KH-9 Hexagon image) mostly correspond to the extent of cultivated fields even today (evaluated using the image from 2019). The area of fields recorded in the 1970s was 41 ha and in 2019, it was 34 ha. As a result of the new construction activity in the western part, the original agrarian fields, which were already captured here in the oldest picture, are necessarily disappearing; however, the addition of several fields in the northwestern part of the village compensates for this loss. A small change in the disposition of field systems is the abandonment of some of the smaller northernmost fields in the northeastern area. However, these terraced fields were difficult to access due to their location on a steep slope. The plots below them are well connected to the road and are not so steep, so they remain cultivated to the present day. The southernmost large field plot, which was captured in the oldest picture, and whose former boundaries remain partially visible, is no longer cultivated (outside its peripheral areas). The reason is probably the low fertility of the soil in contact with the Proluvial gravel-sand cone.
The village’s communication network remains largely identical to the older road network. The only changed area is the western part, where the road network is evolving along with the expanding construction of new homesteads. The residential area as well as a rural area road network is visibly connected to field systems and is thus maintained in an operational condition even today. The field system has a close connection to the local hydrological network. The village of Qazbagi is crossed from the northeast by the main mountain stream, which passes through the southern part of the village core and continues to the southwest. The second source of water is visible at the northwestern edge of the village. Both of these main streams can be observed in historical images and in a minimally altered form in the current image. Due to the specific geomorphology of the terrain, no significant change in water meanders can be expected. The network of watercourses is natural (of mountain origin), regulated only to the extent necessary for field irrigation. Adaptation to water resources is very evident in the agricultural land distribution system, where the connection of an irrigation system to a water resource is key to successful crop production (
Figure 9).
5. Discussion
The analysis of historical images as a means of monitoring the developmental stages of village settlement produced very good results. Currently, the wide range of available high-resolution data offers opportunities to deepen our understanding of urban landscape based on remote sensing data. However, from the point of view of data unit processing, it is necessary to point out a few facts. Currently, the most suitable underlying freely available images by far are the KH-9 Hexagon images. However, it is necessary to precisely georeference these images and, above all, to combine several images from different missions. It is insufficient to rely on only one source (in this case one mission) in the elaboration of topographic site plans. The visibility of features depends on several factors. One of the most important is the shooting period. As in the case of the CORONA system, the ideal images come from the winter period, when there is dormancy and especially when the soil in these areas is sufficiently irrigated to make visible not only cropmarks, but especially soilmarks. To emphasize the visibility of these marks, suitable tools are post-processing image adjustment in the form of resampling, stretch type changing, and balancing of contrast parameters, or tonal adjustment using the gamma value. At the same time, it is necessary to take into account the location of the site within the image and its degree of distortion. Images that often have increased distortion outside their central point (both vertical and horizontal) caused by the non-perpendicular position of the cameras must be taken as additional parameters. Where they are used, increased topographical deviation during georeferencing and subsequent digitization must be taken into account. The morphological parameters of the mapped features become inaccurate in this case. An important factor that plays a significant role in the usability of images is the cloud cover that often obscures some of the features on the ground.
Topographic analysis of a combination of historical and current remote sensing data demonstrates the need to use a multi-temporal approach to obtain an objective and realistic evaluation of the situation. Changes in the urban landscape can be detected using suitable data sources even when there is no possibility of direct field research of the site. The topographic development of the village of Qazbagi, observed in two main time periods (the 1970s and the beginning of the new millennium), demonstrates how well the changes in the layout of the village and its hinterland can be captured. Of course, the time span of almost 50 years presupposes the capture of a certain development of settlement activity and changes in the landscape. In the case of the model village of Qazbagi, we can speak of a two-stage transformation of village settlement, starting with the destruction in 1988 and ongoing resettlement, and completed by rapid, radical modernization in the second decade of the 21st century. The rapid course of extinction processes is amplified by the active involvement of the inhabitants, who dismantle defunct homesteads into building materials, threatening a number of the original village settlements (
Figure 10).
Thanks to the involvement of basic research in oral history and field research verification, we were able to better interpret the developmental stages of the village, described on the basis of topographic analyses. The oldest form of the village offers a view of the original layout of the modern settlement, which can be characterized as a closed settlement unit, surrounded by extensive agrarian land with a close connection to water resources and irrigation systems. The appearance of the modern village, captured at the beginning of the new millennium, clearly shows a significant change in structure due to the total destruction of the original buildings during al-Anfal and subsequent resettlement. According to local witnesses, the strategically located village of Qazbagi was a base for Peshmerga (members of Kurdish armed militias) in the 1980s. Mainly for this reason, about a hundred soldiers were killed during the operation, and many women and children lost their lives as well. According to oral information, part of the original population returned after the tragic period of the Kurdish genocide and restored the settlement of Qazbagi on the site of the original buildings. Gradually, the settlement grew into the form visible in the OrbView-3 image from 2005. The settlement of the northern and northeastern slopes above the village center was associated with a traditional way of life in which pastoralism played a key role. The northern buildings were mostly shepherds’ houses and mountain huts for cattle, which were kept in nearby large enclosures, visible on the slopes of the mountains about 100 m above these houses.
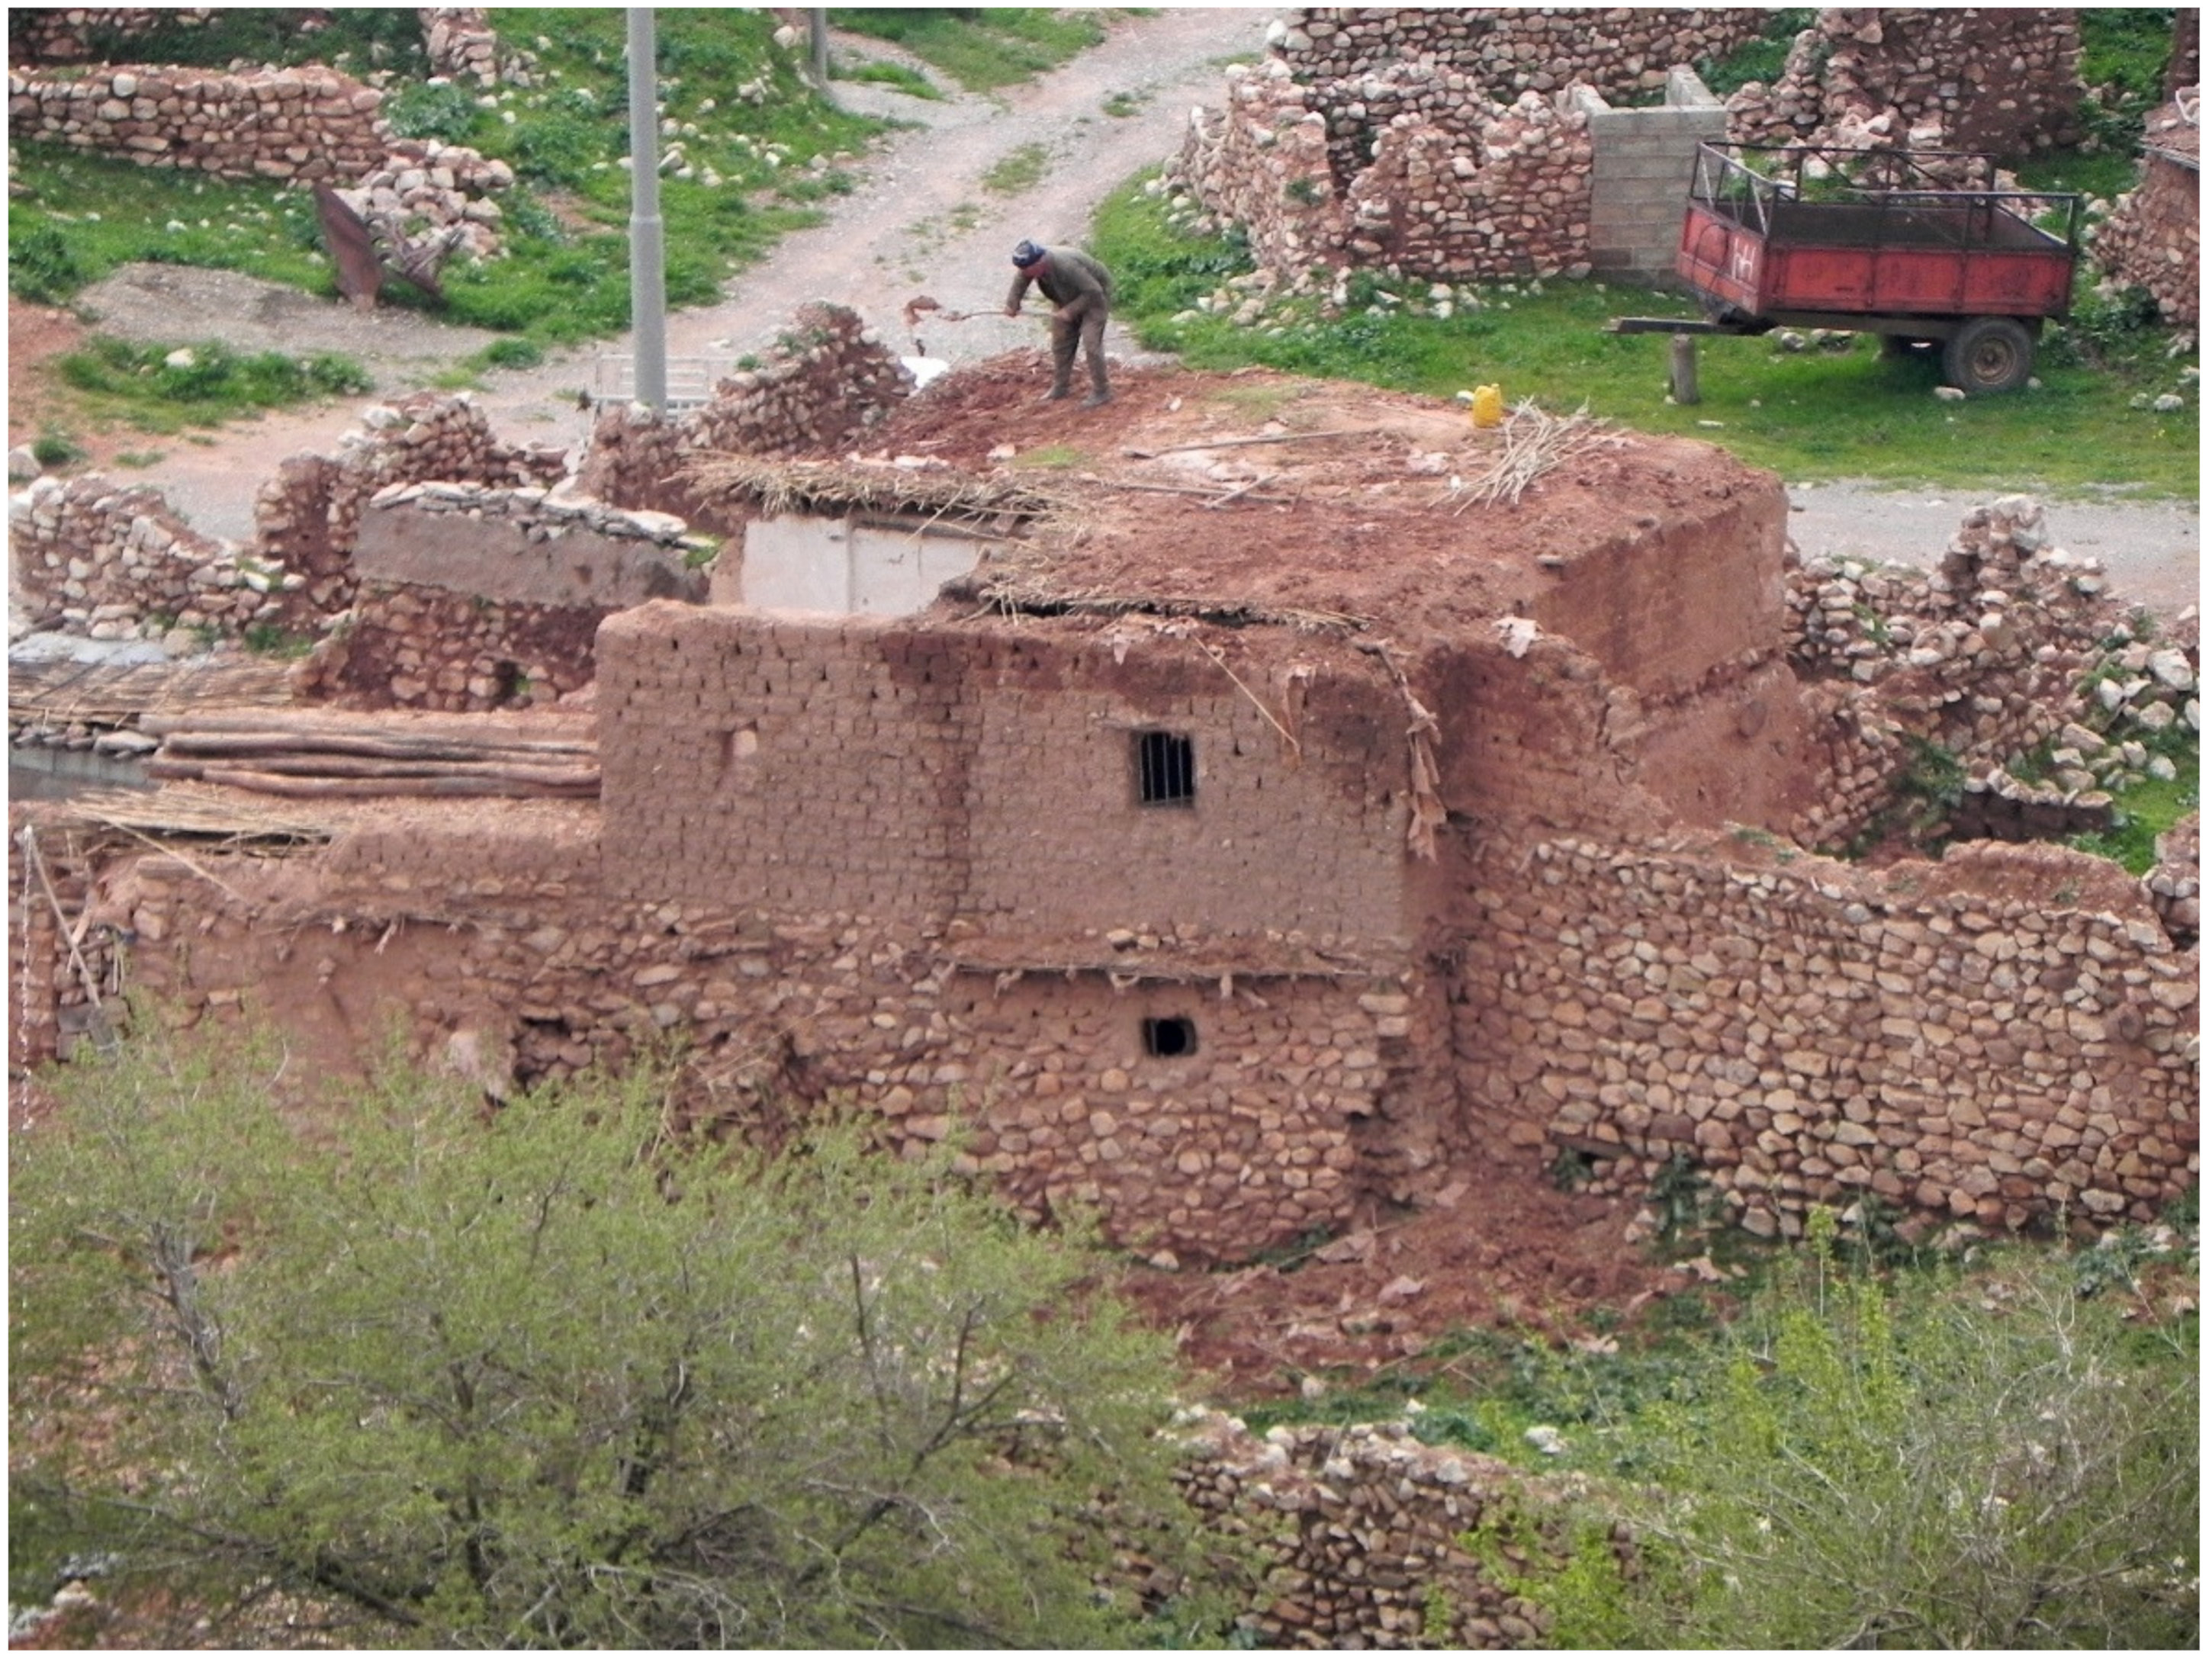
Subsequent changes in the settlement structure of the village of Qazbagi over the last decade can clearly be associated with the decline of traditional pastoralism and a change in the social structure of the population. The gradual relocation of the village of Qazbagi to the open space west of the original site is caused by a change in building culture and a professional and social change in the village. This transfer may also be related to the targeted settlement of fields by inhabitants of the original village core who wished to move to a new area without being forced to buy new land. In order to establish this, for certain it would be necessary to investigate the property rights of the population. The clay, fenced areas of houses with large central courtyards, is replaced by concrete villas with gardens and minimal household facilities. The rapid demise of the original buildings, exacerbated by manual dismantling by the locals, is clear evidence of this. The reason for the relatively substantial efforts of local residents to dismantle the buildings is their desire to obtain one of the most valuable building materials in the Middle East: wood in the form of machined poles and beams. This is often used for the construction of ceilings and load-bearing structures (
Figure 11).
The establishment of a new location for the Qazbagi village west of the original core was not accidental. Its location near the original site is caused by a factor that generally significantly affects the global settlement system of the Middle East: the availability of water resources for the connection of irrigation systems. In the case of the village of Qazbagi, based on image analyses, two main water sources were recorded, crossing the original village in its northwestern and southeastern parts. The position of the newly established village is located exactly between these two streams. The importance of the close presence of the water system is documented especially in the analysis of the disposition of field systems in the rural area of the village. Field systems, as already mentioned, appear to be a stable element and not subject to transformation. This fact testifies to a very close connection to the distribution of irrigation systems, which may have been functional in their current form for several decades to hundreds of years [
40,
41]. This topic was monitored and analyzed within the Archaeological Survey of Koi Sanjaq/Koya (ASK) [
42]. From this example, it is possible to evaluate how easily and quickly residential units can be completely transformed, but systems that are conditioned by a stable connection to natural resources cannot be easily modified. This knowledge could also be helpful in future surveys of extinct village settlements, where very often only the original signs of plowing are preserved on the terrain (whether in the sense of above-ground relics or cropmarks and soilmarks). The spatial disposition of these systems presupposes their long-term stability and connection to a nearby settlement village structure, in which case they can help to predict the original locations of extinct settlement units.
6. Conclusions
Remote sensing archeology of the Middle East is currently experiencing a certain divide in standard methodological procedures due to the release of images generated by the KH-9 Hexagon system in digital form. Images of the KH-9 Hexagon system with a resolution of up to 0.5 m can be used for comparison with datasets reflecting the current state of the land, and their prospecting is not limited to the detection of anthropogenic relics, but can assist above all with the detailed mapping of individual features on the ground.
This reality, together with the fact that the newly available historical satellite images open up the possibility of obtaining further data for a multi-temporal approach, offers new opportunities for research in urban landscape archeology—especially in areas of highly endangered or already destroyed cultural and historical heritage. The speed of documentation plays an important role in such topics. Archaeological research through remote sensing data allows effective and detailed analysis of large areas and can thus be used to assess the degree of threat and conservation status. The case study of the Qazbagi village is direct evidence of this. The long-term stable village unit was deployed in the range of five years (2014 to 2019), and it is likely that the built environment of the original village will disappear in the near future. The question is whether in the next five years we will be able to detect in the landscape the original location of the village during such rapid transformation processes. It will probably only be possible to capture components that belong to the suburbs, but the built environment itself will disappear. At present, traditional nucleated villages in Iraqi Kurdistan are becoming a critically endangered type of monument environment, and it is therefore necessary to include them in archaeological projects and research on landscape of Iraqi Kurdistan.
The study of modern village settlements offers a unique opportunity to expand the interpretive basis for research of the landscape development of northern Iraq. Archaeological projects based on landscape data collection and analysis in this region usually end in the medieval and early modern periods and focus only to a minimal extent on the areas of living or recently extinct villages. Continuity of settlement in close connection with natural conditions and communication systems presupposes a stability of settlement for long periods. Research on villages of the 20th century—specifically before 1988—offers the possibility of retrogressive analysis, i.e., controlled projection of knowledge back into the past. The retrogressive remote sensing analysis provides further indications that the al-Anfal operation artificially disrupted the natural development of the village settlement and changed its structure, both in terms of its landscape and its demographics. To follow the direct evidence of this critical period of the 1980s in terms of landscape archeology; however, we would need to supplement the source base with remote sensing data reflecting the period just before and after the individual operations. Unfortunately, such data are not yet available. In addition to the remote sensing data, direct evidence provided by anthropological research (oral history) and an analysis of textual reports about al-Anfal also need to play a substantial role.
The second milestone in the development of the village settlement structure is the social transformation of the Kurdish countryside in recent years due to the abandonment of traditional pastoral lifestyles and the search for new jobs that require a different form of homestead and better access to larger cities (i.e., connections to major roads). The dynamics of the village’s spatial change that were surprisingly revealed in the remote sensing dataset analyses reflect the rapid social transformation of the countryside that is currently taking place throughout southern Kurdistan. As this study shows, such changes are occurring very rapidly, and it is necessary to respond to them quickly from the point of view of monument care. A very important part of the research on nucleated villages is research into their background—especially field systems, which represent one of the most stable units of residential areas. Landscape archeology and the use of remote sensing represent tools that can be used to document and analyze these changes. However, in terms of interpretation, this form of research must be combined with other disciplines that complete the picture of the past and present landscape and village life. Through multidisciplinary research on nucleated villages, we are able not only to reconstruct the original landscape and structure of the village itself, but also the social context economic returns, property, and legal relations of this fragile and highly endangered built environment.
