Article

Aerodynamic Characteristics of Coupled Twin Circular Bridge Hangers with Near Wake Interference

1
Key Laboratory for Wind and Bridge Engineering of Hunan Province, College of Civil Engineering, Hunan University, Changsha 410082, China
2
College of Civil Engineering, Hunan University of Science and Technology, Xiangtan 411201, China
*
Author to whom correspondence should be addressed.
Appl. Sci. 2021, 11(9), 4189; https://doi.org/10.3390/app11094189
Submission received: 10 March 2021 / Revised: 19 April 2021 / Accepted: 19 April 2021 / Published: 4 May 2021

Abstract

:
Much work has been devoted to the investigation and understanding of the flow-induced vibrations of twin cylinders vibrating individually (e.g., vortex-induced vibration and wake-induced galloping), but little has been devoted to coupled twin cylinders with synchronous galloping. The primary objective of this work is to investigate the aerodynamic forcing characteristics of coupled twin cylinders in cross flow and explore their effects on synchronous galloping. Pressure measurements were performed on a stationary section model of twin cylinders with various cylinder center-to-center distances from 2.5 to 11 diameters. Pressure distributions, reduced frequencies and total aerodynamic forces of the cylinders are analyzed. The results show that the flow around twin cylinders shows two typical patterns with different spacing, and the critical spacing for the two patterns at wind incidence angles of 0° and 9° is in the range of 3.8D~4.3D and 3.5D~3.8D, respectively. For cylinder spacings below the critical value, vortex shedding of the upstream cylinder is suppressed by the downstream cylinder. In particular, at wind incidence angles of 9°, the wake flow of the upstream cylinder flows rapidly near the top edge and impacts on the inlet edge of the downstream cylinder, which causes a negative and positive pressure region, respectively. As a result, the total lift force of twin cylinders comes to a peak while the total drag force jumps to a higher value. Moreover, there is a sharp drop of total lift coefficient for α = 9–12°, indicating the potential galloping instability. Finally, numerical simulations were performed for the visualization of the two flow patterns.

1. Introduction

Bridge hangers in suspension bridges are commonly deployed in pairs or groups with close spacing [1], and the aerodynamic behavior of closely spaced cylinders becomes very complex and is considerably different from that of a single isolated one as a result of the interference effects. Severe wind-induced vibrations have been observed on several well-known suspension bridges including the Akashi-Kaikyo Bridge in Japan [2], the Great Belt East Bridge in Denmark [3], and the Xihoumen Bridge in China [4]. Excessive wind-induced vibrations raise concerns about the fatigue life at both ends of the hangers and other structural members and can also cause visual discomfort for drivers.
The study of the aerodynamic performance of twin cylinders in cross flow is a topic of both fundamental and practical importance [5,6,7]. The aerodynamic behavior of flexible cylinders as a result of wind actions can be dramatically altered by their proximity to neighboring structures [8,9,10,11]. Slender, identical, and parallel cylinders such as bundled overhead conductors, heat exchange tubers, hangers of suspension bridges, and chimney stack groups are particularly sensitive to wake interference effects, which are associated with fatigue damage or catastrophic failure [12,13]. Aerodynamic interference between two cylinders may induce flow separation, shear-layer development, reattachment, gap flow switching, vortex impingement, and quasi-periodic vortices, involving most of the generic flow features associated with various structures [14]. Flow around twin cylinders provides an excellent model for gaining insight into the underlying flow physics around multiple structures and has attracted wide attention [7,15,16,17,18,19].
There are three arrangements for parallel twin cylinders: tandem arrangement, side-by-side arrangement and stagger arrangement. The effects of aerodynamic interactions on cylinders are significantly different for the three arrangements. For instance, the downstream cylinder is sucked by the upstream cylinder when twin cylinders are arranged in tandem closely, while it may suffer strong vibration when they are arranged in stagger with a certain relative position, which can lead to disastrous results on engineering structures. Previous studies have focused on multiple aerodynamic instabilities of the downstream cylinder such as vortex-induced vibration (VIV) [20], wake induced galloping [21,22,23,24], and a combination of them [25]. Instability may occur on both cylinders in a tandem arrangement with a small spacing (W/D < 3.2) at a low Reynolds number [26]. Additionally, the vibration amplitude of one cylinder is sensitive to the spacing between the two cylinders and whether one of them is fixed or not. For the downstream cylinder, strong vibration results in particular cases for staggered arrangement [27].
It is worth mentioning that flow-induced vibration can also occur on two rigidly coupled identical circular cylinders in tandem, staggered and side-by-side arrangements [25,28]. Zhao [25] studied the synchronous vibration of coupled twin cylinders in the cross-flow direction at a low Reynolds number, and found that the gap between the two cylinders has a significant effect on the response. For a tandem arrangement, the lock-in regime of the reduced velocity for VIV is very different from that of a single cylinder; for a side-by-side arrangement, there is a specific phenomenon that the combination of VIV and galloping emerges at a certain range of spacing and reduced velocity. The VIV of two rigidly coupled circular cylinders of different diameters at low Reynolds numbers has also been investigated by researchers [20]. Setting a small gap between the two cylinders is an effective measure to mitigate the vibration by reducing the vibration amplitude and narrowing the lock-in regime. Kim and Kim [21] investigated the characteristics of wake galloping for two parallel/unparallel circular cylinders via wind tunnel tests at a Reynolds number of 2.0 × 10⁵. The unparallel disposition of two cylinders was effective to reduce wake galloping phenomena caused by unsynchronized motion along the cylinder with varying gap spacing. That study proposed a new method of vibration control for adjacent cylinders.
Flow around twin cylinders arranged in tandem is extremely complex due to the aerodynamic or hydrodynamic interaction, and the flow characteristics are of great practical importance for determining the flow-induced behaviors of cylinders [29,30]. Flow characteristics are mainly dependent on the characteristics (turbulence and incident angle) of incoming flow and the arrangement of cylinders. Researchers [9,31,32] classified the relative position of the downstream cylinder as three typical regions: proximity interference region, wake interference region, and region of no-interference. Meanwhile, flow regimes of the three patterns have been comprehensively studied via numerical simulations and experiments in the last several decades [10,14]. Previous research indicated that critical spacing values for the three typical regions are mainly dependent on the turbulence and incidence angle of flow [14]. When the Reynolds number is in the subcritical range, wake interference takes place in tandem and slightly staggered cylinders whose spacing exceeds a critical value of 3.5D–4.0D [33]. In this case, the downstream cylinder wake is greatly affected by the upstream cylinder but not vice versa, thus the upstream cylinder is assumed to behave like a single isolated cylinder. The upstream cylinder flow is influenced slightly through a feedback mechanism by the downstream cylinder with the spacing at least up to 8D (with a reduced St and increased aerodynamic coefficients compared to those of an isolated cylinder) [34,35]. In addition, researchers [36,37] have discovered two completely distinct flow characteristics in laminar and turbulent regimes. Mizushima and Suehiro [38] studied the flow around twin tandem cylinders by both direct numerical calculation and numerical simulation. The results showed there was a critical Reynolds number for the transition from steady symmetric flow to an oscillatory flow, and also a certain range of the gap spacing where physical quantities (such as aerodynamic coefficients and Strowhal number) show an abrupt change. Moreover, the transition of flow regime is also connected with the flow incidence angle in the high subcritical range of the Reynolds number, and the critical incidence angle of transition is dependent on the Reynolds number and spacing of the cylinders [37].
Pressure measurement is a familiar efficient method for the study of structural wind engineering and has been widely used in previous investigations on the aerodynamic characteristics of twin cylinders [39,40,41]. As an essential aerodynamic parameter, the distribution and pulsation of pressure are sensitive to the surface roughness [42], Reynolds number, flow incidence angle, diameter ratio [43], and arrangement of the cylinders [14,44]. Igarashi [45] tested the pressure on two tandem identical cylinders at a Reynolds number range of subcritical values. Vortex shedding was detected from the upstream cylinder in a certain spacing near 3.5D, with a sharp peak of pressure pulsation emerging at θ = 40° (where θ is the angle on the circumference taken from the front stagnation point on a cylinder) of the downstream cylinder. This location and magnitude remained unchanged up to the spacing of 7D, and the vortex-shedding frequency increased with rising flow velocity. Similar conclusions have been found by Arie et al. [46]: the RMS (Root-Mean-Square) surface pressure was much higher for the downstream cylinder than for the upstream cylinder at the spacing of 4D and the Reynolds number of 1.57 × 10⁵, and a distinct peak of RMS pressure was observed at θ = 50° of the downstream cylinder. In addition, the RMS lift and drag of the cylinders were heavily dependent on the spacing, and were much larger for the downstream cylinder than for the upstream cylinder at the spacing ranging from 2D to 7D. Researchers [47] also paid many efforts to study the effects of flow incidence angle on the flow characteristics and aerodynamic characteristics of parallel twin cylinders. Gu et al. [48] classified three different pressure distribution patterns on the downstream cylinder and observed two switching processes for the wind incidence angle varying from 0° (in tandem) to 90° (in side-by-side) at high subcritical Reynolds numbers. A high level of asymmetric distribution of fluctuating pressure was detected at a high subcritical Reynolds number. The pressure pattern around the downstream cylinder may switch between two patterns at the critical wind incidence angle. This switching will create a step change of lift force on the downstream cylinder. However, for a supercritical Reynolds number, things will change. Effects of aerodynamic interference on the fluctuating pressures of twin circular cylinders of various wind incidence angles become weaker at the supercritical Reynolds number than those at the subcritical one [27]. Furthermore, mean pressures on downstream cylinders at the supercritical Reynolds number have very different features from those at the subcritical one.
Previous studies were mainly devoted to studying the aerodynamic characteristics and the ensuing vibrations of two twin cylinders that are not coupled. In other words, the two cylinders respond independently to wind and wake excitations. However, serious synchronous vibrations of twin coupled cylinders still exist in several engineering structures, such as bundled conductors [5], linked buildings [49], twin hangers or cables in bridges [28]. Unfortunately, to the authors’ knowledge, the vibration mechanism for coupled twin cylinders seems to be less understood. In the previous study by the authors [28], it is shown that the coupled twin cylinders suffered from wake-induced vibrations at certain spacings and ranges of wind attack angles. The purpose of this work is to describe the aerodynamic forcing characteristics and flow patterns of coupled parallel twin circular cylinders through wind tunnel tests and numerical simulations. Pressure measurements were performed on a stationary section model with a series of cylinder spacings and wind incidence angles. Based on the pressure data, mean and fluctuating wind pressure distributions, reduced frequencies and aerodynamic forces of the cylinders are obtained and analyzed. In addition, numerical simulations were performed for flow visualization. Moreover, the exciting mechanism of synchronous vibrations for the coupled twin cylinders is also discussed from the point of view of aerodynamic forces.

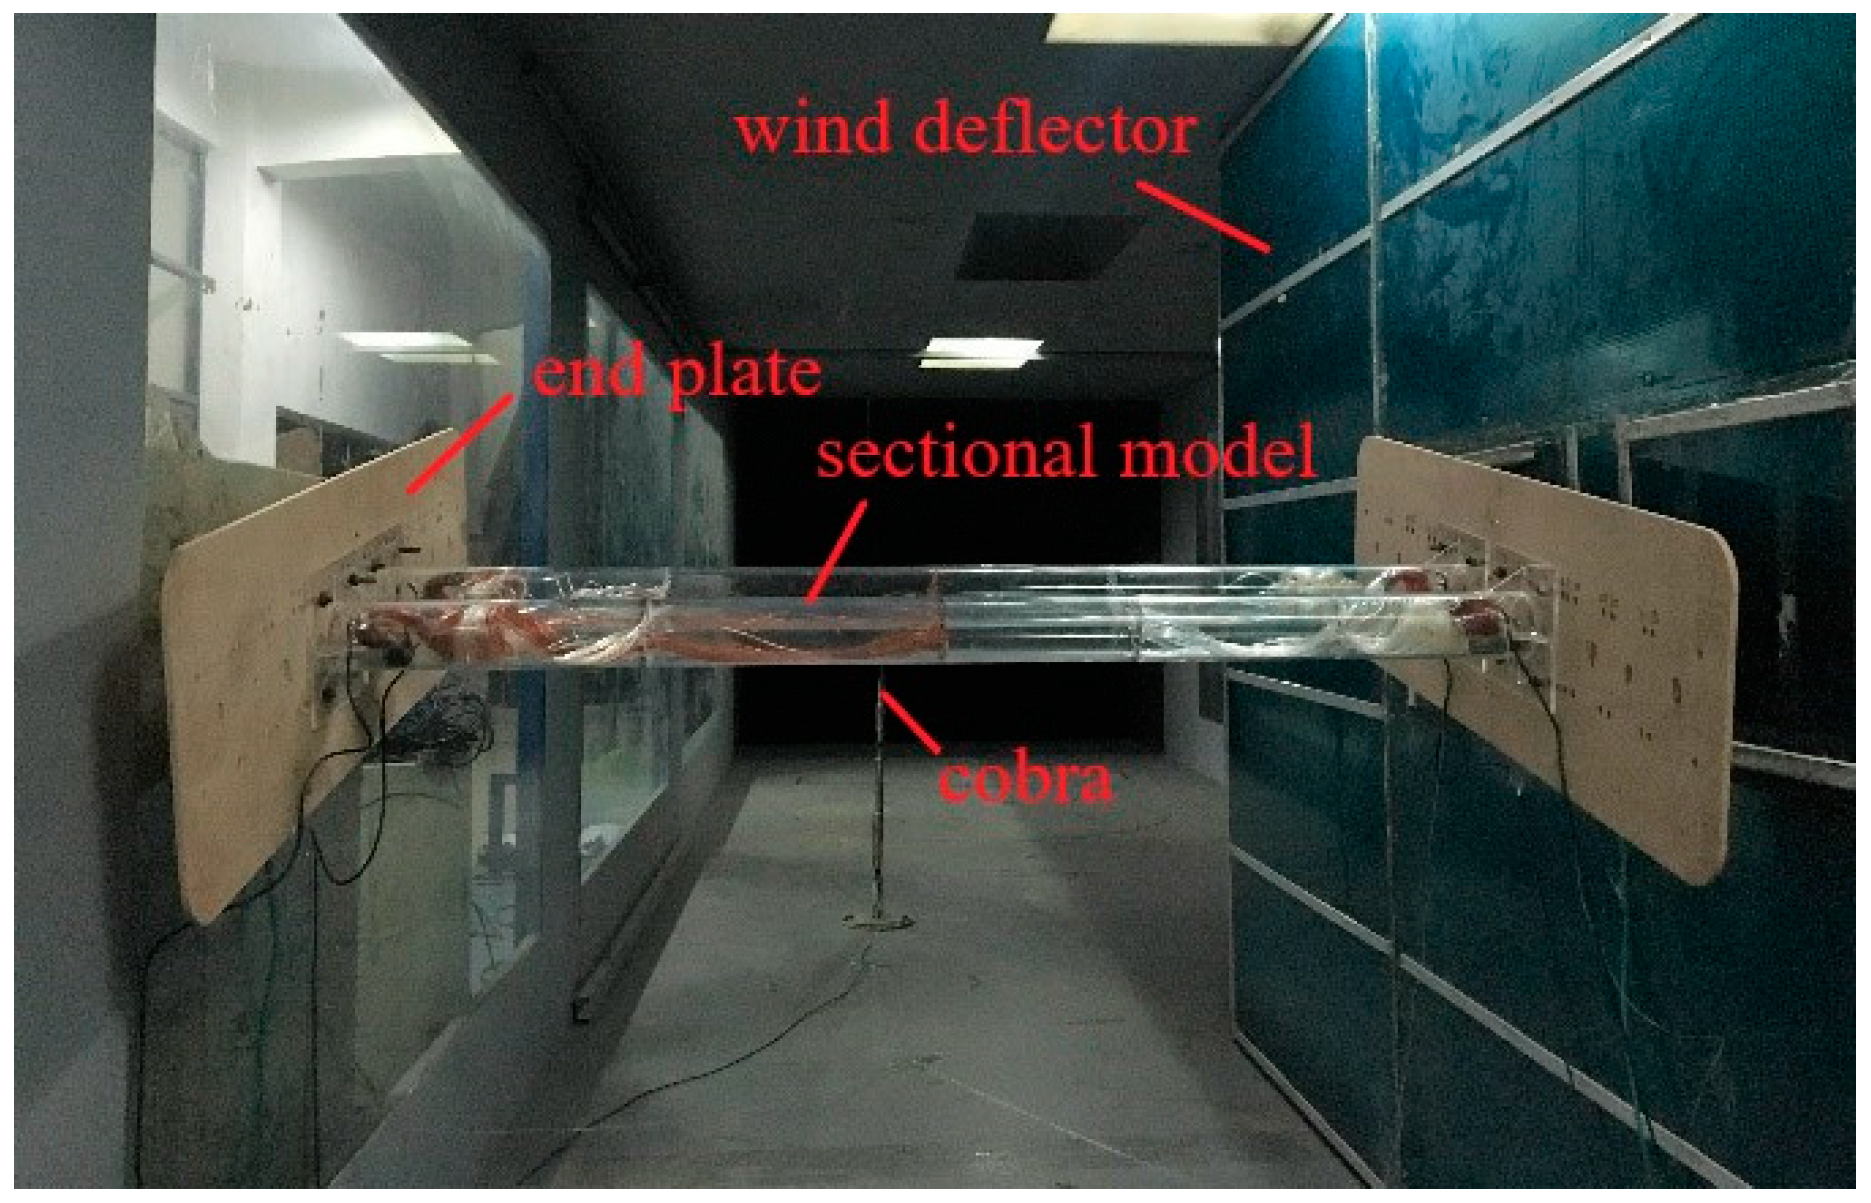
2. Experimental Apparatus

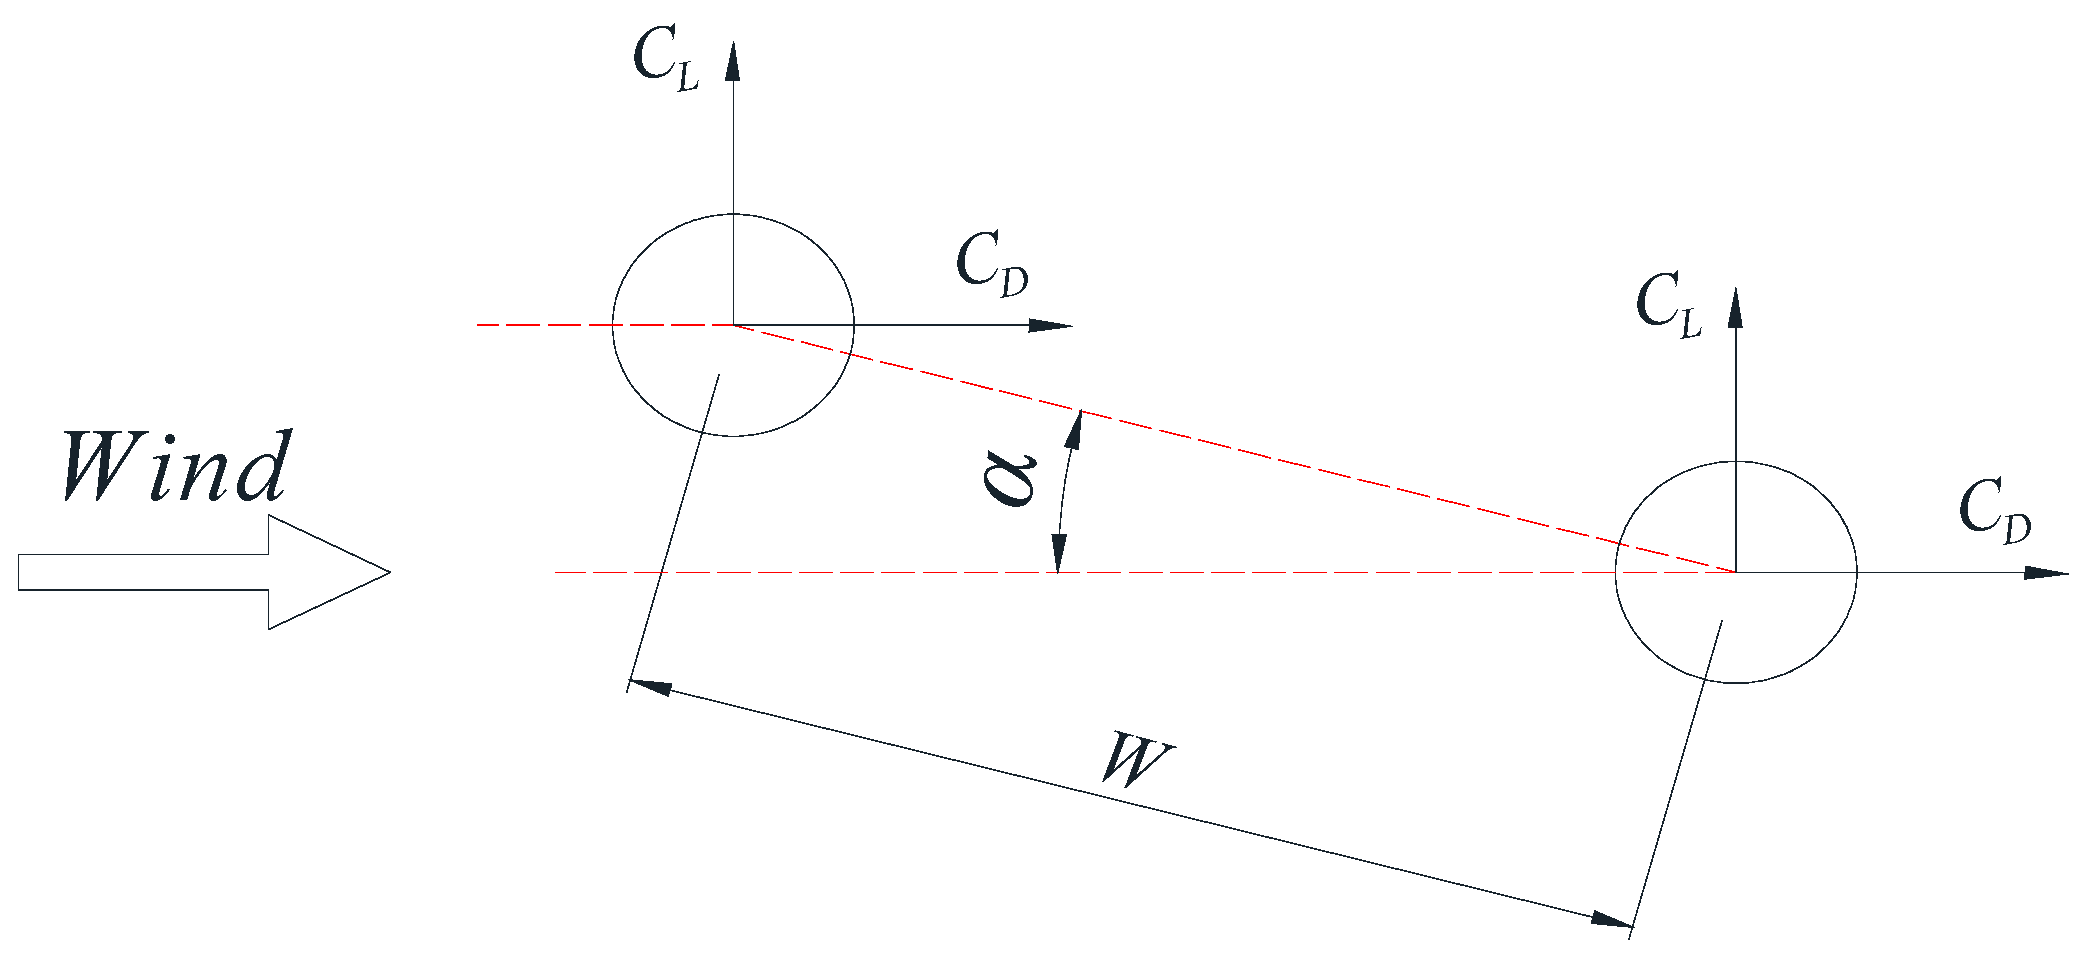
2.1. Description of Stationary Model

In order to study the wake-induced vibration mechanism of parallel twin circular cylinders associated with engineering structures, wind tunnel tests for pressure measurement were performed to investigate flow characteristics around the cylinders.
Based on a prototype of hangers in suspension bridges [28], the section model of cylinders used for surface pressure measurements was made of polymethyl methacrylate and each cylinder had a diameter of 88 mm. The length of both cylinders was 1.54 m, resulting in an aspect ratio of 17.5 for the section model. Two identical rectangle plates are installed on the two ends of the model to weaken the end effect. In order to reduce measuring error, surface pressure measurements were performed at four rings along the model length. Each cross section consists of 24 pressure taps installed circumferentially and spaced uniformly. Azimuth angle θ for pressure taps started from 0° at the upstream point in streamwise direction and increased in an anti-clockwise direction with a gradient of 15°. The layout of surface pressure taps on the section model is shown in Figure 1. Both cylinders were rigidly attached to a rectangular wood plate in each end, and the coupled twin model kept stationary both in along-wind and crosswind directions. The cylinder spacing W (Figure 2) was adjustable, and the spacing ratios W/D were 2.5, 3.0, 3.5, 3.8, 4.3, 6.5, 8.7 and 11 (D is the cylinder diameter). As a comparison task, the surface pressure of a single circular cylinder in the same condition was also measured in the tests. The surface pressure is measured by using pressure scanning instruments DTC net. Pressure signals at different azimuth angles of both cylinders under test were recorded simultaneously. Tests were performed at a flow velocity of 18 m/s with various wind incidence angles. Figure 2 illustrates the flow incidence angle α and the corresponding aerodynamic force coefficients. The corresponding Reynolds number is 1.084 × 10⁵. Wind velocity was collected by a Cobra probe.
Tests were conducted in the high-speed working section of a closed-circuit-type wind tunnel at the College of Civil Engineering of Hunan University. The high-speed test section is 3.0 m wide and 2.5 m high where the turbulence intensity of wind velocity above 2 m/s is less than 0.5%. Limited to the facilities of the wind tunnel, the section model was installed close to one side wall in the tunnel, and a wind deflector was installed in the other end of the model (as shown in Figure 3) to ensure the good quality of the incoming flow. The wind velocity of the incoming flow was measured by a cobra probe, which was placed in front of the sectional model with a sufficient distance to ensure the measurement precision. Figure 3 shows the layout of the section model and apparatus for surface pressure measurement in the wind tunnel.

2.2. Data Processing Method

The instant surface pressure at azimuth angle θ was measured and denoted by p(θ, i), thus the instant pressure coefficient Cp(θ, i) can be determined as:
C p ( θ , i ) = p ( θ , i ) P 1 2 ρ U 2
where P refers to the static pressure of incoming flow; ρ represents the density of air; U is the flow velocity. As the pressure is synchronously measured, the integration of surface pressure for each cross section gives their lift coefficients and drag coefficient as follows:
C L ( i ) = 1 2 0 2 π C p ( θ , i ) sin θ d θ C D ( i ) = 1 2 0 2 π C p ( θ , i ) cos θ d θ

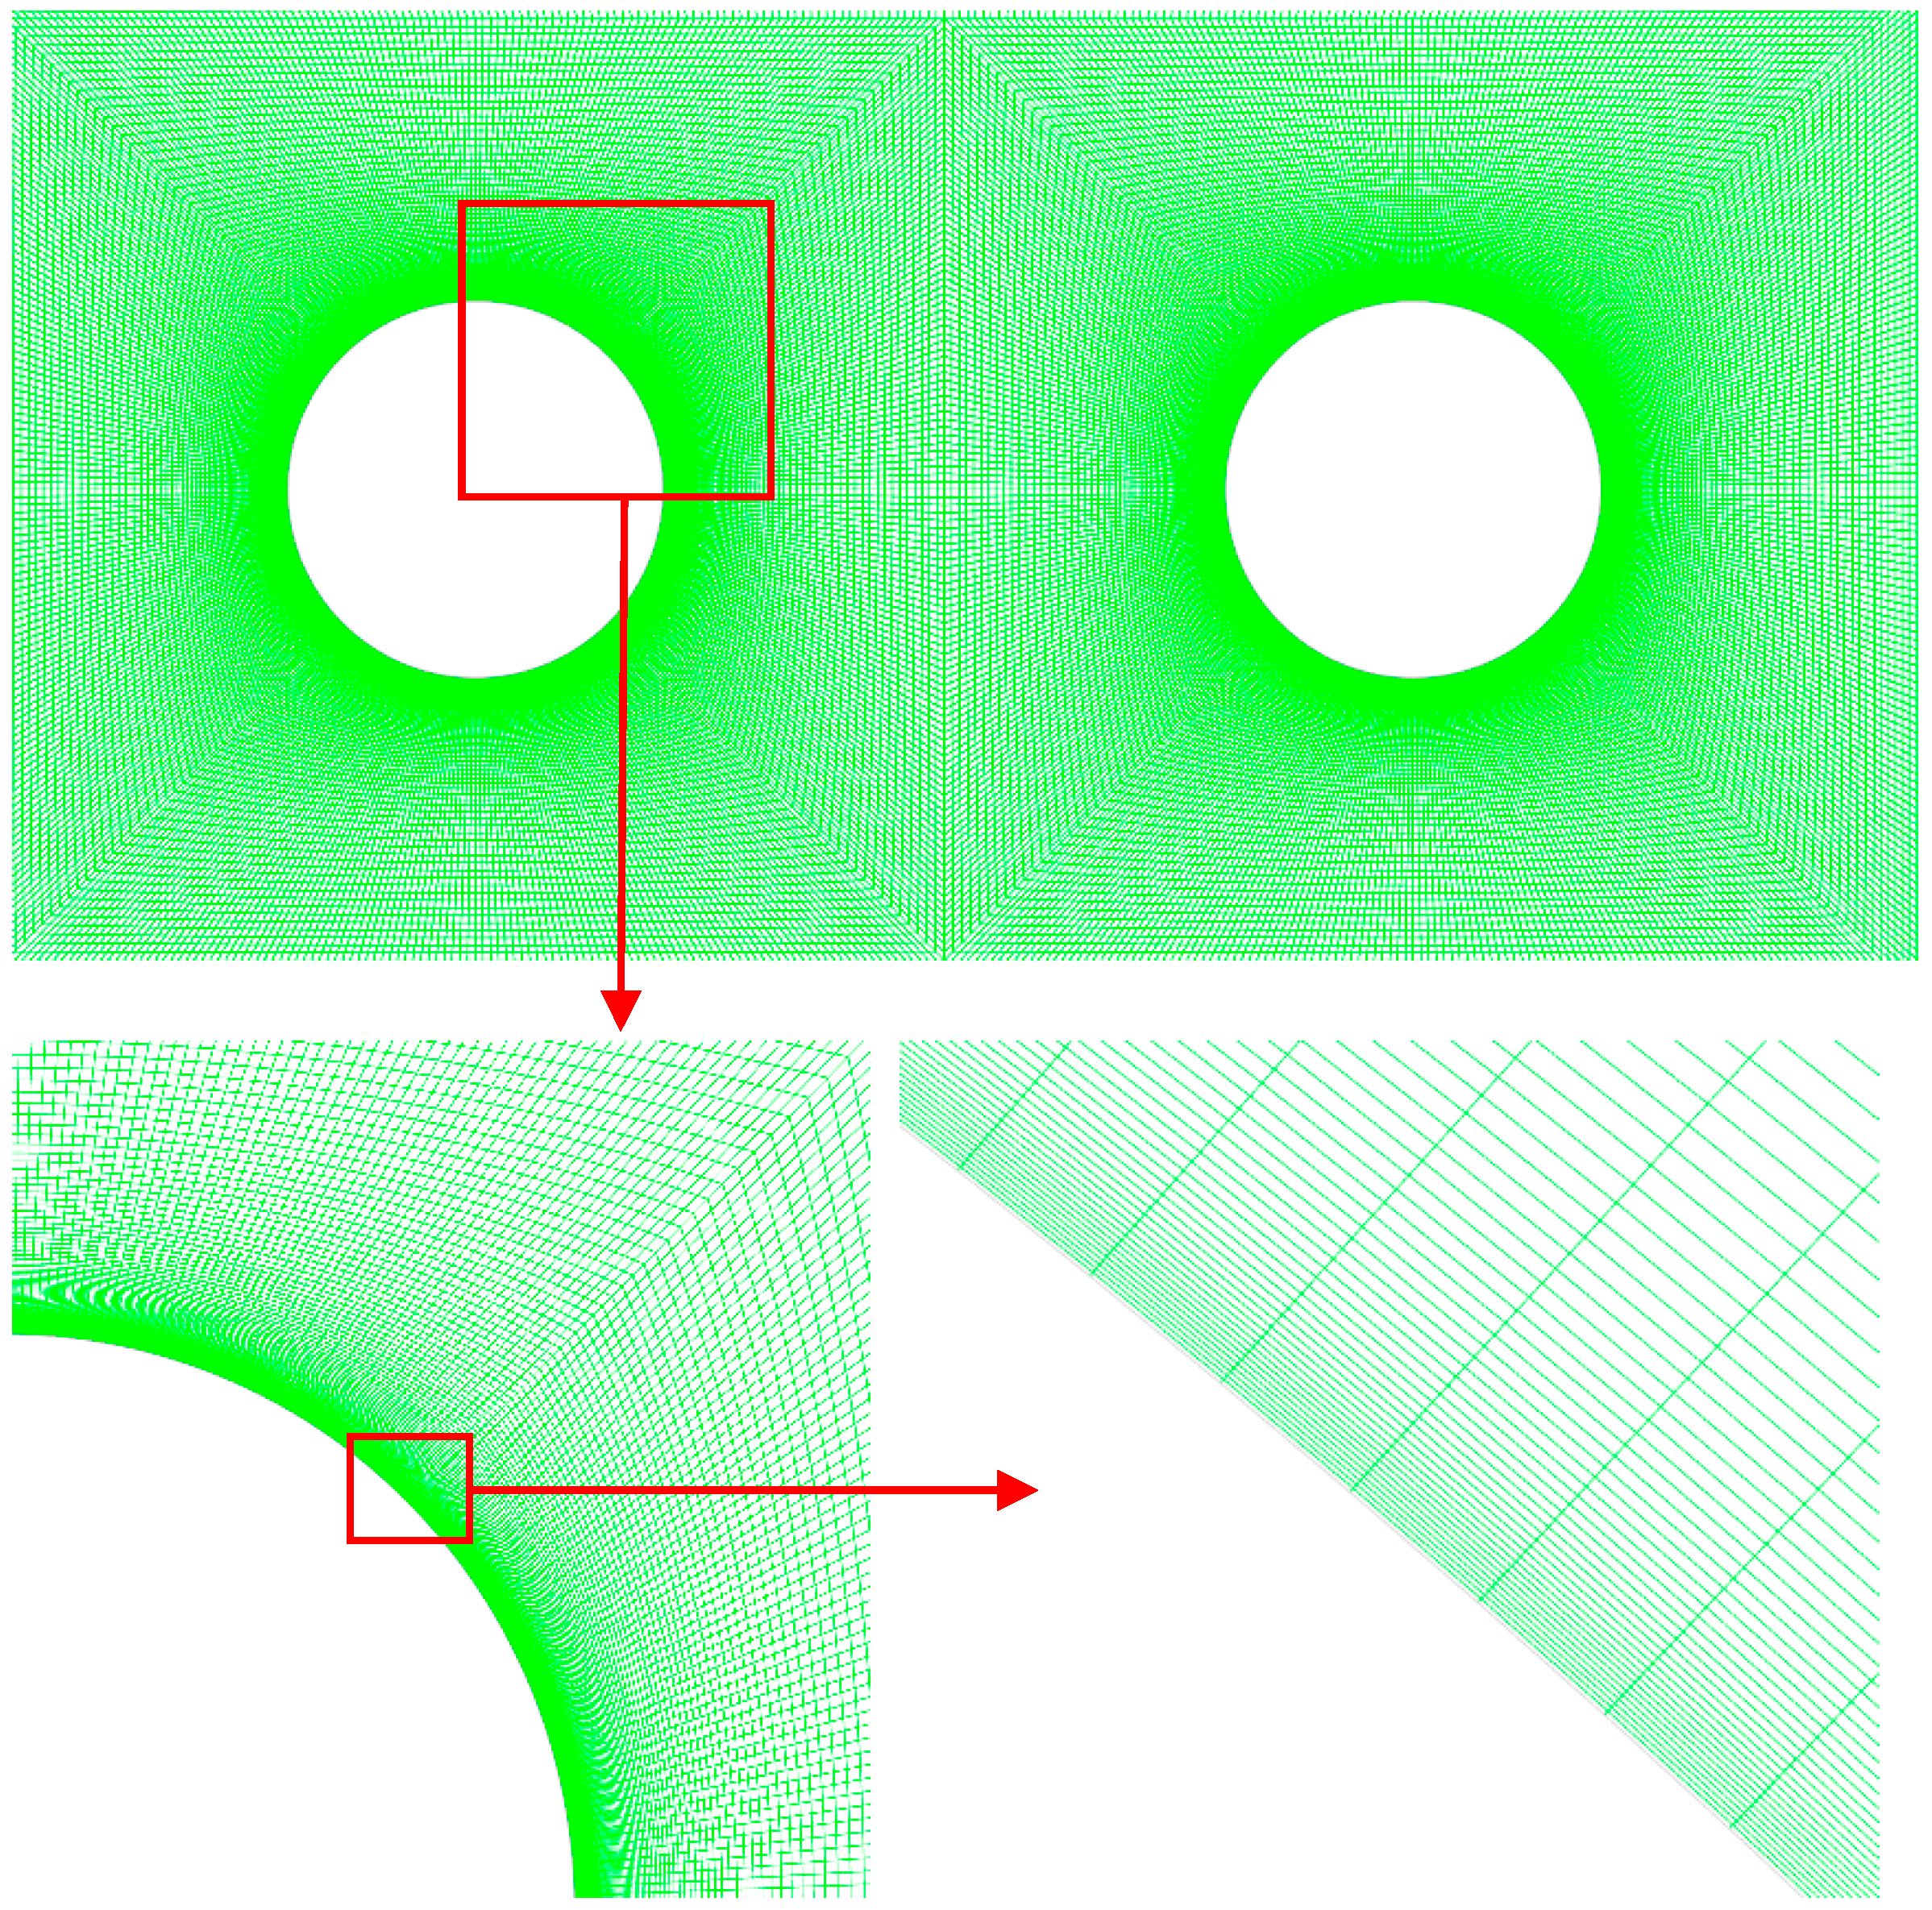
3. Results and Discussion

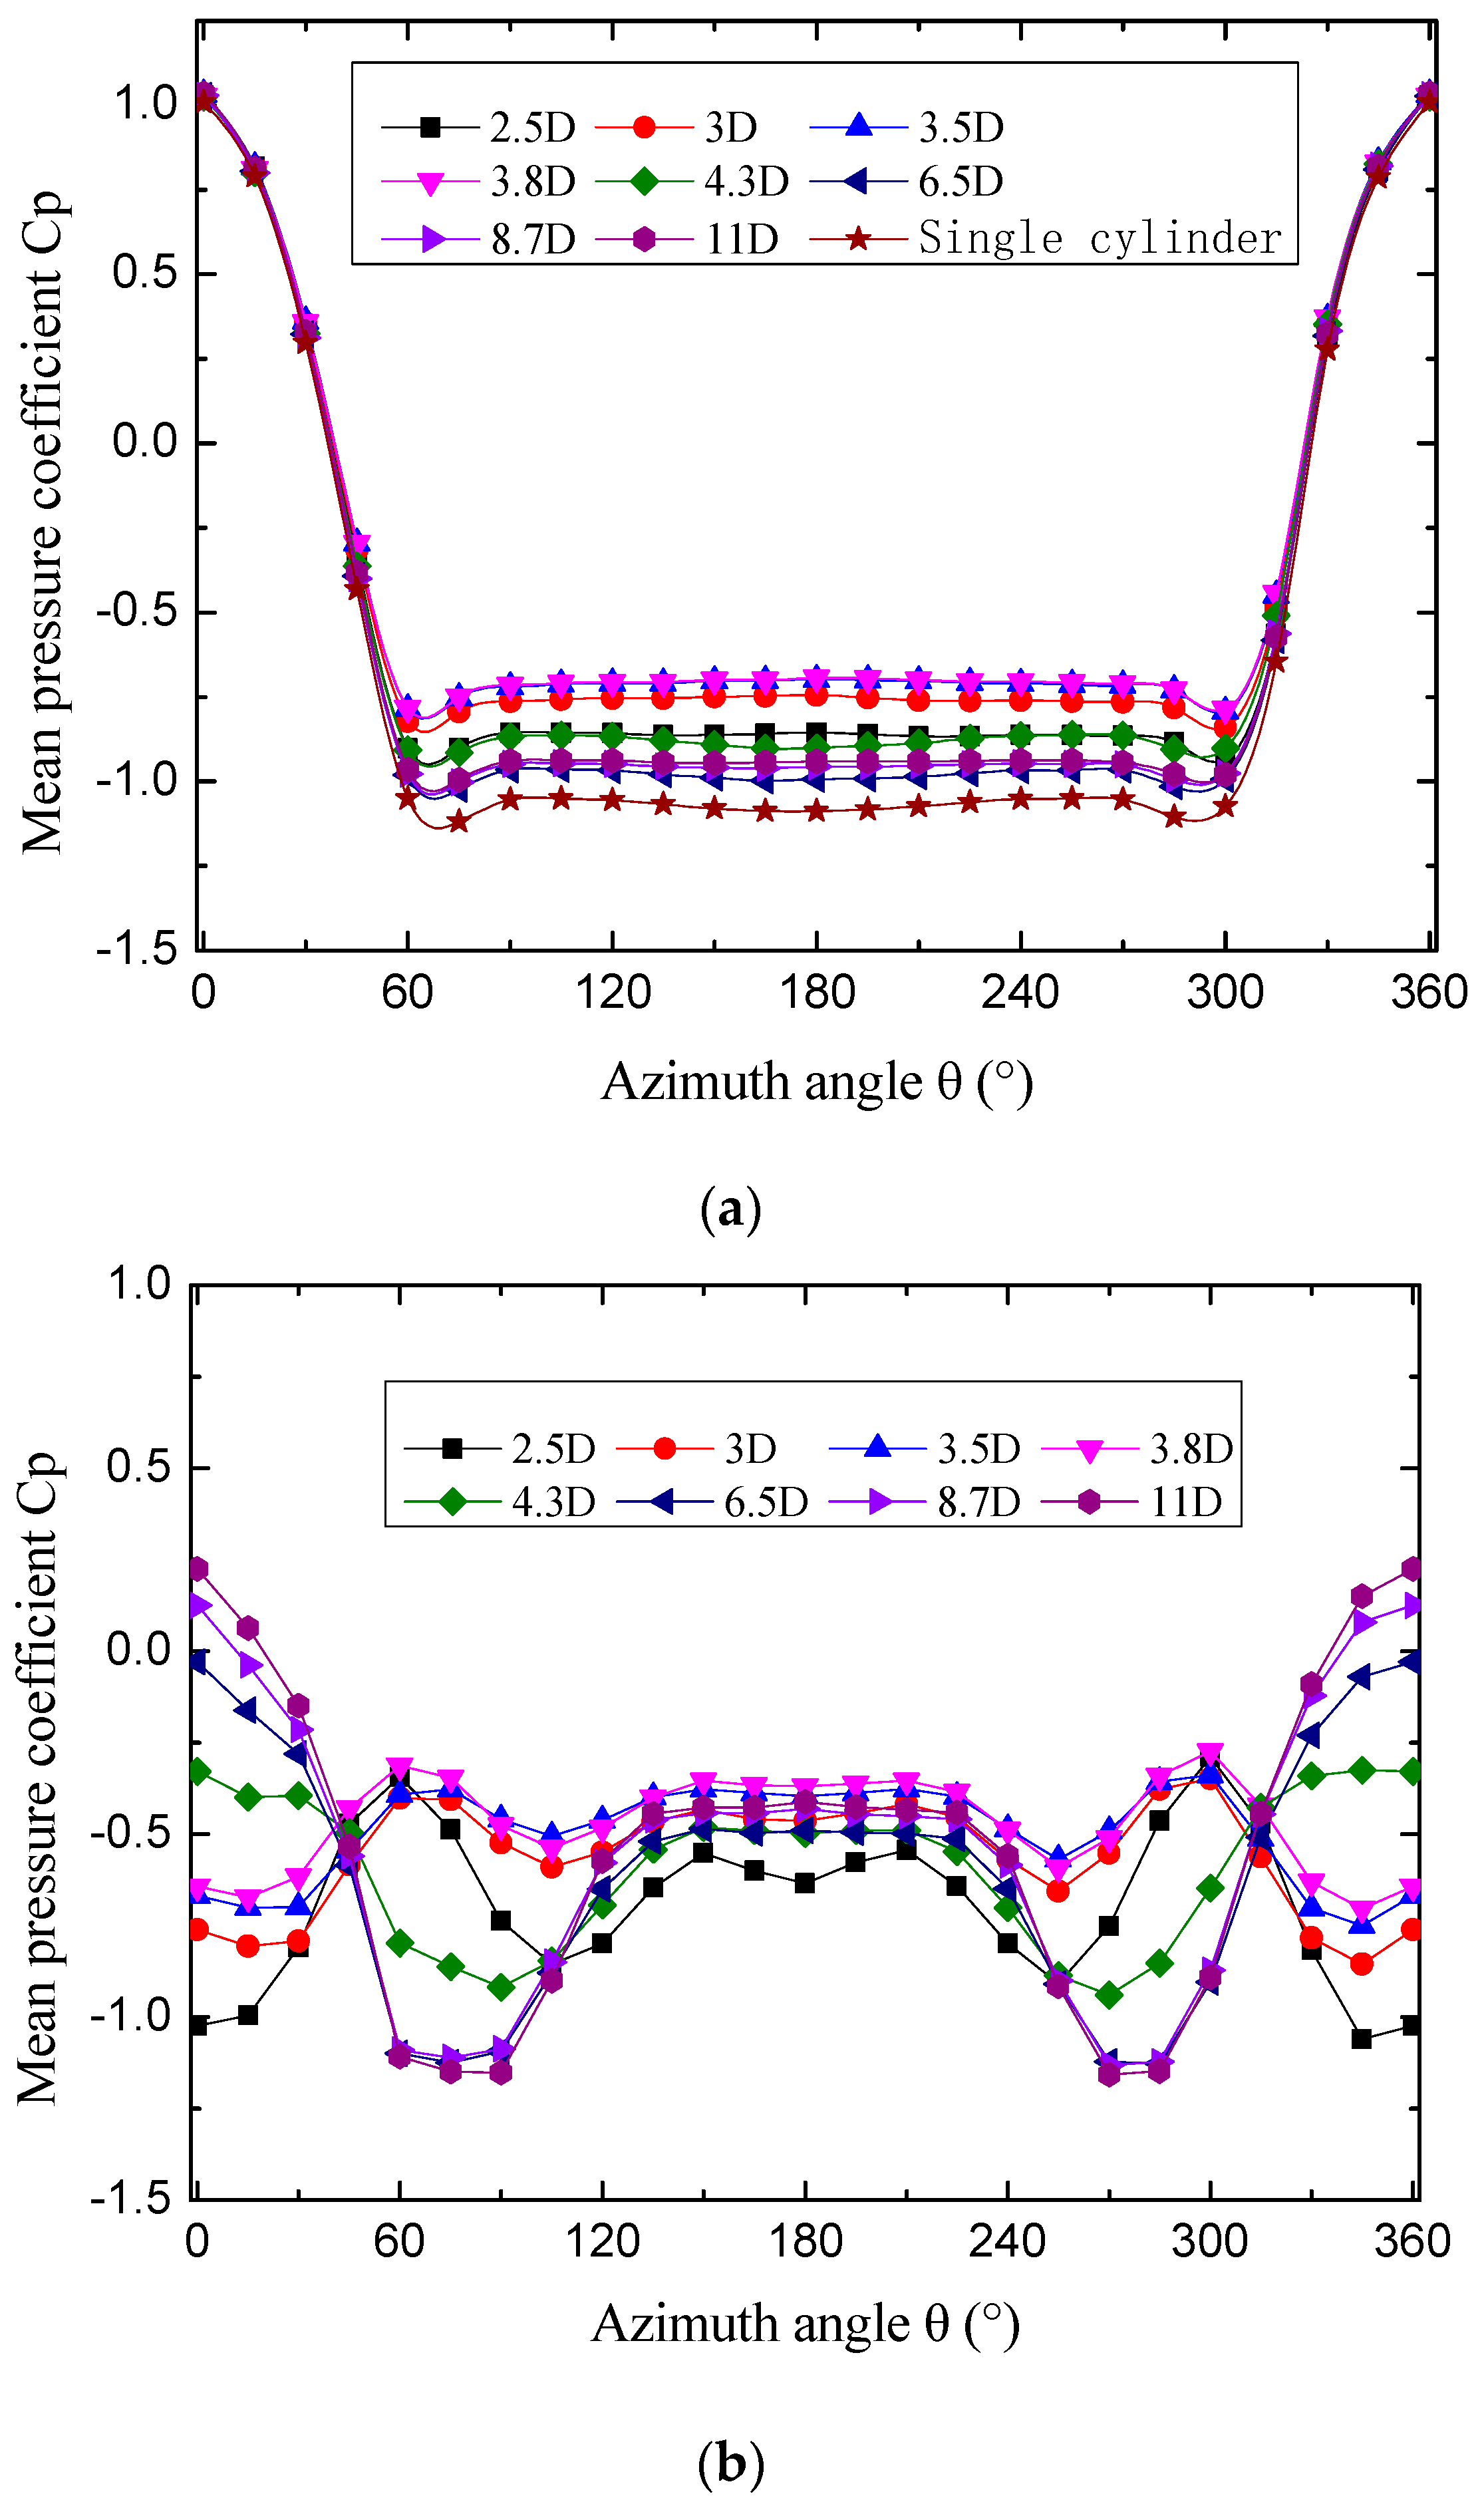
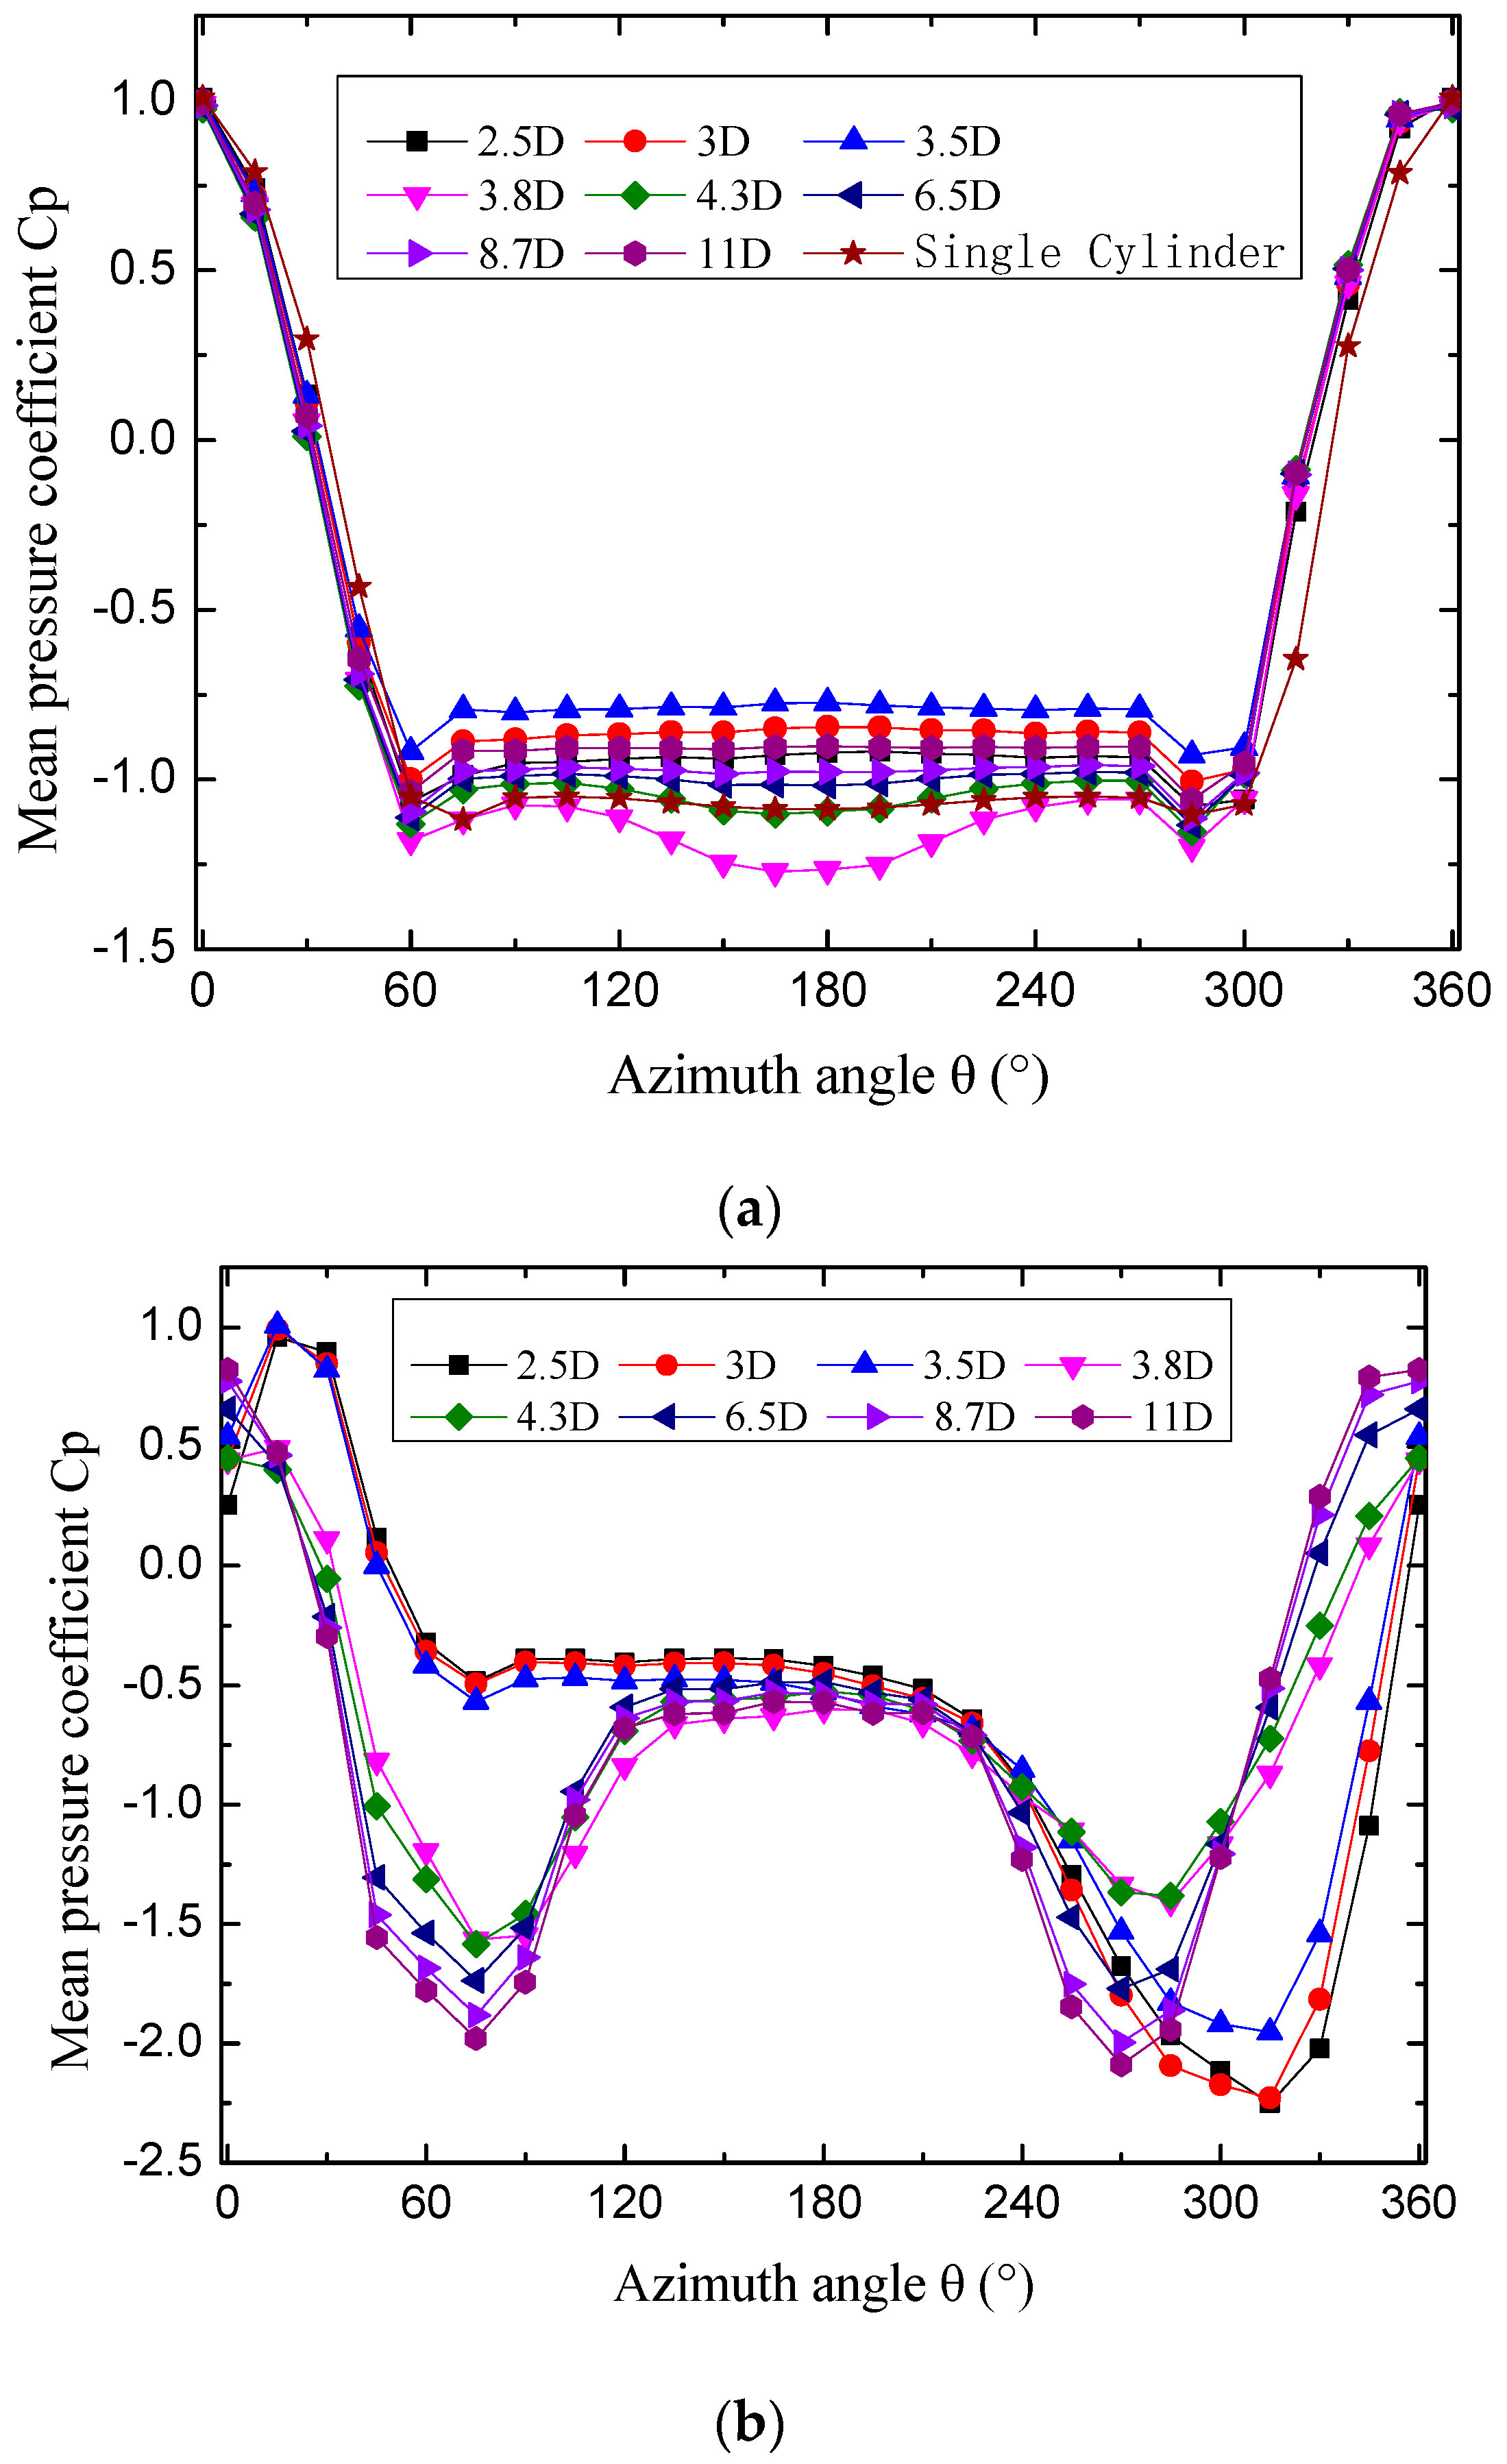
3.1. Time–Mean Pressure

Experimental results of time–mean pressure distribution on twin cylinders for various cylinder spacings at α = 0° and α = 9° are shown in Figure 4 and Figure 5, respectively. According to Figure 4a, it is shown that the upstream cylinder has an obvious different mean pressure distribution compared to the single isolated case, especially at 60° < θ < 300°. The mean pressure coefficient of upstream cylinders increases at various spacings compared to that of the single isolated one due to the aerodynamic interaction. At W/D > 3.8, the mean pressure of the upstream cylinder has an almost constant value of −1, while at W/D ≤ 3.8, mean pressure increases with an increase in W/D at 60° < θ < 300° and reaches a maximum value at W/D = 3.8. The mean pressure coefficient of the upstream cylinder is −0.86 and −0.69 at W/D = 2.5 and 3.8, respectively. Overall, no apparent changes in the characteristics of mean pressure distribution were observed.
Compared to the upstream cylinder, the downstream cylinder has a more obvious variation of pressure distribution with respect to various spacings. According to Figure 4b, there are two different flow regimes around the twin cylinders with various spacings, and the critical spacing for these two regimes is in the range of 3.8D~4.3D. When W/D > 3.8, the mean pressure distribution of the downstream changes to another pattern compared to that at W/D ≤ 3.8. Due to the shelter of the upstream cylinder, the mean pressure coefficient of the front stagnation point is significantly smaller than that of the upstream cylinder, but increases with increasing W/D. At W/D > 3.8, the mean pressure coefficient of the downstream cylinder has a peak value at the front stagnation point. There are two symmetrical peaks on the pressure distribution curve at θ = 75° and θ = 285°, which are caused by the shear layers of the upstream cylinder, which attaches to the surface of the downstream cylinder. The mean pressure coefficient of the upstream cylinder is −1.02 and 0.22 at W/D = 2.5 and 11, respectively. At W/D = 6.5, the mean pressure coefficient at the stagnation point is 0. It is worth mentioning that at W/D ≤ 3.8, the mean pressure of the downstream cylinder at the front stagnation point is almost equal to the pressure of the upstream cylinder at θ = 180°, indicating that there is no obvious flow in the gap of the twin cylinders.
Figure 5 indicates that the flow around cylinders shows two completely different patterns with various spacings at α = 9°, and the critical spacing is in the range of 3.5D~3.8D. For the upstream cylinder, the mean pressure distribution at different spacings falls in the range between those at 3.5D and 3.8D, which is distinctly different from the pressure distribution of the upstream cylinder in tandem. At θ = 180°, the mean pressure coefficient reaches a maximum value of −0.79 when W/D = 3.5, and the pressure distribution on the trailing edge of the cylinder is almost constant. Meanwhile, the mean pressure coefficient reaches a minimum value of −1.27 when W/D = 3.8, and the minimum value is smaller than that of the single isolated cylinder, which illustrates that the gap flow between cylinders has a significant influence on the upstream cylinder at α = 9°. With the increase in spacing, the pressure distribution of the upstream cylinder asymptotically approaches that of the single cylinder, indicating that the influence of the downstream cylinder is gradually weakening.
According to Figure 5b, the mean pressure distribution of the downstream cylinder fluctuates violently versus spacing. When W/D ≤ 3.5, due to the shelter of the upstream cylinder, the maximum wind pressure coefficient does not emerge at the front stagnation point, but emerges nearly at the position where θ = 15°. The pressure distribution versus θ is asymmetrical, and the mean pressure coefficient reaches a minimum value of −2.2 at θ = 315°. In this case, the wake flow of the upstream cylinder flows rapidly near the top edge and impacts on the inlet edge of the downstream cylinder, which causes a negative and positive pressure region near the corresponding edge regions, respectively. This feature of pressure distribution provides a good explanation for the lift peak of the section model at α = 9° in the study of Wen et al. [28]. When W/D > 3.5, the interference becomes weaker and the maximum mean pressure coefficient appears at the front stagnation point. The pressure distribution is symmetrical along the circumference, and the mean pressure coefficient at 135° < θ < 210° is almost constant near a value of −0.53. The minimum mean pressure appears both at θ = 75° and θ = 270°, and the absolute value of the mean pressure increases with rising W.

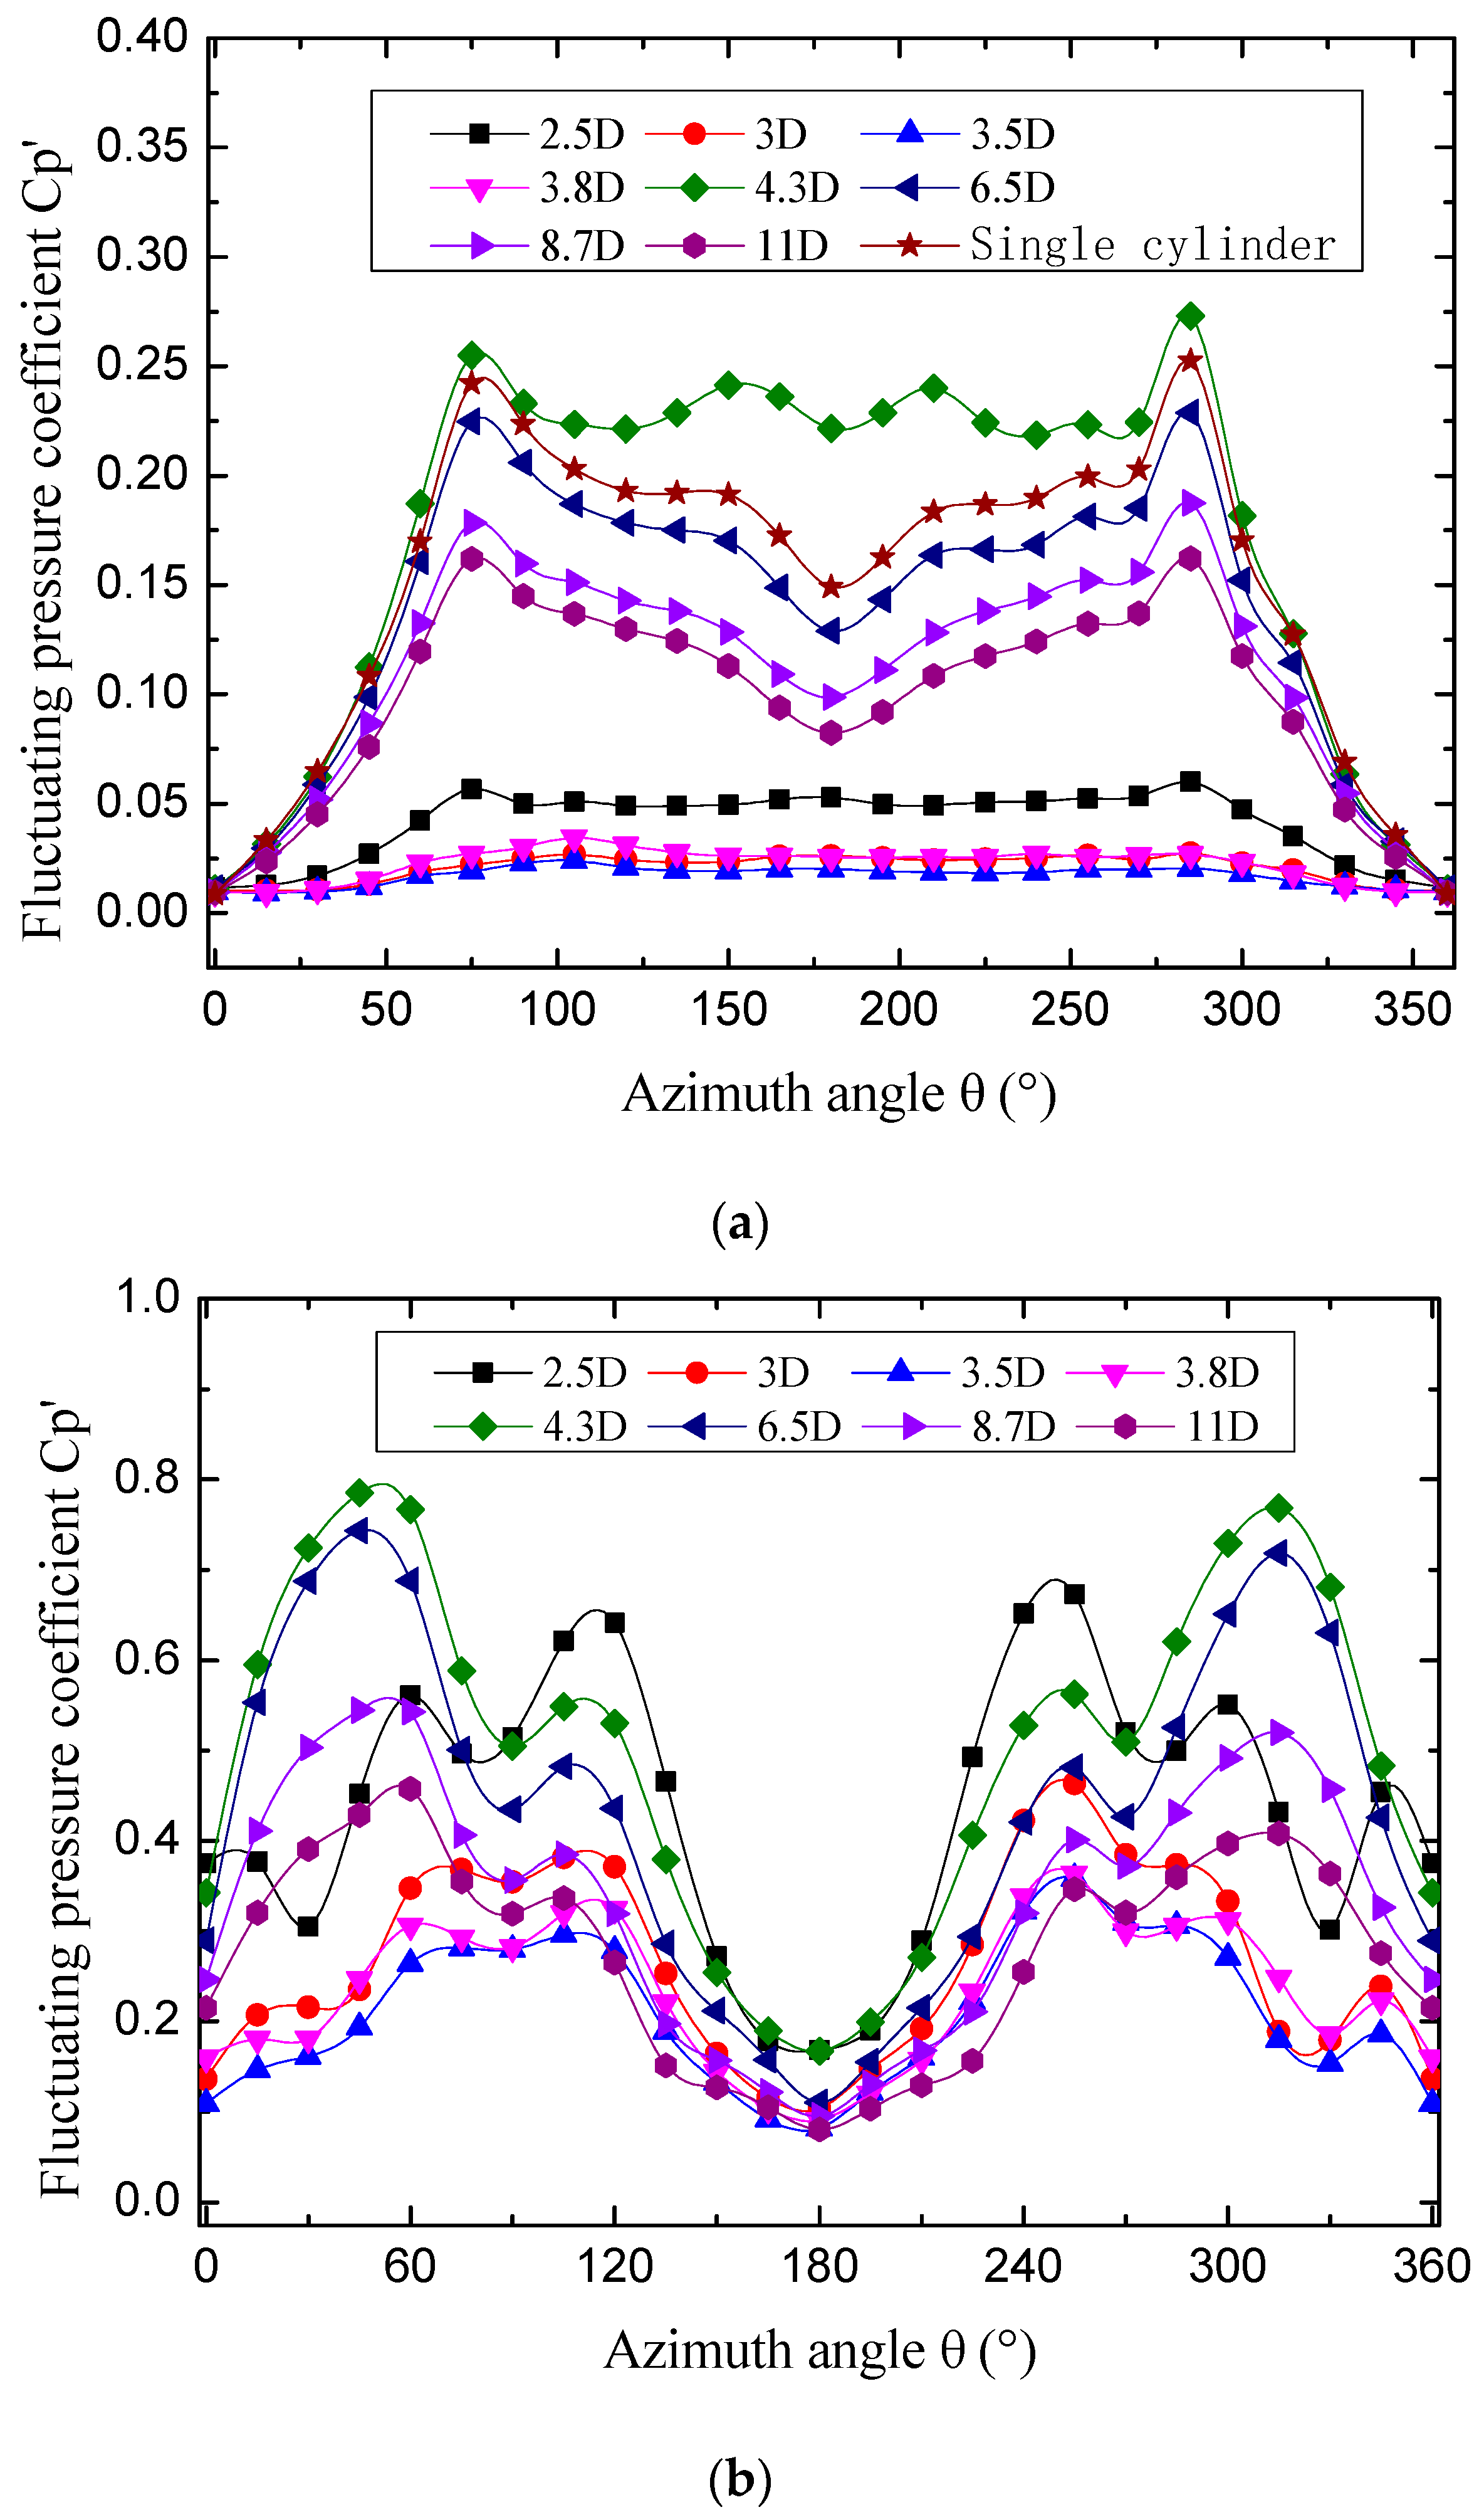
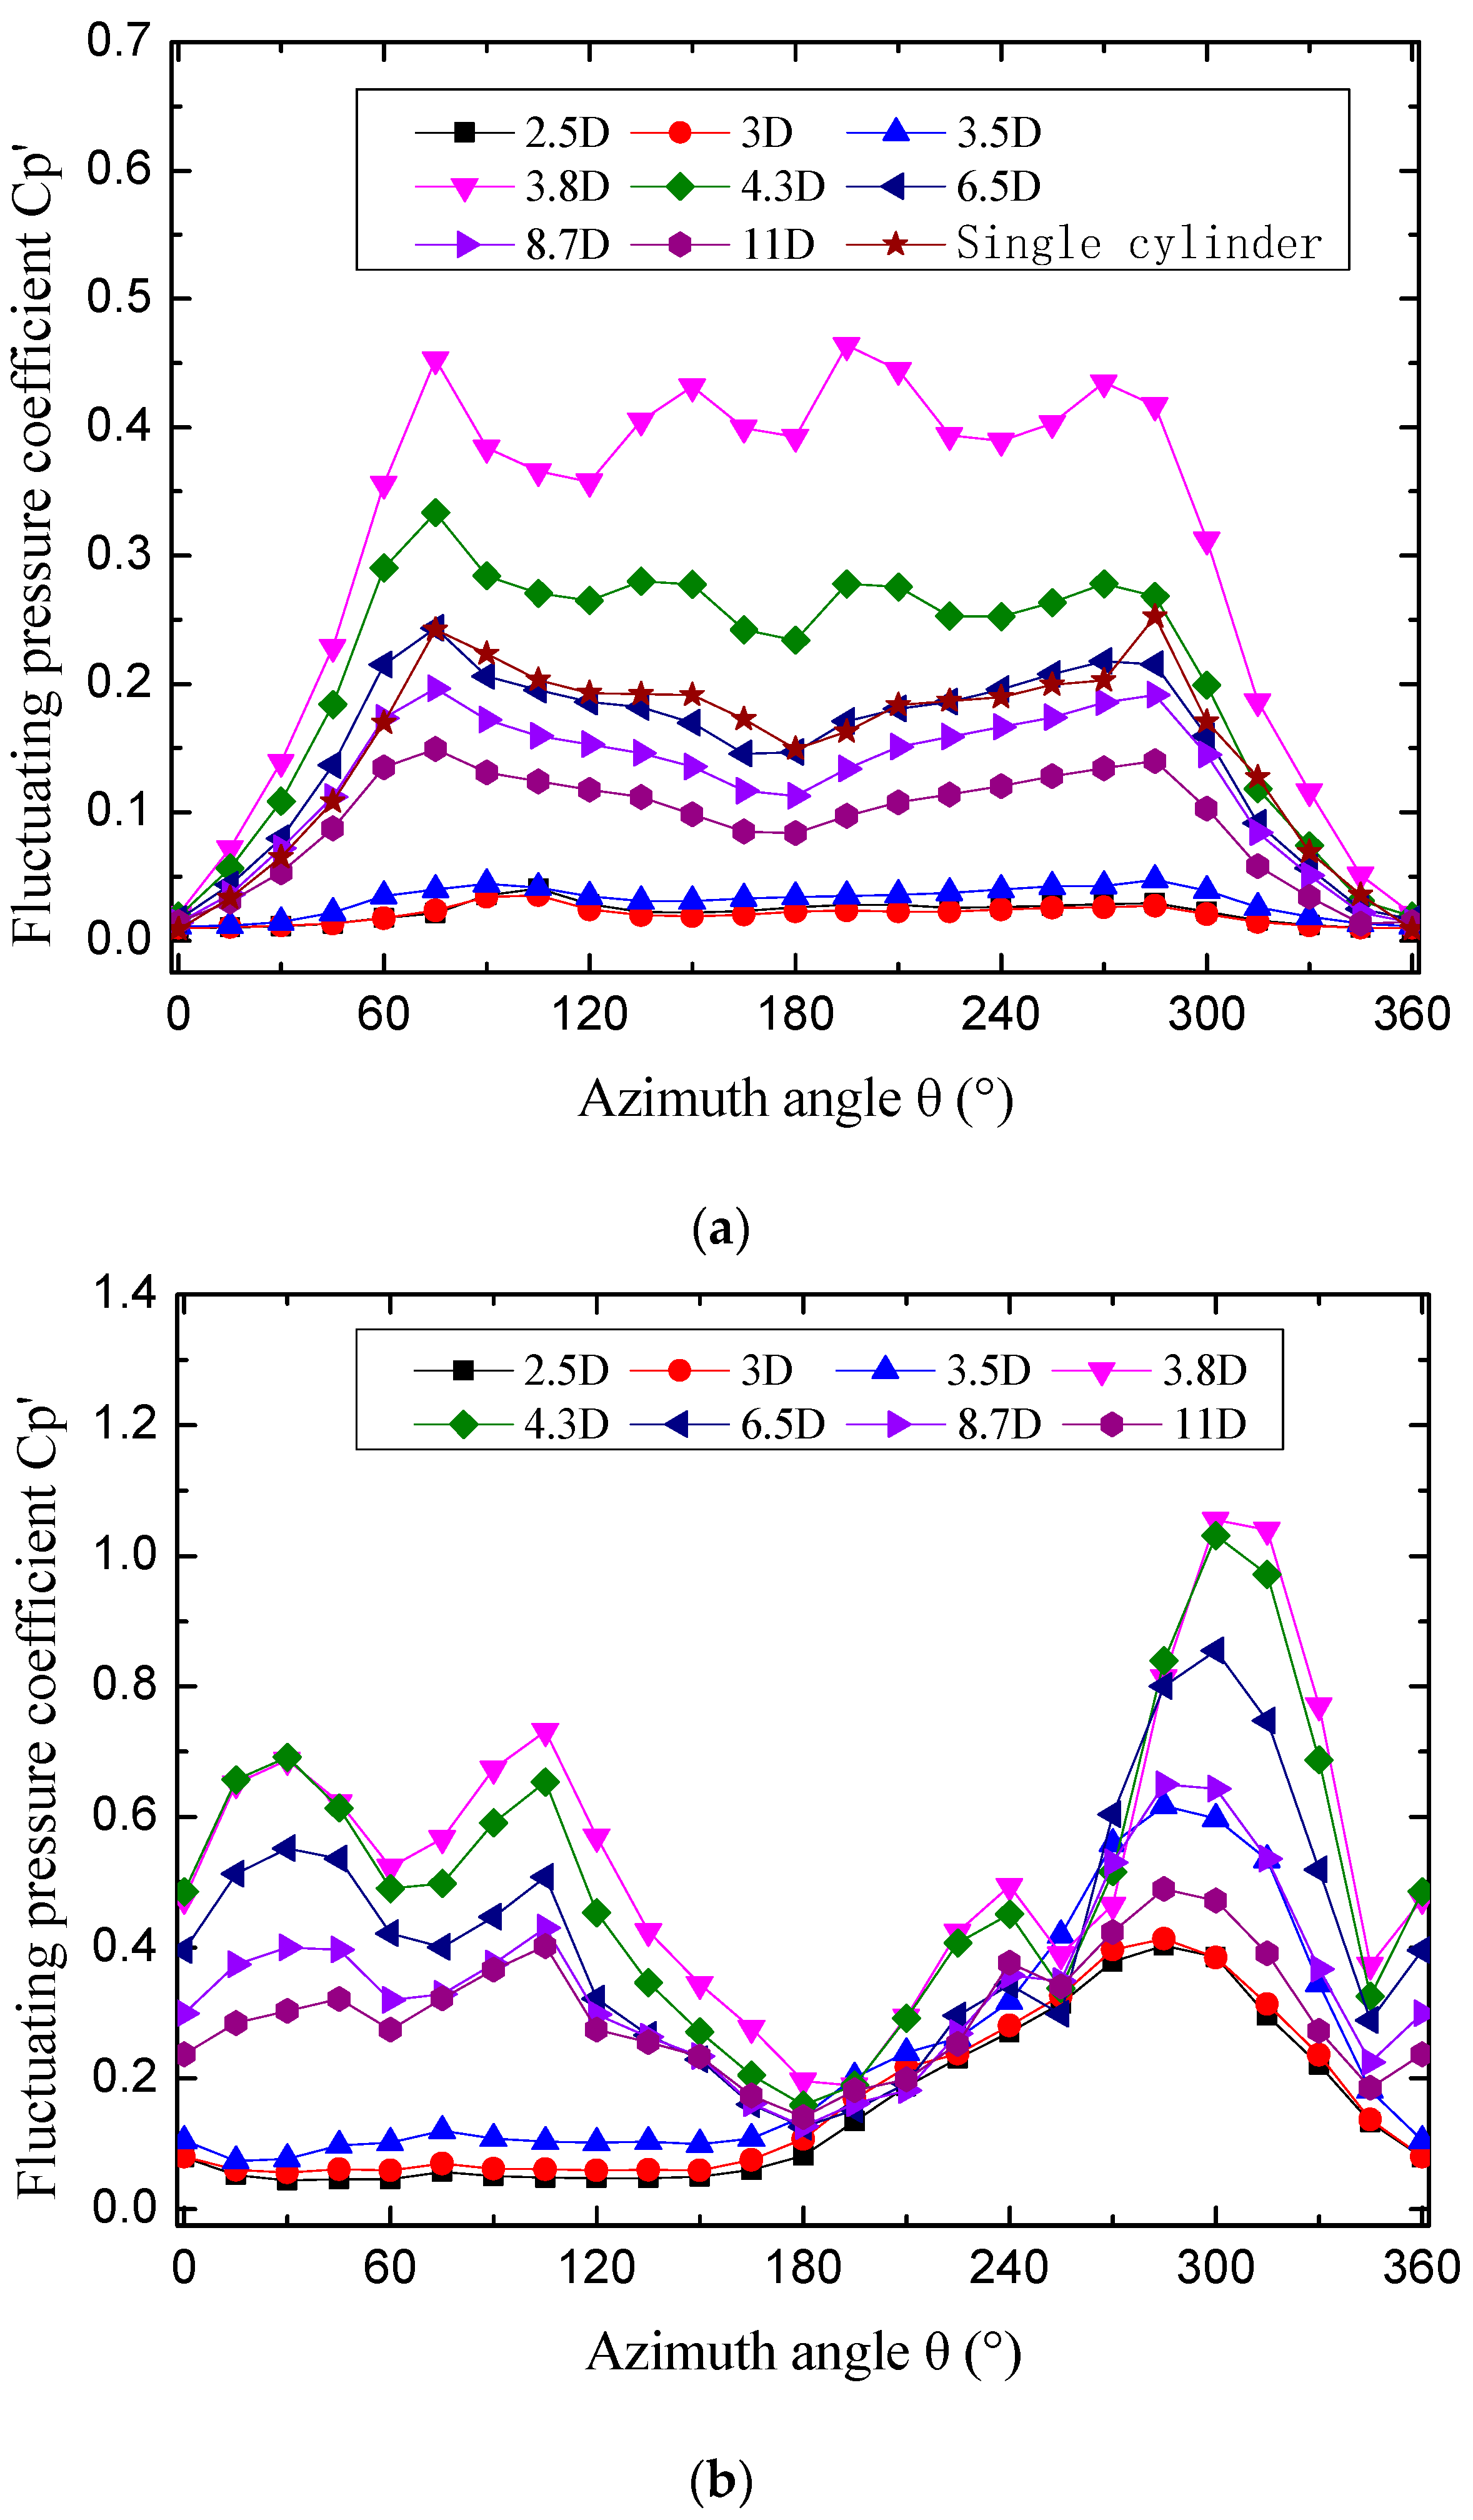
3.2. Fluctuating Pressure

The fluctuating pressure distribution of cylinders at α = 0° is illustrated in Figure 6. According to the curve shapes, there exist two distinct flow patterns while the cylinder spacing varies, which is consistent with the results of mean pressure distribution. For the upstream cylinder, when W/D ≤ 3.8, the fluctuating pressure coefficient is almost constant with respect to θ and they are all less than 0.07. This is because the shear layer separated from the upstream cylinder is reattached to the downstream cylinder, with vortex shedding suppressed. However, at W/D > 3.8, the fluctuating pressures change drastically with respect to θ and show two obvious peaks at θ = 75° and θ = 285°, respectively. This indicates that the shear layer of the upstream cylinder is separated at θ = 75° and θ = 285° and vortex shedding occurs.
For the downstream cylinder, the fluctuating pressure varies violently at various spacings and displays obvious symmetry with respect to θ. One can see that the magnitude of the fluctuating pressure at a cylinder spacing of 4.3D is greatly larger than other spacings. In order to facilitate the description, only the fluctuating pressure distribution at θ = 0°~180° is discussed in the following. At W/D > 3.8, there are two peaks of the fluctuating pressure, with one peak at θ = 30°~60° and another nearly at θ = 110°. The first peak is due to the vortex generated from the upstream cylinder impacting on the downstream cylinder, resulting in a maximum value of Cp’ = 0.8, while the peak value decreases with rising spacing, indicating that the eddy energy and the impact are gradually weakened. The second peak is due to the point of vortex shedding for the downstream cylinder. When W/D ≤ 3.8, there are also two peaks: the first peak is nearly at θ = 70°, and the second peak is nearly at θ = 110°. The first peak is due to the reattachment of the shear layer separated by the upstream cylinder, and the second peak is due to the point of vortex shedding for the downstream cylinder. To sum up, the corresponding position for the first peak of fluctuating pressure on the downstream cylinder varies with W, while that for the second peak is invariant.
Figure 7 shows the fluctuating pressure distribution of cylinders at α = 9°. The curve shapes in Figure 7 indicate that there exist two distinct flow patterns while the spacing varies, and the critical spacing is in the range of 3.5D~3.8D. For the upstream cylinder, the fluctuating pressure distribution is similar to that at α = 0°, but the critical spacing changes. At W/D ≤ 3.5, the fluctuating wind pressure almost keeps constant with a small value less than 0.05. When W/D > 3.8, the fluctuating pressure distribution is similar to that of a single cylinder, and there are two prominent peaks at the separation points. For W/D = 3.8, the fluctuating pressure fluctuates drastically versus θ with multiple peaks, and the maximum fluctuating pressure coefficient Cp’ = 0.45. It may be concluded that the critical spacing is about 3.8D.
For the downstream cylinder, the fluctuating pressure distribution is obviously different from that at α = 0°, and the fluctuating pressure distribution is not symmetrical versus θ. Such an asymmetrical distribution is peculiar to the twin cylinders with staggered arrangement [47]. At W/D ≤ 3.5, the fluctuating wind pressure almost keeps constant at θ = 0°~180° with a small value less than 0.1. The fluctuating pressure coefficient starts to increase gradually versus θ and reaches a maximum value at θ = 280°. This may be due to the reattachment of the shear layer produced by the upstream cylinder, resulting in an increase in the fluctuating pressure coefficient [27]. When W/D > 3.5, four peaks can be seen from the curves of fluctuating pressure distribution, and the maximum peak is nearly at θ = 300°. At W/D = 3.8, the peak reaches a maximum value of 1.05. This peak may be due to the impact effect of the vortex shedding generated from the upstream cylinder. The specific flow pattern and peak formation under this condition need to be further studied by means of fluid visualization.
A great deal of research has been conducted on the distribution of the parallel twin cylinder pressure at α = 0° with various Reynolds numbers. The distributions of both time–mean and fluctuating pressure have been given by researchers [34]. The results in this study are qualitatively or quantitatively consistent with those in the previous study mentioned above. In addition, the results of the time–mean pressure distribution at α = 9° are consistent with those obtained by Gu and Sun [47] under high sub-critical Reynolds numbers in the trends.

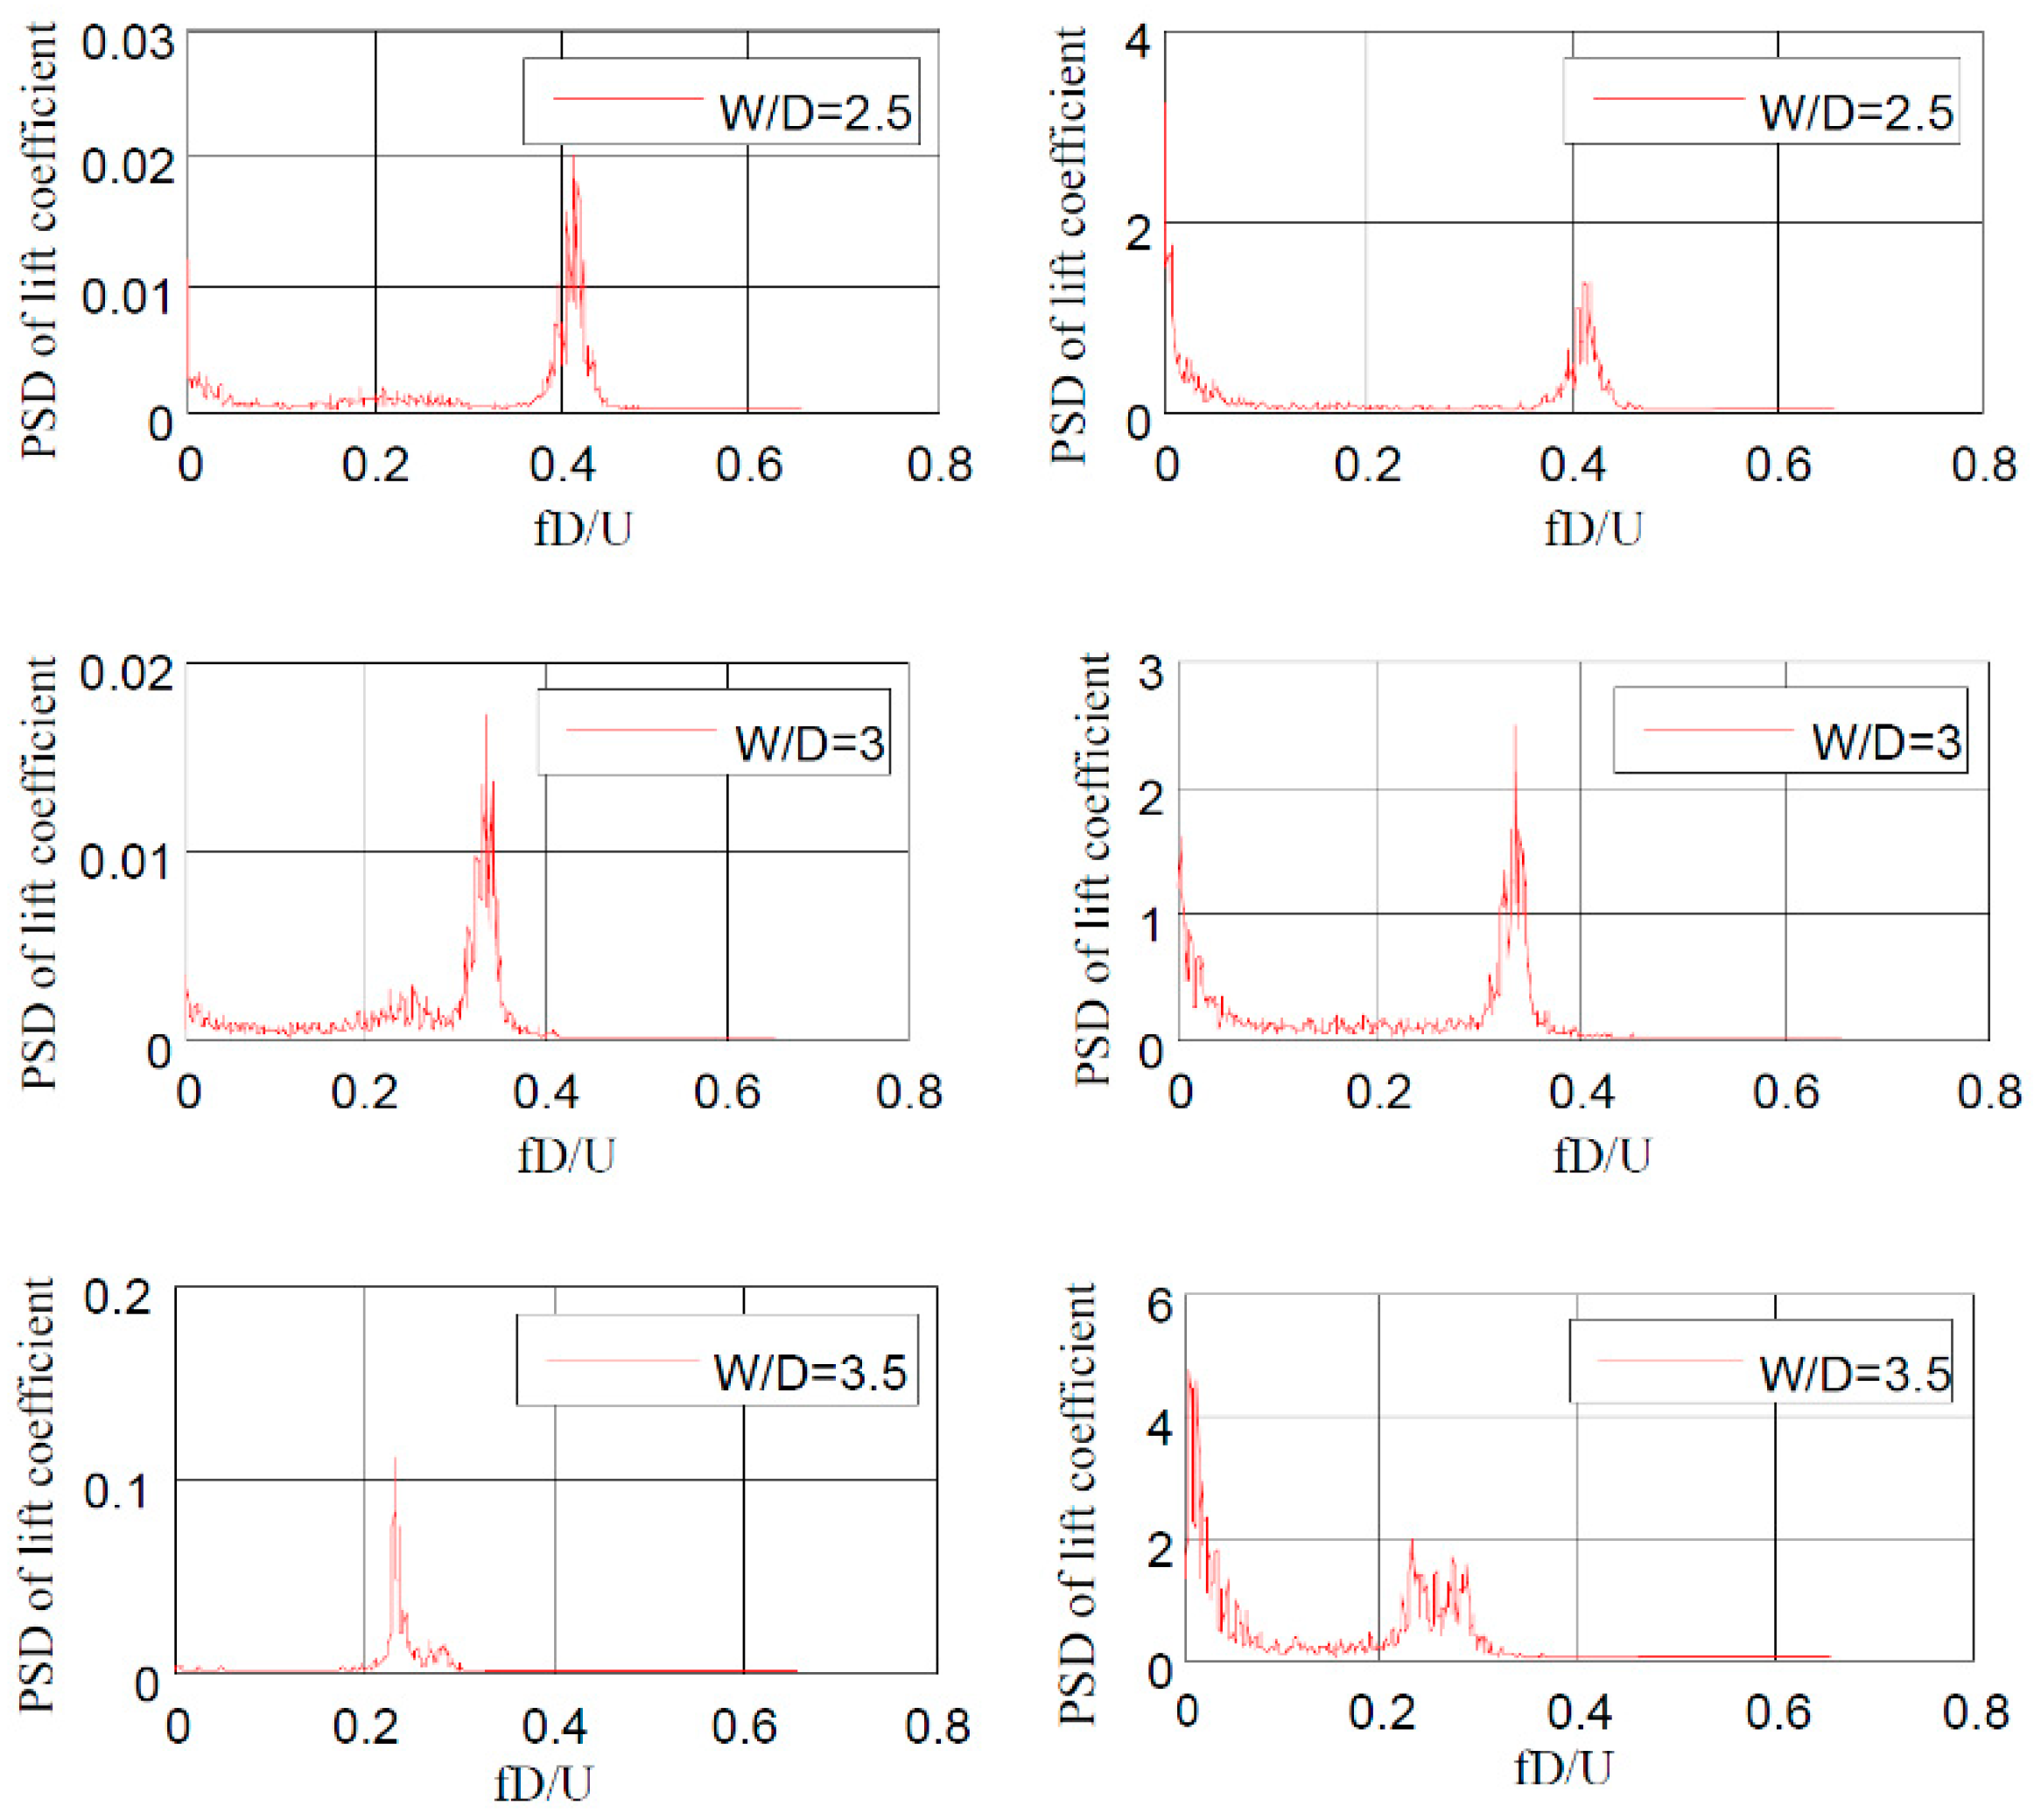
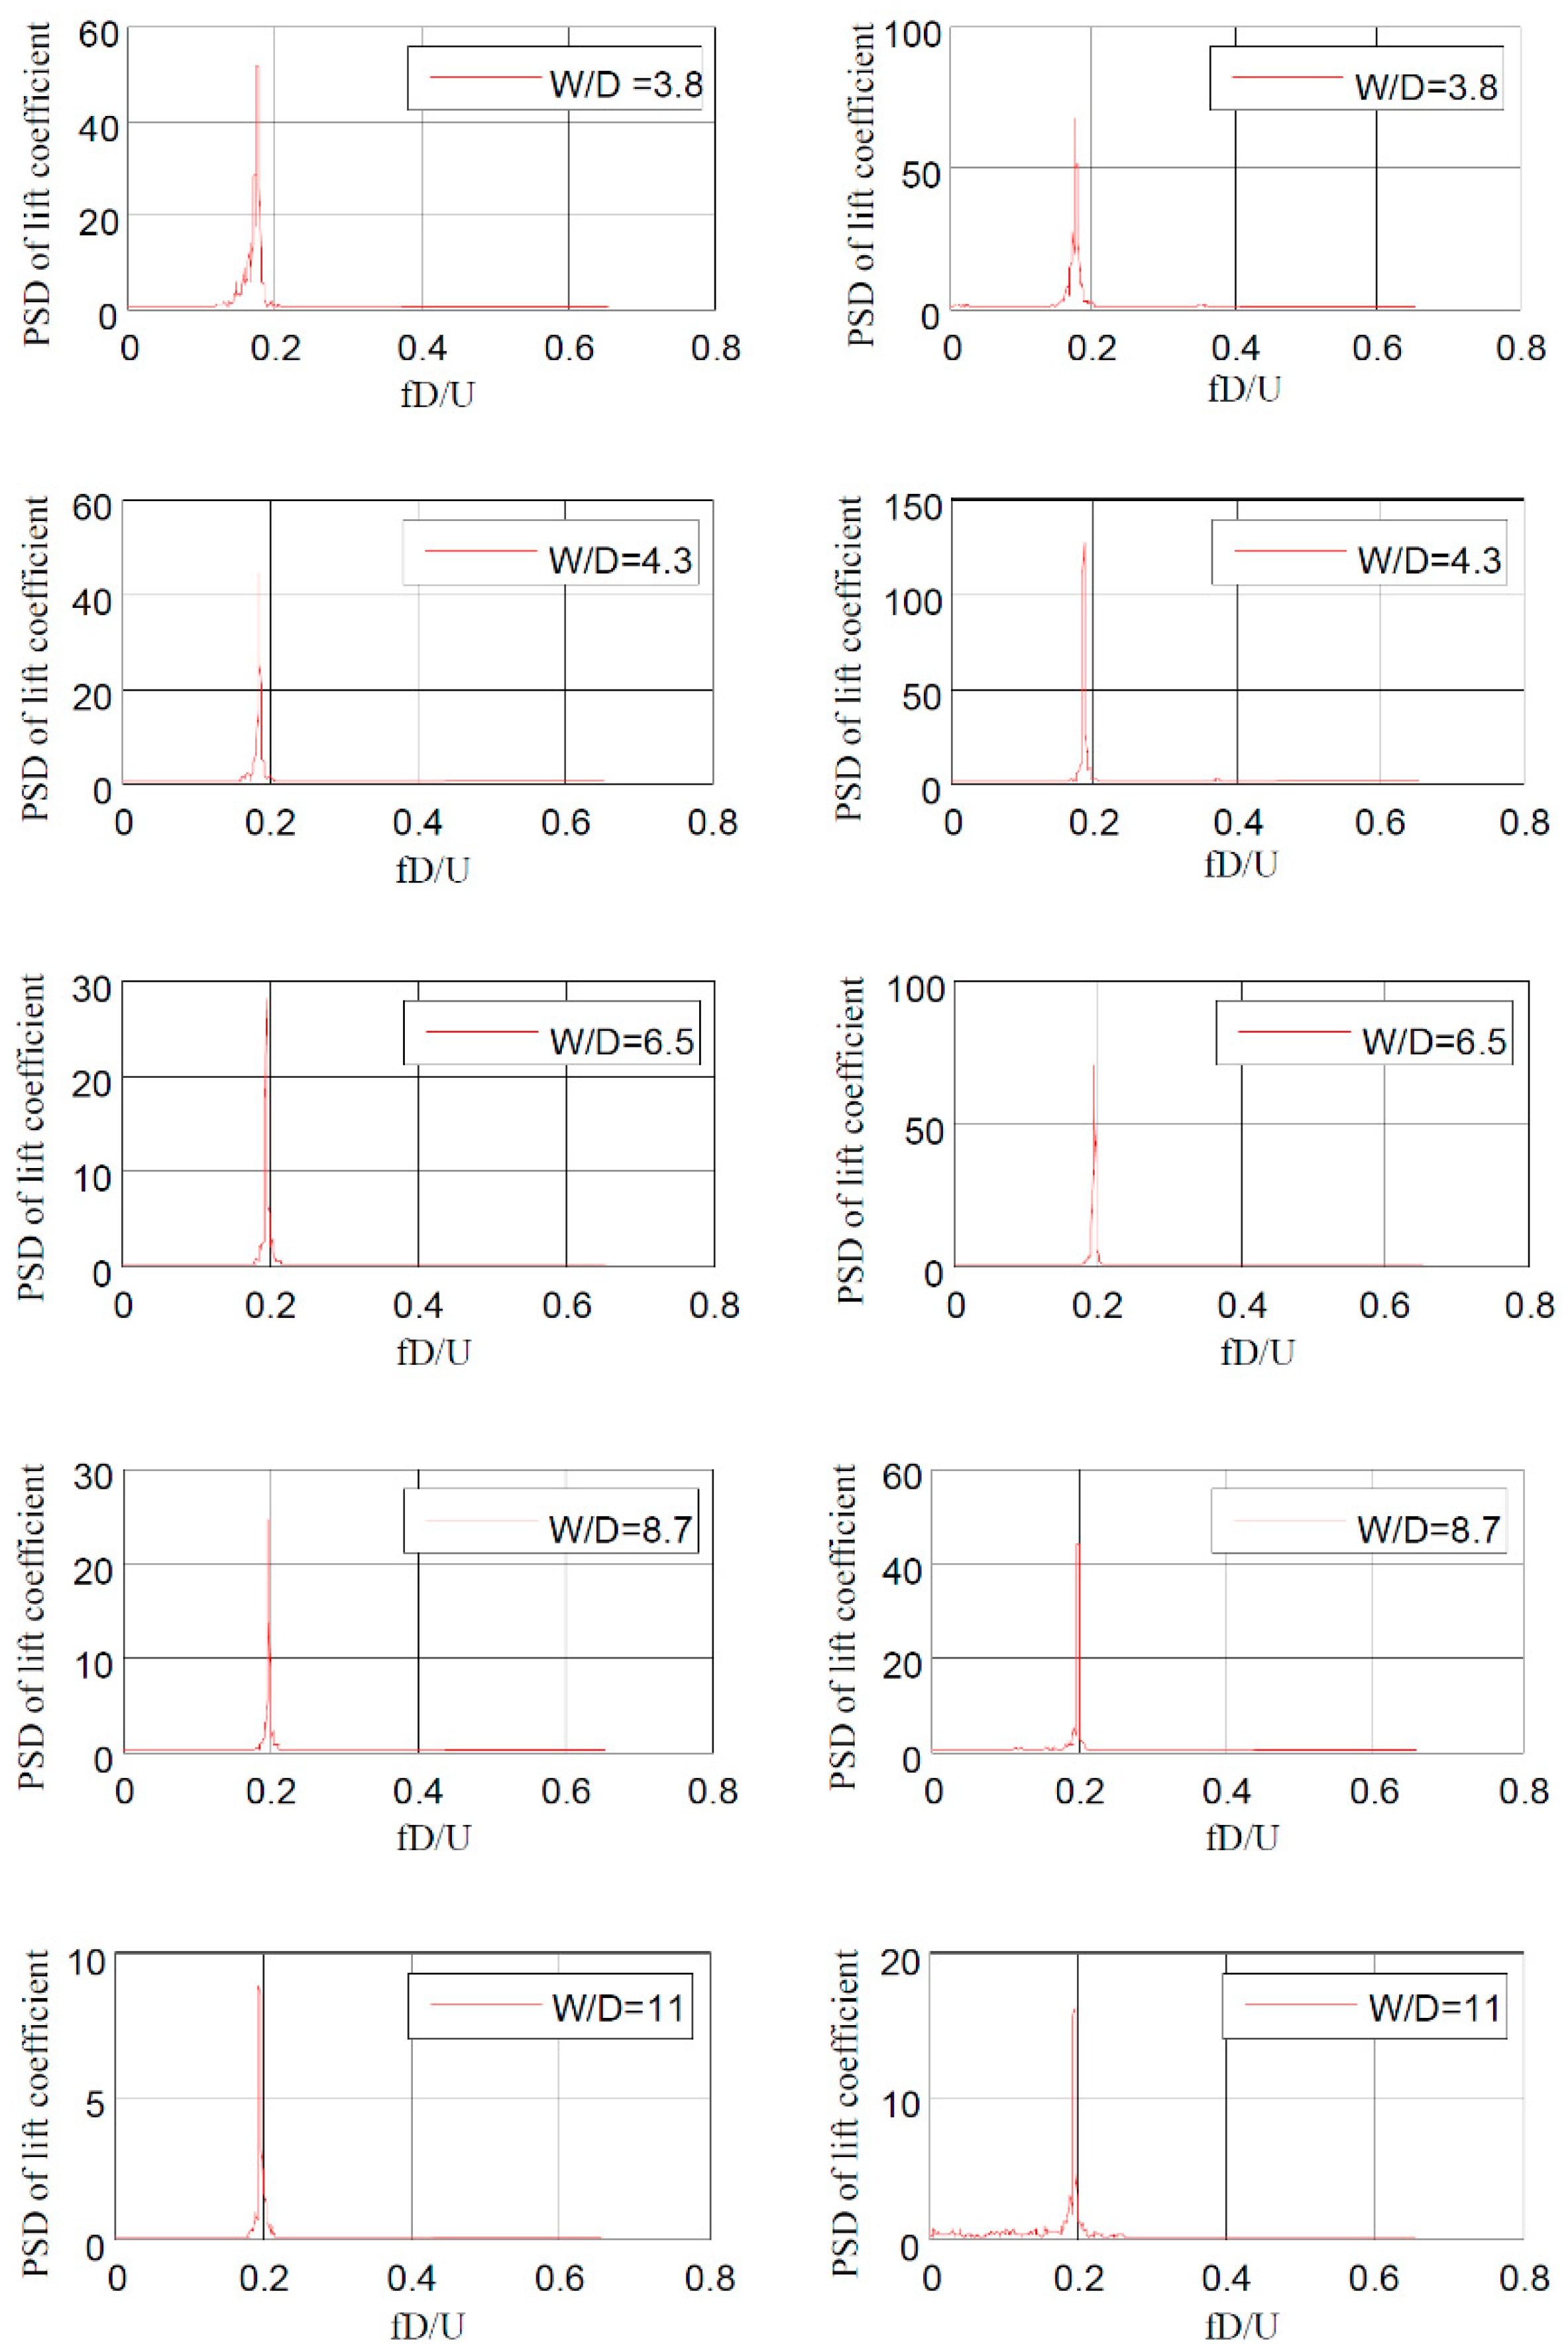
3.3. Spectral Analysis

Spectral analysis is an effective method for further study of the flow regime. Power spectra of lift for the twin cylinders with various spacings at α = 9° are shown in Figure 8, in which the horizontal coordinate represents the reduced frequency St = fD/U (where f denotes frequency, D is the diameter of the cylinder and U denotes the wind velocity of incoming flow). Lift coefficients of cylinders are obtained by Equation (2) in Section 2.2. At W/D ≤ 3.5, although the spectrum curve of the upstream cylinder has a peak, the corresponding value is very small (notice that the ordinate range of the spectrum map is different). In this case, the vortex shedding of the upstream cylinder is suppressed by the downstream cylinder, and the dominant frequency is caused by the alternate separation of shear layers from the upstream cylinder. The dominant frequency of the downstream cylinder is caused by the vortex shedding from the downstream cylinder, and it decreases with the rising spacing. When W/D > 3.5, the peak values of cylinders rapidly increase, indicating that obvious vortex shedding is starting to be produced by the upstream cylinder. Meanwhile, the dominant frequencies of both the cylinders all jump to 0.18, and then gradually increase to 0.2 with increasing spacing. In other words, the flow regimes around twin cylinders are almost consistent with that of a single cylinder at large spacings. To sum up, the flow around twin cylinders presents two different patterns with various spacings in this study. This conclusion is consistent with that of the analysis for pressure distribution in the above.

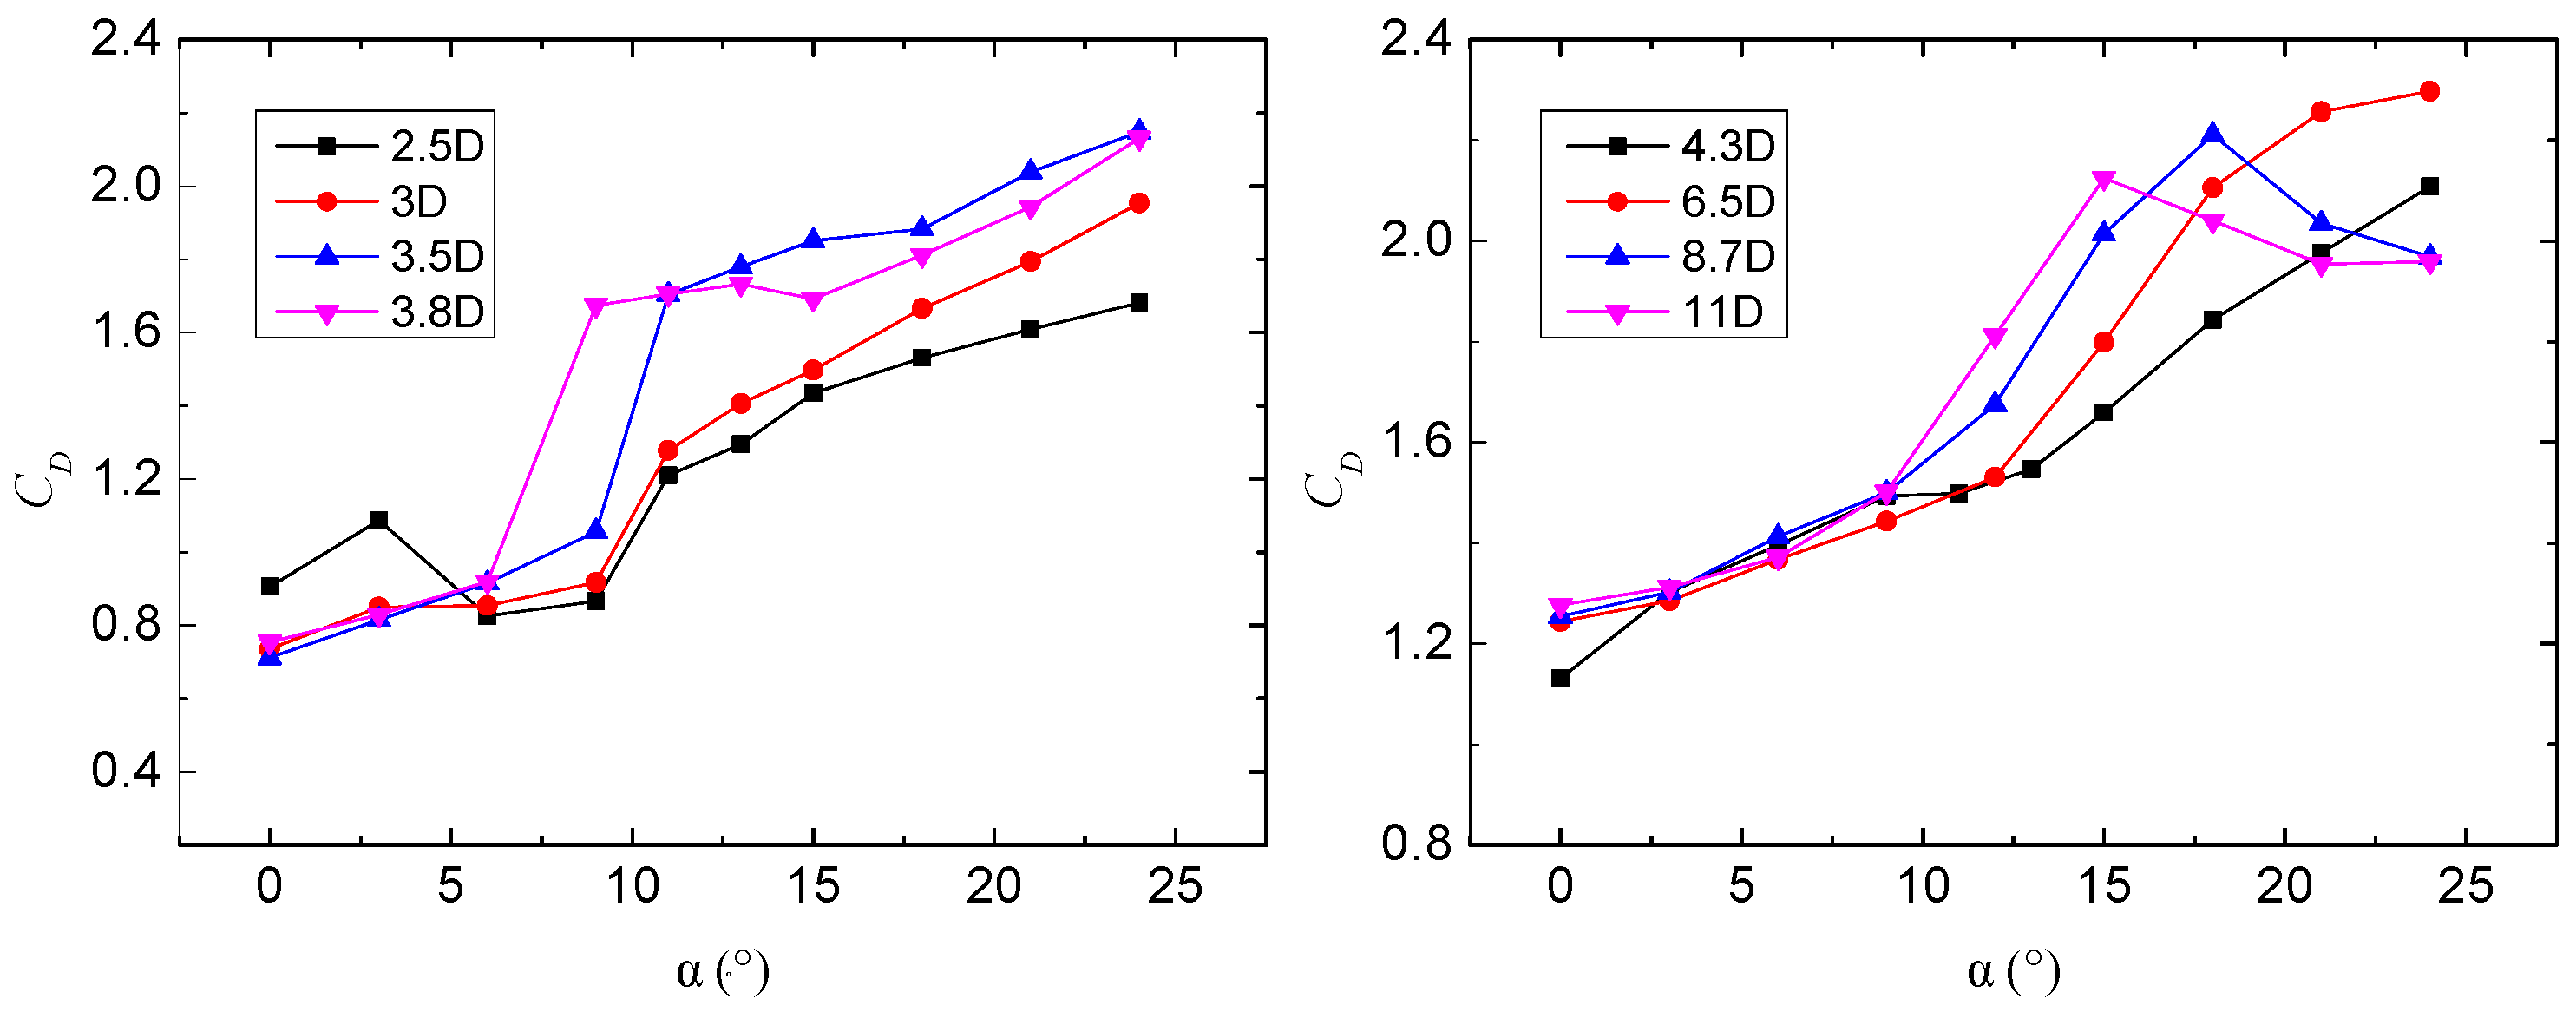
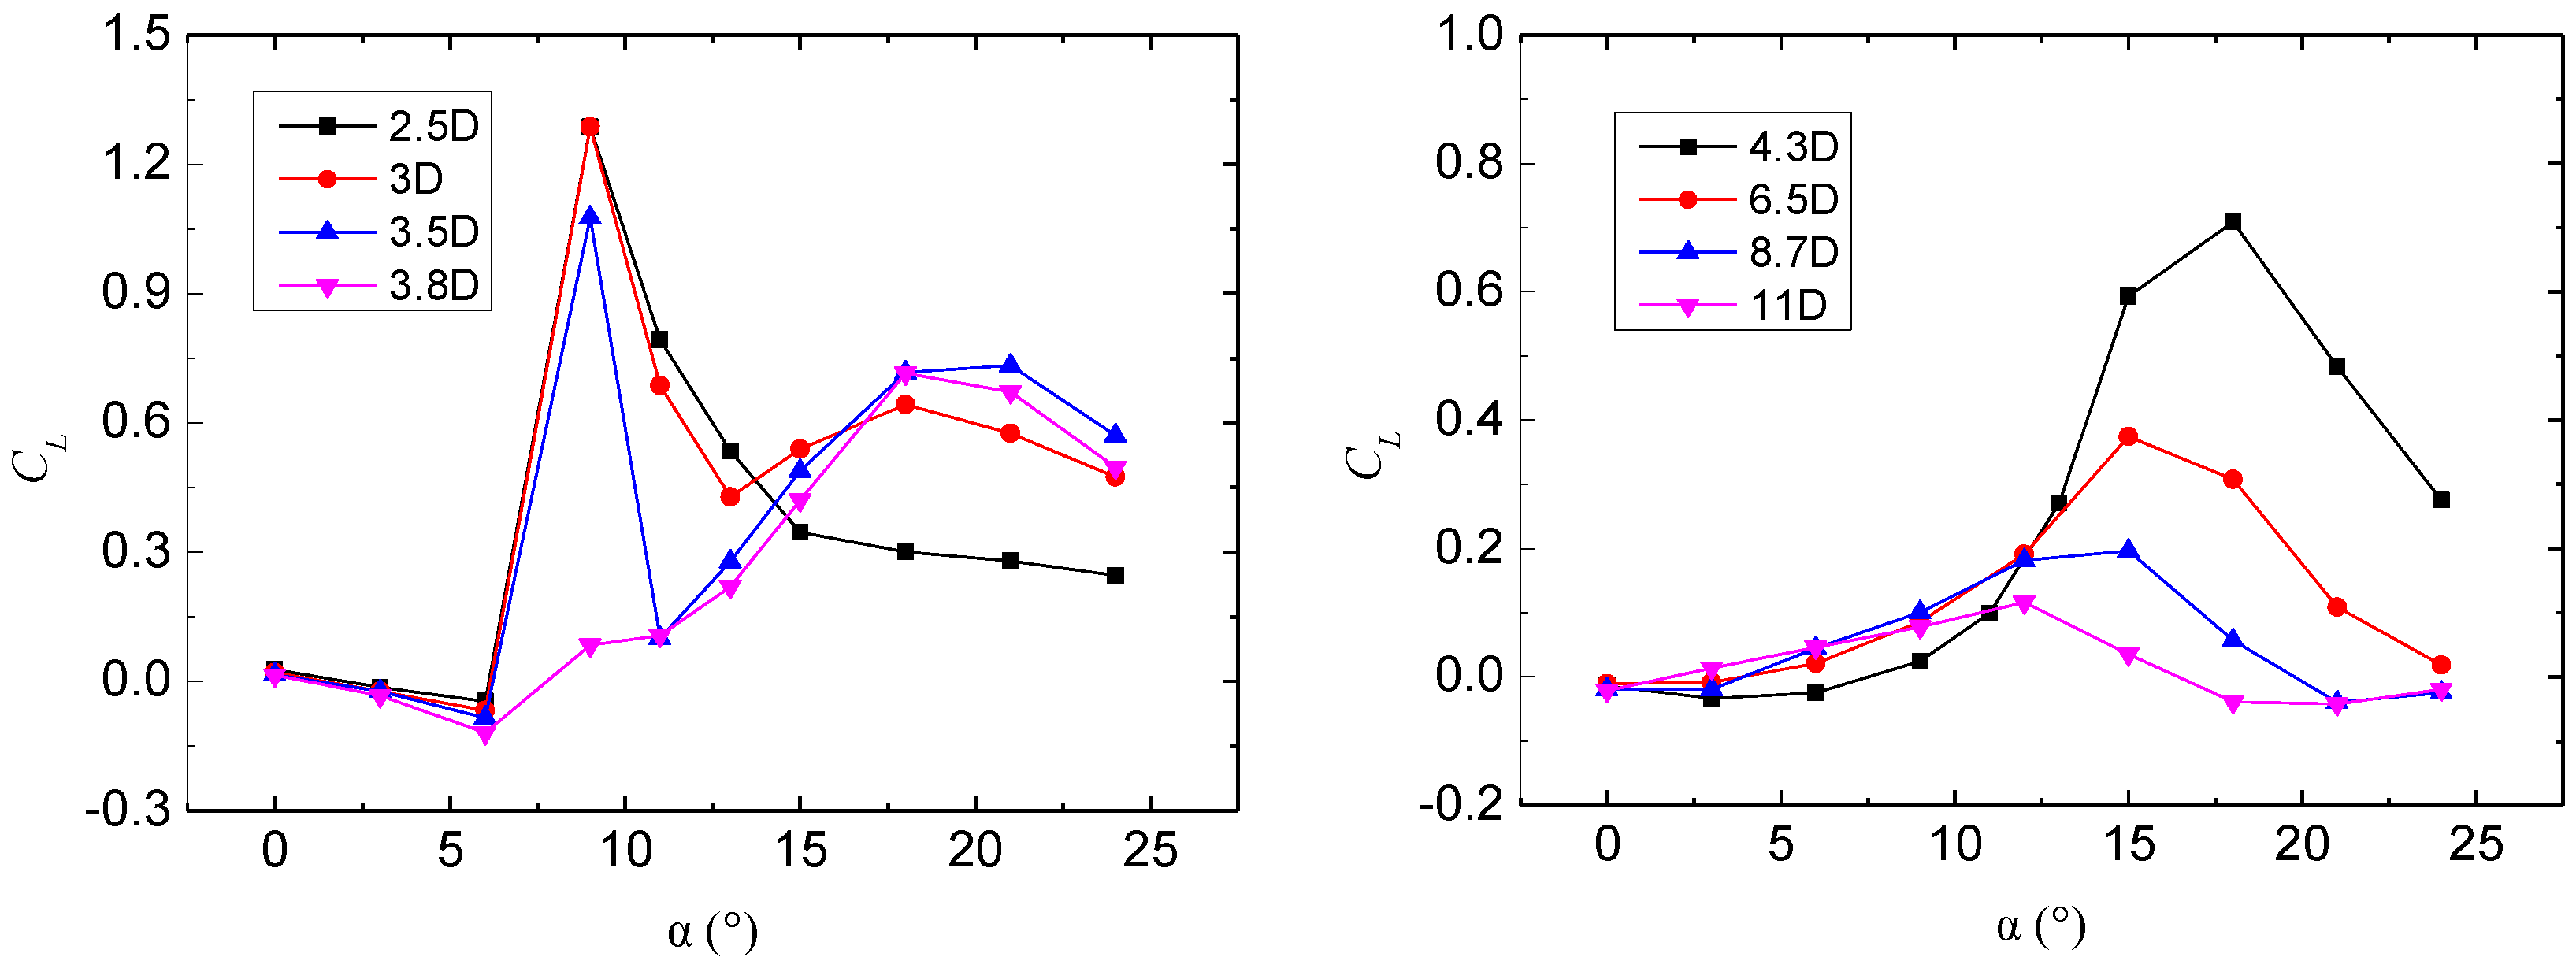
3.4. Aerodynamic Forces

For the coupled twin cylinders, the total aerodynamic forces of twin cylinders are more helpful for the study of the exciting mechanism of synchronous vibration, compared with those of the individual cylinders. Figure 9 shows the total drag coefficient of twin cylinders with various spacings. It is shown that the shelter effect of the upstream cylinder on the downstream cylinder weakens with rising α, leading to an increase in the total drag force of the twin cylinders. The total drag force comes to an almost stable value when the spacing reaches 8.7D, and the value is nearly twice as large as that of a single cylinder [50]. At W/D ≤ 3.5, the total drag coefficient at α = 0° is about 0.8, less than that of a single cylinder. In this case, the downstream cylinder is sucked by the upstream cylinder, thus the drag force of the downstream cylinder is negative. This conclusion is consistent with the results shown in Figure 4b. In addition, the total drag coefficient jumps to a higher value nearly at α = 9°, which is coursed by the impact effect of the wake flow from the upstream cylinder on the downstream cylinder mentioned in Section 3.1. When W/D > 4.3, the total drag coefficient at α = 0° is about 1.25, a little larger than that of a single cylinder. In other words, the drag force of the downstream cylinder is positive in this case. In addition, it is worth mentioning that the total drag coefficient has a decreasing trend when the wind incidence angle is larger than 15° at W/D ≥ 8.7.
Figure 10 shows the total lift coefficient of twin cylinders at various spacings. At W/D ≤ 3.5, the total drag coefficient comes to a peak nearly at α = 9° with a maximum value of 1.29 at W/D = 3. In this case, the wake flow of the upstream cylinder flows rapidly near the top edge of the downstream cylinder, which causes a negative pressure region near the corresponding edge region. As a result, the lift force of the downstream cylinder reaches a large value, and the total lift of coupled twin cylinders comes to a peak. Furthermore, there is a sharp drop in the total lift coefficient in the range of 9° < α < 12°. This may lead to aeroelastic instability when the flow velocity increases to a critical value. Additionally, this can be a valid explanation for the galloping of several engineering structures [25,28]. When W/D > 3.8, on the whole, the variation trends of total lift coefficient versus α for various spacings are largely consistent with no dramatic changes. In addition, the effect of flow incidence angle on the total lift coefficient of the twin cylinders decreases with increasing spacing. When W/D = 11, the total lift coefficient remains almost unchanged with a value of 0 with increasing α.

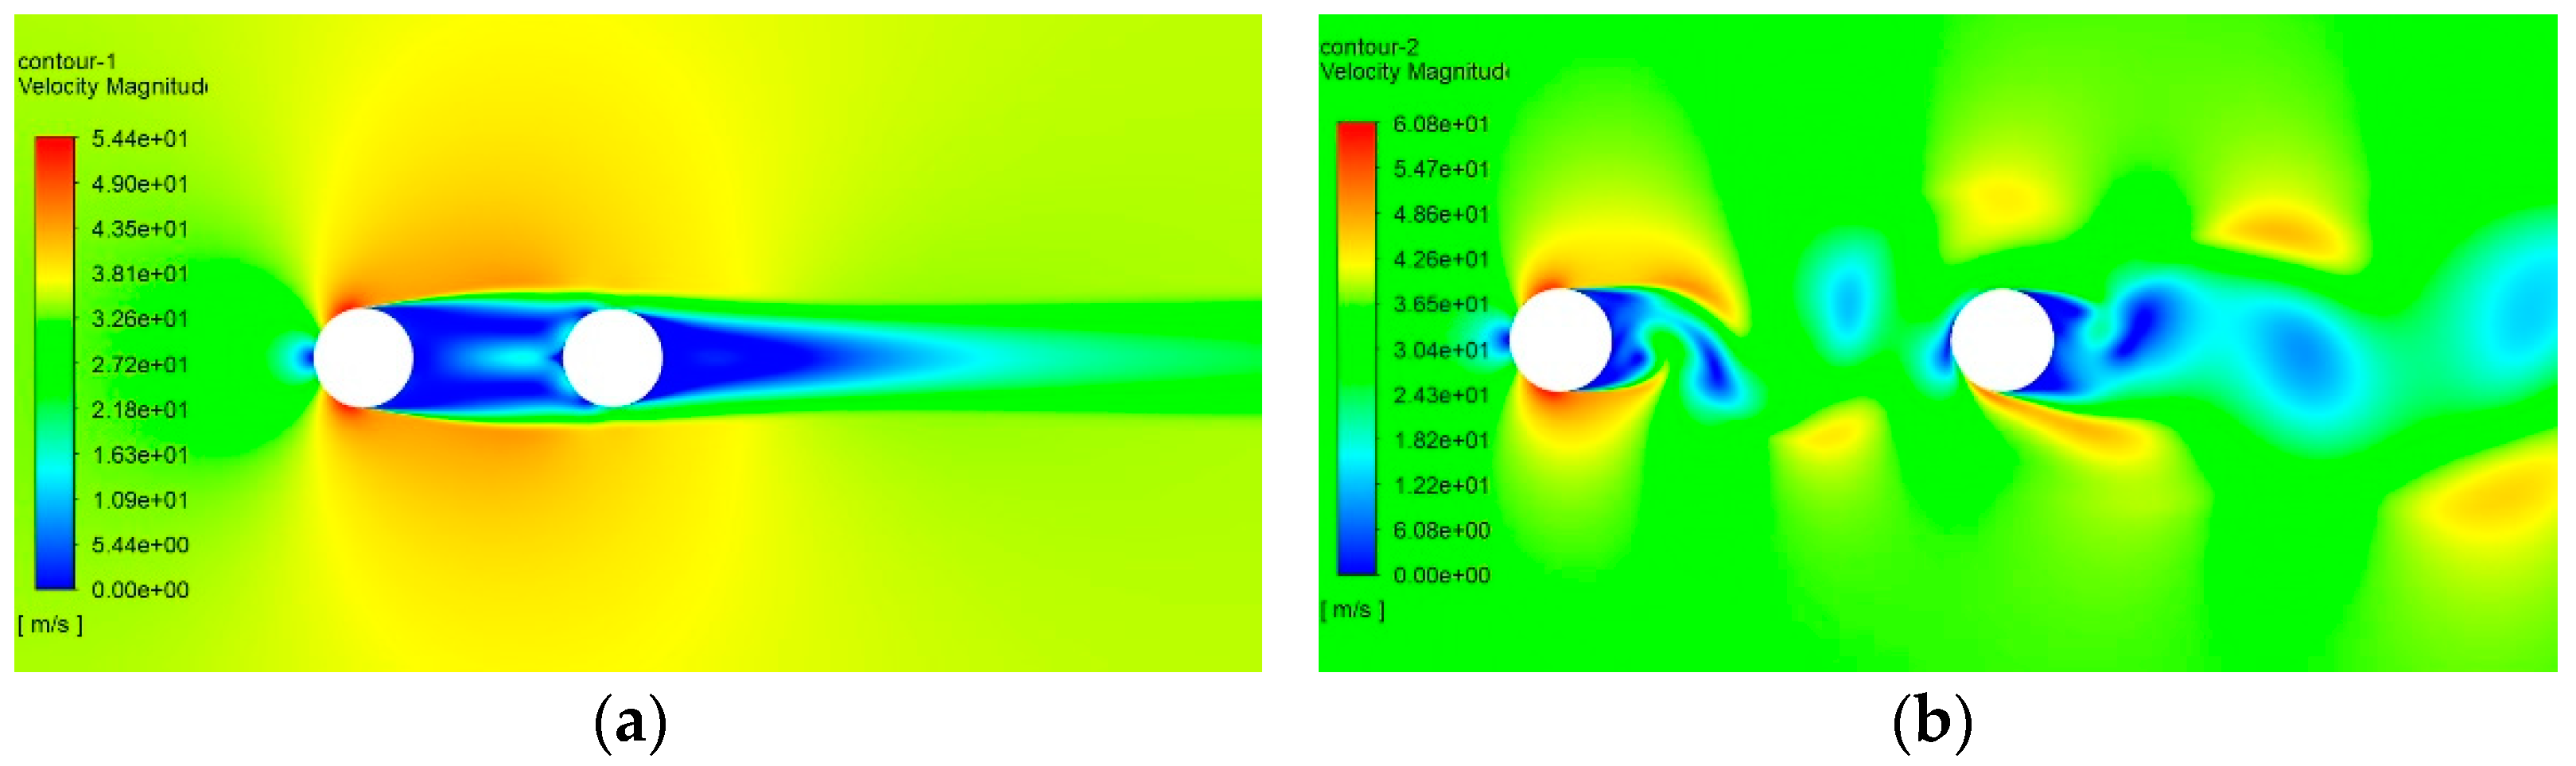
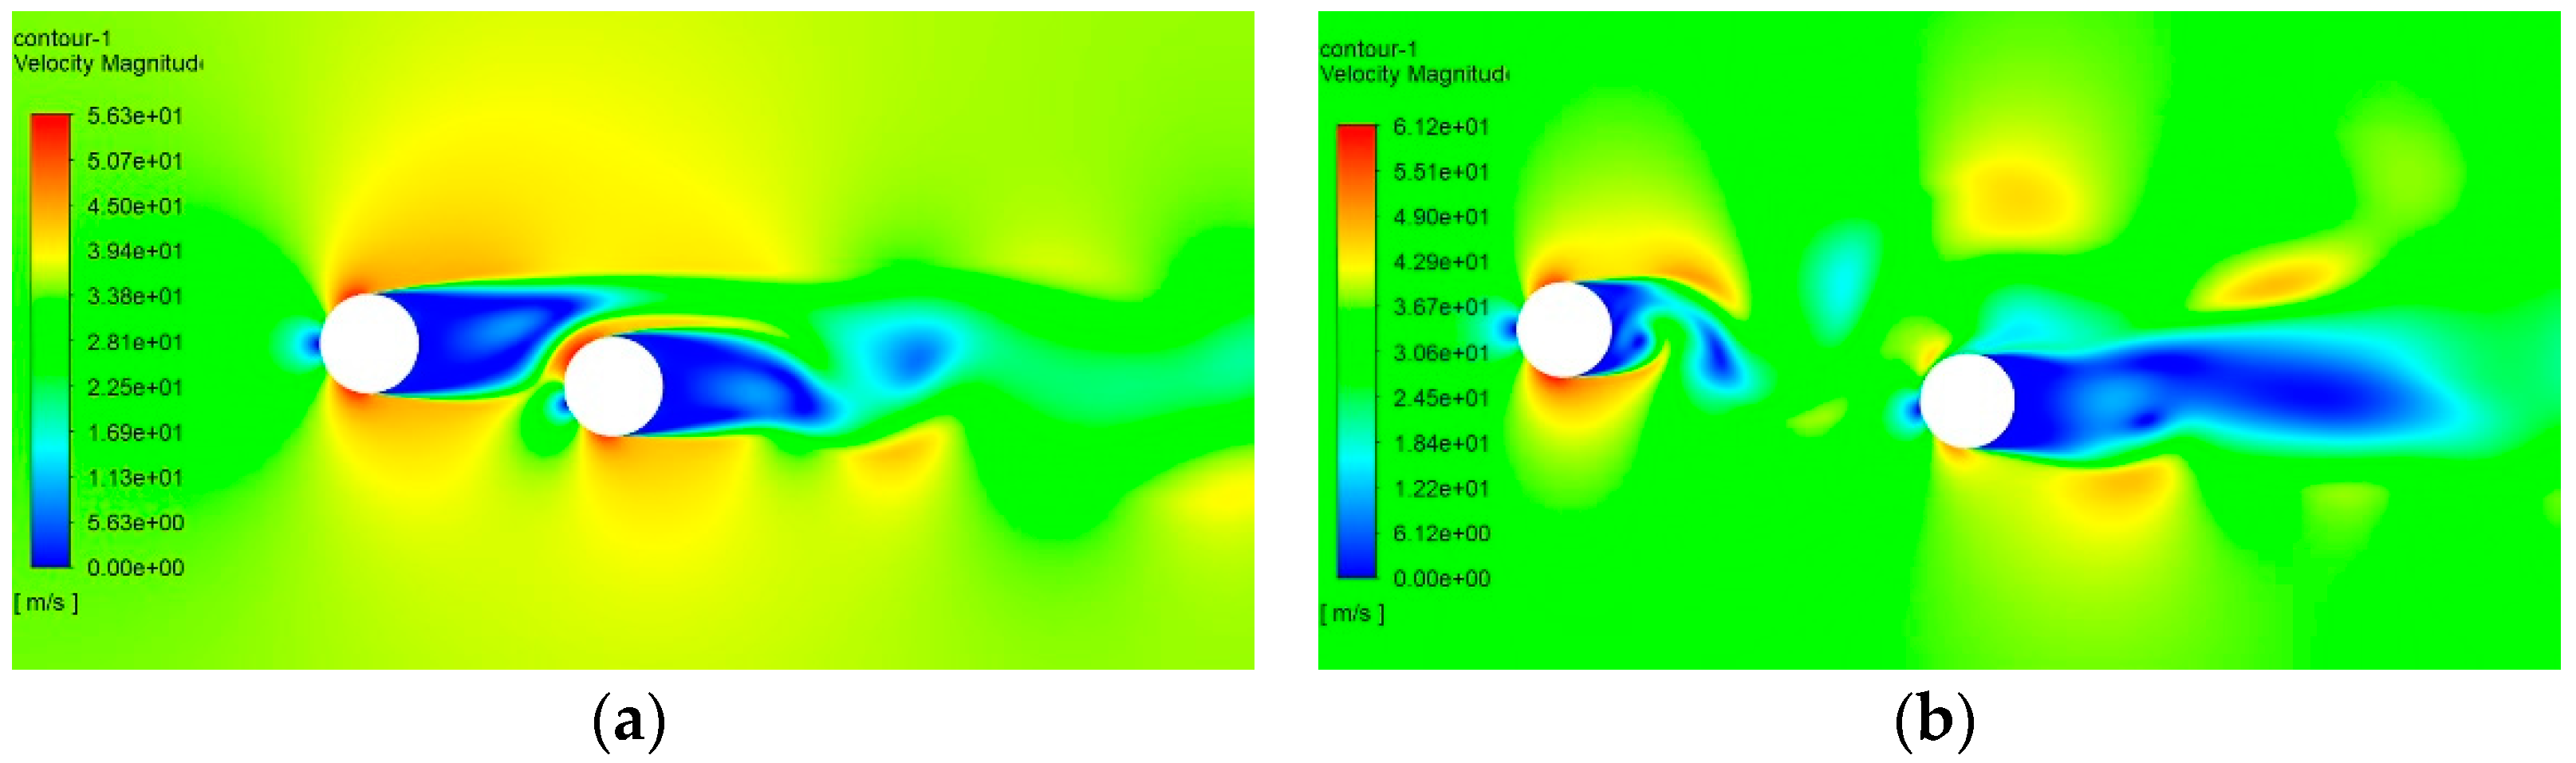
4. Flow Visualization

In order to better understand the flow characteristics and wake interference between two cylinders, two-dimensional fluid computations using CFD (computational fluid dynamics) technology were also performed to visualize the flow regimes around cylinders. RANS (Reynolds Averaged Navier–Stokes) and LES (Large Eddy Simulation) are two most popular methods in CFD simulation. In recent decades, they have been widely used in the simulation of flow around cylinders, and the efficiency of them has been verified by many previous studies [29]. By contrast, RANS is much less computationally intensive than LES and is sufficient to describe the nature of the problem in this study. Therefore, RANS equations were chosen and solved with the SST k-ω turbulence model in this study [8,51]. Before formal simulation, a mesh convergence test for the numerical model was carried out on a single circular cylinder (as shown in Appendix A). The computational domain used for the numerical model with a height of 45D and width of 68D was discretized by about 250,000 cells, and the mesh near cylinders is shown in Figure 11. Furthermore, to validate both the present experimental and numerical method, the results of a single circular cylinder are compared with the data of other literatures in Table 1. It can be seen that the present results are in agreement with the literature to a certain extent, especially those of the experiment. Nevertheless, the drag coefficient by numerical simulation of this paper is about 16~25% smaller than those of the experiments, while the corresponding numerical result of [52] is about 13~27% smaller than the experiment results. Present Strouhal numbers (St) also agree well with those of the previous papers. To sum up, errors in this paper can be generally accepted.
According to the discussion in Section 3, there are two typical flow patterns for twin cylinders both in tandem and staggered arrangements with various spacings. Therefore, two typical spacings of 2.5D and 4.3D are selected for numerical computation. Figure 12 shows the velocity contours for twin cylinders arranged in tandem. It can be seen that the flow regime around the twin cylinders shows two typical patterns. For W/D = 2.5, both shear layers from the upstream cylinder symmetrically reattached to the downstream one, and as outlined above, flow velocity is very low in the gap between cylinders. Meanwhile, the vortex formation of the downstream cylinder is not identifiable. In the other flow pattern, for W/D = 4.3, small vortices were formed in the space between the cylinders and convected toward the downstream cylinder. In this case, evident vortices are formed in the wake of the downstream cylinder, indicating that the interference effect of the upstream cylinder is weak when compared with the other pattern.
When twin cylinders are placed in a staggered arrangement, things become different. It is worth mentioning that in numerical simulation, the total lift coefficient of the twin cylinders at W/D = 2.5 comes to a peak at α = 10°, differing from the experiment result that the total lift coefficient comes to a peak at α = 9°. This difference may be caused by the large gradient of 3° for the wind incidence angle in the wind tunnel test. To make better sense of the distinct flow pattern at the critical angle, the velocity contours for twin cylinders arranged in a staggered arrangement at α = 10° are shown (Figure 13) and discussed in this paper. At W/D = 2.5, the vortex formation of the downstream cylinder is identifiable, while the vortex shedding of the upstream cylinder is completely suppressed by the downstream one. In this case, as discussed in Section 3, the wake flow of the upstream cylinder flows rapidly near the top edge and impacts on the inlet edge of the downstream cylinder, which leads to a positive lift and drag, respectively. When W/D = 4.3, the interference becomes weaker and apparent vortexes are generated from both the twin cylinders. Nevertheless, the vortex street is asymmetrical on account of the staggered arrangement. In general, the flow visualization agrees well with the results of pressure measurement in this paper. In addition to the flow-induced vibrations of twin cylinders, the conclusions drawn above could also be useful for evaluating the wind pressures on structures with multiple cylinders [54,55,56].

5. Conclusions

The aerodynamic forcing characteristics of coupled twin circular cylinders were investigated experimentally to study the synchronous galloping. Pressure measurements were performed on a stationary section model with a series of cylinder spacings and wind incidence angles. Based on the pressure data, mean and fluctuating pressure distributions, reduced frequencies and total aerodynamic forces of the cylinders are discussed. Moreover, numerical simulations were performed for flow visualization. The conclusions are summarized as follows:
(1) The flow around twin cylinders shows two distinct patterns with various spacings, and the corresponding critical spacings at wind incidence angles of 0° and 9° are in the range of 3.8D~4.3D and 3.5D~3.8D, respectively.
(2) When W/D is greater than the critical value, regular vortex shedding will be generated from the upstream cylinder and the vortexes impact upon the downstream cylinder. In consequence, large fluctuating pressure on the downstream cylinder is induced, while the fluctuation decreases with increasing W/D. When W/D is smaller than the critical value, the vortex shedding of the upstream cylinder is suppressed by the downstream cylinder: the symmetric region between the twin cylinders is almost static at a wind incidence angle of 0°; a negative pressure region emerges on the top edge of the downstream cylinder and the pressure distribution is asymmetrical at a wind incidence angle of 9°.
(3) When 2.5 ≤ W/D ≤ 3.5, there is a critical wind incidence angle near 9°. In this case, the wake flow of the upstream cylinder flows rapidly near the top edge and impacts on the inlet edge of the downstream cylinder, which causes a negative and positive pressure region near the corresponding edge regions, respectively. Hence, the lift force of the downstream cylinder comes to a peak while the drag force jumps to a higher value. In consequence, the total lift force of the twin cylinders comes to a peak while the total drag force jumps to a higher value. Furthermore, there is a sharp drop in the total lift coefficient in the range of 9° < α < 12°, and this may lead to aeroelastic instability of the coupled twin cylinders when the flow velocity increases to a critical value. Therefore, these cases (i.e., 9° < α < 12° while 2.5 ≤ W/D ≤ 3.5) should be carefully checked in engineering applications involving avoiding aeroelastic instability.

Author Contributions

Conceptualization, X.H.; methodology, C.W. and Q.W.; software, C.W.; validation, X.H. and Z.H.; investigation, C.W., Z.H. and Q.W.; writing—original draft preparation, C.W.; writing—review and editing, X.H. All authors have read and agreed to the published version of the manuscript.

Funding

This study is sponsored by the National Science Foundation for Distinguished Young Scholars of China (No. 52025082), the National Science Foundation of China (No. 51422806), and the Hunan Provincial Innovation Foundation for Postgraduate, China (No. CX20190288), which are greatly acknowledged.

Acknowledgments

The help from Qi-lin Wu, former graduate student, is also appreciated for conducting wind tunnel tests.

Conflicts of Interest

The authors declare no conflict of interest.

Appendix A

The mesh convergence test of the CFD model is carried out on a single cylinder before the numerical simulation of twin cylinders. In the test, mesh quality is mainly evaluated through the dimensionless height of the first layer mesh (namely y+) [8] close to the cylinder. Calculation results of the single cylinder with different numbers of mesh are shown in the following Table A1. According to the results shown in Table A1, the numerical result of a single cylinder is very sensitive to y+ (or numbers of mesh) of the model, and a convergence is reached when y+ comes to a value smaller than 0.8. Hence, the condition of y+ < 0.8 is adopted in the formal simulation of twin cylinders in this study.
Table A1. Numerical results of a single cylinder with different numbers of mesh.
y+Number of MeshCDCLSt
y+ < 104.2 × 1041.400.000.22
y+ < 37.6 × 1041.130.000.20
y+ < 1.51.1 × 1050.950.000.21
y+ < 0.81.4 × 1050.940.000.21

References

  1. Gimsing, N.J.; Georgakis, C.T. Cable Supported Bridges: Concept and Design; John Wiley Sons: Chichester, UK, 2011. [Google Scholar]
  2. Katsuchi, H.; Jones, N.P.; Scanlan, R.H.; Akiyama, H. Multi-mode flutter and buffeting analysis of the Akashi-Kaikyo bridge. J. Wind Eng. Ind. Aerodyn. 1998, 77, 431–441. [Google Scholar] [CrossRef]
  3. Larsen, A. Aerodynamic aspects of the final design of the 1624 m suspension bridge across the Great Belt. J. Wind Eng. Ind. Aerodyn. 1993, 48, 261–285. [Google Scholar] [CrossRef]
  4. Hua, X.G.; Chen, Z.Q.; Lei, X.; Wen, Q.; Niu, H.W. Monitoring and control of wind-induced vibrations of hanger ropes of a suspension bridge. Smart Struct. Syst. 2019, 31, 683–693. [Google Scholar]
  5. Wardlaw, R.L.; Cooper, K.R.; Ko, R.G.; Watts, J.A. Wind tunnel and analytical investigations into the aeroelastic behaviors of bundle conductors. IEEE Trans. Power Appar. Syst. 1975, 94, 642–653. [Google Scholar] [CrossRef]
  6. Wardlaw, R.L. Interference and Proximity Effects in Wind-Excited Vibrations of Structures; Springer: Wien, Germany, 1994. [Google Scholar]
  7. Paidoussis, M.; Price, S.; de Langre, E. Fluid-Structure Interactions: Cross-Flow-Induced Instabilities; Cambridge University Press: Cambridge, UK, 2011. [Google Scholar]
  8. An, Y.H.; Wang, C.Q.; Li, S.L.; Wang, D.W. Galloping of steepled main cables in long-span suspension bridges during construction. Wind Struct. 2016, 23, 595–613. [Google Scholar] [CrossRef]
  9. Zdravkovich, M.M. Review of flow interference between two circular cylinders various arrangements. J. Fluids Eng. 1977, 99, 618–633. [Google Scholar] [CrossRef]
  10. Zdravkovich, M.M. Flow induced oscillations of two interfering circular cylinders. J. Fluids Eng. 1985, 99, 618–633. [Google Scholar] [CrossRef]
  11. Zdravkovich, M.M. Flow around Circular Cylinders, Vol. 1. Fundamentals; Oxford University Press: Oxford, UK, 1997. [Google Scholar]
  12. Matsumoto, M.; Shiraishi, N.; Shirato, H. Aerodynamic instabilities of twin circular cylinders. J. Wind Eng. Ind. Aerodyn. 1990, 33, 91–100. [Google Scholar] [CrossRef]
  13. Li, S.L.; An, Y.H.; Wang, C.Q.; Wang, D.W. Experimental and numerical studies on galloping of the flat-topped main cables for the long span suspension bridge during construction. J. Wind Eng. Ind. Aerodyn. 2017, 163, 24–32. [Google Scholar] [CrossRef]
  14. Zhou, Y.; Alam, M.M. Wake of two interacting circular cylinders: A review. Int. J. Heat Fluid Flow 2016, 62, 510–537. [Google Scholar] [CrossRef]
  15. Blevins, R.D. Flow-Induced Vibrations; Van Nostrand Reinhold: New York, NY, USA, 1990. [Google Scholar]
  16. Zdravkovich, M.M. Flow around Circular Cylinders, Vol. 2. Applications; Oxford University Press: Oxford, UK, 2003. [Google Scholar]
  17. Kim, B.; Tse, K.T.; Yoshida, A.; Chen, Z.S.; Phuc, P.V.; Park, H.S. Investigation of flow visualization around linked tall buildings with circular sections. Build. Environ. 2019, 153, 60–76. [Google Scholar] [CrossRef]
  18. Kim, B.; Tse, K.T.; Tamura, Y. POD analysis for aerodynamic characteristics of tall linked buildings. J. Wind Eng. Ind. Aerodyn. 2018, 181, 126–140. [Google Scholar] [CrossRef]
  19. Kim, B.; Tse, K.T.; Yoshida, A.; Tamura, Y.; Chen, Z.S. Statistical analysis of wind-induced pressure fields and PIV measurements on two buildings. J. Wind Eng. Ind. Aerodyn. 2019, 188, 161–174. [Google Scholar] [CrossRef]
  20. Zhao, M.; Yan, G.R. Numerical simulation of vortex-induced vibration of two circular cylinders of different diameters at low Reynolds number. Phys. Fluids 2013, 25, 083601. [Google Scholar] [CrossRef]
  21. Kim, S.; Kim, H.K. Wake galloping phenomena between two parallel/unparallel Cylinders. Wind Struct. 2014, 18, 511–528. [Google Scholar] [CrossRef]
  22. Chen, Z.Q.; Liu, M.G.; Liu, Z.W. Experimental study on aerodynamic interference of tandem cables based on aeroelastic model. J. Vib. Shock 2008, 27, 7–11. [Google Scholar]
  23. Tokoro, S.; Homatsu, H.; Nakasu, M.; Mizuguchi, K.; Kasuga, A. A study on wake-galloping employing full aeroelastic twin cable model. J. Wind Eng. Ind. Aerodyn. 2010, 88, 247–261. [Google Scholar] [CrossRef]
  24. Takeguchi, M.; Fukunaga, S. Aerodynamic stabilization for wake-induced vibration in parallel hanger ropes of the Akashi Kaikyo Bridge. Wind Eng. JAWE 2012, 37, 300–306. [Google Scholar] [CrossRef] [Green Version]
  25. Zhao, M. Flow induced vibration of two rigidly coupled circular cylinders in tandem and side-by side arrangements at a low Reynolds number of 150. Phys. Fluids 2013, 25, 123601. [Google Scholar] [CrossRef] [Green Version]
  26. Kim, S.; Alam, M.M.; Sakamoto, H.; Zhou, Y. Flow-induced vibrations of two circular cylinders in tandem arrangement. Part1: Characteristics of vibration. J. Wind Eng. Ind. Aerodyn. 2009, 97, 304–311. [Google Scholar] [CrossRef]
  27. Sun, T.F.; Gu, Z.F.; He, D.X.; Zhang, L.L. Fluctuating Pressure on Two Circular Cylinders at High Reynolds Numbers. J. Wind Eng. Ind. Aerodyn. 1992, 41, 577–588. [Google Scholar] [CrossRef]
  28. Wen, Q.; Hua, X.G.; Lei, X.; Chen, Z.Q.; Niu, H.W. Experimental study of wake-induced instability of coupled parallel hanger ropes for suspension bridges. Eng. Struct. 2018, 167, 175–187. [Google Scholar] [CrossRef]
  29. De Wang, J.S.; Fan, D.; Lin, K. A review on flow-induced vibration of offshore circular cylinders. J. Hydrodyn. 2020, 32, 415–440. [Google Scholar] [CrossRef]
  30. Lin, K.; Fan, D.; Wang, J. Dynamic response and hydrodynamic coefficients of a cylinder oscillating in crossflow with an upstream wake interference. Ocean Eng. 2020, 209, 107520. [Google Scholar] [CrossRef]
  31. Zdravkovich, M.M. The effects of interference between circular cylinders in cross flow. J. Fluids Eng. 1987, 1, 239–261. [Google Scholar] [CrossRef]
  32. Cigada, A.; Diana, G.; Falco, M.; Fossati, F.; Manenti, A. Vortex shedding and wake-induced vibrations in single and bundle cables. J. Wind Eng. Ind. Aerodyn. 1997, 72, 253–263. [Google Scholar] [CrossRef]
  33. Mederios, E.B.; Zdravkovich, M.M. Interference-induced oscillation of two un- equal cylinders. J. Wind Eng. Ind. Aerodyn. 1992, 41, 753–762. [Google Scholar] [CrossRef]
  34. Alam, M.M.; Moriya, M.; Takai, K.; Sakamoto, H. Fluctuating fluid forces acting on two circular cylinders in a tandem arrangement at a subcritical Reynolds number. J. Wind Eng. Ind. Aerodyn. 2003, 91, 139–154. [Google Scholar] [CrossRef]
  35. Alam, M.M.; Sakamoto, H.; Zhou, Y. Effect of a T-shaped plate on reduction in fluid forces acting on two tandem circular cylinders in a cross-flow. J. Wind Eng. Ind. Aerodyn. 2006, 94, 525–551. [Google Scholar] [CrossRef]
  36. Sumner, D.; Price, S.J.; Païdoussis, M.P. Flow-pattern identification for two staggered circular cylinders in cross-flow. J. Fluid Mech. 2000, 411, 263–303. [Google Scholar] [CrossRef] [Green Version]
  37. Ribeiro, J.D. Effects of surface roughness on the two-dimensional flow past circular cylinders II: Fluctuating forces and pressures. J. Wind Eng. Ind. Aerodyn. 1991, 37, 311–326. [Google Scholar] [CrossRef]
  38. Mizushima, J.; Suehiro, N. Instability and transition of flow past two tandem circular cylinders. Phys. Fluids 2005, 17, 104107. [Google Scholar] [CrossRef]
  39. Acampora, A.; Macdonald, J.H.G.; Georgakis, C.T.; Nikitas, N. Identification of aeroelastic forces and static drag coefficients of a twin cable bridge stay from full-scale ambient vibration measurements. J. Wind Eng. Ind. Aerodyn. 2014, 124, 90–98. [Google Scholar] [CrossRef]
  40. Hu, G.; Tse, K.T.; Kwok, K.C.S.; Chen, Z.S. Pressure measurements on inclined square prisms. J. Wind Eng. Ind. Aerodyn. 2015, 142, 232–245. [Google Scholar] [CrossRef]
  41. Zu, G.B.; Lam, K.M. Across-wind excitation mechanism for interference of twin tall buildings in staggered arrangement. J. Wind Eng. Ind. Aerodyn. 2018, 177, 167–185. [Google Scholar] [CrossRef]
  42. Batham, J.P. Pressure Distributions on Circular Cylinders at Critical Reynolds Numbers. J. Fluid Mech. 1973, 57, 209–228. [Google Scholar] [CrossRef] [Green Version]
  43. Wang, Y.T.; Yan, Z.M.; Wang, H.M. Numerical simulation of low-Reynolds number flows past two tandem cylinders of different diameters. Water Sci. Eng. 2013, 6, 433–445. [Google Scholar]
  44. Assi, G.R.S.; Bearman, P.W.; Meneghini, J.R. On the wake-induced vibration of tandem circular cylinders: The vortex interaction excitation mechanism. J. Fluids Mech. 2010, 661, 365–401. [Google Scholar] [CrossRef]
  45. Igarashi, T. Characteristics of the flow around two circular cylinders arranged in tandem. Bull. JSME 1981, 24, 323–331. [Google Scholar] [CrossRef]
  46. Arie, M.; Kiya, M.; Moriya, M.; Mori, H. Pressure Fluctuations on the Surface of Two Circular Cylinders in Tandem Arrangement. J. Fluids Eng. 1983, 105, 161–166. [Google Scholar] [CrossRef]
  47. Gu, Z.F.; Sun, T. On interference between two circular cylinders in staggered arrangement at high subcritical Reynolds numbers. J. Wind Eng. Ind. Aerodyn. 1999, 80, 287–309. [Google Scholar] [CrossRef]
  48. Gu, Z.F.; Sun, T.F.; He, D.X.; Zhang, L.L. Two circular cylinders in high-turbulence flow at supercritical Reynolds number. J. Wind Eng. Ind. Aerodyn. 1993, 49, 379–388. [Google Scholar] [CrossRef]
  49. Kim, B.; Tse, K.T. POD analysis of aerodynamic correlations and wind-induced responses of two tall linked buildings. Eng. Struct. 2018, 176, 369–384. [Google Scholar] [CrossRef]
  50. Schewe, G. On the force fluctuations acting on a circular cylinder in crossflow from subcritical up to transcritical Reynolds numbers. J. Fluid Mech. 1983, 133, 265–285. [Google Scholar] [CrossRef]
  51. Wang, C.Q.; Hua, X.G.; Huang, Z.W.; Tang, Y.; Chen, Z.Q. Post-critical behavior of galloping for main cables of suspension bridges in construction phases. J. Fluids Struct. 2021, 101, 103205. [Google Scholar] [CrossRef]
  52. Tutar, M.; Holdø, A.E. Computational modeling of flow around a circular cylinder in sub-critical flow regime with various turbulence models. Int. J. Numer. Methods Fluids 2001, 35, 763–784. [Google Scholar] [CrossRef]
  53. Cantwell, B.; Coles, D. An experimental study of entrainment and transport in the turbulent near wake of a circular cylinder. J. Fluid Mech. 1983, 139, 321–374. [Google Scholar] [CrossRef] [Green Version]
  54. Orlando, M. Wind-induced interference effects on two adjacent cooling towers. Eng. Struct. 2001, 23, 979–992. [Google Scholar] [CrossRef]
  55. Gu, M.; Huang, P.; Tao, L.; Zhou, X.Y.; Fan, Z. Experimental study on wind loading on a complicated group-tower. J. Fluids Struct. 2010, 26, 1142–1154. [Google Scholar]
  56. Xu, F.Y.; Yu, H.Y.; Zhang, M.J.; Han, Y. Experimental study on aerodynamic characteristics of a large-diameter ice-accreted cylin-der without icicles. J. Wind Eng. Ind. Aerodyn. 2021, 208, 104453. [Google Scholar] [CrossRef]
Figure 1. Layout of surface pressure taps on cylinder.
Applsci 11 04189 g001
Figure 2. Relative position of twin cylinders and definition of force coefficients.
Applsci 11 04189 g002
Figure 3. Layout of section model and apparatus in the wind tunnel.
Applsci 11 04189 g003
Figure 4. Distributions of time–mean pressure coefficients on cylinders at α = 0°: (a) upstream cylinder; (b) downstream cylinder.
Applsci 11 04189 g004
Figure 5. Distributions of time–mean pressure coefficients on cylinders at α = 9°: (a) upstream cylinder; (b) downstream cylinder.
Applsci 11 04189 g005
Figure 6. Distributions of fluctuating pressure coefficients on cylinders at α = 0°: (a) upstream cylinder; (b) downstream cylinder.
Applsci 11 04189 g006
Figure 7. Distributions of fluctuating pressure coefficients on cylinders at α = 9°: (a) upstream cylinder; (b) downstream cylinder.
Applsci 11 04189 g007
Figure 8. Power spectra of lift force of both cylinders at α = 9° (left column: upstream cylinder; right column: downstream cylinder).
Applsci 11 04189 g008aApplsci 11 04189 g008b
Figure 9. Drag coefficients of coupled twin cylinders with various spacings.
Applsci 11 04189 g009
Figure 10. Lift coefficients of coupled twin cylinders with various spacings.
Applsci 11 04189 g010
Figure 11. Mesh view of twin cylinder.
Applsci 11 04189 g011
Figure 12. Velocity contours for twin cylinders arranged in tandem: (a) W/D = 2.5; (b) W/D = 4.3.
Applsci 11 04189 g012
Figure 13. Velocity contours for twin cylinders arranged in staggered (α = 10°): (a) W/D = 2.5; (b) W/D = 4.3.
Applsci 11 04189 g013
Table 1. Results comparison of a single cylinder.
Reynolds NumberCaseCDCLSt
1.08 × 10⁵Present experiment1.140.020.20
1.08 × 10⁵Present numerical simulation0.920.000.21
1.10 × 10⁵Experiment of Schewe [50]1.10-0.20
1.40 × 10⁵Experiment of Cantwell [53]1.24-0.18
1.40 × 10⁵Numerical simulation of Tutar and Holdø [52]1.40-0.18
Publisher’s Note: MDPI stays neutral with regard to jurisdictional claims in published maps and institutional affiliations.

