Article

Open-Air Cold Plasma Device Leads to Selective Tumor Cell Cytotoxicity

by
Catarina Almeida-Ferreira
1,†,
Rafael Silva-Teixeira
1,2,†,
Mafalda Laranjo
1,3,4,*,
Nuno Almeida
1,
Gonçalo Brites
1,
João Dias-Ferreira
1,
Inês Marques
1,3,
Rita Neves
1,
Beatriz Serambeque
1,
Ricardo Teixo
1,3,
Ana Margarida Abrantes
1,3,4,
Francisco Caramelo
1,4 and
Maria Filomena Botelho
1,3,4,*
1
Institute for Clinical and Biomedical Research (iCBR), Area of Environment Genetics and Oncobiology (CIMAGO), Institute of Biophysics, Faculty of Medicine, University of Coimbra, 3000-548 Coimbra, Portugal
2
Department of Cardiology, Hospital Center of Vila Nova de Gaia/Espinho, EPE, Rua Conceição Fernandes, 4434-502 Vila Nova de Gaia, Portugal
3
Center for Innovative Biomedicine and Biotechnology (CIBB), University of Coimbra, 3000-548 Coimbra, Portugal
4
Clinical Academic Centre of Coimbra (CACC), 3000-548 Coimbra, Portugal
*
Authors to whom correspondence should be addressed.
These authors contributed equally for this work.
Appl. Sci. 2021, 11(9), 4171; https://doi.org/10.3390/app11094171
Submission received: 6 April 2021 / Revised: 26 April 2021 / Accepted: 29 April 2021 / Published: 2 May 2021

Abstract

:
The need for effective and safe therapies for cancer is growing as aging is modifying its epidemiology. Cold atmospheric plasma (CAP) has gained attention as a potential anti-tumor therapy. CAP is a gas with enough energy to ionize a significant fraction of its constituent particles, forming equal numbers of positive ions and electrons. Timely-resolved output voltage measurement, emission spectroscopy, and quantification of reactive species (RS) in plasma-activated media (PAM) were performed to characterize the physical and chemical properties of plasma. To assess the cytotoxicity of cold atmospheric plasma in human tumors, different cell lines were cultured, plated, and exposed to CAP, followed by MTT and SRB colorimetric assays 24 h later. Human fibroblasts, phenotypically normal cells, were processed similarly. Plasma cytotoxicity was higher in cells of breast cancer, urinary bladder cancer, osteosarcoma, lung cancer, melanoma, and endometrial cancer. Cytotoxicity was time-dependent and possibly related to the increased production of hydrogen peroxide in the exposed medium. Sixty seconds of CAP exposure renders selective effects, preserving the viability of fibroblast cells. These results point to the importance of conducting further studies of the therapy with plasma.

1. Introduction

Normal cells evolve progressively to neoplastic cells as they develop a succession of capabilities, named the hallmarks of cancer. Cancer cells acquire a selective growth advantage, which can lead to uncontrolled proliferation and consequently to a malignant tumor [1]. Currently, cancer kills millions of people around the world [2]. Available therapies, such as chemotherapy, radiotherapy, cryotherapy, and surgery often lack selectivity for tumor cells.
Plasma, known as the fourth matter state, is a gas with enough energy to ionize a significant portion of its particles, generating positive ions and electrons. Plasmas share some features with gases; however, plasmas are good electrical conductors and can be affected by magnetic fields. There are, essentially, two models of cold plasma (better referred to as collisional plasma) of interest for medical applications: (1) atmospheric pressure and (2) low-pressure plasma. It is reasonable to assume that the density for these two types of plasma is approximately equal to the atmospheric density, but for atmospheric pressure plasmas, the mean free paths separating electrons and heavy particles are shorter than those from low-pressure plasmas; consequently, the former is essentially governed by collisions among particles [3]. Under such conditions, local thermodynamic equilibrium (LTE) tends to prevail including kinetic equilibrium, meaning that electrons and heavier particles may have similar energy (the temperature of electrons, Te, is similar to the temperature of heavier particles, Th, or the sensible temperature defined as the temperature of non-ion species), and chemical equilibrium when different ions species are presented. Within atmospheric pressure plasmas, there are two different categories, thermal and non-thermal plasmas, whether or not LTE exists. In thermal plasma, LTE exists, and the kinetic energy of heavy particles and electrons are similar, meaning that electron temperatures and sensible temperatures are essentially the same. Therefore, the core gas temperatures in thermal plasmas are above 10,000 K. In non-thermal plasma, the sensible temperature remains at room temperature [3]. The biological effects of the constituents of non-thermal atmospheric plasma, in which thermodynamic equilibrium is achievable in the time scale considered, can therefore be used and studied. The plasma can be produced by an electrical current applied across a dielectric gas. As air temperature gases are excellent insulators, a significant fraction of ionic species has to be generated in order to transform the gas into an electric conductor. By passing an electric current through an ionized gas, a process, known as gaseous discharge takes place, and plasma is produced [4].
Several studies, systematized in Table 1, suggest an interesting use of cold atmospheric plasma (CAP) in cancer therapy, as demonstrated by the in vitro eradication of several cancer cell lines. Some mechanisms of action of this new approach include: (1) UV radiation may produce direct effects on cells through the absorbed UV energy, (2) electric fields may have an effect on cellular permeabilization, microfilaments, and lateral glycoproteins redistribution, increasing permeability to calcium, damaging the structure and the synthesis of DNA and cellular mitosis, and (3) reactive species may alter the intracellular redox state [5].
The selective effects of cold plasma on different cell types suggest that it is possible to find the right conditions with plasma treatment affecting only cancer cells, leaving normal cells essentially unharmed [28]. In order to outspread the therapeutic application of plasma to cancer treatment, previous observations that cancer cells are more vulnerable to plasma-induced effects than normal cells require further verification on various cell lines and for several plasma sources. In this way, CAP might offer a minimally invasive option that allows specific cell removal without interfering with the whole tissue.
Due to the novelty of this field, namely the possibility of using CAP as a treatment approach for cancer, the goal of this study was to evaluate CAP cytotoxicity in different cancer cell lines and phenotypically normal fibroblast cells. This was achieved by evaluating the metabolic activity and viability of several human cancer cell lines when exposed to CAP. Further characterization of chemical and physical properties of plasma was pursued by capturing the plasma optical emission spectrum and quantifying reactive species in plasma exposed media, allowing a direct comparison with other devices reported in the literature pictured in Table 2. Thus, with this work, we clarified that a different response to CAP is better explained by intrinsic cell properties than by device characteristics and settings, as in this screening the same treatment conditions were used among all types of cells. Moreover, we showed that different cell lines display intrinsic CAP sensitivity and resistance.

2. Materials and Methods

2.1. Cell Culture Conditions

The effect of CAP in several adherent human cancer cell lines was studied, namely, melanoma (A375), extrahepatic bile duct carcinoma (TFK-1), osteosarcoma (MNNG-HOS), colon carcinoma (WiDr), prostate cancer (PC3 and LnCap), urinary bladder grade 3 carcinoma (HT-1376), esophageal adenocarcinoma (OE19), hormonal receptor positive breast cancer (MCF7), triple-negative breast cancer (HCC1806), lung cancer (H1299), and endometrial cancer (ECC-1). A cell line of human fibroblasts (HFF-1) was also evaluated. The cell lines were purchased from the American Type Culture Collection or from the European Collection of Authenticated Cell Cultures. All cell lines were cultured under standard cell culture conditions (37 °C, 5% CO2). TKF-1 cells were cultured with Roswell Park Memorial Institute (RPMI-1640, Sigma Aldrich®, St. Louis, MO, USA) medium and supplemented with 15% fetal bovine serum (FBS, Sigma Aldrich®, St. Louis, MO, USA). LnCap, HCC1806, and ECC-1 were cultured with the same medium, however, it was supplemented with 10% FBS, while PC3 was supplemented with 5% FBS. A375, MNNG-HOS, HT-1376, H1299, MCF7, WiDr, OE19, and HFF1 cells were maintained in Dulbecco’s Modified Eagle Medium (DMEM, Sigma Aldrich®, St. Louis, MO, USA). A375, MNNG-HOS, and OE19 were supplemented with 5% FBS. HT-1376, H1299, MCF7, and WiDr cells were cultured with the same medium but were supplemented with 10% FBS. HFF1 was supplemented with 15% FBS. All media contained 1% of penicillin-streptomycin solution (Gibco, Thermo Fisher Scientific, MA, USA). Cells were plated with concentrations between 50,000 and 250,000 cells/mL (Table 3) in 48-multi-well plates (Sarstedt, Newton, NC, USA) with a media volume of 200 µL per well and incubated for 24 h.

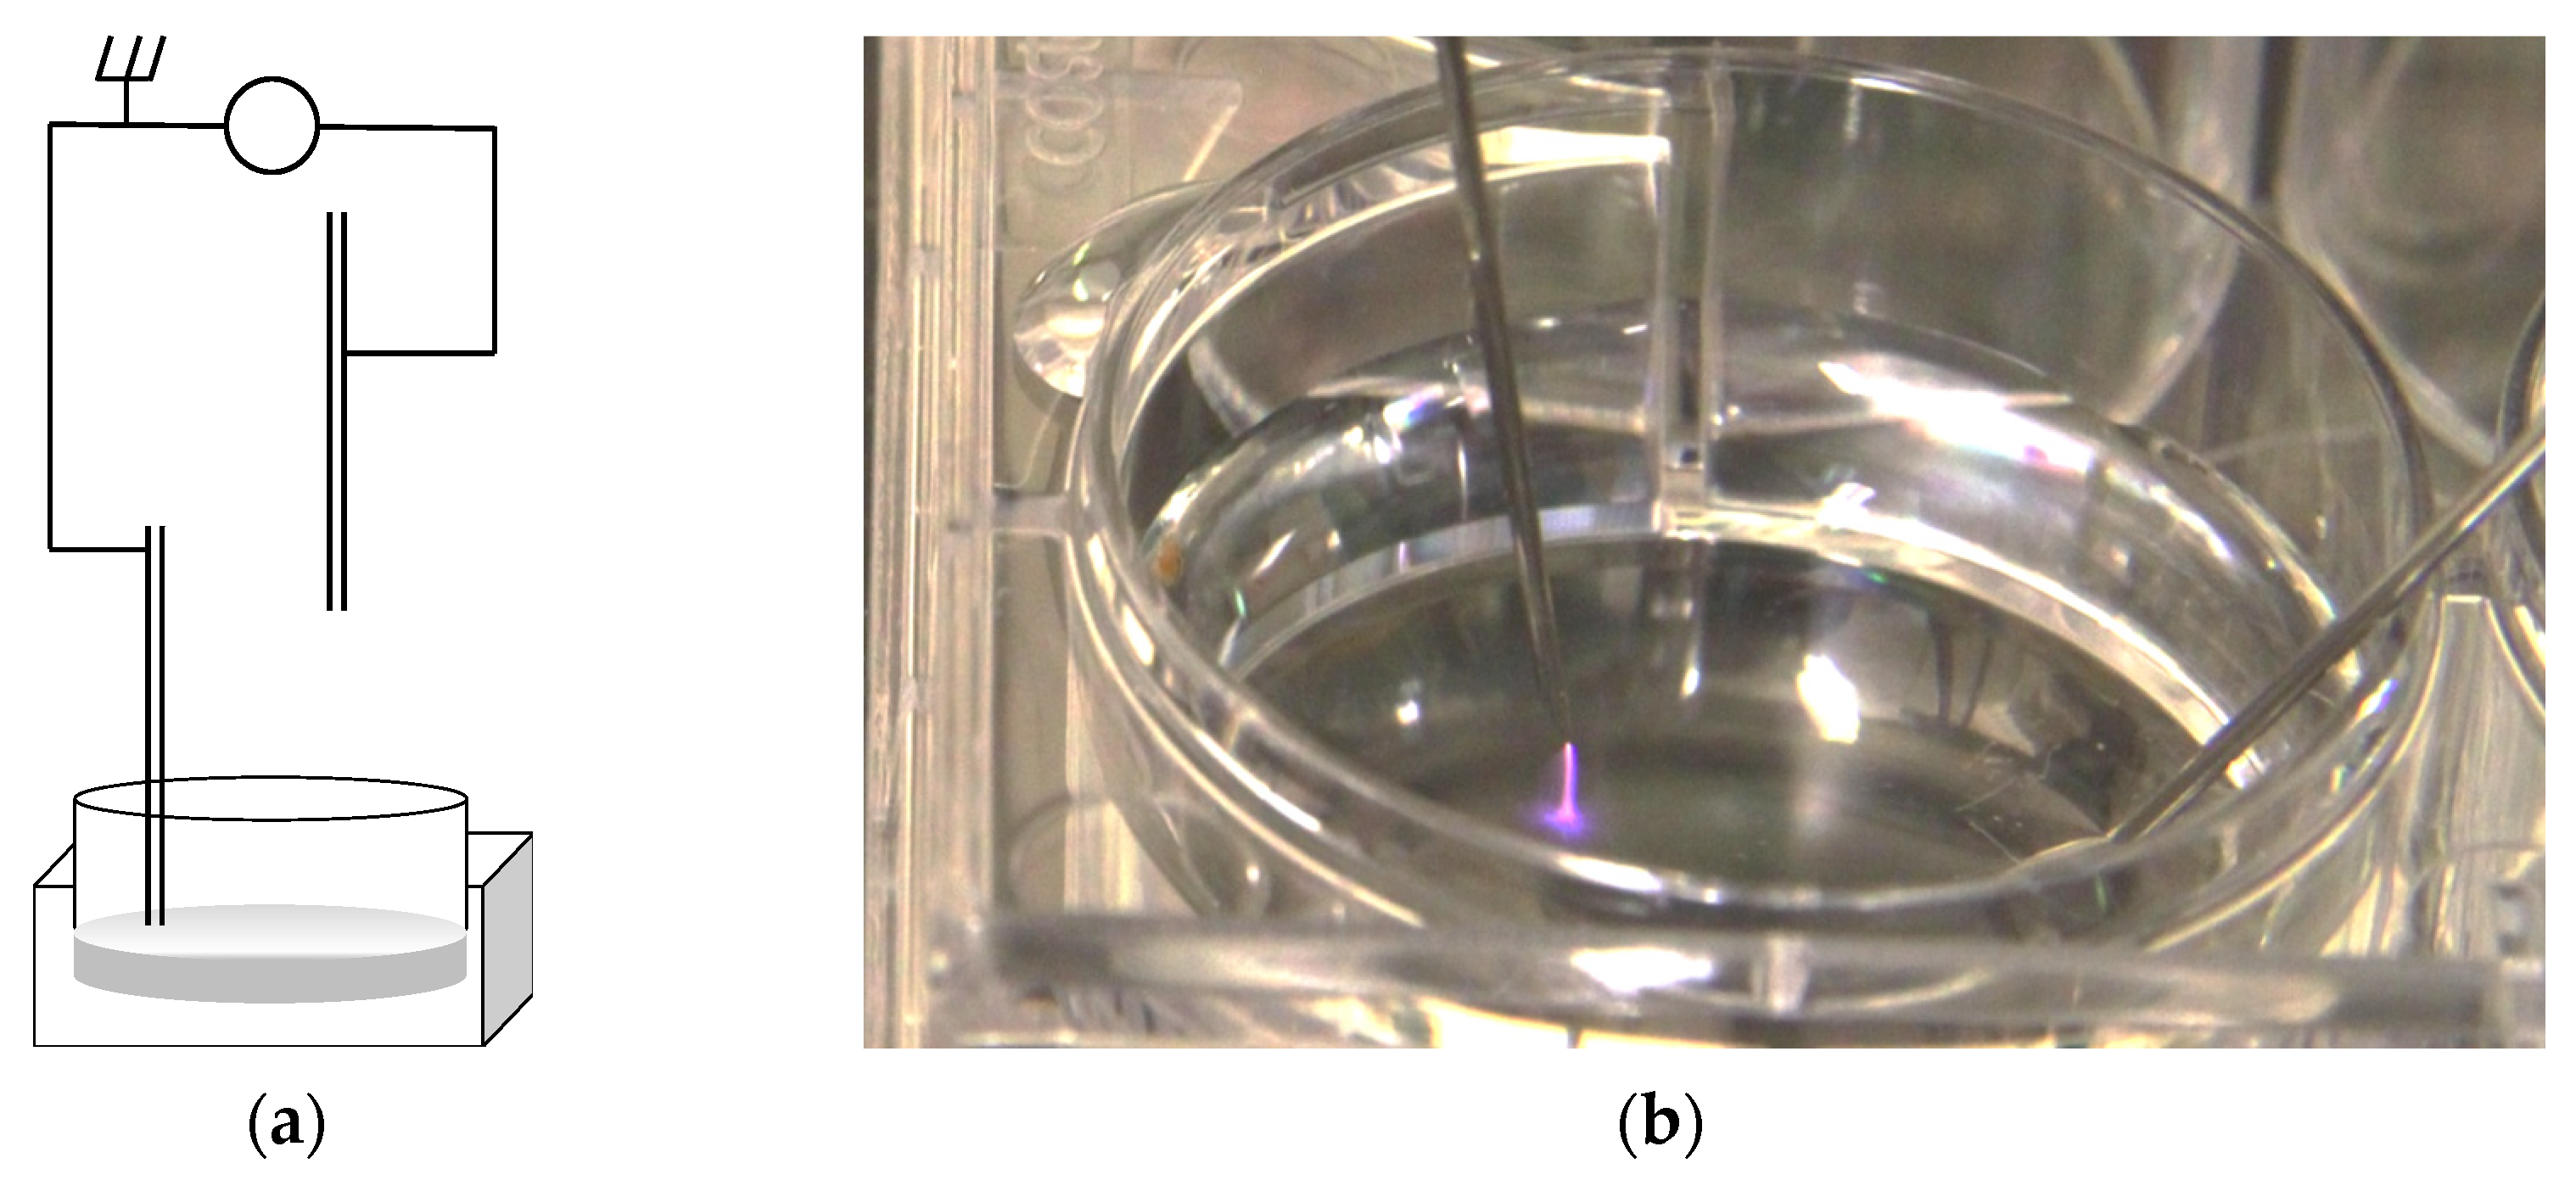
2.2. Cold Atmospheric Plasma Jet

The Institute of Biophysics, Faculty of Medicine, University of Coimbra developed a direct current electronic device capable of generating high output voltage through a sterilized needle with 0.9 mm radius and 40 mm length (Microlance 3, Becton Dickinson, Franklin Lakes, NJ, USA). When charged, the needle works as an open-air single electrode CAP jet. The equipment was designed to produce an electrical discharge between the tip of the needle and multi-well plates where cell cultures were seeded. An electrically grounded needle was submerged in the culture media, as pointed in Figure 1. In this arrangement, the cultures act both as target and grounded electrodes enabling the plasma generation. The high voltage needle was placed 2 mm above the surface of the cell culture’s medium. Voltage and current intensity were measured in a closed circuit with an equivalent resistance of 120 MΩ. The frequency of electrical pulses was determined by a 60 MHz Oscilloscope (2215 Oscilloscope, Tektronix, Beaverton, OR, USA).
An emission spectrum was obtained with an optic fiber spectrometer (USB2000+, Ocean Optics, Orlando, FL, USA) and analyzed with the spectrometer operating software (SpectraSuite, Ocean Optics, Orlando, FL, USA).

2.3. Preparation of Plasma Activated Medium (PAM)

A volume of 200 µL of culture media, RPMI, and DMEM supplemented with FBS 5 and 15%, was plated in 48-multi-well plates and exposed to plasma for 60, 90, and 120 s.

2.4. Quantification of Nitrite Concentration in PAM

Griess reagent was prepared with 5% phosphoric acid containing 0.1% NEDD-N-(1-naphthyl) ethylenediamine and 1% sulfanilamide. An equal volume of the previously prepared solution was added to 50 µL of PAM and following a period of 30 min incubation, absorbance was quantified at 540 nm in a multi-well plate spectrophotometer (Synergy HT, Biotek, Winooski, VT, USA). A nitrite reference curve was plotted using average absorbance values of nitrite concentration of serial two-fold dilutions. The blank solution was identical, except for the nitrite.

2.5. Quantification of Peroxide Concentration in PAM

A solution of 25 mM H2SO4 and 150 mM of both Fe2+ and xylenol orange in the same solvent was prepared according to Gay et al. (Gay, Collins, and Gebicki 1999). A volume of 100 µL of the solution was added to 50 µL of plasma-activated medium, and following a period of 30 min incubation, absorbance was quantified at 560 nm in a multi-well plate spectrophotometer (Synergy HT, Biotek, Winooski, VT, USA). A peroxide reference curve was prepared using two-fold serial dilutions up to 25 mM hydroperoxide. The blank solution was identical, except for the hydroperoxide.

2.6. Plasma Treatment of Cell Cultures

A total of 200 µL of cell cultures were plated in 48-multi-well plates, exposed to CAP for five short time periods: 15, 30, 60, 90, and 120 s and incubated for 24 h.
In order to exclude the possibility of plasma detaching living cells, thereby interfering with the colorimetric assays, which discard the supernatant medium of adherent cell cultures, a viability assay with trypan blue was performed to determine the number of living cells in the supernatant medium. Before the colorimetric assays, 20 µL of supernatant was removed and the number of living cells was determined with 20 µL of Trypan Blue (Sigma Aldrich®, St. Louis, MO, USA) solution.
Results (not shown) suggest a clear preponderance of dead cells with an insignificant number of living cells in the discarded medium 24 h after plasma treatment.

2.7. SRB Assay

The sulforhodamine B (SRB) assay was used to measure the drug-induced cytotoxicity and cell viability. Its principle is based on the ability of the protein dye sulforhodamine B to bind electrostatically and pH dependently to alkaline amino acid residues of trichloroacetic acid-fixed cells.
Firstly, the medium was removed, cells were washed twice with phosphate saline buffer (PBS: 137 mM NaCl (Sigma), 2.7 mM KCl (Sigma), 10 mM Na2HPO4·2H2O (Sigma), 2.0 mM KH2PO4 (Sigma), pH = 7.4) and 200 µL of acetic acid (Panreac, Barcelona, Spain) was added to each well. After 60 min of incubation at 4 °C, the content was discarded and 200 µL of SRB (Sigma Aldrich®, St. Louis, MO, USA) was added. Then, after 90 min in the dark, the cells were washed with water and 200 µL of Tris-NaOH (Sigma Aldrich®, St. Louis, MO, USA) was added. Finally, a sample of 200 µL of each well was transferred to 96-multi-well plates (Sarstedt, Newton, NC, USA), and the results of absorbance were read in the UV/Vis spectrophotometer (Ocean Optics, Dunedin, FL, USA) at wavelengths of 540 and 690 nm.

2.8. MTT Assay

Metabolic activity was determined with a 3-(4,5-dimethylthia-zolyl-2)2,5-di-phenylte-trazolium bromide (MTT) assay. The MTT, a yellow tetrazolium reagent, is reduced to purple formazan crystals in the presence of dehydrogenase enzymes located in the mitochondria of viable, metabolically active cells.
The medium was removed before the addition of the reagent and the cells were washed with PBS. A volume of 200 µL of MTT (Sigma Aldrich®, St. Louis, MO, USA) reagent at a concentration of 0.5 mg/mL and pH 7.4, was added to each well and the plates were incubated for at least 4 h in the dark at 37 °C. Then, 200 µL of isopropyl alcohol (Sigma Aldrich®, St. Louis, MO, USA) was added to each well and plates were gently stirred. Absorbance was read in the UV/Vis spectrophotometer (Enspire, Perkin-Elmer, Waltham, MA, USA) at wavelengths of 570 and 620 nm.

2.9. Statistical Analysis

All results are expressed as a mean ± standard error (Mean ± SEM) of a minimum of three independent experiments performed in triplicate. Statistical analysis was performed using software SPSS® v.21 (IBM, NY, USA). To evaluate if quantitative variables follow a normal distribution the Shapiro–Wilk test was used. When the distribution was normal, parametric tests were used, otherwise, nonparametric tests were applied. Two sample comparisons were assessed either by the Student’s t-test or by resorting to the Mann–Whitney test according to the need of using parametric or non-parametric tests. Comparison of the quantitative variables between more than two groups was obtained using Kruskal–Wallis (non-parametric test) or using the ANOVA test (parametric test). Multiple comparisons corrections were performed considering the Bonferroni procedure. Metabolic activity and protein content were normalized to non-treated same-cell line controls. This procedure allowed for the creation of dose–response curves and calculation of the treatment duration that inhibits metabolic activity and protein rate by 50%, analogous to IC50 (half maximal inhibitory concentration) for each cell line. Results were analyzed and processed using the software Origin Pro 8.0 (OriginLab, Northampton, MA, USA) and adjusted to a sigmoidal curve. Confidence intervals of 95% were obtained for each cell line.

3. Results

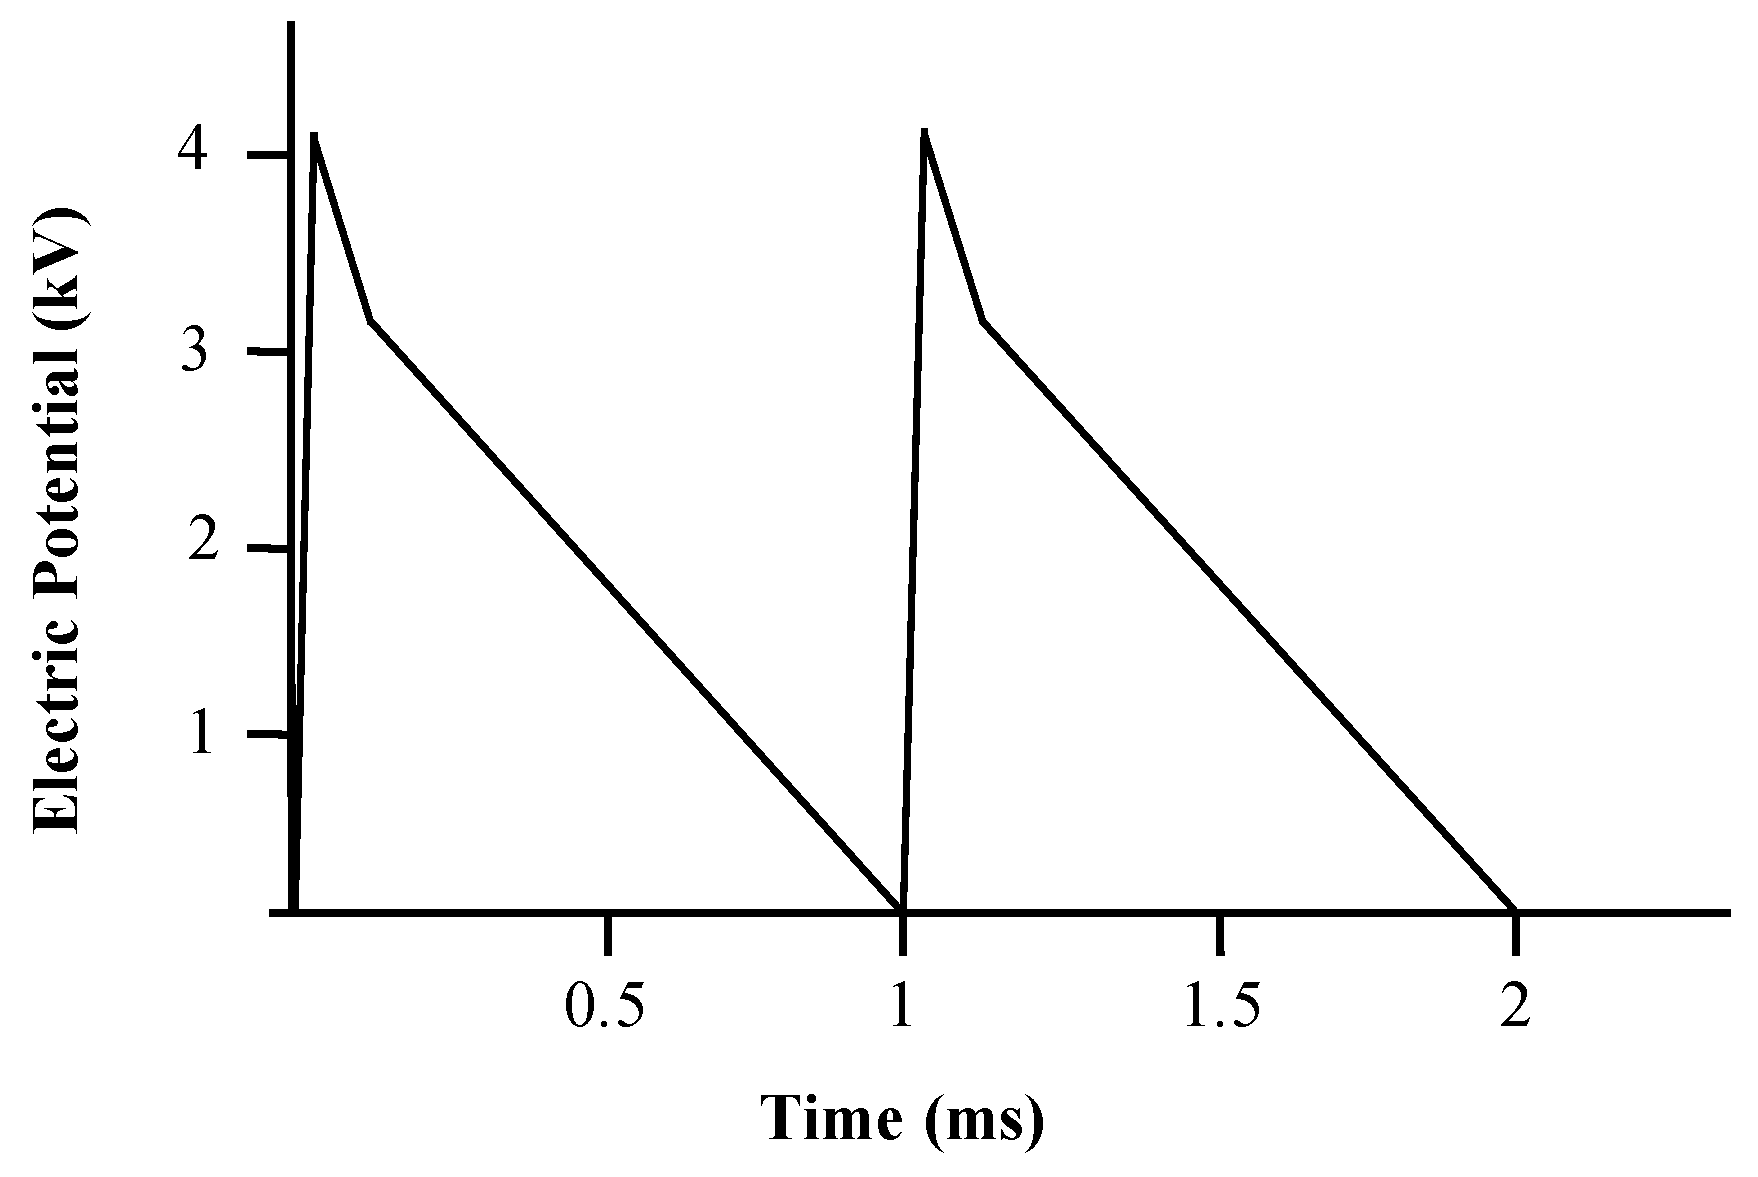
3.1. CAP Single Electrode Jet Generates High Voltage Electrical Pulses

The electric current intensity recorded in the needle in a closed circuit with an equivalent resistance of 120.1 MΩ was 33 ± 1 μA, the calculated voltage was approximately 4000 ± 121 V and the frequency of pulses was 1000 ± 10 Hz, each pulse with 1.0 ± 0.1 ms of duration. The pulse waveform is depicted in Figure 2.

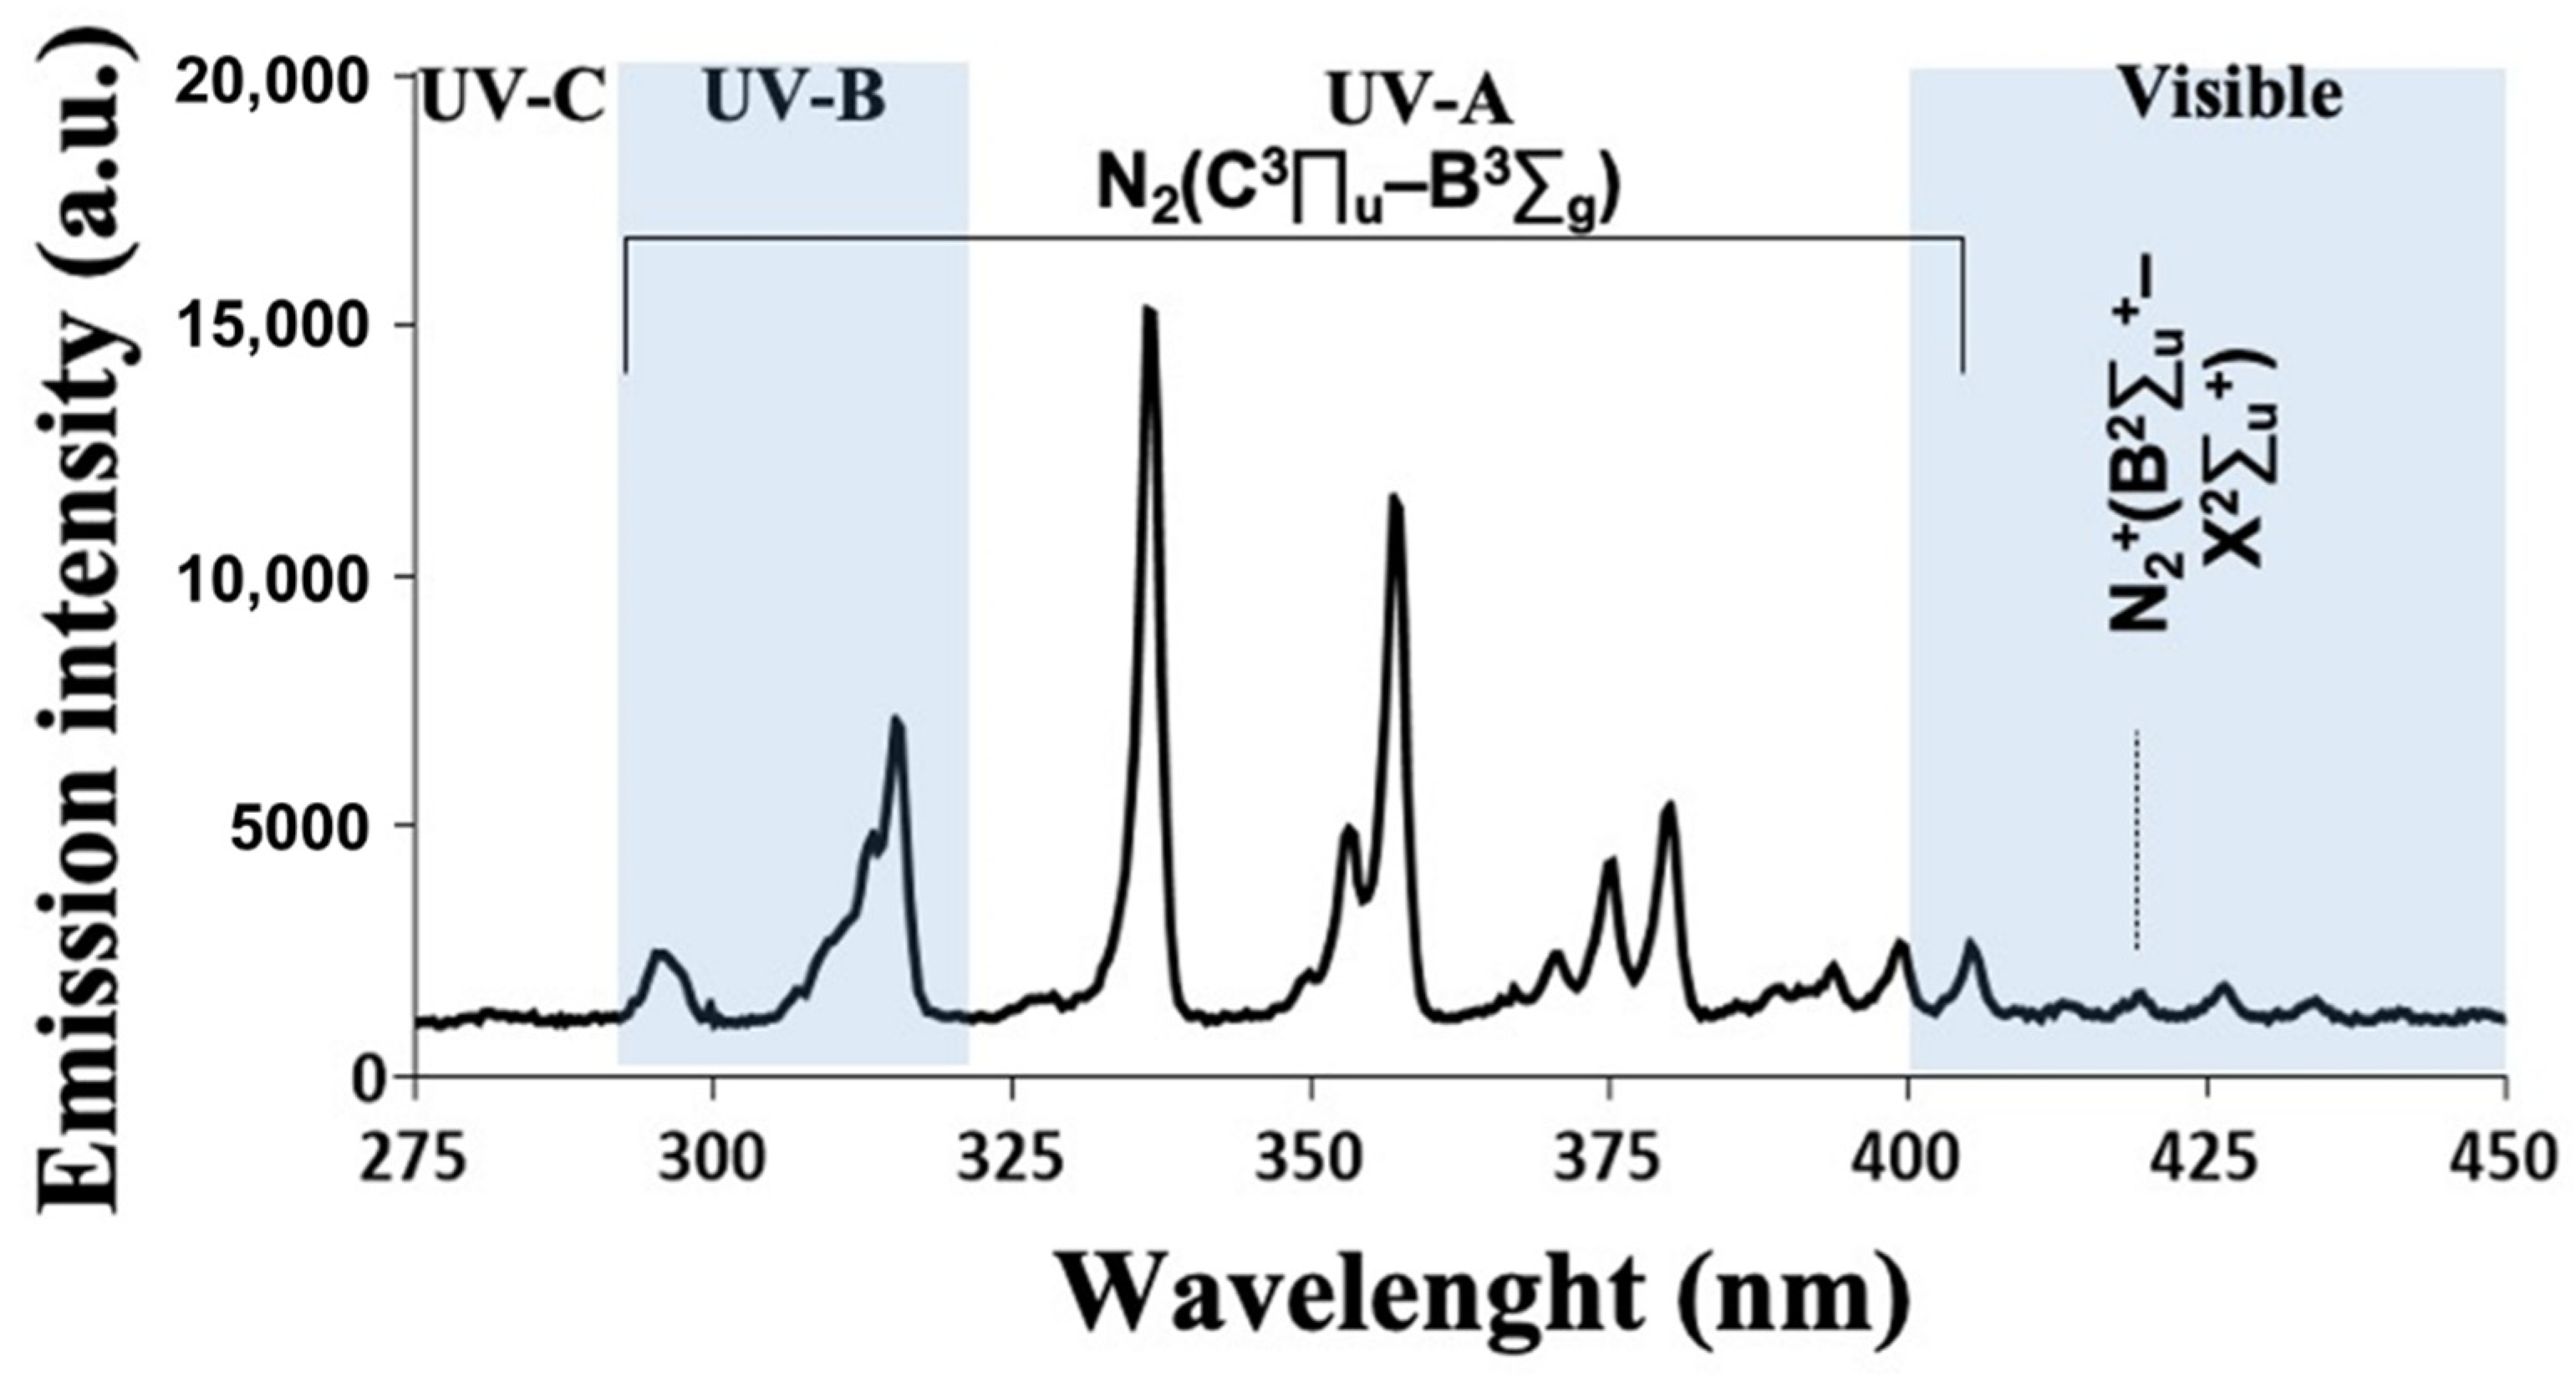
3.2. CAP Emission Spectrum Depicted Several Peaks in the UV Domain and Reactive Species

As seen in Figure 3, the plasma emission spectrum is dominated by the emission lines corresponding to nitrogen second positive electronic transition N2(C3Πu–B3Σg) and its family of vibrational and rotational level sub-transitions, in the range of 300 to 450 nm. The strongest line is the (0–0) transition in the N2 second positive system at 337 nm. No OH line that exceeded the height of the tail of the N2 second positive transition was visible at 308 nm. Some significant N2+ first negative system, N2+(B2Σu+–X2Σu+), transitions, particularly in wavelengths corresponding to 419.7 nm, were also visible in the violet range of the visible spectrum. In the significant range of 250 to 300 nm, there were very weak emission lines, interpreted as NO. Atomic oxygen (emission lines at 777 nm) is believed to have significant biological effects and was not present in our generated CAP.

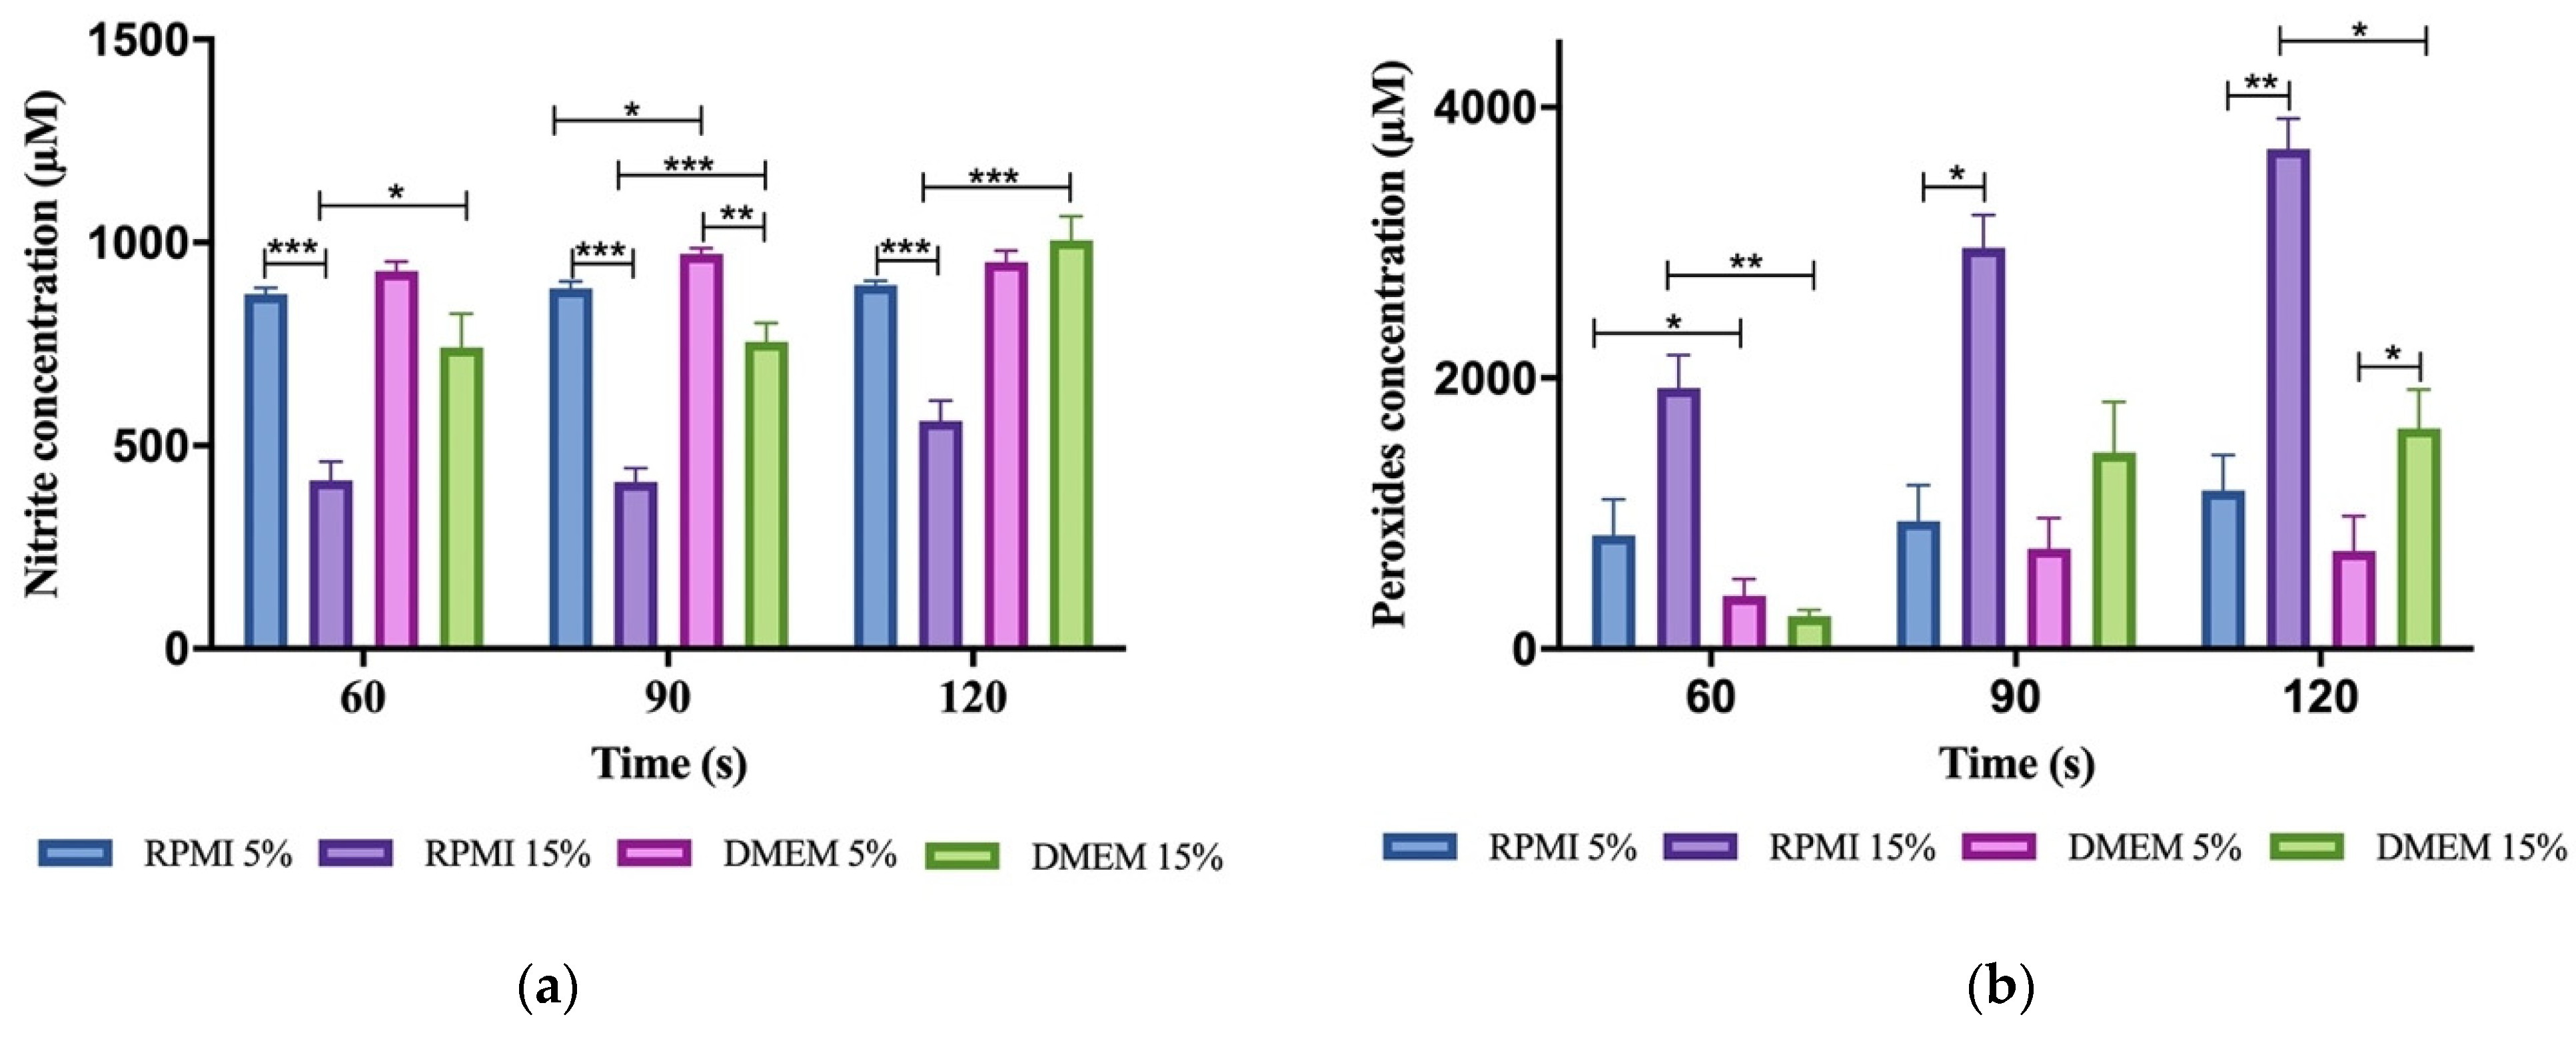
3.3. Reactive Oxygen and Nitrogen Species (RONS) Accumulate in Plasma-Activated Medium

Several RONS have been identified in liquid media treated with plasma. Since the half-lives of most RONS are in the range of seconds, microseconds, or even nanoseconds, we quantified only the long-lived species from CAP, NO2, and H2O2 which represent the final byproducts of redox reactions and are thought to be the major players in killing cancer cells [54].
According to our data, which can be seen in Figure 4, there is a time-dependent increase in the concentration of peroxides while the concentration of nitrites remains similarly high during the tested exposition times. Our results show that the composition of media being irradiated influences the stability and reactivity of reactive species.
Two variables were analyzed, type of media and its supplementation with FBS, since our cell cultures required different growth conditions. The type of culture medium showed no influence in reactive species stability as the concentration of nitrites and peroxides seemed no different in RPMI and DMEM minimally supplemented. However, when supplementation with FBS increases, reactive species behave differently in RPMI medium. As shown in Figure 3, 15% FBS supplemented RPMI displayed the highest concentration of peroxides and the lowest concentration of nitrites in any given exposure time.

3.4. Plasma-Activated Medium Did Not Alter Its pH Nor Its Temperature

Irradiation of the media did not produce a statistically different alteration in media pH (pH = 7.45 ± 0.02 at 20 °C) nor its temperature which remained below 30 °C.

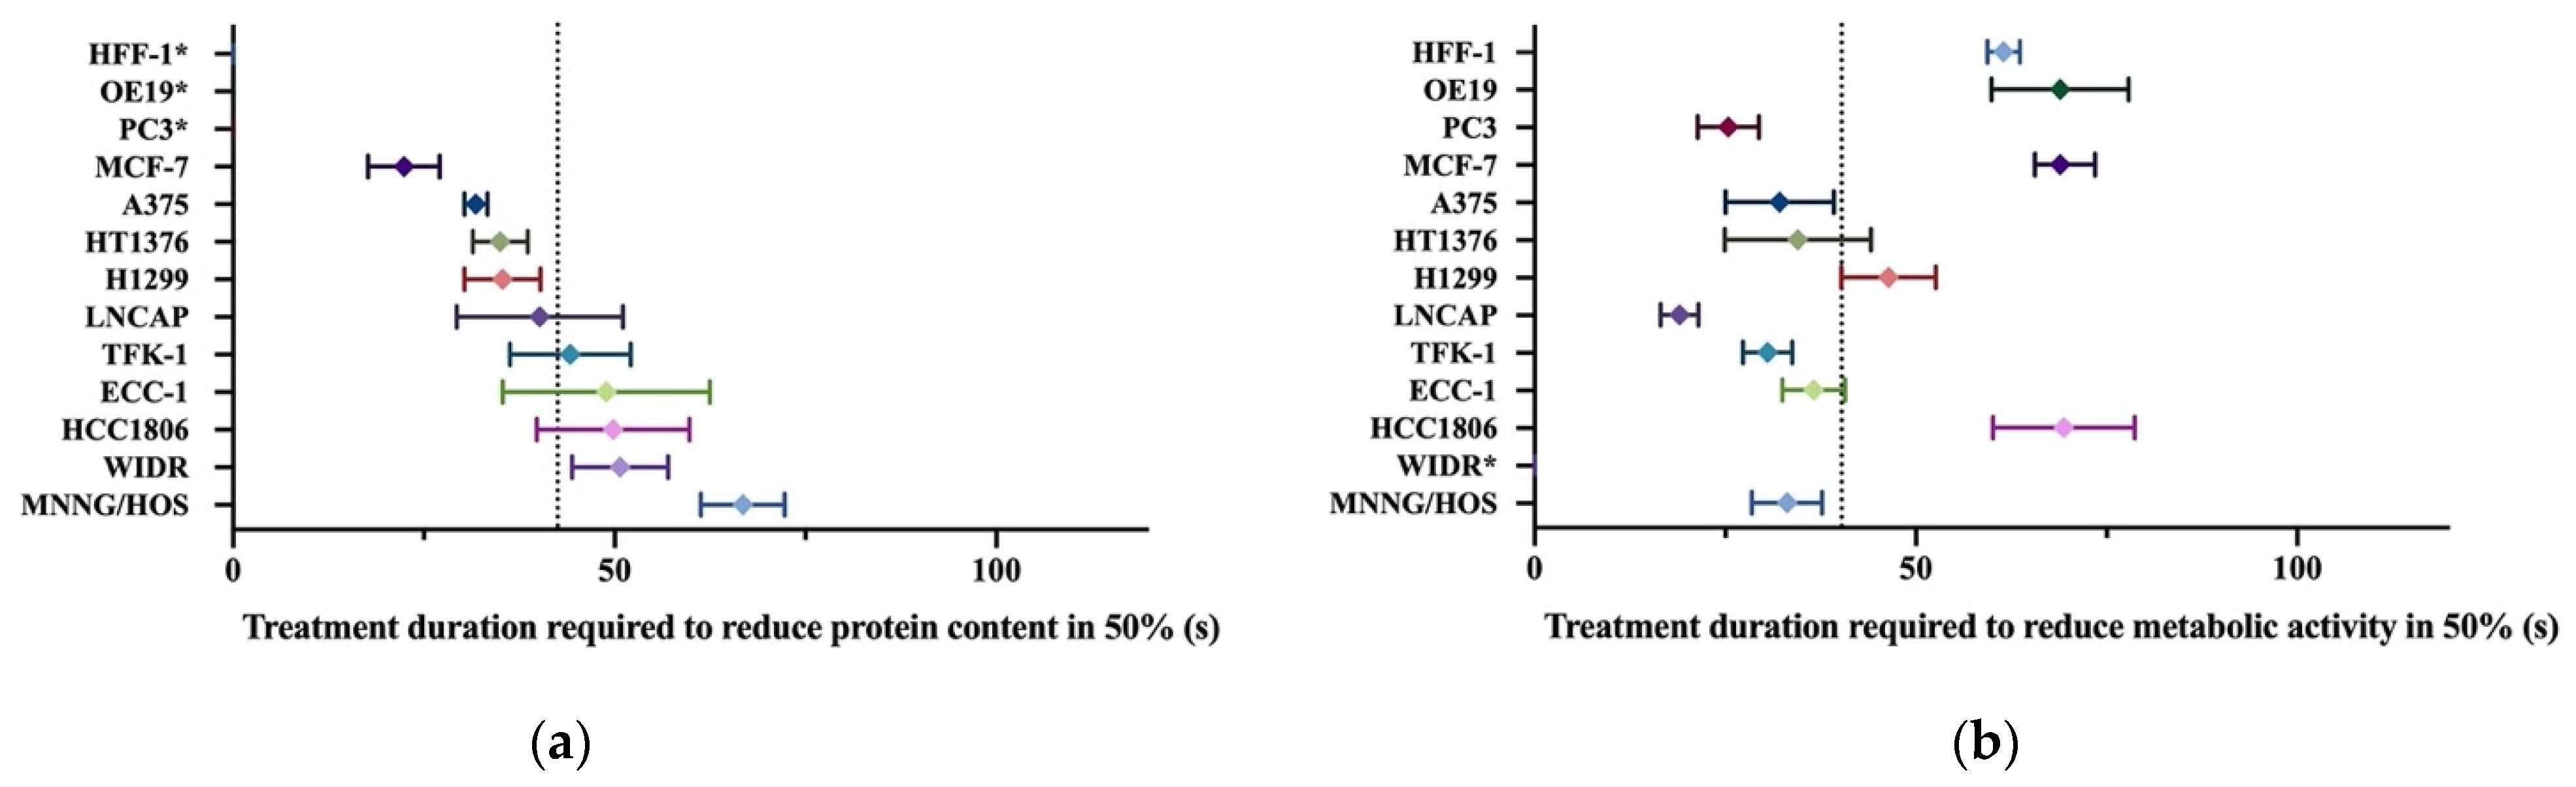
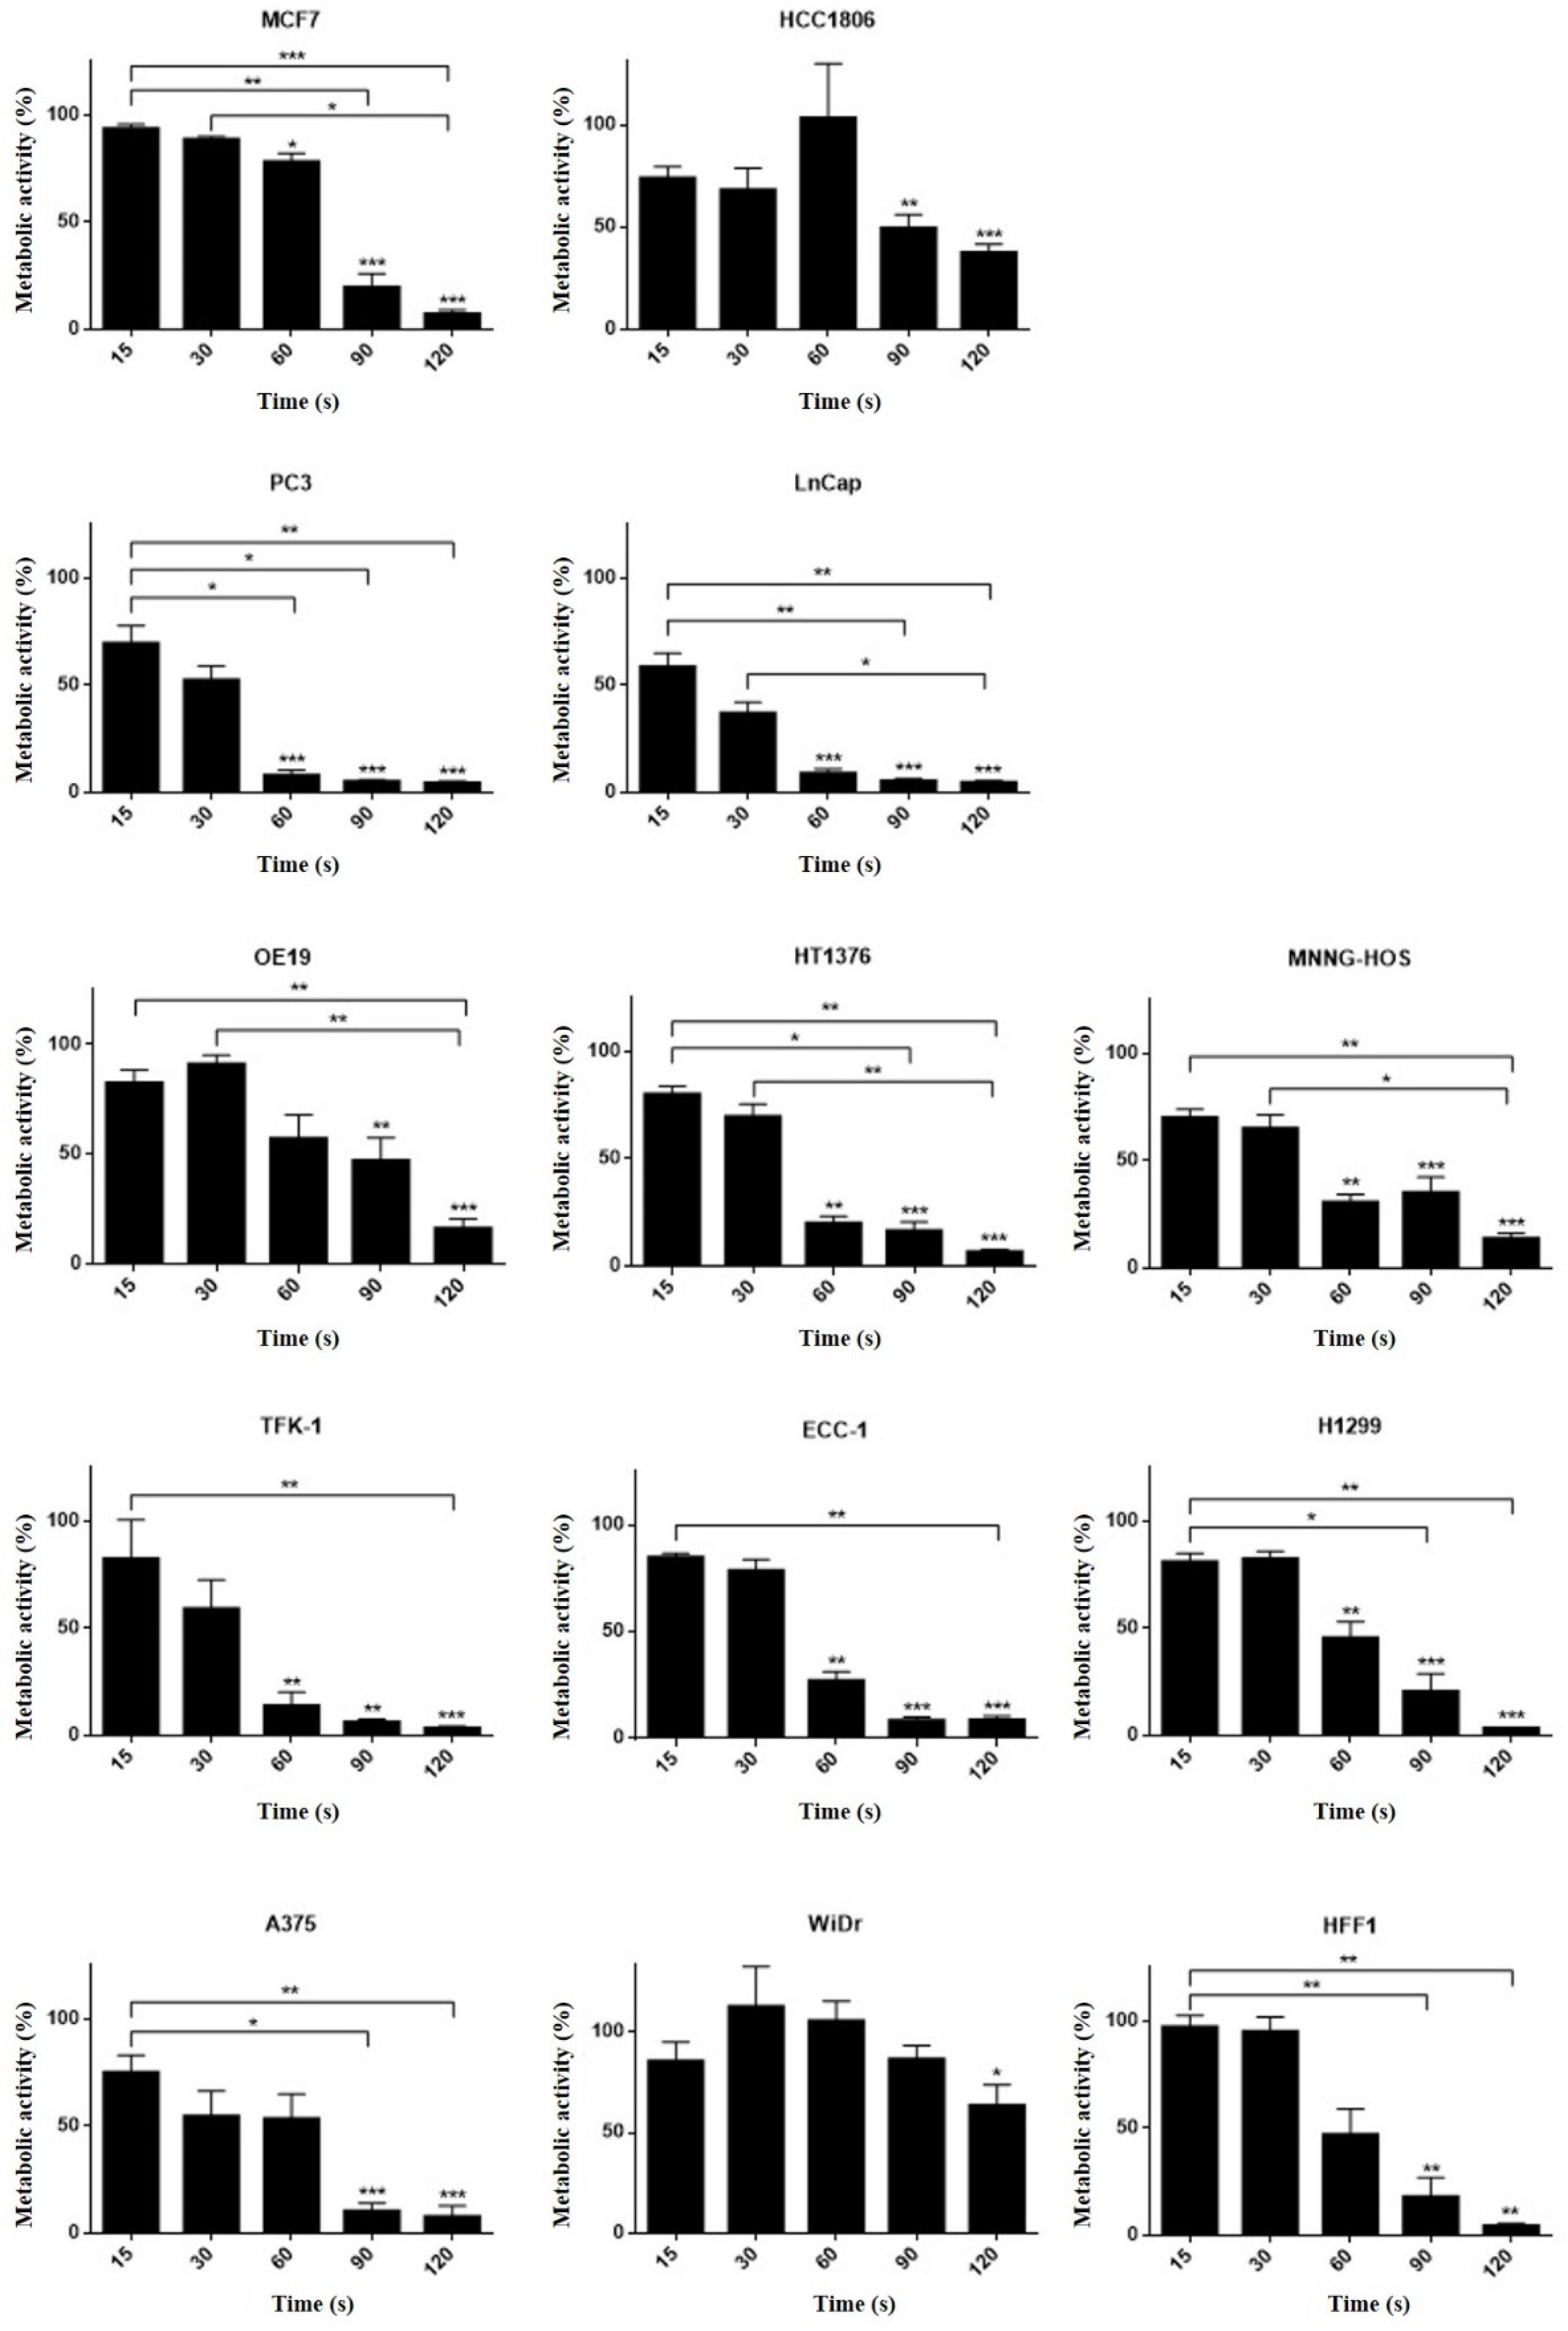
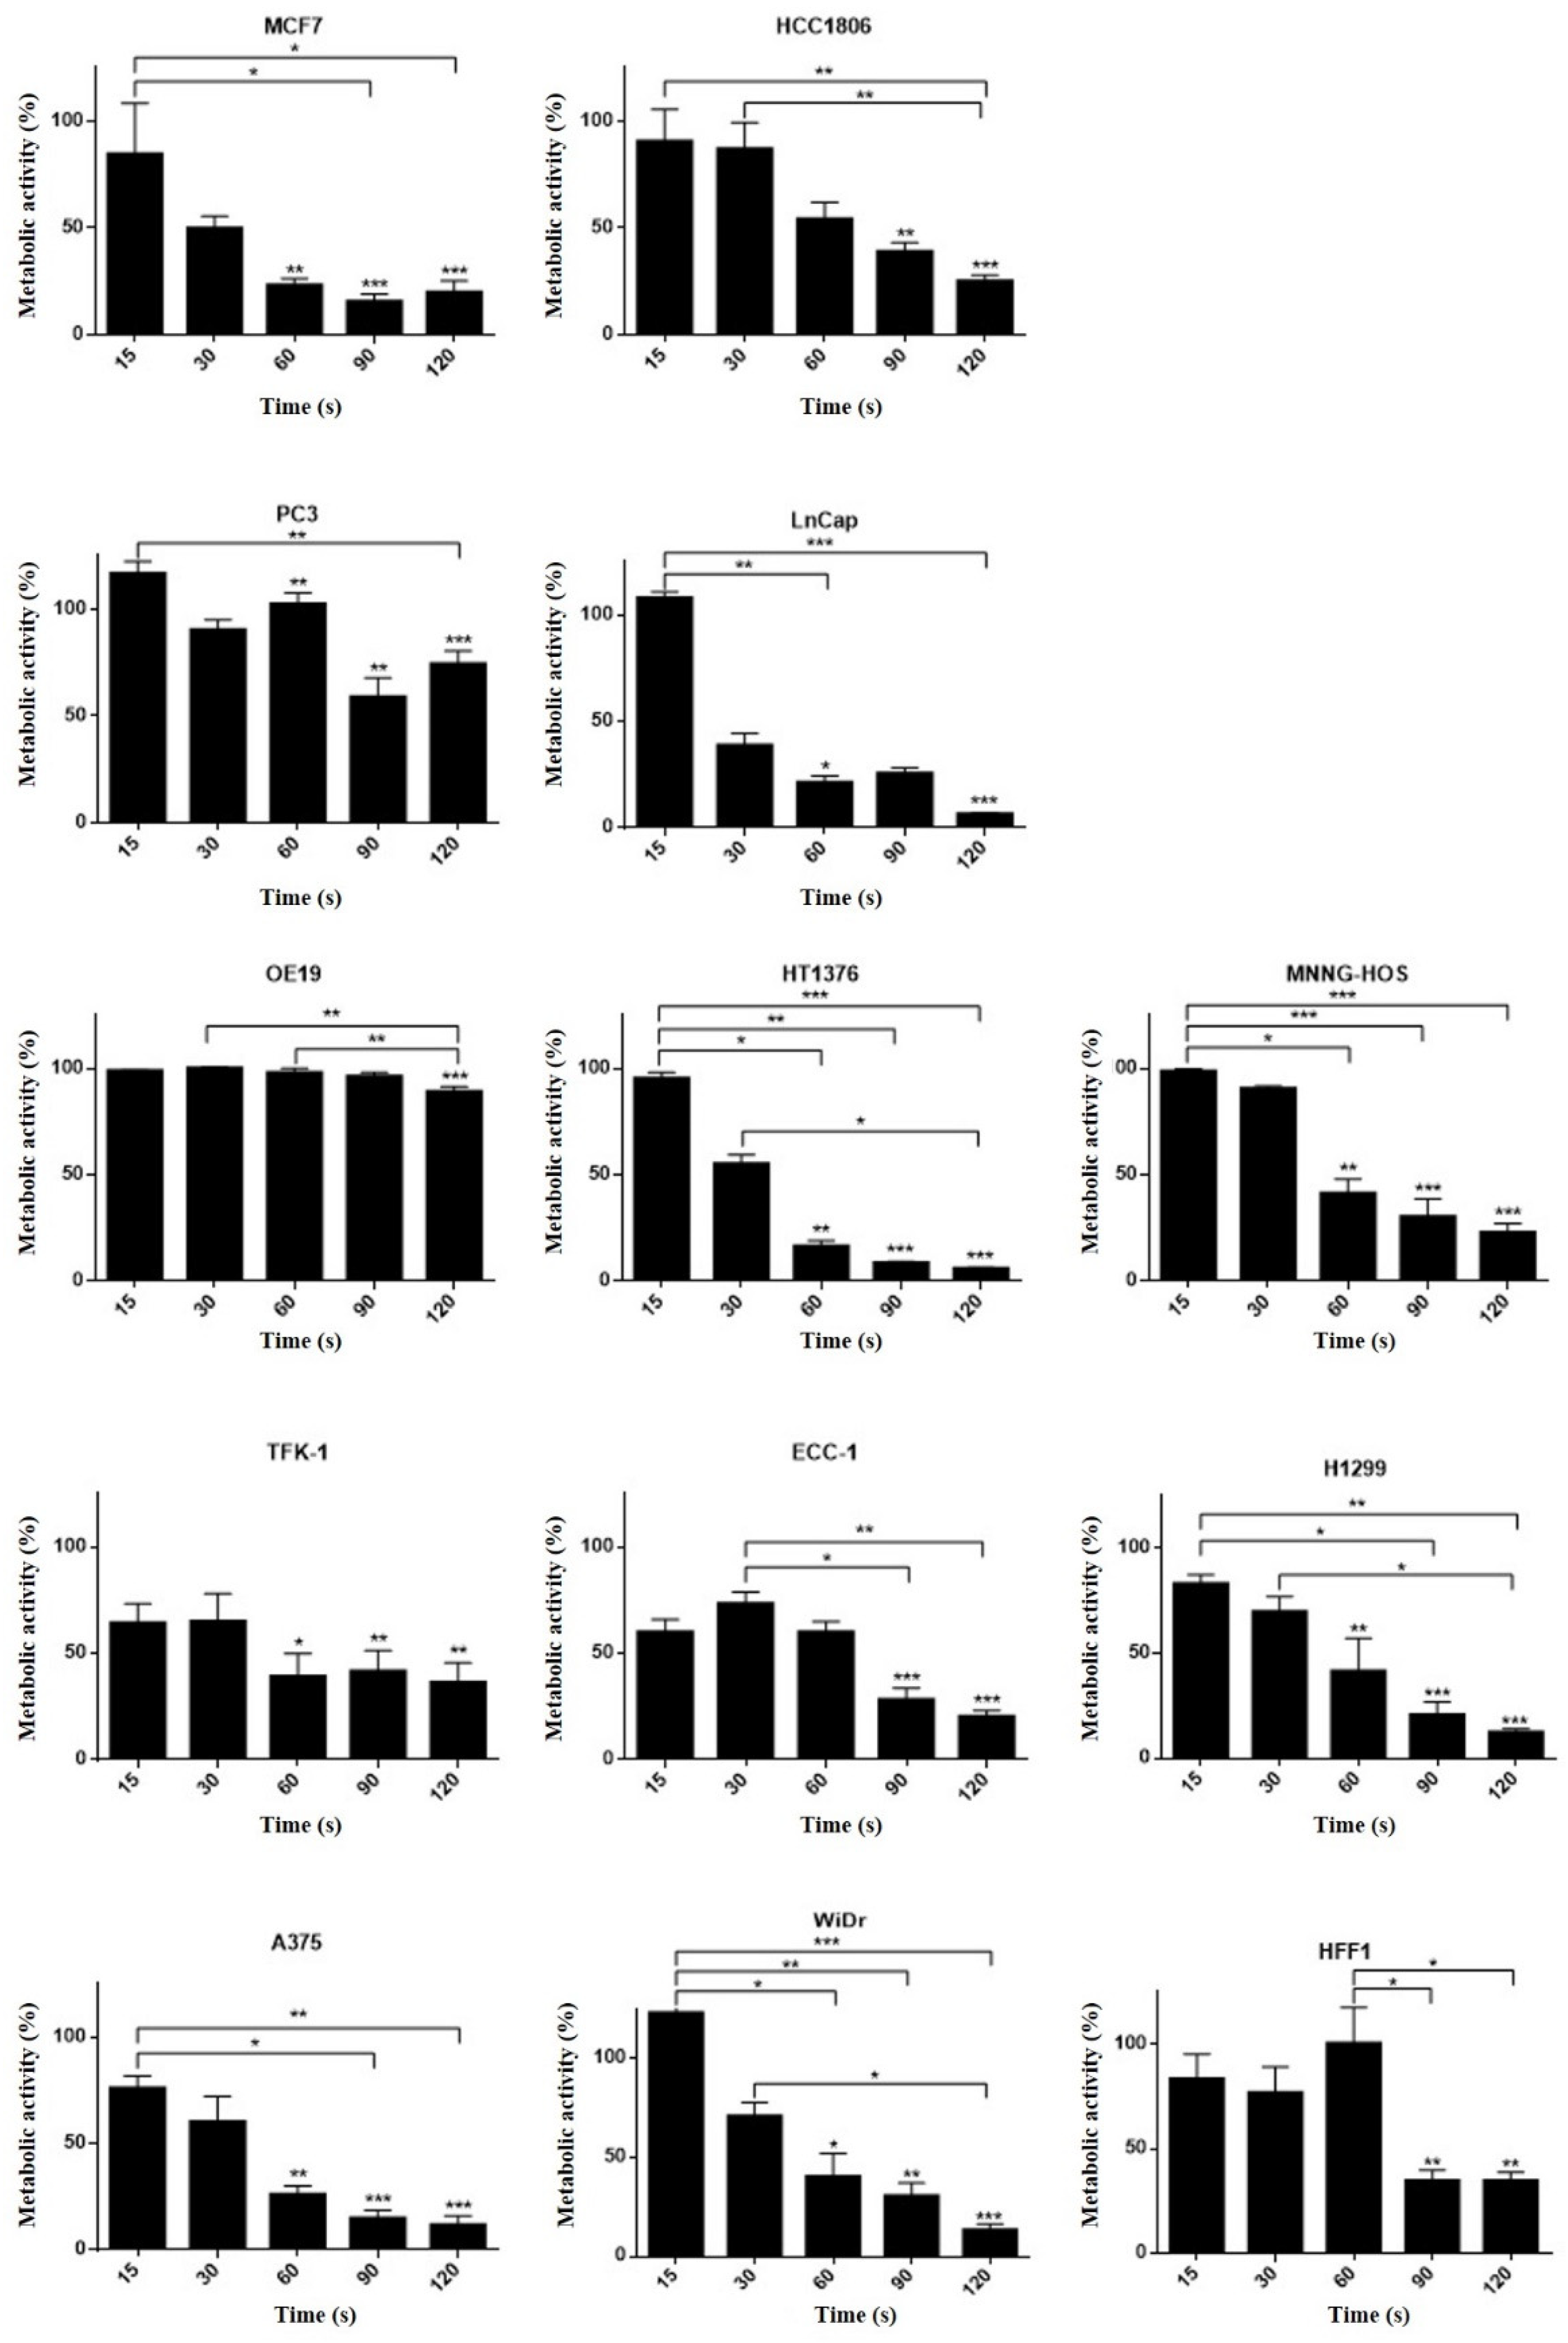
3.5. Different Cell Lines Displayed Different Responses to Cold Plasma

Treatment duration in the range of seconds produces significant inhibitory effects in the majority of cancer cell lines.
The MTT assay shows a decrease in metabolic activity in several cell lines, particularly after 120 s CAP exposure, with OE19 being an obvious exception (see Appendix A Figure A1). In the SRB assay (see Appendix A Figure A2), after 60 s of CAP exposure, cells show a statistically significant decrease in viability, and maximal effects were seen using plasma exposures of 120 s.
Most plasma-treated cell lines displayed a parallel decrease in metabolic activity and viability in a time-dependent manner, as evaluated by MTT and SRB assays. Treatment durations required to reduce metabolic activity and viability by 50% (IT50) were calculated for each of the cell lines. Calculated IT50s in responsive cancer cells were lower than 1 min, as seen in Table 3.
In order to allow a better comparison between different cell lines, Figure 5 confronts calculated IT50 with a confidence interval of 95% for all cell lines. This also allowed for the classification of the cell lines into susceptible, stressed, stunned, and resistant to CAP. Most cell lines studied are sensitive to CAP; this is the case of A375, HT1376, TFK-1, LnCap, ECC-1, and H1299. OE19, WiDR, HCC1806, and HFF-1 are among the cells resistant to plasma treatment while PC3 and MNNG/HOS become stunned and MCF7 become stressed.

4. Discussion

Anti-cancer properties of CAP have been recently recognized and are far from being completely understood [55,56]. In order to enable precise targeting of tumor cells, we developed an air plasma jet based on a high-voltage sharply-pointed electrode. Plasma is produced according to a point-to-plane pulsed corona discharge model. As the plasma produced by the jet does not significantly increase the local sensible temperature, cooling techniques, which could have serious drawbacks are not needed. Despite the need for thorough quantification, we foresee that such cooling techniques would difficult the plasma application, for example, in endoscopic procedures of non-complacent body cavities.
Since plasmas consist of moving electrons and ions, an electric current is created, and they may pass through the skin. The electric characteristics of our device respect the ICNIRP electric current limit for medical applications, defined as 0.5 mA at 1 kHz, and 20 mA at 100 kHz [57]. Then, from this perspective non-intentional contact of plasma created by our device with living tissues, it is not expected to cause any harm.
Here, we highlight that a comparison of various experiments carried out with different CAP devices is difficult due to different CAP parameters and designs, as shown in Table 2. Moreover, even assays carried out with the same plasma device rendered divergent results when different cell lines were targeted [21]. In order to allow comparisons between results obtained by different devices, we performed a physical and chemical evaluation of the plasma generated by our equipment.
The optical emission spectroscopy (OES) recorded ultraviolet (UV) photons and reactive species emission lines, which are known to induce cellular lesions. UV effects show a strong dependence on dose and wavelength. In fact, the UV absorption spectrum for DNA comprises a rising band in the far UV (<220 nm) with a further peak at 260 nm, which tails into the near-UVB wavelengths at around 300 nm. Between 290 and 315 nm, direct excitation of DNA prevails [58]. However, UV spectral peak wavelengths recorded in our experiment are above the threshold of 300 nm, thus limiting photons’ role in plasma cytotoxicity and overemphasizing the role of chemically reactive species.
Considering that plasma was generated above a liquid phase where cells were seeded, there are plasma-relevant reactive species that can, by themselves, interact with cancer cells. In fact, most studies of non-thermal plasmas in medicine are based on indirect treatments, with plasmas being produced between two electrodes in a gap discharge or open-air, and ejected into the direction of the sample by convection established by an inert gas flow. This approach has two main implications: (1) there is a gaseous interface between plasma and liquid, which may alter the reactive potential of the generated chemical species, and (2) as reactive species (RS) have to pass through the afterglow area of the plasma jet to reach the surface of the liquid medium, some primary species disappear while other secondary species are generated. In our setup, the device directly delivers plasma to the liquid phase that acts as the grounded electrode. Thus, primary RS are expected to be of greater importance. Table 2 compares the concentrations of nitrites and peroxides found on media exposed to different devices. Thus, it becomes clear that direct plasma treatment provides the highest reactivity since all listed devices previously reported in the literature are based on indirect plasma treatment.
Despite only the more frequent excited states of molecular nitrogen having been detected in plasma OES, other species such as NO, oxygen, and dissociation products of air such as atomic nitrogen and hydrogen are expected to be present [59]. There is also the production of ozone usually observed in corona discharges in air [60]. There are certainly other active species but they are not observable in the OES mainly due to quenching processes, emission outside the selected wavelength range [61], or simply because they are not being excited [62]. Thus, it is suggested that active chemical species produced inside plasma are directly delivered into the liquid phase, by solubilization and diffusion, where they reach cells, or react to produce secondary RS [56]. These can be scavenged by cancer cells and trigger biochemical reactions inside them. Since an oxidant environment can trigger cell death, it is possible that the intracellular RS, directly or indirectly induced by plasma, can be seen as responsible for the cytotoxicity of plasma. This seems to be the most common explanation for the cytotoxicity of CAP-based anticancer therapy [13,22,54,63,64,65,66,67].
According to our data, there is an increase in a time-dependent manner of the concentration of peroxides while the concentration of nitrites remains similarly high during the tested exposition times. However, nitrites are difficult to quantify since the typical half-time of 1 to 5 min renders it less reliable in time-consuming colorimetric assays. Even when these limitations are considered, when we confront the peroxides and nitrites concentrations (Figure 4a,b) with each cell line biological response (Appendix A Figure A1 and Figure A2), we may hypothesize hydrogen peroxide having a greater importance than nitrite. Since the cytotoxicity of plasma increases with longer exposures, it seems plausible that mediators responsible for plasma effects should also increase with longer treatment durations. Therefore, hydrogen peroxide may be the major player in plasma cytotoxic effects, since its concentration increases with longer plasma exposures while nitrite concentrations do not correlate with the plasma’s effect.
In Figure 4, we can see that there is a tendency for nitrites to decrease and peroxides to increase with FBS supplementation and that this effect is higher in RPMI than in DMEM.
The half time of hydrogen peroxide is dependent upon the presence of trace transition metals on the media. Ferrous non-chelated iron is known to react and consume peroxides through the Fenton and Haber–Weiss reaction [68] and its presence in DMEM but not in RPMI can explain why peroxide concentration is lower in the former.
Different results are seen regarding the effect of FBS on peroxides and nitrite concentration in the literature since FBS is highly variable in composition according to the producer and batch [69,70]. In our work, the concentration of peroxides increased with FBS supplementation from 5 to 15%, and the opposite was seen with nitrites.
Some studies show that FBS can scavenge nitrites [51] or peroxides [43,71], depending on the experiment. Our results do not support this hypothesis. However, while FBS can scavenge RS, it does not protect cells from death, since exposure to plasma/plasma reactive species induces changes in the composition of the serum (such as lipid peroxidation, oxidation of proteins, amino acids) which are themselves cytotoxic [71].
When we compare the effect of plasma in different cell lines, there are two considerations to make: (1) the cytotoxicity of plasma-activated medium and (2) the intrinsic susceptibility of cell lines.
As previously shown, RPMI and supplementation with FBS increase peroxide concentration. However, this does not mean that other used media are less cytotoxic since hydrogen peroxide could have been converted into hydroxyl radicals or resulted in the peroxidation of organic molecules. Moreover, reactive species other than hydrogen peroxide and nitrites are generated at the plasma–liquid interface. When we compare different cell lines with the same culture medium requirement, striking differences in metabolic impairment emerge as shown in Table 3. This observation implies that the intrinsic properties of tumor cells are the main factor determining the response to plasma treatment.
Since different cell lines have different growth rates based on different cell culture medium requirements, optimal cell concentrations, and characteristic doubling times, the metabolic activity and protein content of each cell line were always normalized to the non-treated control of the same cell line, thereby eliminating possibly confounding factors related with experimental design. This procedure helped us to establish dose–response curves and calculate the time required to inhibit the metabolic rate and protein content by 50% (IT50), analogous to IC50 (half maximal inhibitory concentration).
In order to allow a better comparison between different cell lines, we plotted the calculated IT50 and associated 95% confidence interval of each cell line on a graph and the calculated average IT50 as shown in Figure 5. With this reference line, we assigned lower than average IT50 to a positive response and higher than average IT50 to a negative response.
We attempted to categorize response to plasma treatment according to metabolic rate and proliferation rate. By doing so, we classify three different types of answer: (1) resistant, (2) susceptible, (3) stressed, and (4) stunned.
When first studying the effect of plasma in metabolic activity by MTT assay, HFF1, WIDR, OE19, HCC1806, and MCF7 cells showed the highest IT50, meaning that these cells were not entirely susceptible to the plasma’s effect. Indeed, HFF1, WIDR, OE19, and HCC1806 cells remained viable until longer treatment durations compared to the other cell lines as seen in SRB assays. These cells were considered resistant to plasma. However, that was not the case for MCF7 cells. The viability of these cells promptly decreased with brief treatments, and was, paradoxically, the cell line with the lowest treatment duration required to decrease protein content by 50% as seen by SRB assay. These cells were considered to be stressed.
Another group of cell lines, PC3 and MNNG/HOS, reported a decrease in metabolic activity but not in protein content and were considered stunned.
Finally, susceptible cells showed the lowest IT50 for metabolic activity with concordant lowest IT50 for proliferation rate.
In order to understand this classification, two concepts were introduced. Firstly, the amount of SRB concentration is directly proportional to the number of living cells [72] and, therefore, can be extrapolated to measure cell proliferations [73], since it is not likely that SRB will overestimate cell number due to cell debris [74]. Secondly, the MTT assay is based on the capacity of metabolically active cells to catalyze the reduction of tetrazolium salt. This reaction occurs mainly in mitochondria and depends on membrane permeability, mitochondrial mass, and activity [75]. Therefore, the SRB assay measures proliferation, and MTT measures metabolism.
Alterations in proliferation and metabolism are usually concordant. Proliferating cells tend to have higher metabolic rates, parallel to biosynthesis, when matched to those of non-dividing cells. Similarly, a reduction in proliferative rate is typically accompanied by a reduction in metabolic rate, as seen in susceptible cells. The reduction in proliferative rate can be caused by cell death or cycle arrest. Many authors report that low doses of plasma preferably induce cell cycle arrest, and higher doses of plasma lead to apoptosis and necrosis in cancer cells [76].
Curiously, while plasma successfully reduces proliferation in MCF7 lines, it is not capable of producing the equivalent reduction in metabolic activity. In fact, cell mass decreases while metabolic rate remains high, suggesting an increase in metabolic rate per cell as seen in Appendix A Figure A1 and Figure A2 when we compare the plots of metabolic activity and protein content for MCF7. These cells display an intermediate response to plasma between resistant and susceptible cells, which we categorize as stressed cells. We hypothesize that this enhanced MTT index represents an adaptation to stress by the selection of a subpopulation of highly metabolic cells or, alternatively, activation of survival processes with hyperactive mitochondria or increased mitochondrial mass.
Studies suggest that some established tumor cell lines, such as MCF7 [77], have a subpopulation of highly metabolic cancer stem cells that have the capacity of self-renewal and differentiation [78]. The proportion of this subpopulation can increase with treatment either by induction of pluripotency in non-stem cells or by the selection of more resistant stem cells [77]. Alternatively, cytotoxic events were shown to induce mitochondrial biogenesis and hyperactivation in MCF7 cells, leading to increased metabolic viability and MTT reduction [75].
The other unexpected case was seen with PC3 and MNNG/HOS which displayed a reduced MTT index, which can be explained by a decrease in mitochondria content most likely in the context of autophagy. Cytotoxic events often induce autophagy, but whether this is a death mechanism or an unsuccessful attempt at cellular preservation is often unclear [79]. Autophagy can drive survival, but not necessarily in nutrient-deprived conditions, as it can be induced by ROS [80]. Despite the role of autophagy in supporting cell survival, cell death following progressive cellular consumption has been attributed to unrestricted autophagy. Thus, autophagy can explain a reduction in metabolic activity disproportional to the proliferation rate.
Several studies report the superior antiproliferative effect of plasma in cancer cells when compared to benign parenchymal counterparts or stromal cells [13,28,81]. While we did not perform the same assays in normal counterpart cells, we tested the same methodology in the standard somatic cells of connective tissue, fibroblasts HFF-1, which was one of the cell lines categorized as resistant. However, an explanation for this differential effect and selectivity is still lacking.
While a low dose of non-thermal plasma may have little to no effect on cancer cells, higher doses may ablate both cancer cells and phenotypically normal counterparts. In between, there is a range of conditions where selective damage to malignant cells might be possible. In fact, in the future, we aim to characterize treatment effect by varying setup conditions, which were maintained arbitrarily in this study, such as electric potential difference and frequency of oscillation of the AC circuit.

5. Conclusions

The effects of the CAP treatment evaluated by MTT and SRB assays suggest that this approach can reduce the metabolic activity and the protein content with relatively short periods of time exposure in most cell lines tested. Maximal effects are seen at the longest time exposures tested, 60, 90, and 120 s, with exposures recorded before 60 s not revealing any damage to the cancer cells.
Furthermore, exposure during 60 s highlights the more pronounced selective effects, considering the periods and electrical output settings evaluated. Concluding, these results are promising for future studies as plasma might offer a new anti-cancer treatment. Currently, several studies are being performed to evaluate the type of cell death and mechanism, considering different plasma conditions. Thus, CAP should be the target of a more refined investigation to confirm its potential as an anticancer therapy.
Plasma is envisioned as a local treatment, whether through irradiation of body surfaces, exposed or available by endoscopy, or exposure of cavities to activated media. Moreover, current literature points to a penetration of several millimeters into tissue [82]. In the near future, we aim to address these topics.

Author Contributions

Conceptualization, R.S.-T., M.L., A.M.A., F.C., and M.F.B.; methodology, R.S.-T., M.L., and F.C.; validation, M.L.; formal analysis, R.S.-T. and F.C.; investigation, C.A.-F., R.S.-T., N.A., G.B., J.D.-F., I.M., R.N., B.S., and R.T.; resources, A.M.A. and M.F.B.; data curation, C.A.-F., R.S.-T., and M.L.; writing—original draft preparation, C.A.-F. and R.S.-T.; writing—review and editing, M.L., F.C., and M.F.B.; visualization, C.A.-F. and R.S.-T.; supervision, M.L., F.C., and M.F.B.; project administration, M.F.B.; funding acquisition, M.F.B. All authors have read and agreed to the published version of the manuscript.

Funding

CIBB was funded by the Foundation for Science and Technology (FCT, Portugal) through the Strategic Project UIDB/04539/2020 and UIDP/04539/2020. PhD Scholarship grant from FCT to Inês A. Marques [SFRH/BD/136973/2018] and Ricardo Teixo [SFRH/BD/116794/2016].

Conflicts of Interest

The authors declare no conflict of interest.

Appendix A

Figure A1. MTT assay results 24 h after plasma therapy application in different human cell lines: hormonal receptor positive breast cancer (MCF7), triple-negative breast cancer (HCC1806), prostate (PC3 and LnCap), esophageal adenocarcinoma (OE19), urinary bladder grade 3 carcinoma (HT1376), osteosarcoma (MNNG-HOS), extrahepatic bile duct carcinoma (TFK-1), endometrial cancer (ECC-1), lung cancer (H1299), melanoma (A375), colon carcinoma (WiDr), and fibroblast (HFF1) at distinct times: 15, 30, 60, 90, and 120 s. Results are expressed as the percentage of metabolic activity normalized to control. Statistical significance in relation to control and between cell populations is represented as * for p < 0.05, ** for p < 0.0,1 and *** for p < 0.001 (n = 9).
Applsci 11 04171 g0a1
Figure A2. SRB assay results 24 h after plasma therapy application in different human cell lines: hormonal receptor positive breast cancer (MCF7), triple-negative breast cancer (HCC1806), prostate (PC3 and LnCap), esophageal adenocarcinoma (OE19), urinary bladder grade 3 carcinoma (HT1376), osteosarcoma (MNNG-HOS), extrahepatic bile duct carcinoma (TFK-1), endometrial cancer (ECC-1), lung cancer (H1299), melanoma (A375), colon carcinoma (WiDr), and fibroblast (HFF1) at distinct times: 15, 30, 60, 90, and 120 s. Results are expressed as the percentage of protein content normalized to control. Statistical significance in relation to control and between cell populations is represented as * for p < 0.05, ** for p < 0.01, and *** for p < 0.001 (n = 9).
Applsci 11 04171 g0a2

References

  1. Hanahan, D.; Weinberg, R.A. Hallmarks of Cancer: The Next Generation. Cell 2011, 144, 646–674. [Google Scholar] [CrossRef] [Green Version]
  2. Ferlay, J.; Soerjomataram, I.; Dikshit, R.; Eser, S.; Mathers, C.; Rebelo, M.; Parkin, D.M.; Forman, D.; Bray, F. Cancer incidence and mortality worldwide: Sources, methods and major patterns in GLOBOCAN 2012. Int. J. Cancer 2014, 136, E359–E386. [Google Scholar] [CrossRef] [PubMed]
  3. Kong, P. Myrtle Atmospheric-Pressure Plasma Process and Applications. SOHN Int. Symp. Adv. Process. Metals Mater. Technol. Ind. Pract. 2006, 6, 493–506. [Google Scholar]
  4. Rahman, Z.; Rahman, H.; Rahman, M.A. Classification and Generation of Atmospheric Pressure Plasma and Its Principle Applications. Int. J. Math. Phys. Sci. Res. 2015, 2, 127–146. [Google Scholar]
  5. Kong, M.G.; Kroesen, G.; Morfill, G.; Nosenko, T.; Shimizu, T.; Van Dijk, J.; Zimmermann, J.L. Plasma medicine: An introductory review. New J. Phys. 2009, 11, 115012. [Google Scholar] [CrossRef]
  6. Köritzer, J.; Boxhammer, V.; Schäfer, A.; Shimizu, T.; Klämpfl, T.G.; Li, Y.-F.; Welz, C.; Schwenk-Zieger, S.; Morfill, G.E.; Zimmermann, J.L.; et al. Restoration of Sensitivity in Chemo — Resistant Glioma Cells by Cold Atmospheric Plasma. PLoS ONE 2013, 8, e64498. [Google Scholar] [CrossRef] [PubMed] [Green Version]
  7. Kaushik, N.K.; Kaushik, N.; Park, D.; Choi, E.H. Altered Antioxidant System Stimulates Dielectric Barrier Discharge Plasma-Induced Cell Death for Solid Tumor Cell Treatment. PLoS ONE 2014, 9, e103349. [Google Scholar] [CrossRef]
  8. Tanaka, H.; Mizuno, M.; Katsumata, Y.; Ishikawa, K.; Kondo, H.; Hashizume, H.; Okazaki, Y.; Toyokuni, S.; Nakamura, K.; Yoshikawa, N.; et al. Oxidative stress-dependent and -independent death of glioblastoma cells induced by non-thermal plasma-exposed solutions. Sci. Rep. 2019, 9, 13657. [Google Scholar] [CrossRef] [Green Version]
  9. Conway, G.; He, Z.; Hutanu, A.L.; Cribaro, G.P.; Manaloto, E.; Casey, A.; Traynor, D.; Milosavljevic, V.; Howe, O.; Barcia, C.; et al. Cold Atmospheric Plasma induces accumulation of lysosomes and caspase-independent cell death in U373MG glioblastoma multiforme cells. Sci. Rep. 2019, 9, 12891. [Google Scholar] [CrossRef] [PubMed] [Green Version]
  10. Xiang, L.; Xu, X.; Zhang, S.; Cai, D.; Dai, X. Cold atmospheric plasma conveys selectivity on triple negative breast cancer cells both in vitro and in vivo. Free. Radic. Biol. Med. 2018, 124, 205–213. [Google Scholar] [CrossRef]
  11. Liu, Y.; Tan, S.; Zhang, H.; Kong, X.; Ding, L.; Shen, J.; Lan, Y.; Cheng, C.; Zhu, T.; Xia, W. Selective effects of non-thermal atmospheric plasma on triple-negative breast normal and carcinoma cells through different cell signaling pathways. Sci. Rep. 2017, 7, 7980. [Google Scholar] [CrossRef] [PubMed]
  12. Shaw, P.; Kumar, N.; Hammerschmid, D.; Privat-Maldonado, A.; Dewilde, S.; Bogaerts, A. Synergistic Effects of Melittin and Plasma Treatment: A Promising Approach for Cancer Therapy. Cancers 2019, 11, 1109. [Google Scholar] [CrossRef] [PubMed] [Green Version]
  13. Wang, M.; Holmes, B.; Cheng, X.; Zhu, W.; Keidar, M.; Zhang, L.G. Cold Atmospheric Plasma for Selectively Ablating Metastatic Breast Cancer Cells. PLoS ONE 2013, 8, e73741. [Google Scholar] [CrossRef]
  14. LeDuc, M.; Guay, D.; Leask, R.L.; Coulombe, S. Cell permeabilization using a non-thermal plasma. New J. Phys. 2009, 11, 115021. [Google Scholar] [CrossRef]
  15. Ryan, H.A.; Neuber, J.; Song, S.; Beebe, S.J.; Jiang, C.; Member, S. Effects of a non-thermal plasma needle device on HPV-16 positive cervical cancer cell viability in vitro. In Proceedings of the 2016 38th Annual International Conference of the IEEE Engineering in Medicine and Biology Society (EMBC), Institute of Electrical and Electronics Engineers (IEEE), Lake Buena Vista (Orlando), FL, USA, 16–20 August 2016; Volume 2016, pp. 537–540. [Google Scholar]
  16. Kim, C.-H.; Kwon, S.; Bahn, J.H.; Lee, K.; Jun, S.I.; Rack, P.D.; Baek, S.J. Effects of atmospheric nonthermal plasma on invasion of colorectal cancer cells. Appl. Phys. Lett. 2010, 96, 243701. [Google Scholar] [CrossRef] [Green Version]
  17. Kim, C.-H.; Bahn, J.H.; Lee, S.-H.; Kim, G.-Y.; Jun, S.-I.; Lee, K.; Baek, S.J. Induction of cell growth arrest by atmospheric non-thermal plasma in colorectal cancer cells. J. Biotechnol. 2010, 150, 530–538. [Google Scholar] [CrossRef] [PubMed]
  18. Vandamme, M.; Robert, E.; Lerondel, S.; Sarron, V.; Ries, D.; Dozias, S.; Sobilo, J.; Gosset, D.; Kieda, C.; Legrain, B.; et al. ROS implication in a new antitumor strategy based on non-thermal plasma. Int. J. Cancer 2012, 130, 2185–2194. [Google Scholar] [CrossRef]
  19. Ishaq, M.; Evans, M.D.; Ostrikov, K. (Ken) Atmospheric pressure gas plasma-induced colorectal cancer cell death is mediated by Nox2–ASK1 apoptosis pathways and oxidative stress is mitigated by Srx–Nrf2 anti-oxidant system. Biochim. Biophys. Acta (BBA) Bioenerg. 2014, 1843, 2827–2837. [Google Scholar] [CrossRef]
  20. Guerrero-Preston, R.; Ogawa, T.; Uemura, M.; Shumulinsky, G.; Valle, B.L.; Pirini, F.; Ravi, R.; Sidransky, D.; Keidar, M.; Trink, B. Cold atmospheric plasma treatment selectively targets head and neck squamous cell carcinoma cells. Int. J. Mol. Med. 2014, 34, 941–946. [Google Scholar] [CrossRef] [Green Version]
  21. Welz, C.; Emmert, S.; Canis, M.; Becker, S.; Baumeister, P.; Shimizu, T.; Morfill, G.E.; Harréus, U.; Zimmermann, J.L. Cold Atmospheric Plasma: A Promising Complementary Therapy for Squamous Head and Neck Cancer. PLoS ONE 2015, 10, e0141827. [Google Scholar] [CrossRef] [Green Version]
  22. Kang, S.U.; Cho, J.-H.; Chang, J.W.; Shin, Y.S.; Kim, K.I.; Park, J.K.; Yang, S.S.; Lee, J.-S.; Moon, E.; Lee, K.; et al. Nonthermal plasma induces head and neck cancer cell death: The potential involvement of mitogen-activated protein kinase-dependent mitochondrial reactive oxygen species. Cell Death Dis. 2014, 5, e1056. [Google Scholar] [CrossRef]
  23. Turrini, E.; Laurita, R.; Stancampiano, A.; Catanzaro, E.; Calcabrini, C.; Maffei, F.; Gherardi, M.; Colombo, V.; Fimognari, C. Cold Atmospheric Plasma Induces Apoptosis and Oxidative Stress Pathway Regulation in T-Lymphoblastoid Leukemia Cells. Oxidative Med. Cell. Longev. 2017, 2017, 1–13. [Google Scholar] [CrossRef] [PubMed]
  24. Barekzi, N.; Laroussi, M. Dose-dependent killing of leukemia cells by low-temperature plasma. J. Phys. D Appl. Phys. 2012, 45, 422002. [Google Scholar] [CrossRef]
  25. Bekeschus, S.; Wende, K.; Hefny, M.M.; Rödder, K.; Jablonowski, H.; Schmidt, A.; Von Woedtke, T.; Weltmann, K.-D.; Benedikt, J. Oxygen atoms are critical in rendering THP-1 leukaemia cells susceptible to cold physical plasma-induced apoptosis. Sci. Rep. 2017, 7, 2791. [Google Scholar] [CrossRef] [PubMed] [Green Version]
  26. Asif, M.; Liu, H.; Aziz, A.; Wang, H.; Wang, Z.; Ajmal, M.; Xiao, F.; Liu, H. Core-shell iron oxide-layered double hydroxide: High electrochemical sensing performance of H 2 O 2 biomarker in live cancer cells with plasma therapeutics. Biosens. Bioelectron. 2017, 97, 352–359. [Google Scholar] [CrossRef]
  27. Gweon, B.; Kim, M.; Kim, D.B.; Kim, D.; Kim, H.; Jung, H.; Shin, J.H.; Choe, W. Differential responses of human liver cancer and normal cells to atmospheric pressure plasma. Appl. Phys. Lett. 2011, 99, 063701. [Google Scholar] [CrossRef] [Green Version]
  28. Keidar, M.; Walk, R.M.; Shashurin, A.; Srinivasan, P.; Sandler, A.B.; Dasgupta, S.; Ravi, R.; Guerreropreston, R.; Trink, B. Cold plasma selectivity and the possibility of a paradigm shift in cancer therapy. Br. J. Cancer 2011, 105, 1295–1301. [Google Scholar] [CrossRef] [PubMed]
  29. Kim, J.Y.; Ballato, J.; Foy, P.; Hawkins, T.; Wei, Y.; Li, J.; Kim, S.-O. Apoptosis of lung carcinoma cells induced by a flexible optical fiber-based cold microplasma. Biosens. Bioelectron. 2011, 28, 333–338. [Google Scholar] [CrossRef] [PubMed]
  30. Panngom, K.; Baik, K.Y.; Nam, M.K.; Han, J.H.; Rhim, H.; Choi, E.H. Preferential killing of human lung cancer cell lines with mitochondrial dysfunction by nonthermal dielectric barrier discharge plasma. Cell Death Dis. 2013, 4, e642. [Google Scholar] [CrossRef] [Green Version]
  31. Tabuchi, Y.; Uchiyama, H.; Zhao, Q.-L.; Yunoki, T.; Andocs, G.; Nojima, N.; Takeda, K.; Ishikawa, K.; Hori, M.; Kondo, T. Effects of nitrogen on the apoptosis of and changes in gene expression in human lymphoma U937 cells exposed to argon-based cold atmospheric pressure plasma. Int. J. Mol. Med. 2016, 37, 1706–1714. [Google Scholar] [CrossRef] [PubMed]
  32. Han, X.; Klas, M.; Liu, Y.; Stack, M.S.; Ptasinska, S. DNA damage in oral cancer cells induced by nitrogen atmospheric pressure plasma jets. Appl. Phys. Lett. 2013, 102, 233703. [Google Scholar] [CrossRef]
  33. Chang, J.W.; Kang, S.U.; Shin, Y.S.; Kim, K.I.; Seo, S.J.; Yang, S.S.; Lee, J.-S.; Moon, E.; Baek, S.J.; Lee, K.; et al. Non-thermal atmospheric pressure plasma induces apoptosis in oral cavity squamous cell carcinoma: Involvement of DNA-damage-triggering sub-G1 arrest via the ATM/p53 pathway. Arch. Biochem. Biophys. 2014, 545, 133–140. [Google Scholar] [CrossRef]
  34. Gümbel, D.; Daeschlein, G.; Ekkernkamp, A.; Kramer, A.; Stope, M.B. Cold atmospheric plasma in orthopaedic and urologic tumor therapy. GMS Hyg Infect Control. 2017, 12, 12. [Google Scholar]
  35. Canal, C.; Fontelo, R.; Hamouda, I.; Guillem-Marti, J.; Cvelbar, U.; Ginebra, M.-P. Plasma-induced selectivity in bone cancer cells death. Free. Radic. Biol. Med. 2017, 110, 72–80. [Google Scholar] [CrossRef] [PubMed] [Green Version]
  36. Koensgen, D.; Besic, I.; Gümbel, D.; Kaul, A.; Weiss, M.; Diesing, K.; Kramer, A.; Bekeschus, S.; Mustea, A.; Stope, M.B. Cold Atmospheric Plasma (CAP) and CAP-Stimulated Cell Culture Media Suppress Ovarian Cancer Cell Growth – A Putative Treatment Option in Ovarian Cancer Therapy. Anticancer Res. 2017, 37, 6739–6744. [Google Scholar] [CrossRef] [PubMed]
  37. Iseki, S.; Nakamura, K.; Hayashi, M.; Tanaka, H.; Kondo, H.; Kajiyama, H.; Kano, H.; Kikkawa, F.; Hori, M. Selective killing of ovarian cancer cells through induction of apoptosis by nonequilibrium atmospheric pressure plasma. Appl. Phys. Lett. 2012, 100, 113702. [Google Scholar] [CrossRef]
  38. Utsumi, F.; Kajiyama, H.; Nakamura, K.; Tanaka, H.; Hori, M.; Kikkawa, F. Selective cytotoxicity of indirect nonequilibrium atmospheric pressure plasma against ovarian clear-cell carcinoma. SpringerPlus 2014, 3, 1–9. [Google Scholar] [CrossRef] [Green Version]
  39. Brullé, L.; Vandamme, M.; Riès, D.; Martel, E.; Robert, E.; Lerondel, S.; Trichet, V.; Richard, S.; Pouvesle, J.-M.; Le Pape, A. Effects of a Non Thermal Plasma Treatment Alone or in Combination with Gemcitabine in a MIA PaCa2-luc Orthotopic Pancreatic Carcinoma Model. PLoS ONE 2012, 7, e52653. [Google Scholar] [CrossRef] [PubMed]
  40. Ma, T.; Schreiber, C.A.; Knutson, G.J.; El Khattouti, A.; Sakiyama, M.J.; Hassan, M.; Charlesworth, M.C.; Madden, B.J.; Zhou, X.; Vuk-Pavlovic, S.; et al. Effects of oxygen on the antigenic landscape of prostate cancer cells. BMC Res. Notes 2015, 8, 687. [Google Scholar] [CrossRef] [PubMed] [Green Version]
  41. Lee, H.J.; Shon, C.H.; Kim, Y.S.; Kim, S.; Kim, G.C.; Kong, M.G. Degradation of adhesion molecules of G361 melanoma cells by a non-thermal atmospheric pressure microplasma. New J. Phys. 2009, 11, 115026. [Google Scholar] [CrossRef]
  42. Schneider, C.; Gebhardt, L.; Arndt, S.; Karrer, S.; Zimmermann, J.L.; Fischer, M.J.M.; Bosserhoff, A.-K. Acidification is an Essential Process of Cold Atmospheric Plasma and Promotes the Anti-Cancer Effect on Malignant Melanoma Cells. Cancers 2019, 11, 671. [Google Scholar] [CrossRef] [PubMed] [Green Version]
  43. Kurake, N.; Tanaka, H.; Ishikawa, K.; Kondo, T.; Sekine, M.; Nakamura, K.; Kajiyama, H.; Kikkawa, F.; Mizuno, M.; Hori, M. Cell survival of glioblastoma grown in medium containing hydrogen peroxide and/or nitrite, or in plasma-activated medium. Arch. Biochem. Biophys. 2016, 605, 102–108. [Google Scholar] [CrossRef] [PubMed]
  44. Adachi, T.; Tanaka, H.; Nonomura, S.; Hara, H.; Kondo, S.-I.; Hori, M. Plasma-activated medium induces A549 cell injury via a spiral apoptotic cascade involving the mitochondrial–nuclear network. Free. Radic. Biol. Med. 2015, 79, 28–44. [Google Scholar] [CrossRef] [PubMed]
  45. Winter, J.; Tresp, H.; Hammer, M.U.; Iseni, S.; Kupsch, S.; Schmidt-Bleker, A.; Wende, K.; Dünnbier, M.; Masur, K.; Weltmann, K.-D.; et al. Tracking plasma generated H2O2 from gas into liquid phase and revealing its dominant impact on human skin cells. J. Phys. D Appl. Phys. 2014, 47, 285401. [Google Scholar] [CrossRef]
  46. Bekeschus, S.; Kolata, J.; Winterbourn, C.; Kramer, A.; Turner, R.; Weltmann, K.D.; Bröker, B.; Masur, K. Hydrogen peroxide: A central player in physical plasma-induced oxidative stress in human blood cells. Free. Radic. Res. 2014, 48, 542–549. [Google Scholar] [CrossRef] [PubMed]
  47. Sato, T.; Yokoyama, M.; Johkura, K. A key inactivation factor of HeLa cell viability by a plasma flow. J. Phys. D Appl. Phys. 2011, 44, 44. [Google Scholar] [CrossRef]
  48. Gibson, A.R.; McCarthy, H.O.; Ali, A.A.; O’Connell, D.; Graham, W.G. Interactions of a Non-Thermal Atmospheric Pressure Plasma Effluent with PC-3 Prostate Cancer Cells. Plasma Process. Polym. 2014, 11, 1142–1149. [Google Scholar] [CrossRef]
  49. Yan, D.; Cui, H.; Zhu, W.; Talbot, A.; Zhang, L.G.; Sherman, J.H.; Keidar, M. The Strong Cell-based Hydrogen Peroxide Generation Triggered by Cold Atmospheric Plasma. Sci. Rep. 2017, 7, 1–9. [Google Scholar] [CrossRef]
  50. Ma, J.; Zhang, H.; Cheng, C.; Shen, J.; Bao, L.; Han, W. Contribution of hydrogen peroxide to non-thermal atmospheric pressure plasma induced A549 lung cancer cell damage. Plasma Process. Polym. 2017, 14, 1600162. [Google Scholar] [CrossRef]
  51. Bekeschus, S.; Schmidt, A.; Niessner, F.; Gerling, T.; Weltmann, K.-D.; Wende, K. Basic Research in Plasma Medicine—A Throughput Approach from Liquids to Cells. J. Vis. Exp. 2017, e56331. [Google Scholar] [CrossRef] [Green Version]
  52. Xu, D.; Liu, D.; Wang, B.; Chen, C.; Chen, Z.; Li, D.; Yang, Y.; Chen, H.; Kong, M.G. In Situ OH Generation from O2− and H2O2 Plays a Critical Role in Plasma-Induced Cell Death. PLoS ONE 2015, 10, e0128205. [Google Scholar] [CrossRef] [PubMed] [Green Version]
  53. Mohades, S.; Laroussi, M.; Sears, J.; Barekzi, N.; Razavi, H. Evaluation of the effects of a plasma activated medium on cancer cells. Phys. Plasmas 2015, 22, 122001. [Google Scholar] [CrossRef]
  54. Ahn, H.J.; Kim, K.I.; Hoan, N.N.; Kim, C.H.; Moon, E.; Choi, K.S.; Yang, S.S.; Lee, J.-S. Targeting Cancer Cells with Reactive Oxygen and Nitrogen Species Generated by Atmospheric-Pressure Air Plasma. PLoS ONE 2014, 9, e86173. [Google Scholar] [CrossRef]
  55. Tanaka, H.; Mizuno, M.; Ishikawa, K.; Toyokuni, S.; Kajiyama, H.; Kikkawa, F.; Hori, M. Molecular mechanisms of non-thermal plasma-induced effects in cancer cells. Biol. Chem. 2018, 400, 87–91. [Google Scholar] [CrossRef] [PubMed]
  56. Boehm, D.; Bourke, P. Safety implications of plasma-induced effects in living cells – a review of in vitro and in vivo findings. Biol. Chem. 2018, 400, 3–17. [Google Scholar] [CrossRef]
  57. International Commission on Non-Ionizing Radiation Protection Guidelines for Limiting Exposure to Time-Varying Electric and Magnetic Fields (1 Hz TO 100 kHz). Health Phys. 2010, 99, 818–836. [CrossRef] [PubMed]
  58. Kielbassa, C.; Roza, L.; Epe, B. Wavelength dependence of oxidative DNA damage induced by UV and visible light. Carcinogenesis 1997, 18, 811–816. [Google Scholar] [CrossRef] [PubMed] [Green Version]
  59. Nijdam, S.; Van Veldhuizen, E.; Bruggeman, P.; Ebert, U. An Introduction to Nonequilibrium Plasmas at Atmospheric Pressure. In Plasma Chemistry and Catalysis in Gases and Liquids; Wiley: Hoboken, NJ, USA, 2012; pp. 1–44. [Google Scholar]
  60. Chang, J.-S.; Lawless, P.A.; Yamamoto, T. Corona discharge processes. IEEE Trans. Plasma Sci. 1991, 19, 1152–1166. [Google Scholar] [CrossRef] [Green Version]
  61. Yousfi, M.; Merbahi, N.; Pathak, A.; Eichwald, O. Low-temperature plasmas at atmospheric pressure: Toward new pharmaceutical treatments in medicine. Fundam. Clin. Pharmacol. 2013, 28, 123–135. [Google Scholar] [CrossRef] [PubMed]
  62. Kolpaková, A.; Kudrna, P.; Tichý, M. Study of Plasma System by OES (Optical Emission Spectroscopy). In Proceedings of the 20th Annual Conference of Doctoral Students, Prague, Czech Republic, 31 May–3 June 2011; pp. 180–185. [Google Scholar]
  63. Volotskova, O.; Hawley, T.S.; Stepp, M.A.; Keidar, M. Targeting the cancer cell cycle by cold atmospheric plasma. Sci. Rep. 2012, 2, 636. [Google Scholar] [CrossRef] [Green Version]
  64. Yan, D.; Talbot, A.; Nourmohammadi, N.; Cheng, X.; Canady, J.; Sherman, J.H.; Keidar, M. Principles of using Cold Atmospheric Plasma Stimulated Media for Cancer Treatment. Sci. Rep. 2015, 5, 18339. [Google Scholar] [CrossRef] [PubMed] [Green Version]
  65. Weiss, M.; Gümbel, D.; Hanschmann, E.-M.; Mandelkow, R.; Gelbrich, N.; Zimmermann, U.; Walther, R.; Ekkernkamp, A.; Sckell, A.; Kramer, A.; et al. Cold Atmospheric Plasma Treatment Induces Anti-Proliferative Effects in Prostate Cancer Cells by Redox and Apoptotic Signaling Pathways. PLoS ONE 2015, 10, e0130350. [Google Scholar] [CrossRef] [PubMed]
  66. Lee, S.Y.; Kang, S.U.; Kim, K.I.; Kang, S.; Shin, Y.S.; Chang, J.W.; Yang, S.S.; Lee, K.; Lee, J.-S.; Moon, E.; et al. Nonthermal Plasma Induces Apoptosis in ATC Cells: Involvement of JNK and p38 MAPK-Dependent ROS. Yonsei Med J. 2014, 55, 1640–1647. [Google Scholar] [CrossRef] [PubMed] [Green Version]
  67. Ishaq, M.; Kumar, S.; Varinli, H.; Han, Z.J.; Rider, A.E.; Evans, M.D.M.; Murphy, A.B.; Ostrikov, K. Atmospheric gas plasma–induced ROS production activates TNF-ASK1 pathway for the induction of melanoma cancer cell apoptosis. Mol. Biol. Cell 2014, 25, 1523–1531. [Google Scholar] [CrossRef]
  68. Michels, A.J.; Frei, B. Myths, Artifacts, and Fatal Flaws: Identifying Limitations and Opportunities in Vitamin C Research. Nutrients 2013, 5, 5161–5192. [Google Scholar] [CrossRef] [PubMed] [Green Version]
  69. Gstraunthaler, G.; Lindl, T.; Van Der Valk, J. A plea to reduce or replace fetal bovine serum in cell culture media. Cytotechnology 2013, 65, 791–793. [Google Scholar] [CrossRef] [PubMed] [Green Version]
  70. van der Valk, J.; Brunner, D.; De Smet, K.; Svenningsen, Å.F.; Honegger, P.; Knudsen, L.; Lindl, T.; Noraberg, J.; Price, A.; Scarino, M. Optimization of chemically defined cell culture media – Replacing fetal bovine serum in mammalian in vitro methods. Toxicol. Vitr. 2010, 24, 1053–1063. [Google Scholar] [CrossRef] [PubMed] [Green Version]
  71. Boehm, D.; Heslin, C.; Cullen, P.J.; Bourke, P. Cytotoxic and mutagenic potential of solutions exposed to cold atmospheric plasma. Sci. Rep. 2016, 6, 21464. [Google Scholar] [CrossRef] [PubMed] [Green Version]
  72. Adan, A.; Kiraz, Y.; Baran, Y. The international international journal journal for timely for timely in-depth reviews in in-depth reviews in Pharmaceutical Pharmaceutical Biotechnology Impact Factor: 1.802 BENTHAM. Curr. Biotechnol. Pharm. 2016, 17, 1873–4316. [Google Scholar]
  73. Orellana, E.A.; Kasinski, A.L. Sulforhodamine B (SRB) Assay in Cell Culture to Investigate Cell Proliferation. Bio Protoc. 2016, 6, e1984. [Google Scholar] [CrossRef] [Green Version]
  74. Keepers, Y.P.; Pizao, P.E.; Peters, G.J.; van Ark-Otte, J.; Winograd, B.; Pinedo, H.M. Comparison of the sulforhodamine B protein and tetrazolium (MTT) assays for in vitro chemosensitivity testing. Eur. J. Cancer Clin. Oncol. 1991, 27, 897–900. [Google Scholar] [CrossRef] [Green Version]
  75. Rai, Y.; Pathak, R.; Kumari, N.; Sah, D.K.; Pandey, S.; Kalra, N.; Soni, R.; Dwarakanath, B.S.; Bhatt, A.N. Mitochondrial biogenesis and metabolic hyperactivation limits the application of MTT assay in the estimation of radiation induced growth inhibition. Sci. Rep. 2018, 8, 1–15. [Google Scholar] [CrossRef] [PubMed] [Green Version]
  76. Kim, S.J.; Chung, T.H. Cold atmospheric plasma jet-generated RONS and their selective effects on normal and carcinoma cells. Sci. Rep. 2016, 6, 20332. [Google Scholar] [CrossRef] [PubMed] [Green Version]
  77. Yang, G.; Quan, Y.; Wang, W.; Fu, Q.; Wu, J.; Mei, T.; Li, J.; Tang, Y.; Luo, C.; Ouyang, Q.; et al. Dynamic equilibrium between cancer stem cells and non-stem cancer cells in human SW620 and MCF-7 cancer cell populations. Br. J. Cancer 2012, 106, 1512–1519. [Google Scholar] [CrossRef] [PubMed]
  78. Dalerba, P.; Cho, R.W.; Clarke, M.F. Cancer Stem Cells: Models and Concepts. Annu. Rev. Med. 2007, 58, 267–284. [Google Scholar] [CrossRef] [Green Version]
  79. Mathew, R.; Karantza-Wadsworth, V.; White, E. Role of autophagy in cancer. Nat. Rev. Cancer 2007, 7, 961–967. [Google Scholar] [CrossRef]
  80. Mizushima, N. Autophagy: Process and function. Genes Dev. 2007, 21, 2861–2873. [Google Scholar] [CrossRef] [PubMed] [Green Version]
  81. Georgescu, N.; Lupu, A.R. Tumoral and Normal Cells Treatment with High-Voltage Pulsed Cold Atmospheric Plasma Jets. IEEE Trans. Plasma Sci. 2010, 38, 1949–1955. [Google Scholar] [CrossRef]
  82. Szili, E.J.; Hong, S.-H.; Oh, J.-S.; Gaur, N.; Short, R.D. Tracking the Penetration of Plasma Reactive Species in Tissue Models. Trends Biotechnol. 2018, 36, 594–602. [Google Scholar] [CrossRef] [PubMed] [Green Version]
Figure 1. (a) Schematic representation of the apparatus constructed for cell culture CAP irradiation. (b) Photograph of a cell culture multi-well plate being irradiated, showing the plasma plume.
Applsci 11 04171 g001
Figure 2. Voltage pulse waveform corrected to a closed circuit with an equivalent resistance of 120 MΩ obtained with an analogic oscilloscope.
Applsci 11 04171 g002
Figure 3. Optical emission spectrum of a cold atmospheric plasma jet obtained 5 mm away from the nozzle exit, over the range of selected wavelengths from 275 to 450 nm. Emission lines identify the particles and radicals produced.
Applsci 11 04171 g003
Figure 4. Accumulation of RONS in different CAP irradiated media. (a) Concentration of peroxides in 200 μL of exposed media. (b) Concentration of nitrites in 200 μL of exposed media. Results are presented as the mean ± SEM of at least three repeated experiments performed in triplicate and normalized for the control of non-irradiated medium. The significance compared is indicated as * p < 0.05, ** p < 0.01, and *** p < 0.005.
Applsci 11 04171 g004
Figure 5. Comparison of the cytotoxic effect of cold atmospheric plasma in different cell lines. (a) Comparison of the calculated exposure time required to decrease protein content by half (IT50) as assessed by SRB. (b) Comparison of the calculated exposure time required to decrease the metabolic rate by half (IT50) as assessed by MTT. Confidence intervals of 95% are represented by the horizontal bars. The calculated average IC50s of all cell lines are represented as a vertical bar in each figure. *: IT50 not computable.
Applsci 11 04171 g005
Table 1. Cancer cell lines shown to be responsive to cold atmospheric plasma in vitro.
Cancer TypesCell LinesReferences
Brain cancerLN18, LN229, U87MG, T98G, U251SP, U373MG-CD14[6,7,8,9]
Breast cancerMDA-MB-231, MCF7, MDAMB468, MDA-MB-453[10,11,12,13]
Cervical cancerHeLa, CaSki[14,15]
Colorectal cancerHCT-116, SW480, LoVo, Caco2, HT29[16,17,18,19]
Head and neck cancer JHU-022, JHU-028, JHU-029, SCC25, FaDu, SNU1041, SNU899, HN9, OSC 19 [20,21,22]
LeukemiaCCRFCEM, Jurkat, THP-1[23,24,25]
Liver cancerSK-HEP-1, H-22[26,27]
Lung cancerSW900, TC-1, H460, HCC1588, A549[28,29,30]
LymphomaU937[31]
Oral cancerKB, SCC25, MSK QLL1, SCC1483, SCC15[7,32,33]
OsteosarcomaU2-OS, MNNG-HOS, SaOS-2[34,35]
Ovarian cancerOHFC, HPMC, SKOV3 and HRA, OVCAR-3, TOV-21G, TOV-112D[36,37,38]
Pancreatic cancer MIA PaCa2 [39]
Prostate cancer LNCaP, PC-3, VCaP [34,40]
Skin cancerG361, A375[41,42]
Thyroid cancerSNU80, BHP10-3, TPC1[7]
Table 2. Concentration of H2O2 and NO2 generated by 60 s plasma compared with other plasma sources.
DeviceGap Length
(mm)
Volume
(μL)
H2O2
(μM)
NO2
(μM)
MediumRef.
Ar 60 Hz 7 kV NEAPP13300017 ± 3642 ± 10DMEM #5796[43]
Ar 60 Hz 2–6 kVNEAPP36000227 ± 42265DMEM #5796[44]
Ar 1 MHz 2–6 kV plasma jet (kinpen GmbH)9500033n.d.RPMI + FBS(8%) + P/S(1%)[45]
Ar 1.1 MHz plasma jet (kinpen 09 GmbH)5 from the top of the well10006026RPMI + FBS(10%) + P/S(2%) +glutamine(1%)[46]
Air 5 kHz 7.5 kV Liquid surface1,5100087n.d.MEM + FBS (10%) + P/S[47]
He + 0.3%O2 13.56 MHz201500n.a.7.4 ± 1MEM + FBS 10%[48]
Ar 60 Hz AC 7 kV1330001.8 × 1046.3 × 105DMEM #5796 + P/S + 10% FBS[43]
Ar 60 Hz AC 7 kV1330002.1 × 1046.3 × 105DMEM #5796 + 10% FBS[43]
He 30 KHz 3.85 kV303050n.a.DMEM #11965-118[49]
He 24 kKz 12 kV520002.3 × 103 ± 24055 ± 9DMEM + 15% FBS[50]
Ar 2 kV 1.1 MHzn.d.1006022RPMI #1640 + 10% FBS[51]
Ar 2 kV 1.1 MHzn.d.1006031RPMI #1640[51]
He + H2O 10 KHz 8 kV150030050–60n.d.RPMI #1640[52]
Ar 10 kHZ 10 kV1500300<20n.d.RPMI #1640[52]
He 5 kHz 5–9 kV2500 from the bottom of the well50028n.d.MEM[53]
Air 1 kHz 4 kV22008.4 × 103 ± 2.7 × 103873 ± 15RPMI #1640 + 5% FBSAuthor’s
Air 1 kHz 4 kV22001.9 × 104 ± 0.3 × 104414 ± 47RPMI #1640 + 15% FBSAuthor’s
Air 1 kHz 4 kV22003.9 × 103 ± 1.3 × 103929 ± 24DMEM #5648 + 5% FBSAuthor’s
Air 1 kHz 4 kV22002.4 × 103 ± 1.3 × 103742 ± 82DMEM #5648 + 15% FBSAuthor’s
n.d.: not disclosed.
Table 3. Comparison of different characteristics of treated cell lines and the effect of treatment observed. Dose–response curves were traced for each cell line and the treatment duration that was required to reduce metabolic activity and protein content by 50% (IT50) was calculated using MTT and SRB assays, respectively, with software Origin Pro 8.0, with a confidence interval of 95%.
Cell Line Cells Plated (Cells/mL) Organ Histology Culture Medium MTT (IT50 (s)) SRB (IT50 (s))
A375 100,000 Skin Melanoma DMEM 5% 32.1 ± 7.1 31.8 ± 1.5
OE19 100,000 Esophagus Adenocarcinoma DMEM 5% 68.9 ± 9.0 nc.
HT1376 80,0000 Urinary bladder Transitional carcinoma grade 3 DMEM 10% 34.6 ±3.7 35.0 ± 3.6
MNNG/HOS 50,000 Bone Osteosarcoma DMEM 5% 33.1 ± 4.6 66.8 ± 5.5
TFK-1 80,000 Extra-hepatic bile duct Carcinoma RPMI 15% 30.5 ± 3.2 44.2 ± 7.9
PC3 100,000 Prostate (derived from bone) Adenocarcinoma grade IV RPMI 5% 25.4 ± 4.0nc.
WIDR 50,000 Colon Adenocarcinoma DMEM 10% nc.50.7 ± 6.3
LNCAP 100,000 Prostate (derived from left supraclavicular lymph node) Adenocarcinoma RPMI 10% 19.0 ± 2.540.2 ± 10.9
ECC-1 100,000 Endometrium Adenocarcinoma RPMI 10% 36.6 ± 4.1 48.9 ± 13.6
H1299 100,000 Lung (derived from lymph node) Large cell carcinoma DMEM 10% 46.4 ± 6.2 35.3 ± 5.0
MCF-7 100,000 Breast (derived from Pleural effusion) Invasive ductal carcinoma DMEM 10% 65.6 ± 7.9 22.4 ± 4.7
HCC 1806 100,000 Breast Squamous cell breast carcinoma, acantholytic variant RPMI 10% 69.4 ± 9.3 49.8 ± 10.0
HFF-1 250,000 Connective tissue Fibroblasts DMEM 15% 61.5 ± 2.1 nc.
nc.: non-computable.
Publisher’s Note: MDPI stays neutral with regard to jurisdictional claims in published maps and institutional affiliations.

