Abstract
An algorithm for constructing a dynamic analysis during the formation of a wave field of stand for testing turbines and the effect of the frequency interaction of the stand’s elements on the measurement of its magnitude is described. The research algorithm involves the use of theoretical solutions of nonlinear wave processes using linear oscillations, refined by experiments. The diagnostic model can determine the technical condition of the stand’s elements and also determine the causes of the discrepancies between the calculated and measured turbine power values. To clarify the stiffness coefficients between the stand’s elements, a modal analysis was used to obtain the range of their changes depending on the external dynamic load, which made it possible to assess the impact of changes in the frequency interaction conditions on the turbine power measurement at different test modes. The conditions for amplifying the amplitude of oscillations at their eigenfrequencies are obtained, and the value of the possible deviation of the expected power value at its measurement for specific modes of the turbine is calculated. The algorithm allows to estimate the dynamic state of the stand-in different research modes of turbines and give recommendations for reducing the level of frequency interaction.
1. Introduction
The stringent requirements that are imposed on the quality of generated energy necessitate making significant fundamental modifications to existing turbine plant prototypes. The conditions of a test stand offer the possibility of combining the stages of computer-aided tests, i.e., simulation of the automatic control system, and hardware-in-the loop-tests, i.e., tests of mockups and experimental and pilot prototypes, also using a computer model of the power system [1]. During the experimental testing of new and modernized products, it is important to take into account the influence of external factors, in particular, frequency interactions with the stand elements caused by vibrations and their influence on the receipt of measurement information from measuring devices built into the stand equipment. In addition, vibration processes can cause damage to the stand and measuring devices.
To control vibration parameters, various methods and devices are offered. For example, in work [2], the prediction of bearing failure based on the results of vibration monitoring of bearing assemblies based on the damage accumulation model is considered. In work [3], a model of optimal frequency control of vibration by a formative active excitation of indefinite flexible mechanical systems with constant excitation is presented. In work [4], a model of studies of nonlinear analysis of the frequency response of hydrodynamic plain bearings with external disturbances according to the results of monitoring of bearing assemblies is presented.
In work [5], the results of an experimental determination of the dynamic force coefficients of a flexible shaft in bearing assemblies are presented. In work [6], the results of experimental vibration tests of a turbo compressor of a high-speed diesel engine are presented. In work [7], questions of the influence of nonlinearity in the dynamic analysis of the machines’ operations are considered; also, the examples of the behavior of their structures are shown. Work [8] described a micro turbocharger with airfoil bearings for a 100 W micro-electric power station, and dynamic analysis to improve the dynamic characteristics of the rotor is given. In work [9], the results of a study of the effect of rotor imbalance in response (vibration) on its stability in hybrid airfoil bearings are presented.
In paper [10], the technical problems of using the Markov process for managing and planning the operation of equipment using a servicing strategy relevant to the technical state are considered. In paper [11], the authors considered the problem of torque pulsation and its stabilization by means of control for switched reluctance drives. The authors introduced the method of model predictive control with reduced integration step size in order to implement precise torque stabilization using pulse width modulation.
The paper [12] presents the experimental results of the combustion diagnosis in the cylinders of heavy diesel engines with direct injection. In work [13], devices are considered to improve the accuracy of parameter measurement: For the vibrational movement of elements of electronic equipment, a three-component measurement method is used. Additionally, modal impedance curves calculated using the linear perturbation method are used to predict rotor-dynamic characteristics of the rotor.
The scheme of the information model of provision of multi-aspect diagnostics of the condition of the electrotechnical complex elements in the standard IDEFlx is given in paper [14].
In this regard, attention should be paid to transients and the restructuring of the “product-stand” self-oscillating system; for example, when the power (number of rotations and other parameters) of the product in the measuring devices of the stand’s modes. Receiving and studying the correct measurement data is the actual task.
To understand the physical aspects of the dynamic behavior of products, experimental complexes are developed based on which issues of the product and stand’s dynamic interaction are investigated. In addition, it is necessary to simultaneously solve the problem of not only obtaining actual results but also to assess the impact of transients during the receiving of a new self-oscillating “product-stand” mode. This is a multi-parameter problem wherein various methods are used to solve, including reducing the dynamic effect of rotation elements (rotors) [15,16] or due to the think selection of turbine block blades [17] or integrated approaches [18,19].
However, insufficient attention is being paid to the influence of frequency interactions with measurement elements embedded in the stand’s equipment since frequency interaction can lead to incorrect results of measuring the output parameters of the equipment under test at the stand. In this case, it is necessary to study the eigenfrequencies and forced frequencies of the elements of the stand’s equipment, both with the tested product and without it. To control the vibration parameters, various means and devices and various methods for processing vibration signals are offered.
Equally important is the identification of the causes leading to a change in the error of the attorney measuring devices during stand tests of various mechanical systems [9,20]. This is especially important for units that provide a minimum dispersion of traction characteristics of various power plants; therefore, strict requirements are imposed on them to meet the specified power characteristics. Therefore, measuring the actual power of the turbine of a turbopump unit depending on the speed (number of rotations) of the turbine allows us to build processes for regulating the operation of the power plant; thereby, minimizing losses (an increase in the error in measuring the power of the turbine is the additional mass of fuel for the gas generator to work).
There are quite a lot of works on the actual change in the error when changing the number of rotations [21], which allows us to take into account when developing the power unit operation algorithm both when entering the mode and in control problems during stand tests of the turbine.
Stand tests of turbines usually have an electric drive part, which provides loading of the turbine during its tests as part of the stand. Typically, this is a generator with a speed reduction system (multiplier), which is mounted on the same frame with elements for measuring the speed of the turbine and its torque. Consequently, the presence of certain structural elements can be based on the works [5,7]. It can be assumed that these elements of the stand will affect the dynamic behavior of the stand during turbine tests. Figure 1 shows a part of the installation of the stand with a generator and a multiplier, indicating the points of measurement of the level of vibration during testing and the study of the modal characteristics of these elements mounted on a common frame of the stand.
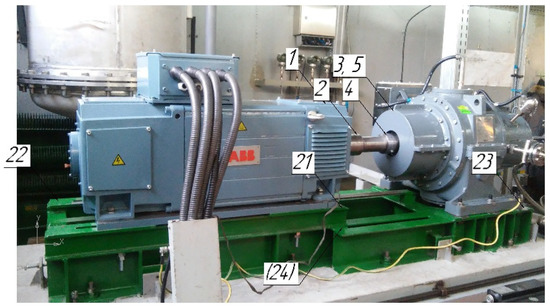
Figure 1.
General view of the installation generator and frame with measuring points.
When testing the elements of mechanical systems, there is a significant impact on their operation. It is important to understand the influence of the stand’s elements on the measurement results.
In this paper, we do not evaluate the errors of the measuring system, but we pose the problem of identifying the discrepancy between the expected value of the turbine power at certain numbers of its rotations (calculated value) and its measured value during testing in the stand.
Nowadays, there are practically no studies aimed at obtaining the influence of the stand’s equipment on the stand’s measuring systems. For example, when a turbine block at the stand is working, a significant spread in the magnitude of the realized torque with its calculated value was revealed. This is especially observed during transients associated with a change in the turbine operating modes. In addition, during the steady-state process, at certain rotations of the turbine, oscillations of the measured torque in time relative to its average value are recorded. It can be assumed that these oscillations of the measured torque are associated with the occurrence of self-oscillating processes of the stand’s wave field with the turbine. Therefore, the analysis of the reasons leading to the discrepancy between the “expected” characteristics of the turbine power and the actually measured values during the turbine working at the stand is an urgent research task. This task allows us to understand and evaluate the impact of dynamic interactions of the structural elements of the stand and the turbine on the reliability of the power plant.
2. Research Methods
To study the modal frequencies of the test stand and measure the level of vibration, we used the tuning measuring and vibration analyzer Kamerton [22] with a set of VK 310A vibration sensors that comply with ISO 8042:1988 [23]. The characteristics of the measuring device are shown in Table 1.

Table 1.
Technical characteristics of the measuring device Kamerton.
The eigenfrequencies (modal frequencies) and vibrations of the stand were measured at the same points (bearing units, mounting units of the stand elements, on the frame and foundation), which made it possible to conduct a frequency analysis and build a model of the frequency interaction of the stand elements of the measuring elements (springs) with the excitation frequencies initiated by the operation of the turbine installed for stand testing. As an example, to estimate the eigenfrequencies, Table 2 shows the values of the excitation and response frequencies by which the computational algorithm below was tested (the selected points No. 10–No. 14 are the key points at which the amplitude-frequency values of the oscillations at the turbine power measurement unit were obtained during the experiment).
Table 2.
Studies of the modal frequencies of the measuring base of the stand “spacers” (points No. 10–No. 14 on the stand).
In the framework of this task, a mathematical model and an automated computational algorithm for studying the dynamic behavior of a turbine as a part of a stand during turbine testing were developed, taking into account the frequency interactions of elements and nodes modal vibrations with the turbine’s rotational frequencies when changing its operating modes when working on the stand [24,25].
Based on the analysis of the stand’s elements, a range of initial and boundary conditions was selected for the process of mathematical modeling of dynamic changes in the turbine power during its operation, taking into account the interaction with the stand’s elements [1,26]. Changes in the dynamics of the stand’s structural elements’ behaviors are also taken into consideration. The conditions for the occurrence of increased dynamic loads acting on the stand’s measurement elements are modeled and determined, taking into account the frequency interactions when changing the turbine speed and measuring power under the conditions of wave interactions of the stand’s elements and power measurement unit. Thus, the general task of research is to determine the modal frequencies of the stand, their changes when exposed to a load (power load, temperature) within the range of the measured power, and temperature changes of the gas medium used during the operation of the turbine (compressed air is used on the stand).
In addition, the rotation of the turbine and the power measurement system creates a certain dynamic effect in the stand’s elements and the stand’s measuring system with a certain frequency and amplitude, i.e., a number of frequency harmonics, which lead to the formation of the wave field of the stand when testing the turbine.
The algorithm for determining the eigenfrequencies of the stand’s elements is based on a mathematical model as a system of discrete masses with elastic-dissipative bonds.
A generalization of the design scheme is the introduction of elastic-dissipative bonds between the non-adjacent masses of the chain [27,28]. Figure 2 shows the stand system in the form of discrete masses with elastic-dissipative bonds. The following values are indicated in Figure 2: x1, …, x6—directions of the possible movement (3 directions are considered); R1, …, R6—viscosity forces between bodies; G1, …, G6—inertia forces of bodies; C1, …, C6—body stiffness forces; ζ (t)—exposure time.
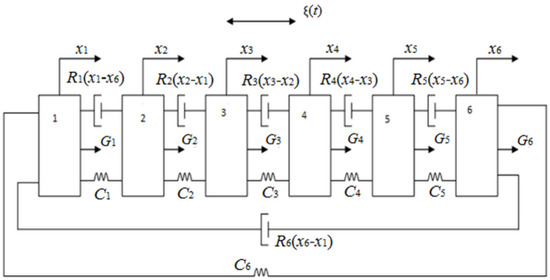
Figure 2.
Stand model in the form of six discrete masses with elastic-dissipative bonds: 1—Turbine; 2—Spacer; 3—Measurement system; 4—Multiplier; 5—Generator; 6—Frame with foundation.
To determine the eigenfrequencies of the oscillations of the stand’s elements with the turbine, as well as the eigenfrequency of the system itself, it is necessary to obtain matrix forms for the following parameters: generalized coordinates of displacements q, inertial forces F0(q) with inertial parameter A, and elastic forces with quasielastic coefficient C, without taking into account dissipative forces (no losses), which will reduce the amount of computation and obtain modal frequencies of structural elements.
The condition of free oscillations of the stand’s elements system is determined from the equality of the kinetic and potential energies. For free oscillations, the kinetic and potential energies of the system are written accordingly:
where T and U are the kinetic and potential vibrational energies in the system; A is the matrix of inertial coefficients; C is the matrix of quasielastic coefficients; q = (ξ, η, ζ, α, β, and γ) is the vector characterizing the movement of the body during oscillations in the directions: ξ and η, which are the indices of longitudinal and torsional vibrations along the axis of rotation of the turbine; ζ, α are the indices of longitudinal and torsional vibrations in the vertical plane to the axis of rotation of the turbine; β, γ, and α are the indices of longitudinal and torsional vibrations in the horizontal plane to the axis of rotation of the turbine.
The differential equation of free oscillations in matrix form will have the form:
The modal (free) frequency f of longitudinal vibrations of any element of the stand, in any direction, as an elastic system is written:
where f = s−1 is the unit compliance corresponding to the quasi-elastic coefficient c; a is the size of the element in the direction of propagation of the elastic wave.
For the stand considered as a system of discrete masses of its elements connected in a series with a common frame with a foundation (shown in Figure 2), the equations of eigenfrequencies will be determined by the following matrix:
where k is the number of the body in the stand scheme (according to Figure 2); n is the number of stand elements.
The general solution of the equation of free (modal) oscillations with the eigenfrequency ωa and the natural form va can be written in the form:
where Ca and Da are the oscillation amplitudes upon expansion in a Fourier series.
The solution to the differential equation of free oscillations is the expression:
where v is a vector (column matrix) that characterizes the relationship between the generalized coordinates, and these are also eigenmodes. χ is the phase angle of the shift between them, while ω and v must satisfy the matrix expression:
q(t) = vsin(ωt + χ),
(C − ω2A)v = 0.
The solution of the differential equation of free vibrations has the form:
where the serial number of matrix elements corresponds to the number of stand elements, according to Figure 2.
To simplify the solution of this complex system of equations, it is necessary to divide it into six subsystems (partial systems). For example, Formula (9) considers only one coordinate of the stand’s wave processes formation and makes it possible to determine the eigenfrequencies of the stand’s elements in a given direction. For this, it is necessary to find the partial frequencies of each element of the system. These frequencies will coincide with the eigenfrequencies of the stand’s elements system at: A12 = A21 = 0; C12 = C21 = 0:
where ωI, ωII, ωIII, ωIV, ωV, and ωVI are the partial frequencies of the components of the stand’s element base, respectively. Using this method, an algorithm was developed to find the eigenfrequencies of the stand’s elements by analyzing the four subsystems and approximating the change in stiffness from the action of the twist torque of the measuring spring. That allows us to relate the obtained results of the vibration level and frequency implementations with the conditions of the dynamic interaction of the element base of the stand with the results of measuring the turbine power when changing the range of its rotations.
The Equations (1)–(8) show an example of a specific implementation of the theory of linear vibrations as applied to a real design of the stand for a one-dimensional model in order to determine the eigenfrequencies of the elements of a coupled system. The whole algorithm for calculating the eigenfrequencies assumes their determination in two more directions, which form their own model of the stand for a specific direction with discrete masses, as in the example, but with different elastic-dissipative bonds. The calculation algorithm is formed based on generalized coordinates of the three-dimensional model of the stand, which requires taking the nonlinear spatial-correlation relationships into account, therefore, a new calculation method.
The conditions for the dynamic interaction of the turbine block with the elements of the measuring system (the spacer where the spring is installed to measure the realized torque of the turbine) were identified. The main emphasis in calculating the eigenfrequencies according to this algorithm was associated with the analysis of their changes when the external load changes. Therefore, the stress changes in the connecting nodes of the stand’s elements, which leads to a change in the stiffness of their joints and the eigenfrequency (modal frequency) of the structure under consideration and partial frequencies.
With an increase in the external load from the turbine, the partial frequencies also change previously linearly with increasing stresses in the connecting elements. In this case, the algorithm for calculating step supply (s−1) will be determined from Hooke’s linear law, connecting strains and stresses through the elastic modulus of the material of the connecting elements, which can significantly simplify the algorithm for calculating the modal frequencies of each of the stand elements, according to Figure 2, for any range of changes in the number of rotations of the turbine, and, consequently, its power.
3. Results
The results of the frequency analysis of the modal characteristics of the stand were verified according to the results of the modal analysis performed on the stand. For example, Figure 3 shows a general view of the multiplier with measuring points; Figure 4 and Figure 5 show the spacer of the stand (element No. 2, according to Figure 2) with measuring points (structural elements for installing the turbine power measurement unit).
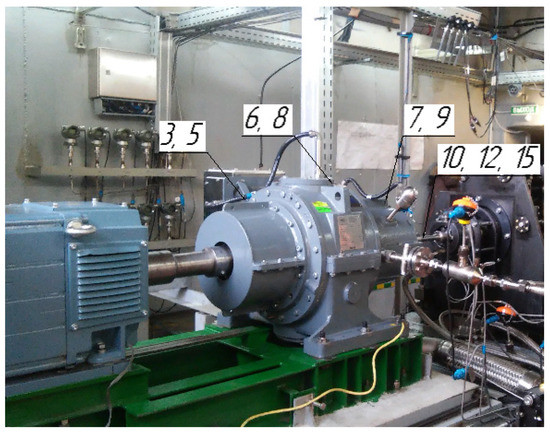
Figure 3.
General view of the multiplier with measurement points.
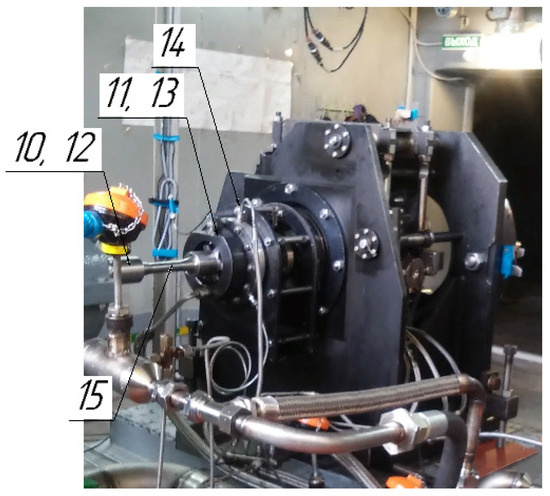
Figure 4.
General view of the spacer with measuring points.
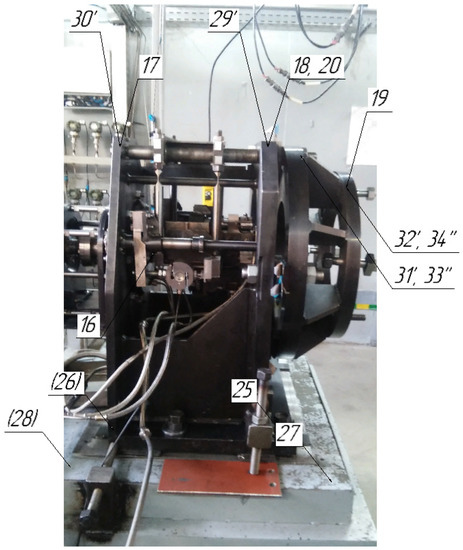
Figure 5.
General view of the spacer with frame.
A comparison of the results of the modal analysis of the unloaded stand conducted on its element base (Figure 2) and fitting the above algorithm to the experimental frequencies made it possible to refine the matrix of quasielastic coefficients C at zero load (unit compliance was determined from the tightening conditions of the mounting bolts of the spacer with the turbine block and unit of the turbine torque measurement system). This made it possible to predict a change in the matrix of quasielastic elements depending on the load realized on the stand’s loading device from the generator through the multiplier, directly on the measuring spring used as a turbine power sensor.
Knowing the range of the percentage change in the spring stiffness coefficient (the eigenfrequencies of the spring grow almost linearly from the value of the applied torque since the stress, and the value of the spring angle of the spring increase linearly because the measuring element operates in the elastic zone of deformation—twisting, and, therefore, its torsional eigenfrequencies, i.e., oscillations, occur in the elastic strain zone), it can be assumed that the eigenfrequencies of the stand’s elements change with the same linear dependence, according to the realized turbine power (Hooke’s linear law).
Then, this algorithm allows us to connect the changing eigenfrequencies of the spring with the harmonic frequencies when the turbine rotates, and its speed and torque are realized by the turbine through the loading device, taking into account measurements of the vibration level on non-rotating stand elements (stator) through the transfer function from the spring to the vibration measurement point on the housing of the stand’s elements.
Consequently, it becomes possible to clarify the actual power of the turbine due to the frequency interaction of the changing modal frequencies of the spring with the rotational frequencies of the turbine, which forms distinctive indications of the power of the turbine during the turbine research with the calculated ones. The magnitude of the discrepancy in the measurement of the torque when determining the power of the turbine will be determined through the coefficient of dynamism in the frequency interaction of eigenfrequencies and forced frequencies (frequencies associated with the number of rotations of the turbine):
where ωk is the spring eigenfrequency; ωh is the reverse (harmonic) frequency of the gas of rotation of the turbine; ξk is the coefficient determining losses in the spring material. In this case, it is necessary to find frequencies close to each other in the frequency domain:
where n and m are integers from 1 to 8 (eighth mode). Sorting frequencies above 8 harmonics does not make sense since the energy of the frequency interaction at high frequencies is insignificant; however, even if the frequency difference is more than 15%, the effect on the error of the frequency interaction also gives a slight error.
4. Analysis of the Results
Figure 6 and Figure 7 show the vibration acceleration spectrum at point 16 (the bearing assembly of the spring of the turbine torque measuring system) at different turbine rotations. An analysis of the results of vibration acceleration makes it possible to evaluate the effect of the inertial force on the oscillatory system, which is realized at the stand’s measurement point, and to track its change when the speed of the turbine changes, and, consequently, its power. In addition to torsional vibrations, bending and longitudinal arises in the spring that certain instantaneous precession values are formed on the bearing of the spacer (measuring unit), which form a vibration field on the fixed part of the spacer in the bearing installation area. Measurement of these vibrations is carried out in three directions. Bending and torsional vibrations create a displacement of the axis of rotation (precession) relative to the geometric axis of rotation of the spring. The spatial addition of eigen vibrations and forced vibrations allows us to build the trajectory of the instantaneous center of the axis of rotation of the spring. The analysis, in this case, can be carried out by comparing one of the three types of occurrence of vibrations of an element (spring) in the bearing assembly.
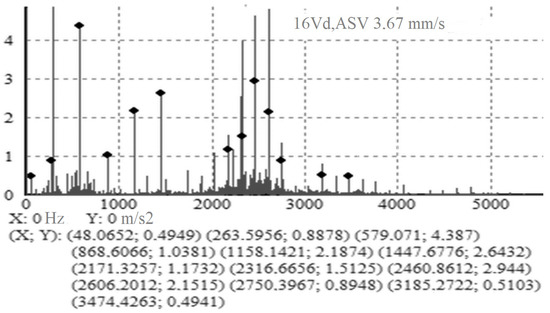
Figure 6.
Vibration accelerations spectrum in the vertical direction on the bearing assembly of the turbine torque measurement system’s spring at a speed of 8500 rpm.
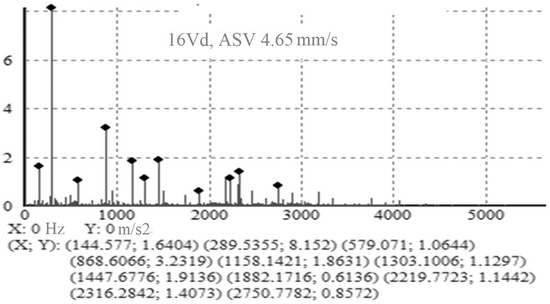
Figure 7.
Vibration accelerations spectrum in the vertical direction on the bearing assembly of the turbine torque measurement system’s spring at a speed of 12,000 rpm.
For example, the eigenfrequency of spring-bending vibrations is 579 Hz, and the harmonic frequency is 141.6 Hz (at turbine speed of 8500 rpm), which is close to the fourth harmonic of the external influence on the spring (4th harmonic is 566.5 Hz). Therefore, taking into account the possibility of frequency interaction between the torsion eigenfrequencies of the spring and the rotating frequencies, the amplitude of the partial frequency at the measuring point (bearing) on the spacer increases to 4.378 μm/s2. The amplitude square value (ASV) is 3.67 mm/s.
Increasing the turbine speed to 12,000 rpm (Figure 7), which corresponds to a frequency of dynamic action of 200 Hz, the conditions for the frequency interaction of spring vibrations change. It leads to a decrease in the amplitude of vibration acceleration on the spacer bearing at a frequency that is a multiple of the eigenfrequency of the spring bending vibrations up to 1.054 μm/s2. If the amplitude of oscillations in vibration velocity at a frequency of 141.6 Hz at rotations of 8500 rpm was 0.163 mm/s. With an increase in the number of rotations to 12,000 rpm, causing an increase in turbine power at a frequency of 200 Hz, the amplitude in vibration velocity increased to 0.323 mm/s. The ASV is 4.65 mm/s.
Consequently, the energy of oscillatory processes in the stand has grown, but the frequency palette of its wave field has changed. This confirms the wave restructuring of the oscillatory processes of the stand’s elements, i.e., the amplitude-frequency characteristics change in the process of changing the turbine operation parameters (visual proof when comparing the vibration acceleration spectra shown in Figure 6 and Figure 7). Such changes in the frequency-amplitude field of the stand are characteristic for all directions of vibration measurement (measurement was carried out in the horizontal and vertical planes and the axial direction). Simultaneous processing of the vibration signal in three directions in time allows us to get the trajectory of the precession of the axis of rotation of the spring when measuring the torque and power of the turbine when changing its speed. Therefore, by analyzing one of the components of the vibration field, it is possible to qualitatively assess the change in other parameters of the manifestation of vibrations, including the change in torsional vibrations of the spring, which form the torque measurement at this moment in time.
A comparison of the frequency spectra when the turbine rotational speed changes on the spacer’s bearing units shows that the stand’s structural elements change the energy of the spacer vibrations quite significantly; therefore, the dynamic interaction between the measuring system of the stand and the spring vibrations, which can significantly affect the accuracy of measuring the turbine power, not only during transients but also in the steady-state during the formation of a new level of self-oscillation mode of the turbine’s torsional vibrations and changing the spring’s modal vibrations.
If the discrepancy between the results of measuring the turbine power at 8500 rpm was 18%, then taking into account the frequency interaction according to Formula (10) for this mode, it is 4.3%, respectively. The discrepancy between the measured turbine power at 12,000 rpm and its calculated value is 15% for these speeds, respectively, and taking into account the conversion of 5.6%. Thus, the influence of frequency interaction as applied to a particular stand design allows one to take into account its influence on the results of the actual value of the measured turbine power.
When using the algorithm for calculating the eigenvibrations of an element of this stand with a change in the mass-rigid characteristics of its elements (in particular, changes in the design of the measuring unit (spacers) cause an increase in the mass of the bearing units by 10%), the calculated value of the measured torque, taking into account the influence of frequency interaction, decreased to 3%.
The results of evaluating the frequency indicators of the installation elements based on the measurement data at the corresponding points are shown in Figure 8, Figure 9, Figure 10 and Figure 11.
Figure 8.
Change in the forced frequency on the electric motor, depending on the frequency of rotation of the turbine (measuring point No. 1).
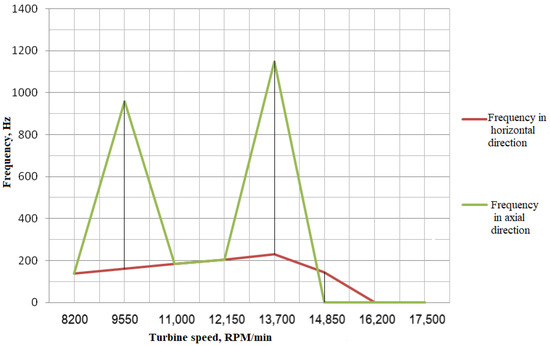
Figure 9.
Change in the forced frequency on the spacer depending on the speed of the turbine (measuring points No. 11 and No. 13).
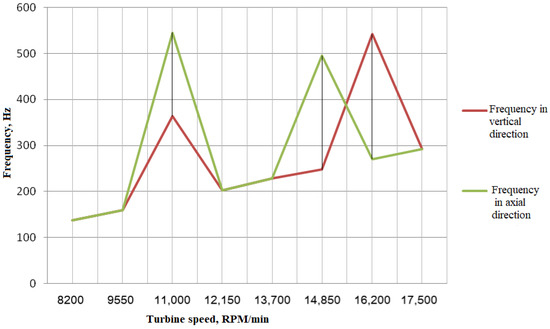
Figure 10.
Change in the forced frequency on the spacer depending on the speed of the turbine (measuring point No. 17).
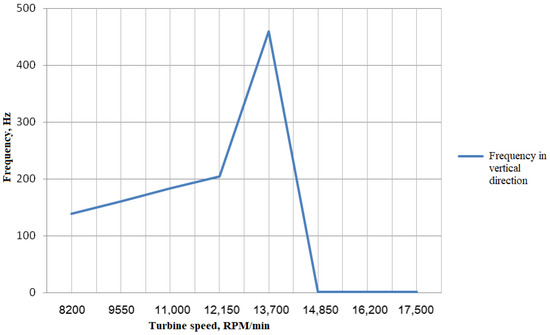
Figure 11.
Change in the forced frequency on the spacer frame depending on the speed of the turbine (measuring point No. 28).
An analysis of the data in Figure 8 shows that the axial component in frequency increases with the increasing speed of the turbine. Significant damping by the stand system is observed in the range of shell frequencies from 14,000 to 16,000 rpm.
At a frequency of 8000 to 11,000 rpm, the frame structure does not provide a rigid fixation of the multiplier. A significant increase in frequency at rotations of 12,000 to 15,000 rpm is associated with the conditions for the dynamic interaction of the coupling joints of the multiplier with the spacer measuring element (shaft eigenfrequencies lie in the range of rotating frequencies).
On the spacer at measuring points No. 11, No. 13, and No. 17, the same dynamic character of the shaft with the measuring system is noted (Figure 9 and Figure 10).
The spacer frame in the vertical direction slightly reduces the level of vibration. At 13,700 rpm, the measurement cuts off due to the high level of vibration at the measurement point (Figure 11).
5. Discussion
The conducted frequency analysis, taking into account the change in the eigenfrequencies of the structural elements of the stand, evaluates the actual value when measuring the power of the tested turbine in a certain range of working frequencies. Additionally, the analysis evaluates the structure of the dynamic interaction of the stand’s elements and, having determined the possible frequency ranges of the interaction of eigenfrequencies and working frequencies with the help of certain upgrades, significantly reduces the discrepancy between the measured power and the actual (calculated) one; thereby, solving the problem of controlling the operation of the turbine as part of a power plant. In addition, the frequency analysis allows us to solve the problem of increasing the reliability and increasing the resource of using stand equipment.
6. Conclusions
A mathematical apparatus based on point masses has been developed for a stand to verify the operability of turbines of various powers in power plants. Using the procedure for studying the modal characteristics of stand equipment, we obtained the correct quasielastic coefficients for calculating the eigenfrequencies of the nodes and stand’s elements and determined their variation in the load value acting on the structure when testing the turbine in various modes without taking into account the influence of temperature changes during testing.
The conditions for amplifying the amplitude of oscillations at eigenfrequencies are obtained, and the value of the possible discrepancy between the measured power results and the calculated (expected) results when measuring power for specific modes (cycles) of turbine operation is calculated. It is shown that taking into account the frequency interaction between the eigenfrequencies and rotating frequencies of the power measurement elements reduces the difference in the power measurement from 15% in the entire range of the studied turbine rotations to an acceptable maximum value of 3%.
The developed mathematical algorithm makes it possible to assess the dynamic state of the stand at different turbine research modes and give recommendations for reducing the level of frequency interaction; therefore, reducing dynamic loads on the stand base, increasing the reliability of the stand and, as a result, increasing the duration of its use without attracting additional material costs.
Author Contributions
Conceptualization, A.P. and A.S.; methodology, A.S.; software, A.S.; validation, S.B. and P.I.; formal analysis, A.P., S.B. and A.S.; writing—original draft preparation, A.P.; writing—review and editing, A.P. and A.S.; visualization, S.B.; supervision, A.P. and A.S. All authors have read and agreed to the published version of the manuscript.
Funding
This research was carried out with financial support from the Russian Ministry of Education and Science in the framework of scientific projects carried out by teams of research centers and scientific laboratories of educational institutions of higher education, subordinate to the Ministry of Education and Science of Russia (project 8.4157.2017/4.6/3305 “Development, design and manufacture of a prototype universal stand for model tests of a turbine of promising engines”). This research also was carried out with the financial support of the Ministry of Science and Higher Education of the Russian Federation in the framework of the program of activities of the Perm Scientific and Educational Center “Rational Subsoil Use.”
Institutional Review Board Statement
Not applicable.
Informed Consent Statement
Not applicable.
Conflicts of Interest
The authors declare no conflict of interest.
References
- Tarasov, V.A.; Petrochenkov, A.B.; Kavalerov, B.V. A computer-aided facility foreigen testing gas-turbine power stations. Russ. Electr. Eng. 2017, 88, 750–754. [Google Scholar] [CrossRef]
- Cheng, Z.; Steven, Y.L.; Jing, Q. Bearing Failure Prognostic Model Based on Damage Mechanics and Vibration Monitoring. Tribol. Trans. 2001, 44, 603–608. [Google Scholar]
- Zheng, L.-A.; Chen, S.-H.; Chou, J.-H. Robust Frequency-Shaping Optimal Active Vibration Control of Uncertain Flexible Mechanical Systems with Persistent Excitation. Chin. J. Mech. 2002, 18, 163–171. [Google Scholar] [CrossRef]
- Byoung-Hoo, R.; Kyung-Woong, A.K. Study on Nonlinear Frequency Response Analysis of Hydrodynamic Journal Bearings with External Disturbances. Tribol. Trans. 2002, 45, 117–121. [Google Scholar]
- Santiago, O.D.; Andrés, L.S. Experimental Identification of Bearing Dynamic Force Coefficients in a Flexible Rotor—Further Developments. Tribol. Trans. 2007, 50, 114–126. [Google Scholar] [CrossRef]
- Kirk, R.G.; Alsaeed, A.; Liptrap, J.; Lindsey, C.; Sutherland, D.; Dillon, B.; Saunders, E.; Chappell, M.; Nawshin, S.; Christian, E.; et al. Experimental Test Results for Vibration of a High Speed Diesel Engine Turbocharger. Tribol. Trans. 2008, 51, 422–427. [Google Scholar] [CrossRef]
- Moon, F.C. Reflections on Nonlinear Dynamics of Machines and Structures. J. Mech. 2000, 16, 79–83. [Google Scholar] [CrossRef]
- Lee, Y.-B.; Kwak, Y.-S.; Chung, J.T.; Sim, K. Microturbocharger with Air Foil Bearings for a 100-W Class Micro Power System and Improvement of Rotordynamic Performance. Tribol. Trans. 2011, 54, 939–948. [Google Scholar] [CrossRef]
- Kim, D.; Varrey, M.K. Imbalance Response and Stability Characteristics of a Rotor Supported by Hybrid Air Foil Bearings. Tribol. Trans. 2012, 55, 529–538. [Google Scholar] [CrossRef]
- Petrochenkov, A.B.; Bochkarev, S.V.; Romodin, A.V.; Eltyshev, D.K. The Planning Operation Process of Electrotechnical Equipment Using the Markov Process. Russ. Electr. Eng. 2011, 82, 592–595. [Google Scholar] [CrossRef]
- Anuchin, A.; Podzorova, V.; Hirz, M.; Datlinger, C.; Aarniovuori, L.; Popova, V.; Demidova, G.; Hao, C. Model predictive control with reduced integration step size of a switched reluctance drive. In Proceedings of the 2020 11th International Conference on Electrical Power Drive Systems, ICEPDS 2020, Saint Petersburg, Russia, 4 October 2020; p. 9249077. [Google Scholar] [CrossRef]
- Vattulainen, J.; Nummela, V.; Hernberg, R.; Kytl, J. A system for quantitative imaging diagnostics and its application to pyrometric in-cylinder flame-temperature measurements in large diesel engines. Meas. Sci. Technol. 2000, 11, 103–119. [Google Scholar] [CrossRef]
- Paimushin, V.N.; Firsov, V.A.; Shishkin, V.M. Complex eigenfrequencies and damping properties of an elongated plate with an integral damping coating. J. Appl. Mech. Tech. Phys. 2020, 61, 599–610. [Google Scholar] [CrossRef]
- Petrochenkov, A.B.; Bochkarev, S.V.; Ovsyannikov, M.V.; Bukhanov, S.A. Construction of an ontological model of the life cycle of electrotechnical equipment. Russ. Electr. Eng. 2015, 86, 320–325. [Google Scholar] [CrossRef]
- Kordjazi, A.; Coe, J.T.; Afanasiev, M. Nondestructive Evaluation of Drilled Shaft Construction Anomalies Using Full Waveform Tomography of Simulated Crosshole Measurements. J. Nondestruct. Evaluation 2021, 40, 1–13. [Google Scholar] [CrossRef]
- Markelov, M.K.; Churikov, P.P. Ustrojstvo s vihretokovym preobrazovatelem dlya kontrolya parametrov vibracii. Izmer. Tekhnika 2013, 12, 40–43. (In Russian) [Google Scholar]
- Yoshioka, T.; Shimizu, S. Monitoring of Ball Bearing Operation under Grease Lubrication Using a New Compound Diagnostic System Detecting Vibration and Acoustic Emission. Tribol. Trans. 2009, 52, 725–730. [Google Scholar] [CrossRef]
- Khalyutkin, V.A.; Alekseenko, V.A.; Ulyanov, A.P.; Krasov, P.S. Device for Measurement of Torque, Shaft Speed and Power on Shaft. Patent Russian Federation No. 2585482, 20 March 2015. [Google Scholar]
- He, J.; Fu, Z.-F. Modal Analysis; Butterworth-Heinemann: Oxford, UK, 2001; p. 291. [Google Scholar]
- Coolen, F.P.A.; Utkin, L.V. Imprecise reliability: A concise overview. In Proceedings of the European Safety and Reliability Conference 2007, ESREL 2007 Risk, Reliability and Societal Safety, Stavanger, Norway, 25 June 2007; pp. 1959–1966. [Google Scholar]
- Crystal Instruments. Basics of Structural Vibration Testing and Analysis; Crystal Instruments: Santa Clara, CA, USA, 2016; Available online: https://www.crystalinstruments.com/basics-of-structural-vibration-testing-and-analysis (accessed on 31 March 2021).
- Vibration Analyzer Kamerton. Available online: http://ros-diagnostics.ru/component/content/article/85.html (accessed on 31 March 2021).
- ISO 8042:1988. Shock and Vibration Measurements—Characteristics to be Specified for Seismic Pick-Ups; International Organization for Standardization (ISO): Geneva, Switzerland, 1988. [Google Scholar]
- Petrova, E.N.; Salnikov, A.F. Gas-dynamic modeling of gas flow in semi-closed space including channel surface fluctuation. AIP Conf. Proc. 2016, 1770, 30071. [Google Scholar]
- Bochkarev, S.V.; Ovsyannikov, M.V.; Petrochenkov, A.B.; Bukhanov, S.A. Structural synthesis of complex electrotechnical equipment on the basis of the constraint satisfaction method. Russ. Electr. Eng. 2015, 86, 362–366. [Google Scholar] [CrossRef]
- Permyakov, K.V.; Sal’nikov, A.F. Exhaust-line performance in a gas-pumping system. Russ. Eng. Res. 2014, 34, 557–559. [Google Scholar] [CrossRef]
- Mormul, R.V.; Pavlov, D.A.; Sal’nikov, A.F. Vibration-Based Diagnostics and Structural Analysis of Research on Nonlinear Dynamic Processes in Maglev-Suspension Rotor Turbomachines. Russ. J. Nondestruct. Test. 2018, 54, 487–494. [Google Scholar] [CrossRef]
- Sal’nikov, A.F. Diagnostika tekhnicheskogo sostoyaniya krupnogabaritnyh detalej gazoturbinnyh dvigatelej po modal’nym harakteristikam. Vestn. Permsk. Nation. Issledovatel’skogo Politekh. Universiteta. Aerokosmicheskaya Tekhnika 2018, 55, 61–69. (In Russian) [Google Scholar]
Publisher’s Note: MDPI stays neutral with regard to jurisdictional claims in published maps and institutional affiliations. |
© 2021 by the authors. Licensee MDPI, Basel, Switzerland. This article is an open access article distributed under the terms and conditions of the Creative Commons Attribution (CC BY) license (https://creativecommons.org/licenses/by/4.0/).