Abstract
Construction quality is one of the primary management objectives relating to duration and cost for construction projects. Project managers struggle with minimizing duration and cost while maximizing quality for construction projects. In construction projects, duration and cost have management priorities. On the other hand, quality is considered a matter of achievement only when it reaches a certain level. Although the importance of quality control in construction management has been constantly discussed, it has still been sacrificed under the goal of shortening construction duration and reducing costs. This study presents a method for estimating the quantitative quality performance of construction operations in which the level of detail is breaking into the work task level for intuitive quality performance evaluation. For this purpose, quality weights of resources that have a proportional quality importance weight and quality performance indexes of resources are utilized for estimating the quantitative quality performance of construction operations. Quality performance estimation and the resource allocation optimization system is presented and validated using a construction simulation model.
1. Introduction
In the construction industry, quality is one of the most significant management targets with duration and cost in delivering projects, determining the success or failure of a project [1]. Therefore, most construction projects demand a plan to meet the appropriate schedule, budget, and quality targets. Duration and cost are always carefully considered factors, while quality is treated as a factor requiring only approval in construction projects [2,3]. Since the attainment of acceptable levels of quality for construction projects has not been defined, there is no efficient and formal quality control procedure [4]. In terms of construction management, shortening duration or reducing costs is considered a successful management case, but the quality is managed by satisfying only a certain level of performance. This quality control behavior is undermining project managers’ efforts to improve quality performance. Although the importance of quality control in construction management is constantly being discussed, it is still being sacrificed under the goal of shortening durations and reducing costs [5]. However, construction quality management should apply the same techniques to manage project duration and cost.
This study aims to (1) explore the current researches and methods of measuring and quantifying quality performance indicators in construction projects, (2) present a method that allocates the quantitative quality performance scores of resources to the operation simulation modeling using discrete event simulation (DES), and (3) develop a decision-making support system to estimate and search optimal alternatives considering duration, cost, and quality performance of construction operations simultaneously.
2. Status of Quality Estimation and Simulation Methods in Construction Management
2.1. Quality Performance Management, Measurement, and Quantification
Technologies used in the manufacturing industry (e.g., total quality management, lean construction, just-in-time production, re-engineering, etc.) have been applied to the construction arena. In the construction industry, however, there is no standardized content for quality management, and it is difficult to apply to construction projects because various participants are involved in a single project [6]. In order to apply the quality management used in the manufacturing industry to the construction industry, the principles and application methods of quality management must be modified and applied to the construction industry [7].
The Construction Industry Institute proposed the general concept of the process for determining factors to be used in a construction project quality performance measurement system [8]. The overall quality performance measurement system has been developed starting from the initial quality quantification. Details on the application procedure and major quality metrics (Customer focus, Leadership, Delivery, Employee Empowerment, etc.) of this quality performance system are presented in detail in [9]. General quality performance measurement is performed according to the below process.
- Setting business objectives defined by the owner;
- Forming a business management team representing individual organizations at major stages of the project;
- Creating a model for each project stage required for quality performance measurement;
- Translating the business objectives into specific project goals;
- 4.1.
- Analyzing the key factors influencing goals.
- 4.2.
- Deciding which factors must be measured;
- 4.3.
- Determining major input/outputs/customer-supplier relationships for each project phase;
- 4.4.
- Deciding when and how to measure;
- Selecting critical measurement metrics with key elements that influence the project objectives and defining targets or criteria for all measurement areas;
- Creating the project management team (PMT), communicating all the information generated, breaking down the objectives and developing measurements, and identifying responsibility and frequency of measurement;
- Creating the technical and craft teams to perform the same process.
On the other hand, Anderson and Russell [10] proposed a method (called quality variable technique) to quantify and evaluate the quality performance of highways in the following procedure:
- Select End Product;
- Determine Measurable Indicators of Quality Performance;
- Determine the Best Measurement Method of Each Indicator;
- Select the Best Indicator of Quality for the End Product.
The quality variable technique helps contractors to improve construction quality in future projects. A variety of end products are used in construction projects. These end products can be various such as hot-mix asphalt concrete pavement, Portland cement concrete pavement, pavement marking, bridge painting, etc. In order to measure the quality of these finished products, methods such as laboratory testing, visual inspection, or on-site measurements may be used (refer to Table 1). Estimating and quantifying a particular resource combination’s quality performance at the construction process or activity level is a more difficult process than estimating the duration and cost of the activity. It is not easy to measure and quantify the impact on quality performance by various resource combination alternatives in construction activities [11,12,13,14]. For example, in certain construction activities, it is a more challenging task to estimate the quality performance of the resources than to estimate the cost and the expected productivity [11].

Table 1.
Construction quality performance measurement indicators.
In order to estimate the quality of construction activities, a measurable quality performance indicator must be considered for individual activity within the project. These quality performance indicators are obtained from a performance-based model (refer to Table 1). In addition, the quality performance of a certain construction activity can be estimated by linking the quality performance of the construction activities generated by the quality performance index of individual sub-activities [11]. For example, Table 2 shows an example of quality performance estimation from sub-activities (i.e., Sub-Activity A-1, 2, and 3) to a certain construction activity (i.e., Activity A) with a simple sum.
Table 2.
Quantification of quality performance of construction project activities.
Hu and He [15] proposed a method of quantifying the quality performance of individual construction processes or activities using a work classification system, and measuring the overall quality performance of a construction project. The factors that determine the quality of construction are categorized into construction equipment, labor, material, and administration.
In the construction industry, quality can be classified from various perspectives according to the life cycle phase, and there are differences in management targets and methods. Zavadskas et al. [16] proposes a construction quality performance management plan classified into three stages as follows:
- Strategic-A plan to manage construction quality at the level of a specific construction sector as a whole (e.g., road sector, etc.)
- Tactical-A plan to manage construction quality by distributing quality management and planned resources among various organizations at the level of projects.
- Operative-A plan to manage the construction quality of the production process at the level of the construction task, process, operation, or activity.
This study seeks to find a way to measure quantitative construction quality performance indicators based on input resources at the construction operation level, the “Operative” stage among the construction quality control stages.
2.2. Construction Process Simulation
Since Halpin [17] introduced Micro CYCLONE, which was specialized in the construction field, DES has been regarded as a scientific tool that effectively analyzes the construction process during the project planning stage, supporting establishing an efficient process plan. The DES has been utilized to schedule management [18], demolition cost estimation [19], safety management [20], high-rise apartment building construction [21], contractor selection [22], environmental impact analysis [23,24], etc. and is recognized for its applicability to uncertainty in the real world. These DES systems in the construction field have been applied to analyze numerous construction processes and performances such as earthmoving [23,24], floating caissons [25], steel fabrication [26], bridge re-decking [27], pile installation [28], road construction [29], and crane selection [30]) and have proven their applicability and effectiveness (refer to Table 3).
Table 3.
Application cases and analyzed performance criteria.
The DES is recognized as a tool that effectively reflects the uncertainty of the real world. In addition, since quality performance is greatly influenced by the management structure of the organization and complex quality management processes must include the construction process model [31]. Therefore, it is necessary to analyze the factors that affect the quality performance of the construction process in the Project Quality Management (PQM) and apply it to the process model to evaluate the quality performance [32]. However, while DES is a quantitative data-centered analysis technology, quality performance is a qualitative element-centered evaluation method, so qualitative quality performance quantification is essential to the construction simulation model.
2.3. Research Scope
Preceding studies have emphasized the importance of quantification, measurement, and detailed analysis of construction quality. However, these existing studies do not provide a method for quantitative estimation of construction quality at a detailed level. To overcome these limitations, the Discrete Event Simulation technique-based method is presented to quantitatively estimate the construction quality, which enables us to model and analyze construction process simulation models at a detailed level. This study focuses on applying and calculating the numerical value in the simulation model after the quality performance indicators (i.e., quality weight and score) of each resource are derived. Data collection and analysis methods (e.g., big data, deep learning, artificial intelligence, etc.) to derive the quantitative performance indicators of diverse construction resources can be further applied. The methodology was developed to support finding an optimal resource deployment plan by analyzing the impact on the quality performance according to the type of resources deployed to the construction simulation models. By executing sensitivity analysis in the system, construction practitioners can efficiently search for optimal resource combinations considering site constraints and priorities for efficient decision-making. The construction operation’s quality performance is estimated by utilizing quality indexes and quality weights assigned to the individual resource (e.g., materials, equipment, laborers, etc.) in the simulation model. The system presents a sensitivity analysis to compare different performance indicators according to various resource combinations during the construction simulation experiments considering duration, cost, and quality performance.
3. Quantitative Quality Performance Estimation System
3.1. System Components
This system provides a method of searching for a resource combination that maximizes the quality performance while minimizing the duration and cost of the construction operation based on the quality performance factors such as resource type, model, or years of experience, and the cost information of resources. The system consists of (1) a datasheet that contains information on the attributes of resources (refer to Table 4), (2) a modeling module that enables system users to build a simulation model in a computer graphic environment, and (3) a sensitivity analysis module that helps to search for an optimal resource combination by calculating quantitative operation performances (i.e., quality, cost, and duration) of each resource combination.
Table 4.
Resource attribute.
3.2. Resource Attribute and Data Collection
Table 4 shows the attribute values of the resources inputted to the Continuous Flight Auger (CFA) pile installation simulation model used in the case study. Among them, the hourly cost of the equipment was referred to in the data presented in the performance handbook provided by Caterpillar [33]. For information on the cost of labor (pile and rebar) and materials (rebar and ready-mixed concrete) were collected by interviewing experts. The quality performance weight and score according to the resources were also collected via interviews using a data form. Interviews were conducted for three days with eight experts with 10 to 20 years of experience in the pile installation operation using a data form. Interviews were conducted with the data forms following the authors’ guidelines to fill the quality weight for involved seven resources (i.e., crawler crane, lifting and cleaning excavator, rebar and pile crew, ready mixed concrete, and rebar for cage) and quality score for nineteen alternatives for each resource in the pile installation operation. Seven categories and nineteen alternatives of resources were informed to the interviewees to quantify the quality weight and score within the restrictions. The quality weight and scores are the average values suggested by eight experts.
3.3. System Process
The method developed in this study helps to identify an optimal combination of resource types to ensure the maximum quality performance of the construction operation while minimizing the duration and cost of the simulation model. The method was implemented as an automated system. The system imports information from the DES model and datasheet, stores information related to the quality and cost of resources, and time of work tasks (task time function, TTF). The system process will be described in detail in the order shown in Figure 1. To build a construction simulation model, (1) knowledge of the technology or construction method related to the construction operation; (2) knowledge of the procedure for breaking down a specific production process into a detailed work task level; (3) information to identify the resources required for the operation; and (4) the ability to define work tasks performed by the resources is required [34]. In order to build a computer simulation model of the analyzed construction operation, the user identifies the types of resources to be input, identifies the work tasks, and uses simulation modeling components (e.g., Combi, Normal, Queue, Counter, Arc, etc.) in a computer graphic environment. Details on the construction simulation modeling and analysis using DES are presented in various literature (e.g., [18,34,35]).
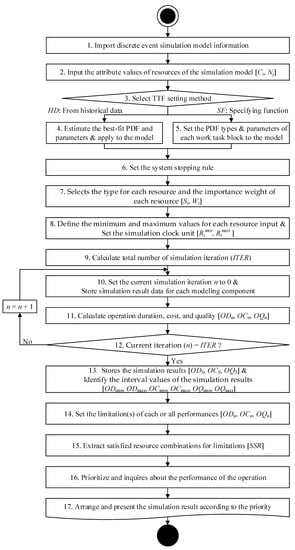
Figure 1.
System process.
Step 1: As shown in Figure 1, the system calls the simulation model of the DES module and stores operation information (i.e., component ID, component name, the relationship among components, etc.) in the system memory.
Step 2: The user defines the input values of the resources to the simulation model, the category of the resource i (Ci), and the number of resources (Ni). The resource category is referred to when setting the available type for each resource to be presented later in the graphic user interface. The input resources are defined in the Queue component as one category among equipment, labor, or materials (e.g., crawler crane, rebar-crew, ready-mixed concrete, etc.) The system presents the resource types according to the defined category and the user can select the type of resources in the graphic user interface.
Step 3: The user selects a TTF input method to be applied in the system. Suppose the historical data on the work task time is sufficient; select HD (historical data). If the user wants to input the TTF directly, selects the SF (specifying function) and input a probability distribution function type and parameters for each work task.
Step 4: The system estimates the best-fit probability distribution function (PDF) and parameters of the TTF for each work task block using historical data and automatically applies them in the system. Details on the estimation of the optimal probability distribution of the TTF using historical data are presented in Lee et al. [18]
Step 5: When the TTF setting of the unit tasks is selected as SF, the user sets the TTF and parameters of each work task block to the simulation model. By the type and parameter of the defined probability distribution function, a random number is generated by the system when the simulation is executed and is set as the time value of the work task blocks.
Step 6: The user sets the stopping rule of the simulation model. A typical stop condition of the DES system is set to a specific simulation time (elapsed simulation time) or set as the number of times a specific resource (entity: flow unit) passes the counter component.
Step 7: When the variable setting of the simulation model components is completed, the system presents the information stored in the datasheet to the user according to the category of resources. When the user selects the type (Si) for each resource and the importance weight of each resource (Wi) that affects the quality performance in the construction operation, the system applies input variables to the simulation model.
Step 8: The user defines the minimum (Rimin) and maximum (Rimax) values for each resource input. The simulation clock unit is set to match the simulation time unit with the resource information stored in the datasheet. The simulation time unit can be set in seconds, minutes, and hours.
Step 9: The system calculates the total number of simulations (ITER) by the number (SNi) of available types (Si) for each resource (i) specified in step 7, the range value for each resource (Rimin and Rimax) set in step 8 using Equation (1). For example, if there are two resources in the simulation model, the possible range of each resource is 1 to 6 and 3 to 20, and the number of available models is 3 and 2, respectively, the system calculates a total simulation iteration (ITER) of 648. The simulation experiment of [(6 × 3) × ((20 − 3 + 1) × 2)] is executed in the sensitivity analysis module.
Step 10: The system sets the current simulation iteration n to 0 and initializes the input resources with the designated resource combinations (number and type of resources) changing for each simulation experiment. After a simulation experiment is finished, the system stores the simulation result data generated from each component. Data, fluctuated by resource flow according to the waiting or work time in each simulation run, is stored in vector format for each modeling component.
Step 11: Using the data stored in Step 10, the system calculates the performance of each resource combination (i.e., operation duration, operation cost, and operation quality) is calculated.
- Operation duration (ODn) at simulation iteration n is the same as the system time ended according to the termination rule set in step 6.
- Operation cost (OCn) at simulation iteration n is calculated by Equation (2) using the hourly cost (HCin), input quantity (SNin), operation duration (ODn) of individual resources (i) at each simulation iteration n for cyclic resources (i.e., equipment and crew) and input quantity (MNj), unit quantity per one entity (UQj), and unit cost (UCj) for noncyclic resources (i.e., material). The input quantity of cyclic resource (SNi) and noncyclic resource (MNj) is the same number of initialized entity in the simulation system.
- Operation quality (OQn) at simulation iteration n is calculated by Equation (3) using the quality weight value (Wi) of the individual resource i set in step 7, the quality performance index of the resource i at the nth simulation (Qin: called from the data sheet).
Step 12: The system determines whether the current iteration number of simulation n has reached the total number of simulation experiment using Equation (4). If it is true, the system proceeds to step 13; otherwise, the system repeats steps 10 and 11.
n = ITER?
Step 13: When the sensitivity analysis is completed, the system stores the simulation results (ODS, OCS, and OQS) to the matrix, SR (Simulation Result) for each resource combination. The system identifies the interval values of the simulation results for all resource combinations (ODmin, OCmin, OQmin, ODmax, OCmax, and OQmax).
Step 14: After executing the sensitivity analysis, the user can set it by specifying the limitation(s) of each or all performances (ODu, OCu, OQu). The system searches only resource combinations that satisfy the specified limitations among the simulation result matrix (SRS) stored in step 15.
Step 15: Among the whole simulation results, only resource combinations that satisfy the constraints (SSR: satisfied simulation result) are extracted using Equation (6).
Step 16: The user prioritizes and inquires about the construction operation’s performance (duration, cost, or quality).
Step 17: The system arranges and presents the simulation result (SSR) extracted according to the selected performance in step 16 in ascending order (if the selected performance is duration or cost) or descending order (if the selected performance is quality).
4. Test Case
4.1. Simulation Modeling for Continuous Flight Auger
The Continuous Flight Auger (CFA) method is also known as the Auger Cast-In-Place (ACIP) pile [28]. The CFA pile excavates using the auger into the ground. Afterwards, the auger is gradually removed, and concrete is injected into the excavated hole through the auger [36]. While the auger is removed, the dirt adhered to the auger passes through the auger-cleaner. A detailed description of the CFA pile installation process is presented in various documents (e.g., [37,38,39]). In order to build a CFA pile installation simulation model, it is necessary to analyze and define the process sequence at a detailed level. In this study, the CFA pile installation process model proposed by Zayed [28] was modified (refer to Figure 2). A step-by-step sequence of a general CFA pile installation process (i.e., from axis adjustment to finishing pile work tasks) was modeled. The CFA pile installation process can be defined as the following steps [28].
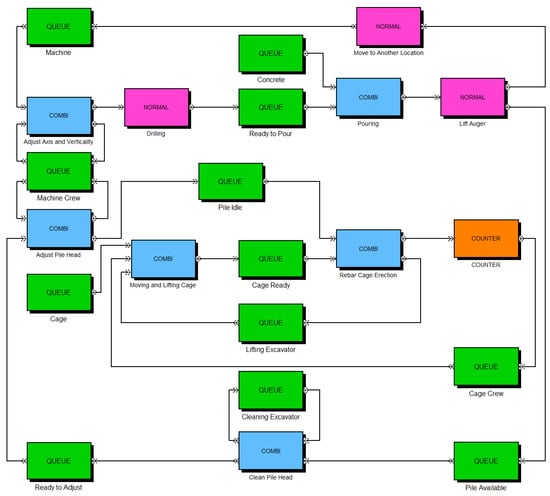
Figure 2.
CFA pile installation simulation model.
- Place the CFA machine (crawler crane) in the center of the pile to be installed, and adjust the verticality of the auger;
- Excavate with an auger to the designed pile depth;
- Remove the auger while pouring concrete or cement grout;
- Clean while removing the auger from the hole;
- Remove the attached dirt;
- When grout or concrete injection is completed, the excavation equipment moves to the next pile location;
- Transport the rebar cage to the pile installation location;
- Lift the wire mesh using equipment available in the field;
- Install the wire mesh and clean up the completed piles;
A simulation model was built by the procedure presented above. Figure 2 is the CFA pile installation simulation model built in this study. This modeling and simulation graphic environment was developed using the SimEvent Version 3.0 and Matlab 2009(b).
4.2. System Input
In this study, the data collected by Zayed [28] was reused for the input time of each task block (i.e., Combi or Normal). The input times of task blocks (TTFs) were set for nine piles with 0.41 m (16 in) of diameter and 18.29 m (60 ft.) of depth. The TTFs were defined as triangular probability distribution functions with minimum, maximum, and mode values. A process is a sequence of interrelated events separated by time intervals that describes the entire experience of an entity as it flows through a system [35]. The number of entity in Table 4 is the number of resources deployed to the operation. The TTF and parameters assigned to the individual task blocks are presented in Table 5. In the CFA pile installation process, the crawler crane and excavation equipment are the most critical resources. Since the pile installation process has a linear characteristic, more than one piece of equipment cannot be put in the same place [28]. Therefore, even if the number of equipment is increased, it does not significantly contribute to productivity improvement. Besides, the waiting problem of other resources could have occurred by increasing or decreasing the amount of equipment. In this situation, the sensitivity analysis that adjusts the input quantity of resources incurs only additional costs without increasing productivity [28]. Therefore, the number of equipment inputs was fixed, and the sensitivity analysis was performed, altering the types of equipment in this case study (refer to Table 4).
Table 5.
Task time function for work tasks.
4.3. Simulation Results
Figure 3 is a graphic user interface that allows users to select the types of resources that can be input by calling the information stored in the datasheet. Among the various types of alternatives stored in each resource category, the sensitivity analysis module was performed by selecting the resources presented above in this study (refer to Table 4).
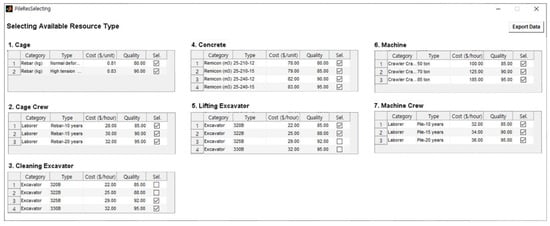
Figure 3.
Graphic user interface for choosing available types of resources.
Total simulation iterations for the sensitivity analysis were 864 (= 3 × 2 × 2 × 3 × 3 × 4 × 2). The system executes the simulation experiment using the variables, calculates operation performances (i.e., duration, cost, quality, and productivity) of the CFA pile installation process. As shown in Figure 4, 864 results of the sensitivity analysis were presented. The simulation results of the resource type combination were identified as the time interval value [214.17:244.77] minutes, the cost interval value $[4944.72:5550.23], and the quality interval value [83.20:93.05]%.
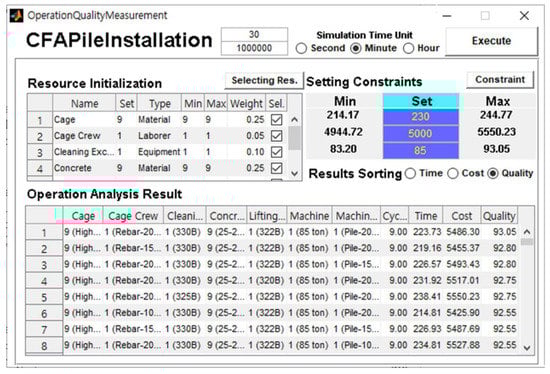
Figure 4.
Graphic user interface for sensitivity analysis and simulation results.
In this study, the sensitivity analysis simulation of various combinations of resource types was performed, and the methodology to achieve high quality within a limited duration and cost of the CFA pile installation process was presented. This supports the establishment of an operation plan that guarantees the maximum quality within the budget and schedule requested by the field managers. For example, when the limitation of duration (230 min), cost ($5000), and quality (85%) were set as the on-site constraint, only 7 sets of the resource combination among 864 results were satisfied. Among the simulation results, the resource combination with the maximum quality and minimum duration performance was identified as [Machine: 50ton, Lifting Excavator: 320B, Cleaning Excavator: 330B, Machine Crew: Pile-10years, Cage Crew: Rebar-10years, Cage: High-Tension deformed bar, Concrete: 25-210-12]. The resource combination with the minimum cost was identified as [Machine: 50ton, Lifting Excavator: 320B, Cleaning Excavator: 325B, Machine Crew: Pile-20years, Cage Crew: Rebar-15years, Cage: Normal deformed bar, Concrete: 25-210-15] (refer to Table 6). Users can search for the optimal resource combination according to the on-site priority of the performance indicators among resource combinations that satisfy the constraints.
Table 6.
Optimal resource combination based on prioritization of performance indicators and simulation results.
4.4. Comparison with the Existing Method and Discussion
The simulation result data of the CFA pile installation process proposed by Zayed [28] was used to compare the two methods. The results were compared through a simulation experiment of pile installation of different diameters (i.e., 20.32 cm, 25.40 cm, 30.48 cm, 35.56 cm, 40.64 cm, and 45.72 cm) with a depth of 18.29 m using the test case model. For the TTF of each work task in the simulation model, the values suggested by Zayed [28] were used according to the diameter. The triangular distribution function was used for the TTF of each work task according to the file diameter, and detailed time values are presented in Zayed [28]. In this case study, Crawler Crane [50ton], Lifting Excavator [320B], Cleaning Excavator [325B], Cage Crew [Rebar-10years], Machine Crew [Pile-10years], Ready Mixed Concrete [Remicon 25-21-12], and cage [Rebar Normal deformed bar] were initialized for the simulation experiments. Table 7 presents the simulation results of Zayed [28] and this method according to the pile diameter. The Result A and B represent Zayed’s and this method’s simulation results, respectively.
Table 7.
Simulation results comparison.
The simulation result shows that the two methods have slightly different productivity. It is due to the different simulation model configurations (i.e., interaction among modeling components, relationship among modeling components, etc.) between Zayed’s model and the case model in this study. However, according to the DES calculation criteria, it is confirmed that both systems produce valid results. This is proof that both methods have the validity of the discrete event simulation system. On the other hand, the cost is calculated much more conservatively by this method. Costs may vary depending on the country, year, location, economic status, etc. However, since this method calculates based on the amount of material and the hourly cost of equipment and labor, this study’s calculation process reflects the reality more than the calculation method based on unit production cost suggested by Zayed [28]. Zayed’s model calculates the total cost using Equation (7).
where, TC is Total cost; Su is unit production cost ($/pile); Qr is rebar quantity; Cr is rebar cost per unit; Qc is concrete quantity; Cc is concrete cost per unit; and O is overhead cost.
In addition, there is an absence of a method for quantitatively estimating construction quality performance at a detailed level based on the DES. The method presented in this study helps to support the scientific decision-making of managers when establishing a construction plan for pile construction.
5. Conclusions
In this study, a methodology for estimating the quantitative quality performance of a construction simulation model was presented. The method presents predicting the quality performance with duration and cost of a specific construction operation when establishing a plan for the production. The benefits of using the developed system can be summarized as follows: first, this study presented a method for simultaneously estimating and evaluating the quality performance of the construction operation with the duration and cost. Second, a procedure for estimating the quantitative quality performance by the resource input at the detailed level was presented. This provides the basis for quantifying various construction performances. Third, the system helps to search for an optimal alternative plan establishing a construction plan that guarantees the maximum quality within a limited duration and cost of construction operations. Therefore, this study is expected to be a useful method for managing these performance indicators by estimating productivity and quality at the detailed level of the construction for academic and practical use.
The limitations of this study and recommended further researches are as follows: first, in this study, data collection was conducted by interviewing experts to apply the simulation model’s input variables. In the future, a method that can collect and analyze various construction field data (e.g., equipment characteristics, operator skills, site layout, management conditions, etc.) and integrate the refined data with the presented method is required. Second, most companies today must produce the highest quality products to remain competitive and meet ever-increasing customer demands. Therefore, focusing on quality management is a prerequisite and key to sustainable economic success for companies [40]. Industry 4.0 technologies (e.g., big data, deep learning, etc.) provide promising opportunities for quality management [41,42]. A study that achieves intelligence in the information collection and analysis by applying Industry 4.0 technologies to the quality quantification processes (i.e., data collection, analysis, etc.) suggested in this study is recommended. Third, this study analyzed only the duration, cost, and quality of the construction operations. However, in addition to the above three indicators, various performance indicators such as environment, safety, and risk management can be applied. Diverse researches that help to quantify various construction performance indicators is recommended. Fourth, in this study, only the analysis of the construction operation level was performed. In future studies, research that can improve the efficiency of quality control by integrating several management levels (e.g., project, cooperation level) is recommended.
Author Contributions
Conceptualization, methodology, and software, C.-Y.Y.; validation, Y.-J.P.; formal analysis, data curation and resources, C.-Y.Y. and Y.-J.P.; writing—original draft preparation, C.-Y.Y.; funding acquisition, C.-Y.Y. and Y.-J.P. All authors have read and agreed to the published version of the manuscript.
Funding
This research was supported by Kyungpook National University Development Project Research Fund, 2018.
Conflicts of Interest
The authors declare no conflict of interest.
References
- Hancher, D. Construction planning and scheduling. Assoc. Gen. Contract. Am. 2002, 1. [Google Scholar] [CrossRef]
- Rwelamila, P.D.; Hall, K.A. Total systems intervention: An integrated approach to time, cost and quality management. Constr. Manag. Econ. 1995, 13, 235–241. [Google Scholar] [CrossRef]
- Rad, H.N.; Khosrowshahi, F. Quality measurement in construction projects. In Proceedings of the Association of Researchers in Construction Management, Reading, UK, 9–11 September 1998; Volume 2, pp. 9–11. [Google Scholar]
- Rounds, J.L.; Chi, N. Total quality management for construction. J. Constr. Eng. Manag. 1985, 111, 117–128. [Google Scholar] [CrossRef]
- Jha, K.N.; Iyer, K.C. Critical factors affecting quality performance in construction projects. Total Qual. Manag. Bus. Excell. 2006, 17, 1155–1170. [Google Scholar] [CrossRef]
- Hoonakker, P.; Carayon, P.; Loushine, T. Barriers and benefits of quality management in the construction industry: An empirical study. Total Qual. Manag. Bus. Excell. 2010, 21, 953–969. [Google Scholar] [CrossRef]
- Formoso, C.T.; Revelo, V.H. Improving the materials supply system in small-sized building firms. Autom. Constr. 1999, 8, 663–670. [Google Scholar] [CrossRef]
- Stevens, J.D.; Kloppenborg, T.J.; Glagola, C.R. Quality Performance Measurements of the EPC Process: The Blueprint; University of Texas at Austin: Austin, Texas, USA, 1994. [Google Scholar]
- Smith, G.R. Quality-Based Performance Rating of Contractors for Prequalification and Bidding Purposes (NCHRP-W38); Citeseer: University Park, PA, USA, 2001; Volume 38. [Google Scholar]
- Anderson, S.D.; Russell, J.S. Guidelines for Warranty, Multi-Parameter, and Best Value Contracting; Transportation Research Board: Washington DC, USA, 2001; Volume 451, ISBN 0309066697. [Google Scholar]
- El-Rayes, K.; Kandil, A. Time-cost-quality trade-off analysis for highway construction. J. Constr. Eng. Manag. 2005, 131, 477–486. [Google Scholar] [CrossRef]
- Luong, D.L.; Tran, D.H.; Nguyen, P.T. Optimizing multi-mode time-cost-quality trade-off of construction project using opposition multiple objective difference evolution. Int. J. Constr. Manag. 2018, 21, 271–283. [Google Scholar] [CrossRef]
- Isikyildiz, S.; Akcay, C. Multi-objective optimization of time-cost-quality in construction projects using genetic algorithm. Rev. Constr. 2020, 19, 335–346. [Google Scholar] [CrossRef]
- Wang, T.; Abdallah, M.; Clevenger, C.; Monghasemi, S. Time–cost–quality trade-off analysis for planning construction projects. Eng. Constr. Archit. Manag. 2019, 28, 82–100. [Google Scholar] [CrossRef]
- Hu, W.; He, X. An innovative time-cost-quality tradeoff modeling of building construction project based on resource allocation. Sci. World J. 2014, 2014. [Google Scholar] [CrossRef]
- Zavadskas, E.K.; Liias, R.; Turskis, Z. Multi-attribute decision -making methods for assessment of quality in bridges and road construction: State-of-the-art surveys. Balt. J. Road Bridg. Eng. 2008, 3, 152–160. [Google Scholar] [CrossRef]
- Halpin, D.W. Cyclone—Method for modeling job site processes. ASCE J. Constr. Div. 1977, 103, 489–499. [Google Scholar] [CrossRef]
- Lee, D.-E.; Yi, C.-Y.; Lim, T.-K.; Arditi, D. Integrated simulation system for construction operation and project scheduling. J. Comput. Civ. Eng. 2010, 24, 557–569. [Google Scholar] [CrossRef]
- Lu, M.; Lau, S.-C.; Poon, C.-S. Simulation approach to evaluating cost efficiency of selective demolition practices: Case of Hong Kong’s Kai Tak airport demolition. J. Constr. Eng. Manag. 2009, 135, 448–457. [Google Scholar] [CrossRef]
- Lee, S.; Halpin, D.W. Predictive tool for estimating accident risk. J. Constr. Eng. Manag. 2003, 129, 431–436. [Google Scholar] [CrossRef]
- Sacks, R.; Esquenazi, A.; Goldin, M. Leapcon: Simulation of lean construction of high-rise apartment buildings. J. Constr. Eng. Manag. 2007, 133, 529–539. [Google Scholar] [CrossRef]
- Lo, W.; Yan, M.-R. Evaluating qualification-based selection system: A simulation approach. J. Constr. Eng. Manag. 2009, 135, 458–465. [Google Scholar] [CrossRef]
- Ahn, C.R.; Lee, S. Importance of operational efficiency to achieve energy efficiency and exhaust emission reduction of construction operations. J. Constr. Eng. Manag. 2013, 139, 404–413. [Google Scholar] [CrossRef]
- Yi, C.Y.; Gwak, H.S.; Lee, D.E. Stochastic carbon emission estimation method for construction operation. J. Civ. Eng. Manag. 2017, 23, 137–149. [Google Scholar] [CrossRef]
- Halpin, D.W.; Martinez, L.H. Real world applications of construction process simulation. In Proceedings of the Winter Simulation Conference Proceedings, Phoenix, AZ, USA, 5–8 December 1999; Volume 2, pp. 956–962. [Google Scholar]
- Song, L.; AbouRizk, S.M. Virtual shop model for experimental planning of steel fabrication projects. J. Comput. Civ. Eng. 2006, 20, 308–316. [Google Scholar] [CrossRef]
- Pang, H.; Zhang, C.; Hammad, A. Sensitivity analysis of construction simulation using cell-devs and microcyclone. In Proceedings of the Proceedings—Winter Simulation Conference, Monterrey, CA, USA, 4 December 2006; Citeseer: University Park, PA, USA, 2006; pp. 2021–2028. [Google Scholar]
- Zayed, T. Stochastic productivity assessment of continuous flight auger piles. Archit. Sci. Rev. 2009, 52, 17–27. [Google Scholar] [CrossRef]
- González, V.; Echaveguren, T. Exploring the environmental modeling of road construction operations using discrete-event simulation. Autom. Constr. 2012, 24, 100–110. [Google Scholar] [CrossRef]
- Hasan, S.; Bouferguene, A.; Al-Hussein, M.; Gillis, P.; Telyas, A. Productivity and CO2 emission analysis for tower crane utilization on high-rise building projects. Autom. Constr. 2013, 31, 255–264. [Google Scholar] [CrossRef]
- Chan, A.P.C.; Tam, C.M. Factors affecting the quality of building projects in Hong Kong. Int. J. Qual. Reliab. Manag. 2000, 17, 423–441. [Google Scholar] [CrossRef]
- Corona-Suárez, G.A.; Abourizk, S.M.; Karapetrovic, S. Simulation-based fuzzy logic approach to assessing the effect of project quality management on construction performance. J. Qual. Reliab. Eng. 2014, 2014. [Google Scholar] [CrossRef]
- Catapillar. Caterpillar Performance Handbook; Catapillar Inc.: Peoria, IL, USA, 2015; p. 2264. [Google Scholar]
- Halpin, D.; Riggs, L. PLanning and Analysis of Construction Operations; John Wiley & Sons: Hoboken, NJ, USA, 1994; ISBN 047155510X. [Google Scholar]
- Gupta, A. Simulation Modeling and Analysis; McGraw-Hill: New York, NY, USA, 2016; Volume 3, ISBN 9781482282566. [Google Scholar]
- Mure, N.; Scott, J.; Seward, D.; Quayle, S.; Clayton, C.; Rust, M. Just-in-time continuous flight auger piles using an instrumented auger. In Proceedings of the 19th International Symposium on Automation and Robotics in Construction (ISARC), Washington DC, USA, 23–25 September 2002; pp. 455–460. [Google Scholar] [CrossRef]
- Coduto, D.P.; Kitch, W.A.; Yeung, M.R. Foundation Design: Principles and Practices; Prentice Hall: Upper Saddle River, NJ, USA, 2001; Volume 2. [Google Scholar]
- Peurifoy, R.L.; Schexnayder, C.J.; Schmitt, R.L.; Shapira, A. Construction Planning, Equipment, and Methods; McGraw-Hill Education: New York, NY, USA, 2018; ISBN 1260108805. [Google Scholar]
- Zayed, T.M. Productivity and cost assessment for continuous flight auger piles. J. Constr. Eng. Manag. 2005, 131, 677–688. [Google Scholar] [CrossRef]
- Foidl, H.; Felderer, M. Research challenges of industry 4.0 for quality management. In Proceedings of the Lecture Notes in Business Information Processing, Ljungskile, Sweden, 7–10 August 2016; Springer: Berlin/Heidelberg, Germany, 2016; Volume 245, pp. 121–137. [Google Scholar]
- Peters, E.; Kliestik, T.; Musa, H.; Durana, P. Product decision-making information systems, real-time big data analytics, and deep learning-enabled smart process planning in sustainable industry 4.0. J. Self-Gov. Manag. Econ. 2020, 8, 16–22. [Google Scholar] [CrossRef]
- Kliestik, T.; Nica, E.; Musa, H.; Poliak, M.; Mihai, E.A. Networked, smart, and responsive devices in industry 4.0 manufacturing systems. Econ. Manag. Financ. Mark. 2020, 15, 23–29. [Google Scholar] [CrossRef]


Publisher’s Note: MDPI stays neutral with regard to jurisdictional claims in published maps and institutional affiliations. |
© 2021 by the authors. Licensee MDPI, Basel, Switzerland. This article is an open access article distributed under the terms and conditions of the Creative Commons Attribution (CC BY) license (https://creativecommons.org/licenses/by/4.0/).