Abstract
Objective and consistent assessment of locomotion recovery remains challenging in rodent spinal cord injury (SCI). We, therefore, studied the validity and relevance of the CatWalk XT® gait analysis as a tool for assessing functional outcome in a clinically relevant cervical SCI model in rats. In total, 20 Wistar rats were randomly assigned to either a C6 clip compression/contusion SCI or a sham laminectomy. Locomotion recovery was assessed weekly using the CatWalk XT® gait analysis and the BBB open field score. Six weeks after SCI, the percentage of preserved spinal cord tissue was measured by glial fibrillary acidic protein (GFAP) immunohistochemistry (IHC) staining. Statistical analyses were performed to assess the correlation of the BBB and the percentage of preserved tissue with 30 different CatWalk XT® parameters. SCI caused a bilateral and significant functional impairment in all studied CatWalk XT® parameters. Similar to the BBB, a significant spontaneous recovery could be observed in most of the CatWalk XT® parameters in the following weeks. Correlation between the hindlimb CatWalk XT® parameters and the BBB was good (53% of r values > 0.6) while the correlation between the forelimb and the hindlimb CatWalk XT® parameters and the percentage of preserved tissue was even stronger (83% of r values > 0.6). The CatWalk XT® gait analysis is closely correlated with tissue damage after cervical contusion/compression SCI and can be used as an objective and consistent tool for assessing locomotion recovery.
1. Introduction
Spinal cord injury (SCI), often caused by accidents, typically results in a series of severe physical and psychological health problems for the individual patient as well as in a huge social and economic burden for the society [1]. It is estimated that about three million people live with traumatic SCI worldwide, and up to 180,000 new cases are reported every year [2,3,4]. The cervical region (C1–4) is affected in about 55% of SCI cases, while the most common injury type is contusion and compression of the spinal cord [5,6]. Respiratory complications, therefore, remain the primary cause of death after SCI, most likely being related to inadequate pulmonary clearance and subsequent infections [7,8]. Other sequela of SCI such as deficits in motor, sensory, or autonomic function below the injury level are directly related to the primary disruption of the spinal cord. Furthermore, secondary complications including neuropathic pain, dysfunction of circulatory, respiratory, or bladder control, and loss of muscle tone affect patients in subacute and chronic stages [7,8].
With a deeper understanding of biochemical and neuroanatomical features of pathological changes after SCI acquired in the recent decades, various therapeutic targets and approaches, including drug treatments, cell transplantation strategies, or even gene editing, have been comprehensively studied in preclinical models of SCI [9]. Thereby, severe contusion/compression injures to the cervical spine via e.g., modified aneurysm clips have repeatedly been identified to be clinically very relevant [10,11,12]. However, before new treatments could proceed to clinical trials, it is crucial that their effects on functional recovery can be validated in animal models and thus, stable and replicable systems of behavioral assessment are needed.
To this end, the Basso, Beattie, and Bresnahan (BBB) open field rating scale was introduced in 1995 and is currently still the most widely used behavioral test for the assessment of the hindlimb motor function in rats. Compared to most single-task tests, the BBB open field rating scale is a more integrated system, including the assessment of joint movements, weight-bearing, coordination, and trunk stability, covering almost all the different levels of locomotion deficits [13]. However, beside the fact that the observations made during its assessment are subjective and should therefore be performed by at least two independent investigators, another major shortcoming of the BBB open field rating scale is its inability to assess the function of the forelimbs before the animal can support its weight or start stepping, which, in clinical practice, extensively affect the patients’ quality of life after SCI.
The CatWalk XT® gait analysis system is a more recent platform for the objective assessment of gait, coordination, and motor function in rodents. While the principle of the CatWalk XT® system is based on the classical ink footprint analysis test, its technological advancement allows an automatic analysis of more than 100 different gait locomotion, spatial, and dynamic parameters, providing a comprehensive understanding of functional impairment and recovery, including forelimb function [14]. Although it has been extensively used by many researchers to assess the functional recovery of rats in different SCI models, only limited numbers of its many parameters without a comprehensive consensus on which to use in a specific injury model have been published so far [15,16,17]. This makes it currently very difficult to determine the most suitable parameters of the CatWalk XT® system to best assess the recovery process induced by a certain treatment for a specific SCI model in preclinical studies.
Therefore, our current analysis aims to describe the typical changes of the 30 major parameters of the CatWalk XT® system during the first six weeks of spontaneous recovery after a clinically relevant clip compression/contusion SCI of the cervical spine in rats. Moreover, we provide data on the correlation of those CatWalk XT® parameters with the BBB open field rating scale and the histological preservation of tissue in the injured spinal cord, allowing an objective evaluation of their validity and relevance in the context of preclinical SCI studies.
2. Materials and Methods
2.1. Animals and Experimental Groups
A total of 20 female Wistar rats (230–265 g; Charles River Laboratories, Germany) were studied. Animals were housed in groups of 3–4 in 1815 cm2 cages with a 12:12 h light/dark cycle, at 26 °C and with food and water ad libitum. During a seven-day acclimation period, all animals were equally adapted to the BBB open field and the CatWalk XT® runway. The baseline of both behavioral tests was performed three days before the C6 cervical SCI (clip contusion/compression) or Sham operation. During the surgery, random assignment to either the SCI group (group 1; n = 12) or the Sham group (group 2; n = 8) took place. Behavioral tests were performed weekly after the surgery until the end of the experiment. Due to the high morbidity associated with the severe contusion/compression injury on the C6 level leading to e.g., weight loss > 20%, three animals from the SCI group had to be excluded early after the trauma. Therefore, nine animals were available in the SCI group and eight in the Sham group at the end of the experiment. Six weeks after SCI, all animals were sacrificed, perfused and their spinal cords were extracted and preserved for histological analyses. All experiments met the requirements of “the animal protection law and animal research regulation of the Federal Republic of Germany” and were approved by the Animal Care Committee of the federal government (file reference G-211/15).
2.2. Cervical Clip Contusion/Compression SCI
Animals were anesthetized with isoflurane (3.5% for induction dose, 1.5% for maintenance dose) and a 1:1 mixture of O2 and N2O, placed on a 36° C heating plate. After shaving and disinfection of the skin with iodine, the T2 spinous process was palpated and a midline incision from T2 to the occiput was performed. The paravertebral muscles were dissected, a retractor was inserted and the laminae of C5-T2 were visualized. Using a surgical microscope (Hund Wiloskop Stereo Microscope, Helmut Hund GmbH, Germany), the interspinous ligaments were carefully cut open and a C6 laminectomy was performed with a small rongeur until the C6 and C7 nerve roots were exposed. For animals of the SCI group, a 28-g modified aneurysm clip (Fehlings Laboratory, University of Toronto, Toronto, Canada) was then carefully slid over the spinal cord, in the space between the C6 and C7 nerve roots and finally placed on the C6 spinal cord with a snap for 60 s as previously described [10,18,19,20]. After removal of the clip, the typical contusion/compression SCI was directly visible. For animals of the Sham group, only a C6 laminectomy and exposure of the C6 and C7 nerve roots were performed. Muscle and skin layer were sutured separately, and the incision was disinfected.
After surgery, all animals were subjected to an intensive postoperative care regime for 3–5 days which included the administration of buprenorphine (0.05 mg/kg s.c.; Bayer AG, Leverkusen, Germany) and meloxicam (2 mg/kg s.c.; CP-Pharma, Burgdorf, Germany) as analgesic medication twice a day. Food and water were placed in the cage as easy as possible to reach. In addition, animals in the SCI group received 3–5 mL saline with their daily analgesic injections to avoid dehydration. An antibiotic prophylaxis (moxifloxacin, 4 mg/kg p.o.; Bayer AG, Leverkusen, Germany) was given for seven days, and bladders were manually voided twice a day until bladder function was restored.
2.3. Behavioral Tests
The CatWalk XT® automated gait analysis system (Noldus Information Technology, The Netherlands) was performed as a baseline (BL) three days prior to the trauma and weekly after SCI until the end of the experiment (neurotest timepoints (N) 1–6). The system consists of an adjustable tunnel and a horizontal glass walkway. Animals are positioned at one of the ends of the walkway and run spontaneously towards the other end. A green LED is emitting light inside the glass walkway and in combination with a high-speed camera which is localized underneath the walkway, the runs of the animals and the print parameters of their forelimbs (FL) and hindlimbs (HL) can be digitally recorded. Data are transmitted to a computer and analyzed with the CatWalk XT® software (version 10.5; Noldus Information Technology, the Netherlands). For our current study, animals had to perform at least three uninterrupted runs back and forth over the walkway to successfully complete the CatWalk XT® gait analysis on a specific timepoint (Figure 1A). A maximum run variation of 60%, a camera gain of 16.99 decibel (dB), and a detection threshold of 0.1 arbitrary units (a.u.) were set as calibrated detection parameters for all runs of both, the SCI and the Sham animals. Every run was first classified by the automated footprint recognition of the CatWalk XT® software. Then, all runs were manually reviewed and irrelevant data such as recorded contacts of the nose, the abdomen, or the tail with the walkway were excluded. In addition, the print data generated when the animals were turning around at the end of the walkway were manually removed (Figure 1B). With the CatWalk XT® software, major parameters (see Table 1) related to e.g., gait, kinetic or coordination were calculated for every run and the results were averaged for every timepoint per animal.
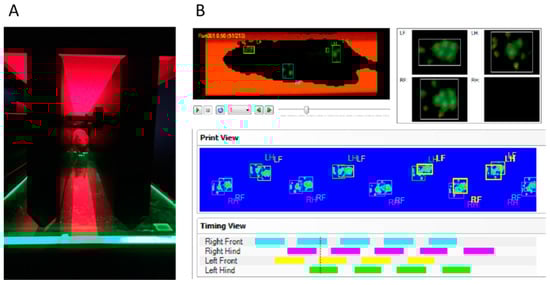
Figure 1.
Runway (A) and classification interface (B) with graphical print view of the CatWalk XT® automated gait analysis system. For each run, pattern and continuity are confirmed and inappropriately labeled prints are manually corrected frame by frame in addition to the CatWalk XT® software’s autoclassification to provide sufficient and reliable data for further analysis.

Table 1.
CatWalk XT® parameters of animals in the SCI group assessing motor function at all available timepoints.
Following the CatWalk XT® automated gait analysis, the BBB open field rating scale score was performed in all animals at the same timepoints (BL, N2-N6) to assess the general recovery of hind limb locomotion [13]. To this end, the animals were placed into an open field and recorded with a camera for 4 min. The videos were then reviewed by two blinded observers and hindlimb joint movement, coordination, and weight support were evaluated using a rating scale from 0 points (no movement of any kind) to 21 points (normal locomotion). The results of both observers for every animal were averaged per timepoint.
2.4. Perfusion, Tissue Processing and Histological Assessment
Six weeks after SCI, when all six weekly neurotest timepoints were completed, the animals were deeply anesthetized with isoflurane (5%) and transcardially perfused with 50 mL 0.1 M cold phosphate-buffered saline (PBS) followed by 150 mL 4% paraformaldehyde (in 0.1 M PBS). The spinal cords were extracted, cut into a 2 cm piece centered around the visible injury lesion, fixed with 4% paraformaldehyde for 24 h and cryoproteted with 30% sucrose for 48 h. The spinal cord pieces were then embedded in tissue embedding medium (Sakura Finetek Europa B.V., Alphen aan den Rijn, The Netherlands) on dry ice and a cryostat (Leica CM3050S, Leica Biosystems, Nußloch, Germany) was used to cut consecutive cross-sections (every 240 µm) with a thickness of 30 µm. The spinal cord cross-sections were labeled, dried and stored at −80 °C until further processing.
For histological assessment of the preserved spinal cord tissue, immunofluorescence staining with glial fibrillary acidic protein (GFAP) was performed. To this end, the spinal cord cross-sections were blocked with a blocking solution containing 5% non-fat milk, 1% bovine serum albumin, and 0.3% Triton-X100 in 0.1 M PBS for 1 h. A mouse anti-GFAP (1:1000; Millipore, Burlington, VT, USA) primary antibody, diluted in blocking solution, was then applied overnight. An isotype control with nonspecific immunoglobulin at the same concentration was performed to ensure specificity of the antibody staining (data not shown). Alexa Fluor 568 goat anti-mouse (1:400; Invitrogen, Carlsbad, CA, USA) diluted in blocking solution without Triton-X100 was used as the secondary antibody and applied for 1 h. Nonspecific binding of the secondary antibody was ruled out by incubating sections with only the antibody diluent without adding the primary antibody (data not shown). After removal of the secondary antibody and washing with PBS, the spinal cord cross-sections were coverslipped after applying mounting medium, dried and then subjected to imaging analysis.
All images were taken with a confocal laser scanning microscope (LSM 700; Carl Zeiss Microscopy GmbH, Oberkochen, Germany) in the “.lsm” file format and analyzed with the image processing software ImageJ (National Institute of Health, New York City, NY, USA). For the assessment of the preserved spinal cord tissue, only images of the same 11 spinal cord cross-sections with the following distinct distances to the lesion epicenter were used: 0 μm (epicenter), +/−240 μm, +/−480 μm, +/−720 μm, +/−960 μm, and +/−1200 μm. ROIs were drawn around the entire spinal cord and, if present, around the posttraumatic cystic cavity with the “Free-hand” tool and the “Measure” tool was used to output the area of the total spinal cord and the preserved spinal cord tissue (total spinal cord area—cyst area). The percentage of preserved spinal cord tissue (preserved spinal cord tissue area divided by the total spinal cord area) was then calculated for every spinal cord cross-section and averaged per animal.
2.5. Statistical Analysis
All results are presented as the mean ± standard error of the mean (SEM). For the statistical comparison of behavioral results between groups and timepoints, a two-way repeated measure analysis of variance (ANOVA), followed by a Tukey test for multiple comparisons was used. Means between multiple groups were analyzed using one-way ANOVAs followed by post-hoc Tukey-HSD-tests. For the comparison of means between two groups, unpaired two-sample t-tests were used. Spearman correlation coefficients were determined to examine the relationship between the ordinal scaled BBB open field score and the different CatWalk XT® parameters. To assesses the correlation between the interval scaled percentage of preserved spinal cord tissue and the different CatWalk XT® parameters, Pearson’s correlation coefficients were calculated. Normality assumption was confirmed prior to all parametric analyses using Shapiro–Wilk normality tests and a p-value of p < 0.05 was considered significant. Depending on the respective r values, the correlation between the variables was classified as weak (r = 0.00–0.39), moderate (r = 0.40–0.59), strong (r = 0.60–0.79) or very strong (0.80–1.00) [18]. All statistical analyses were performed using the software PRISM (Version 7.0; GraphPad, San Diego, CA, USA).
3. Results
3.1. CatWalk XT® Automated Gait Analysis
Since a successful CatWalk XT® run requires the animals to at least bear their own weight, none of the animals in the SCI group were able to finish a CatWalk XT® run during the first assessment seven days after the injury. Therefore, the neurotest timepoint (N) 1 (one week after SCI) was not included in the statistical analysis.
3.1.1. Regularity Index
The regularity index (RI), defined as the exclusive use of normal step sequence patterns during uninterrupted locomotion, shows the degree of interlimb coordination [19]. A walkway crossing with a RI of 100% is regarded as a fully coordinated run.
Within the SCI group, RI was significantly reduced two weeks after the injury to 0.99 ± 0.99% compared to the baseline measurement of 98.03 ± 0.80% (baseline vs. N2; p < 0.0001), followed by slow spontaneous recovery (Table 1; Figure 2A). Thereby, significant improvement of the interlimb coordination was reached five weeks after SCI with a RI of 13.94 ± 3.10% (N2 vs. N5; p = 0.001).
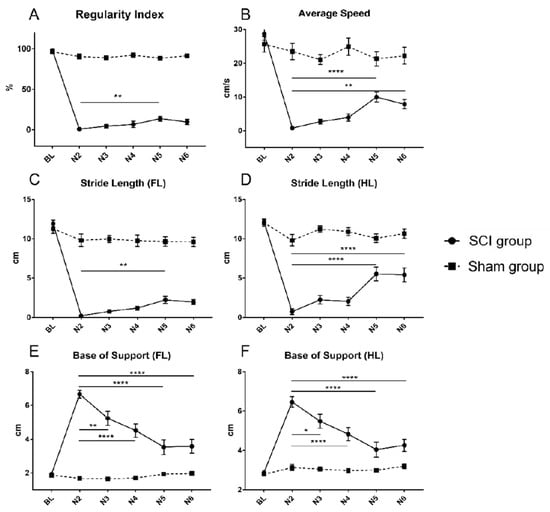
Figure 2.
Regularity index (A), average speed (B), stride length of the forelimbs (C) and the hindlimbs (D) as well as base of support of the forelimbs (E) and the hindlimbs (F) for animals in the SCI and the Sham group from baseline (BL) until the end of the experiment (N6). In the SCI group, a similar pattern of a significant deterioration from the BL values after the injury followed by spontaneous recovery, eventually reaching a significant level compared to the first postinjury value (N2) could be observed for all presented CatWalk XT® parameters (* p < 0.05; ** p < 0.01; **** p < 0.0001).
3.1.2. Average Speed
The average speed measures the speed of each run and is representative for the general locomotion status [14].
Within the SCI group, a significant reduction of the average speed could be observed two weeks after the injury (N2) with 0.80 ± 0.46 cm/s compared to the baseline measurement of 28.71 ± 1.91 cm/s (baseline vs. N2; p < 0.0001). However, over the course of the experiment, average speed gradually improved (Table 1; Figure 2B). This spontaneous recovery reached a significant level five weeks after SCI (N5) with 10.00 ± 1.49 cm/s (N2 vs. N5; p < 0.0001) and also remained significant six weeks after the injury (N6) with 7.87 ± 1.36 cm/s (N2 vs. N6; p = 0.005).
3.1.3. Stride Length
The stride length (SL) is defined as the distance between the placement of a paw and the subsequent placement of the same paw. As a well-established parameter in the CatWalk XT® analysis, an increase of the stride length after injury suggests a greater trunk stability and implies better improvement of coarse muscle strength [20,21].
Compared to the baseline measurement within the SCI group, the SL of the forelimbs dropped significantly from 11.91 to 0.22 cm two weeks after the injury (baseline vs. N2; p < 0.0001), and then gradually recovered over the course of the experiment (Table 1; Figure 2C). Significant recovery of the forelimb SL was reached five weeks after SCI with 2.25 ± 0.44 cm (N2 vs. N5; p = 0.0357).
Similarly, the SL of the hindlimbs in the SCI group was significantly impaired by the injury and dropped from 12.16 ± 0.37 to 0.75 ± 0.37 cm at the timepoint N2 (baseline vs. N2; p < 0.0001; Figure 2D). However, the following endogenous recovery of the hindlimb SL showed a different pattern as the forelimb SL, leaping forward to a significant level with 5.54 ± 0.89 cm five weeks after SCI (N2 vs. N5; p < 0.0001) and remaining significant with 5.43 ± 0.89 cm at the last timepoint as well (N2 vs. N6; p < 0.0001).
3.1.4. Base of Support (BOS)
The base of support (BOS) is another well-established parameter in the CatWalk XT® gait analysis, representing the distance between the forelimbs or the hindlimbs and measured perpendicular to the direction of walking. A lower BOS indicates a higher trunk stability and thus, BOS is typically increased after SCI [14].
For the forelimbs of animals in the SCI group, the BOS significantly increased to 6.67 ± 0.23 cm two weeks after the injury (N2; baseline vs. N2; p < 0.0001; Figure 2E), but then decreased, reaching a significant level of recovery already three weeks after SCI (N3) with 5.24 ± 0.42 cm (N2 vs. N3; p = 0.0016). Spontaneous recovery continued and the lowest BOS was reached five weeks after SCI (N5) with 3.54 ± 0.44 cm (N2 vs. N5; p < 0.0001).
Similarly, the BOS of the hindlimbs showed a significant increase from 2.88 ± 0.08 cm at baseline to 6.46 ± 0.26 cm two weeks after the injury (N2; baseline vs. N2; p < 0.0001; Figure 2F), and then gradually decreased, indicating spontaneous recovery which became significant already three weeks after SCI (N3) with 5.48 ± 0.35 cm (N2 vs. N3; p = 0.027). Five weeks after SCI (N5), the BOS of the hindlimbs had reached the lowest level with 4.05 ± 0.38 cm (N2 vs. N5; p < 0.0001), while it slightly increased to 4.26 ± 0.31 cm at the end of the experiment (N2 vs. N6; p < 0.0001).
3.1.5. Print Parameters
Max Intensity, Mean Intensity, Max Contact Max Intensity, and Max Contact Mean Intensity
In the CatWalk XT® gait analysis, the print parameters max intensity and mean intensity indicate the maximum and the mean intensity of the complete paw print. In contrast, the max contact max intensity and the max contact mean intensity parameter are only measured at the max contact period of the paw. In general, print parameters that measure the print intensity, indirectly measure the stepping pressure, and thus serve as a surrogate for the weight-bearing situation as a part of the locomotor function [14].
Within the SCI group, a significant decrease of all print intensity parameters to severely low levels could be observed compared to the respective baseline measurement two weeks after the injury (N2; Table 1, Table 2; Figure 3A–H; all p < 0.0001). The max intensity of the forelimbs had already significantly recovered three weeks after SCI (N3) compared to the first postinjury measurement (N2 vs. N3; p = 0.0069), in the same way as the mean intensity (p = 0.0008), the max contact max intensity (p = 0.0047), and the max contact mean intensity (p = 0.0008) of the forelimbs (Table 1; Figure 3A,C,E,G). Spontaneous recovery then gradually continued until the highest max intensity of the forelimbs was reached six weeks after SCI (N6; N2 vs. N6; p < 0.0001; Table 1). However, in the remaining print intensity parameters (mean intensity, max contact max intensity, and max contact mean intensity of the forelimbs), the highest intensity was reached already five weeks after SCI (N5; N2 vs. N5; p < 0.0001; Table 1).
Table 2.
Assessment of the injury severity by statistical comparison of the CatWalk XT® parameters between baseline test (BL) and the first postinjury neurotest timepoint two weeks after SCI (N2) as well assessment of spontaneous recovery by statistical comparison of the CatWalk XT® parameters between N2 and the following postinjury neurotest timepoints (N3–6).
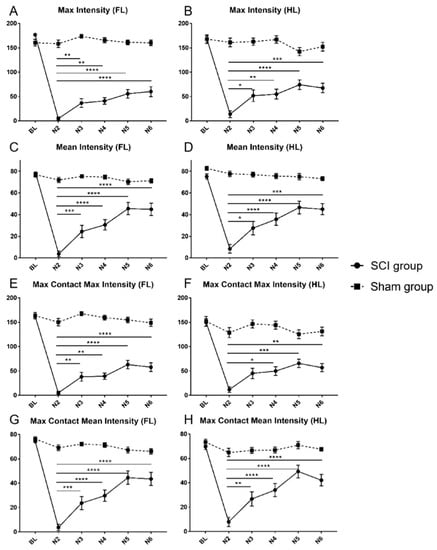
Figure 3.
Max intensity of the forelimbs (A) and the hindlimbs (B), mean intensity of the forelimbs (C) and the hindlimbs (D), max contact max intensity of the forelimbs (E) and the hindlimbs (F) and max contact mean intensity of the forelimbs (G) and the hindlimbs (H) for animals in the SCI and the Sham group from baseline (BL) until the end of the experiment (N6). In the SCI group, a similar pattern of a significant deterioration from the BL values after the injury followed by a spontaneous recovery, eventually reaching a significant level compared to the first postinjury value (N2), could be observed for all CatWalk XT® print intensity parameters (* p < 0.05; ** p < 0.01; *** p < 0.001; **** p < 0.0001).
Similarly, the print intensity parameters max intensity, mean intensity and max contact mean intensity of the hindlimbs showed early recovery after SCI compared to the respective N2 timepoints and reached a significant level after three weeks (N3; N2 vs. N3; p < 0.05; Table 1; Figure 3B,D,F,H). Only max contact max intensity of the hindlimbs took one week longer to significantly recover (N2 vs. N4; p = 0.0149). All print intensity parameters then further increased stepwise until the highest recovery was reached five weeks after SCI (N5; N2 vs. N5; p < 0.0001; Table 1).
Print Length, Print Width, Print Area, and Max Contact Area
The print scale parameters print length, print width, print area, and max contact area of the CatWalk XT® gait analysis all measure the print of the complete paw. Compared to the print intensity parameters that reflect the stepping pressure, these static measurements represent the force during locomotion [22]. Moreover, an increased print area also suggests improved fine digit motor function and trunk stability [20,21].
In the SCI group, the prints of all paws significantly decreased in length, width, area as well as max contact area to a very low level, compared to the respective baseline measurements, two weeks after the injury (N2; Table 1 and 2; Figure 4A–H; all p < 0.0001). Early significant spontaneous recovery was observed in the print length of the forelimbs (N2 vs. N3; p = 0.0216) and the print width of the hindlimbs (N2 vs. N3; p = 0.0141), while the print length of the hindlimbs (N2 vs. N5; p < 0.0001), the print width of the forelimbs (N2 vs. N5, p = 0.001), and the print area of the hindlimbs (N2 vs. N5, p = 0.0185) reached a significant level of recovery only five weeks after the injury (N5; Table 1 and Table 2; Figure 4A–D,F). On the contrary, there was no significant improvement of the print area of the forelimbs as well as the max contact area of all limbs compared to the first postinjury measurement over the course of the experiment (Table 1 and Table 2; Figure 4E,G,H).
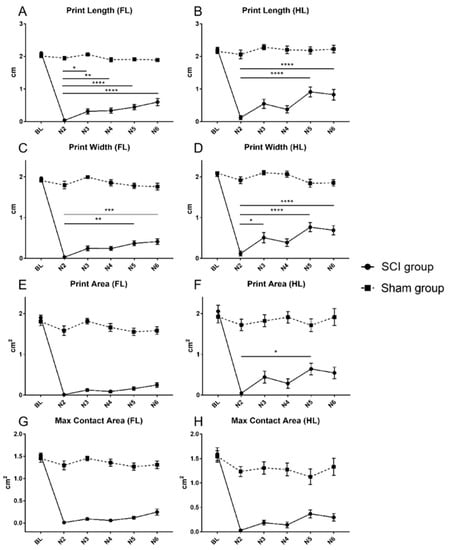
Figure 4.
Print length of the forelimbs (A) and the hindlimbs (B), print width of the forelimbs (C) and the hindlimbs (D), print area of the forelimbs (E) and the hindlimbs (F) and max contact print area of the forelimbs (G) and the hindlimbs (H) for animals in the SCI and the Sham group from baseline (BL) until the end of the experiment (N6). In the SCI group, a similar pattern of a significant deterioration from the BL values after the injury could be observed in all presented CatWalk XT® print parameters. However, consistent significant spontaneous recovery compared to the first postinjury value (N2) was only demonstrable for the print length and the print width parameters. (* p < 0.05; ** p < 0.01; *** p < 0.001; **** p < 0.0001).
3.1.6. Swing Speed and Body Speed
The swing speed parameter in the CatWalk XT® gait analysis measures the speed of the paw during a swing. The body speed parameter on the other hand is calculated by dividing the distance that the animal’s body traveled from one initial contact of a specific paw to the next by the duration it took to travel this distance [23]. Both speed parameters provide information on the locomotion and muscle tone of each limb.
After SCI, the swing speed and the body speed of all limbs dropped significantly at the timepoint N2 compared to the respective baseline values (Table 1 and Table 2; Figure 5A–D; all p < 0.0001). Gradual spontaneous recovery of the swing speed of the forelimbs could be observed, becoming significant compared to the first postinjury value five weeks after SCI (N5; N2 vs. N5; p = 0.0041) with a further increase during the last week of the experiment (N6; N2 vs. N6; p < 0.001). In contrast, spontaneous recovery of the swing speed of the hindlimbs showed a rather volatile development with a rapid increase at the timepoint N5, leading to a significant difference to the first postinjury value five weeks after SCI (N2 vs. N5; p < 0.0001), followed, however, by a slight decline until the end of the experiment (Table 1 and Table 2; Figure 5A,B). Similarly, the body speed of the forelimbs and the hindlimbs only showed a slow spontaneous recovery early after SCI but increased significantly compared to the timepoints N2 five weeks after the injury (N2 vs. N5; p < 0.0001 and N2 vs. N5; p = 0.0003, respectively) and decreased again slightly towards the end of the experiment (Table 1 and Table 2; Figure 5C,D).
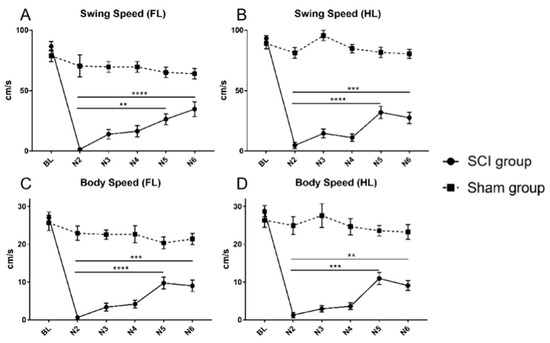
Figure 5.
Swing speed of the forelimbs (A) and the hindlimbs (B) as well as body speed of the forelimbs (C) and the hindlimbs (D) for animals in the SCI and the Sham group from baseline (BL) until the end of the experiment (N6). A similar pattern of significant deterioration from the BL values after SCI, followed by a spontaneous recovery, could be observed in all CatWalk XT® speed parameters (** p < 0.01; *** p < 0.001; **** p < 0.0001).
3.2. Basso, Beattie, and Bresnahan (BBB) Open Field Score
In our study, the BBB open field score was used to evaluate the general locomotor recovery of the hindlimbs on a 21-point rating scale weekly after SCI from N1 to N6 (Figure 6). For all baseline tests, the maximum of 21 points in the BBB open field score was achieved by all animals and in the Sham group, all animals continued to achieve 21 points on every timepoint throughout the experiment. In the SCI group, however, the BBB score significantly dropped to 6.97 ± 0.72 one week after the injury (N1; baseline vs. N1; p < 0.0001), and seven out of nine animals were unable to bear their own weight (BBB score < 9 points). During the following weeks, the BBB open field score gradually recovered in the injured SCI animals, but a significant difference compared to the first postinjury timepoint (N1) could only be observed at the end of the experiment (N6) with 9.611 ± 0.64 points (N1 vs. N6; p = 0.019). Nevertheless, there were still three out of nine animals in the SCI group unable to bear their own weight at the end of the experiment. These results of the BBB open field score indicated a gradually spontaneous recovery of the general motor function of the hindlimbs after severe cervical contusion/compression SCI but also demonstrated the limited discriminative ability of the score especially after a severe cervical SCI.
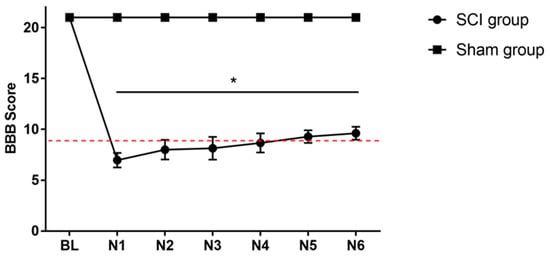
Figure 6.
BBB open field scores of animals in the SCI and the Sham group from baseline (BL) until the end of the experiment (N6). A significant decrease of the BBB score from baseline to one week after SCI (N1) could be observed (p < 0.0001). During the following weeks, the BBB scores gradually but slowly improved and spontaneous recovery reached a significant level at the end of the experiment (N1 vs. N6; * p < 0.05). The dashed line is indicating a BBB score of 9 points above which animals are able to bear their own weight.
3.3. Histological Assessment of the Preserved Spinal Cord Tissue
The percentage of preserved spinal cord tissue, calculated as the area of preserved spinal cord tissue (area of the total spinal cord section (Stotal) subtracted by the cyst area (Scyst)) divided by the area of the total spinal cord section ((Stotal − Scyst)/Stotal * 100%), was assessed on spinal cord cross-sections that were stained for GFAP, a marker for astrocytes, six weeks after SCI (Figure 7A). The overall rate of preserved spinal cord tissue in the SCI group was 60.42 ± 2.82%, which was calculated based on the average values of 11 spinal sections sampled within 1200 μm rostral and caudal to the lesion site. The least percentage of preserved spinal cord tissue was found 240 µm caudal to the lesion epicenter (35.99 ± 5.14%), while axial distribution of preserved spinal cord tissue percentage revealed a gradual outward increase to 90.65 ± 5.86% 1200 µm rostral and 89.37 ± 5.33% 1200 µm caudal to the lesion epicenter (Figure 7B).
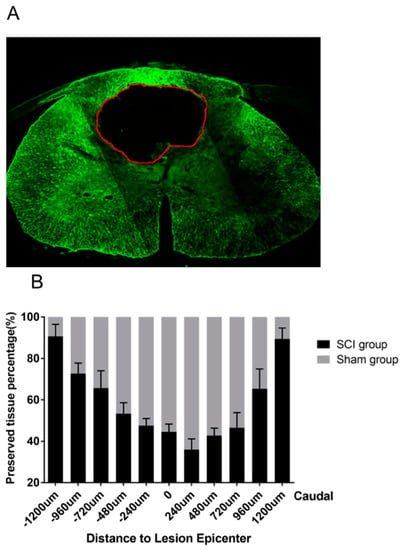
Figure 7.
(A) GFAP-stained (green) spinal cord cross-section of an animal in the SCI group six weeks after the injury. The intramedullary cyst is framed with the ROI measurement function in Image J (red line). (B) Axial distribution of preserved spinal cord tissue percentage on 11 spinal cord cross-sections with an intersection distance of 240 µm.
3.4. Correlation Analysis between the CatWalk XT® Parameters and Other Measurements
In order to investigate the consistency of the different CatWalk XT® parameters when describing spontaneous recovery after severe cervical contusion/compression SCI in rats, we examined the relationship between our CatWalk XT® results and the BBB open field scores as well as the histological assessment of preserved tissue, determining Spearman or Pearson correlation coefficients, respectively.
3.4.1. Correlation between the CatWalk XT® Parameters and the BBB Open Field Scores
Since the timepoint N1 was not achievable in the CatWalk XT® gait analysis, we calculated Spearman correlation coefficients for the BBB open field scores of timepoints N2 to N6 with all studied CatWalk XT® parameters of the hindlimbs (the forelimbs are not assessed in the BBB open field score and were therefore excluded) in all animals of the SCI group. As shown in Figure 8, the CatWalk XT® parameter max contact area showed the highest correlation with the BBB open field scores over the course of the experiment (r = 0.88), followed by the swing speed (r = 0.73), print area (r = 0.73), and regularity index (r = 0.7). In contrast, the intensity parameters max contact mean intensity (r = 0.17) and mean intensity (r = 0.375) were only weakly correlated with the BBB open field scores. Overall, a very strong correlation between the BBB open field score and the CatWalk XT® gait analysis was found in 1 out of 16 (6.3%) and a strong correlation in 8 out of 16 (50%) assessed parameters. These findings suggested a comparable ability of the CatWalk XT® gait analysis and the BBB open field score to describe spontaneous recovery after severe cervical SCI.
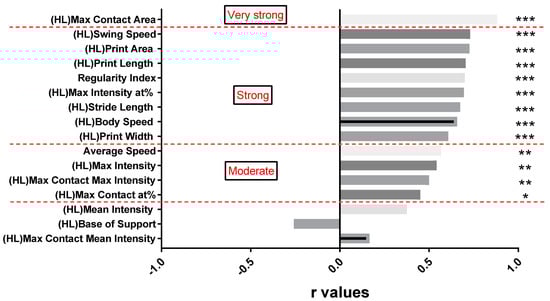
Figure 8.
Spearman correlation coefficients of all CatWalk XT® parameters of the hindlimbs with the BBB open field scores in SCI animals from two weeks after the injury (N2) until the end of the experiment (N6). The r values and the respective CatWalk XT® parameters are presented in a descending order from max contact area (r = 0.88) to max contact max intensity (r = 0.17; * p < 0.05; ** p < 0.01, *** p < 0.001; classification of the correlation in red writing).
3.4.2. Correlation between the CatWalk XT® Parameters and the Percentage of Preserved Tissue
Considering that the histological assessment of preserved tissue was carried out after termination of the experiment, a correlation analysis could only be performed between the percentage of preserved tissue and the CatWalk XT® parameters from the last timepoint (N6). As shown in Figure 9, the correlation between the following CatWalk XT® parameters and the percentage of preserved tissue reached the highest r values: swing speed of the forelimbs (r = 0.980), print length of the forelimbs (r = 0.92), max contact mean intensity of the forelimbs (r = 0.915) and base of support of the hindlimbs (r = −0.91). Interestingly, the correlation coefficients (r values) were higher in the forelimbs than in the hindlimbs in nearly all CatWalk XT® parameters except for the stride length (HL: r = 0.89 vs. FL: r = 0.78) and the base of support (HL: r = −0.91 vs. FL: r = −0.89). Comparison of the r values of the forelimbs and the hindlimbs, however, yielded no statistically significant difference (p = 0.107). The poorest correlation could be observed between the percentage of preserved tissue and the CatWalk XT® parameters body speed of the hindlimbs (r = 0.53) and forelimbs (r = 0.49), the max intensity at % of the hindlimbs (r = 0.38) and lastly the average speed (r = 0.34). A very strong correlation between the CatWalk XT® gait analysis and the percentage of preserved tissue was observed in 24 out of 30 (80%) parameters and was thus considerably more common compared to the correlation with the BBB open field score (6.3%). These findings suggested a close relationship between the spontaneous recovery after severe cervical SCI assessed by the CatWalk XT® gait analysis and the histologically preserved spinal cord tissue.
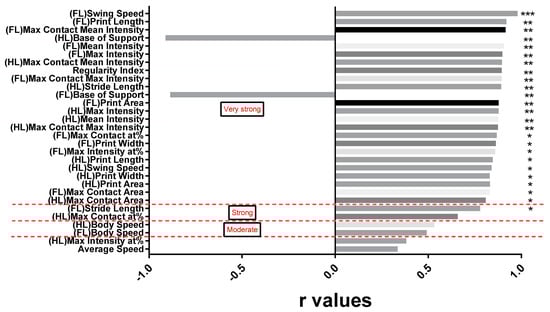
Figure 9.
Pearson correlation coefficients of all CatWalk XT® parameters with the percentage of preserved tissue in SCI animals six weeks after the injury (N6). The r values and the respective CatWalk XT® parameters are presented in a descending order from swing speed of the forelimbs (r = 0.98) to average speed (r = 0.33; * p < 0.05; ** p < 0.01; *** p < 0.001; classification of the correlation in red writing).
4. Discussion
To successfully evaluate potential experimental treatments for SCI, a suitable experimental animal, a valid injury model and reliable behavioral tests are required.
Historically, researchers have used cats, dogs, and monkeys as experimental animals for in vivo SCI models [24,25,26,27,28]. However, several clinical trials based on these preclinical studies have failed because of the inconsistency of the animal models and assessment methods used [24,25]. Since then, animal experiments have been relying on more standardized and reproducible species such as rats and mice. While mice are currently more suitable for transgenic technologies, allowing the exploration of underlying mechanisms of certain genes, the pathophysiological changes seen after SCI are more similar to humans in rats [29,30,31]. As an example, the development of a posttraumatic, intramedullary cyst is typically observed in humans and rats, but not in mice [32,33].
Concerning the injury model, sharp injuries such as (hemi)-transections of the spinal cord have often been performed in preclinical animal experiments [34]. However, those injuries lead to substantially less inflammation, demyelination, gliotic scarring and neuron loss compared to the contusion-compression injury typically seen in human SCI [35]. Moreover, although the cervical spine, which is most commonly affected in human SCI, has a unique and complex cellular circuitry, injuries in animal models have predominantly been performed in the thoracic spine [12,36]. Due to these considerations, clip contusion/compression injuries to the cervical spinal cord have been developed which are closer to reality in terms of their histological as well as clinical severity [10,37].
For our current study, we, therefore, used a 28-g clip to induce an incomplete but severe cervical contusion/compression SCI at the C6 level in rats. As a result, the SCI animals showed quadriplegia immediately after the injury with most of them still being unable to bear their own weight one week later. Nevertheless, this combination of experimental animal and injury model/level used in our study, allowed for gradual recovery of motor function during the six weeks after SCI (N1-N6) and therefore can be seen as a suitable basis for behavioral testing and possibly the evaluation of potential experimental SCI treatments.
Although neural regeneration within the adult spinal cord is generally limited after SCI, some extent of spontaneous sensorimotor recovery still occurs [38]. As the lesion in the spinal cord with its pathological changes is closer to the forelimb motor circuits in cervical SCI, this mechanism might contribute to the differences in spontaneous recovery between forelimbs and hindlimbs, observed by us and others [39,40]: as depicted in Figure 2, Figure 3, Figure 4 and Figure 5, all CatWalk XT® parameters analyzed in our study showed a significant decrease (or increase in case of the base of support) from baseline to the first postinjury timepoint (N2) independent from the measured limbs. While gradual recovery over the following five weeks could then be observed for both, the hindlimbs and the forelimbs, the overall maximum level of spontaneous recovery was considerably higher in the hindlimbs compared to the forelimbs, with the most obvious differences in the parameters stride length (41.04% vs. 14.97%), print width (29.48% vs. 19.77%), and print area (24.83% vs. 12.46%).
The regularity index indicates the interlimb coordination of experimental animals when normal step sequence patterns are used during uninterrupted locomotion. In the SCI group of our current experiment, the regularity index dropped to 0.99% at the timepoint N2 and reached the highest recovery with 13.94% at the timepoint N5. At the same time, the highest BBB open field score after SCI, measured at the end of the experiment, was 9.611 points. According to the BBB open field scale, a performance of 12 points equals occasional (≤50%) interlimb coordination which, in our study, was never reached by any animal during the six weeks after SCI. However, the highest result of the regularity index in the CatWalk XT® analysis 5 weeks after the injury (N5) indicated a significant recovery compared to the first postinjury value (N2). Moreover, we found a good correlation (r = 0.89) of the regularity index with the percentage of preserved tissue, indicating a high validity of this parameter for the usage in our injury model. Therefore, the supplement of the CatWalk XT® regularity index might result in an overall more reliable and sensitive assessment of locomotor function for animals with BBB open field scores less than 12 points, similar to what has previously been reported for BBB open field scores from 11 to 14 points [19,41]. Furthermore, although major variation from different SCI levels, injury models and severities can occur, the regularity index is one of the most popular CatWalk XT® parameters used for behavioral testing after rodent SCI due to its high sensitivity [19,41,42,43,44,45].
Stride length and base of support are two CatWalk XT® parameters that indicate the level of trunk stability and gross muscle strength. We observed significant recovery of the stride length in the SCI group since the timepoint N5, while the BOS had already significantly recovered since the timepoint N3. As for the correlation with the percentage of preserved tissue, we found relatively high r values for the stride length and the BOS parameters in both, the forelimbs (0.78 and −0.89, respectively) and the hindlimbs (0.89 and −0.91, respectively). However, there was a relatively lower correlation of the BBB open field score with the BOS than with the stride length of the hindlimbs (r = 0.67 and r = −0.26, respectively). An explanation for this lower correlation could be that some of the animals in our study, especially at the later timepoints, had already reached complete weight-bearing in the BBB locomotor rating, while the percentage of preserved tissue did not have this ceiling effect. Although the stride length and the BOS are two well-recognized CatWalk XT® parameters, some researchers have called for their more specified and precise use, outside of general locomotion assessment [1,19,21,44,46,47,48,49]. As an example, Neckel et al. elaborated that stride length and BOS could alter depending on the velocity of the animal and offered a body coordinate frame to optimize the evaluation of those parameters with the context of the body [50].
Judging from our current results, the impairment and recovery of the CatWalk XT® parameter average speed after SCI followed a similar tendency of spontaneous recovery as the other parameters. However, as can be observed in Figure 2B, the variation of the average speed measurements over the course of the experiment was relatively high, even in the Sham group, leading to a relatively poor correlation with the BBB open field score (r = 0.57) as well as the percentage of preserved tissue (r = 0.34). We assume, that this variation is related to the random differences in passing speeds among runs of the Sham and SCI animals over the CatWalk XT® walkway, which we noticed when acquiring these data. Compared to the average speed parameter, the swing speed is a single-limb based CatWalk XT® parameter designed with less variation between animals, regarding absolute velocity [23]. Accordingly, the correlation of the swing speed with the other measurements in our study was considerably higher (HL swing speed vs. BBB: r = 0.73, FL swing speed vs. preserved tissue: r = 0.98, HL swing speed vs. preserved tissue: r = 0.84).
The ability of the CatWalk XT® gait analysis system to assess a variety of single paw/print parameters is seen as one of its major advantages as a behavioral test in preclinical SCI research. Thereby, the print intensity, the print area (including print width and length) as well as the maximum contact area are key parameters described in multiple SCI-related studies [22,51,52]. The CatWalk XT® parameter print intensity measures the stepping pressure, directly reflecting the weight bearing as a part of the locomotion function, while the print area indicates the relative force during locomotion. What is more, an increased print intensity or area has been attributed to improved fine motor digit function and trunk stability [20,21]. Accordingly, in our study, the print intensity parameters, compared to the print scale parameters, reflected an earlier onset of spontaneous recovery after SCI, and had a better correlation with the percentage of preserved tissue (Figure 9). However, their correlation with the BBB open field scores was generally poorer. While this inconsistency is difficult to explain, it might be associated with the fact that the BBB open field rating scale is not a linear-based system, in which each different point has a significantly different meaning. Our current results, therefore, underline that the print intensity parameters might have a better capability to discriminate the level of spontaneous recovery after a cervical contusion/compression SCI. This notion might be supported by findings that showed a correlation of decreased print intensity with increased mechanical allodynia in rodent neuropathic pain models [51,52].
Researchers have been seeking more objective methods to assess rodent locomotor function by integrating the results of different behavioral tests. To this end, linear regression analyses have been used to explain the relationship between different measurements in several studies: Crowley et al. created a scaling system to assess locomotor recovery in an impact SCI model at the T11 level in mice, which they named “Combined CatWalk Index”, by combining all 104 CatWalk XT® parameters into a single score. They used linear regression analyses to assess the relationship between the CatWalk XT® parameters and Basso mouse scale open field scores and stated that the resulting R2 values represented the “power” of the correlation [53]. Moreover, to evaluate the sensitivity of different behavioral tests after a dorsal hemi-transsection SCI model in rats, Fagoe et al. aimed to correlate results from e.g., the tape removal test, the rope crossing test, the horizontal ladder, and the inclined rolling ladder with the CatWalk XT® gait analysis using linear regression analyses as well [54]. However, from a statistical point of view, linear regression analyses which are typically used for prediction and not for correlation might not have been the best approach in this context, because the relationship between the CatWalk XT® parameters and other measurements can at least not be deemed causal. Instead of using a linear regression model, we, therefore, determined Spearman correlation coefficients for the CatWalk XT® parameters and the BBB open field scores, to validate and underline the equivalence of the CatWalk XT® analysis as a behavioral test after severe cervical contusion/compression SCI. In addition, we examined the relationship between the CatWalk XT® parameters and the percentage of preserved tissue as a histological assessment. Our corresponding findings with more CatWalkXT® parameters showing a very strong correlation with the percentage of tissue preservation compared to the BBB open field score (80% vs. 6.3%) indicate, in an even more objective way, that the CatWalk XT® gait analysis might have a high value as a behavioral test in the assessment of locomotion recovery after rodent SCI.
Nevertheless, a deeper understanding of these CatWalk XT® parameters is merited. For example, the random variation of the passing velocity of the animals over the CatWalk XT® walkway could influence the stability of the average speed parameter and other comprehensively used parameters, such as the stride length and the base of support, themselves. To further improve the validation of the CatWalk XT® gait analysis, more well-established behavioral tests should be included in future studies, correlating the CatWalk XT® with more measurements such as, especially for cervical SCI models, forelimb tasks like the grip strength test. Moreover, the correlation of the CatWalk XT® gait analysis with histological changes should be improved by adding additional assessments focusing e.g., on inflammation and timepoints in also the acute or subacute stages after SCI.
5. Conclusions
In conclusion, our data support the notion that the CatWalk XT® gait analysis can be seen as an objective and consistent tool for assessing the impairment and recovery of locomotor function after severe cervical contusion/compression SCI in rats. The CatWalk XT® parameters we used did not only reflect the spontaneous recovery after the injury. They also had a generally high correlation with the widely used scaling system of the BBB open field score, and especially with the histological assessment of the percentage of preserved tissue. We found that among static CatWalk XT® parameters, the print intensity parameters showed an early onset of a significant improvement in both, the forelimbs and the hindlimbs during the process of spontaneous recovery. On the other hand, kinematic parameters, such as the regularity index, the stride length, the swing speed, and the average speed, which are more dependent on the recovery of general locomotion and coordination of the animals, discriminated a significant recovery in the later stages 5–6 weeks after the injury. Among the kinematic parameters, the regularity index and the stride length showed a good correlation with the BBB open field scores and the percentage of preserved tissue, underlining their value for behavioral testing at later stages after SCI. Finally, among the CatWalk XT® parameters measuring the speed of the animals, the swing speed demonstrated a superiority compared to the body speed and the average speed with less variation and better correlation with the BBB open field scores and the percentage of preserved tissue.
Author Contributions
Conceptualization, G.Z. and A.Y.; methodology, G.Z., A.Y., M.S., L.R., T.S. and K.Z.; software, G.Z., A.Y., M.S. and L.R.; validation, G.Z., A.Y., T.S. and K.Z.; formal analysis, G.Z. and A.Y.; investigation, G.Z., A.Y., M.S. and L.R.; resources, T.S., A.U. and K.Z.; data curation, G.Z., A.Y., L.R., T.S. and K.Z.; writing—original draft preparation, G.Z. and A.Y.; writing—review and editing, A.Y., M.S., L.R., J.W., T.S., A.U. and K.Z.; visualization, G.Z. and A.Y.; supervision, A.Y., T.S. and K.Z.; project administration, A.Y. and K.Z.; funding acquisition, A.U. and K.Z. All authors have read and agreed to the published version of the manuscript.
Funding
This research received no external funding.
Institutional Review Board Statement
All experiments met the requirements of “the animal protection law and animal research regulation of the Federal Republic of Germany” and were approved by the Animal Care Committee of the federal government (file reference G-211/15).
Informed Consent Statement
Not applicable.
Data Availability Statement
The data generated and/or analyzed during the current study are available from the corresponding author on reasonable request.
Acknowledgments
The authors acknowledge the help of Claudia Pitzer and Barbara Kurpiers from the Interdisciplinary Neurobehavioural Core (INBC) Facility at the University of Heidelberg with the neurobehavioural testing.
Conflicts of Interest
The authors declare no conflict of interest.
References
- Salewski, R.P.; Mitchell, R.A.; Li, L.; Shen, C.; Milekovskaia, M.; Nagy, A.; Fehlings, M.G. Transplantation of Induced Pluripotent Stem Cell-Derived Neural Stem Cells Mediate Functional Recovery Following Thoracic Spinal Cord Injury Through Remyelination of Axons. Stem Cells Transl. Med. 2015, 4, 743–754. [Google Scholar] [CrossRef] [PubMed]
- Jazayeri, S.B.; Beygi, S.; Shokraneh, F.; Hagen, E.M.; Rahimi-Movaghar, V. Incidence of traumatic spinal cord injury worldwide: A systematic review. Eur. Spine J. 2015, 24, 905–918. [Google Scholar] [CrossRef]
- Assinck, P.; Duncan, G.J.; Hilton, B.J.; Plemel, J.R.; Tetzlaff, W. Cell transplantation therapy for spinal cord injury. Nat. Neurosci. 2017, 20, 637–647. [Google Scholar] [CrossRef]
- Lee, B.B.; Cripps, R.A.; Fitzharris, M.; Wing, P.C. The global map for traumatic spinal cord injury epidemiology: Update 2011, global incidence rate. Spinal Cord 2014, 52, 110–116. [Google Scholar] [CrossRef] [PubMed]
- Mothe, A.J.; Tator, C.H. Review of transplantation of neural stem/progenitor cells for spinal cord injury. Int. J. Dev. Neurosci. 2013, 31, 701–713. [Google Scholar] [CrossRef] [PubMed]
- Shende, P.; Subedi, M. Pathophysiology, mechanisms and applications of mesenchymal stem cells for the treatment of spinal cord injury. Biomed. Pharmacother. 2017, 91, 693–706. [Google Scholar] [CrossRef]
- Brown, R.; DiMarco, A.F.; Hoit, J.D.; Garshick, E. Respiratory dysfunction and management in spinal cord injury. Respir. Care 2006, 51, 853–868. [Google Scholar]
- Gill, L.C.; Gransee, H.M.; Sieck, G.C.; Mantilla, C.B. Functional recovery after cervical spinal cord injury: Role of neurotrophin and glutamatergic signaling in phrenic motoneurons. Respir. Physiol. Neurobiol. 2016, 226, 128–136. [Google Scholar] [CrossRef] [PubMed]
- Kwon, B.K.; Okon, E.B.; Plunet, W.; Baptiste, D.; Fouad, K.; Hillyer, J.; Weaver, L.C.; Fehlings, M.G.; Tetzlaff, W. A systematic review of directly applied biologic therapies for acute spinal cord injury. J. Neurotrauma 2011, 28, 1589–1610. [Google Scholar] [CrossRef]
- Younsi, A.; Zheng, G.; Scherer, M.; Riemann, L.; Zhang, H.; Tail, M.; Hatami, M.; Skutella, T.; Unterberg, A.; Zweckberger, K. Treadmill training improves survival and differentiation of transplanted neural precursor cells after cervical spinal cord injury. Stem Cell Res. 2020, 45, 101812. [Google Scholar] [CrossRef]
- Zweckberger, K.; Ahuja, C.S.; Liu, Y.; Wang, J.; Fehlings, M.G. Self-assembling peptides optimize the post-traumatic milieu and synergistically enhance the effects of neural stem cell therapy after cervical spinal cord injury. Acta Biomater. 2016, 42, 77–89. [Google Scholar] [CrossRef] [PubMed]
- Wilcox, J.T.; Satkunendrarajah, K.; Zuccato, J.A.; Nassiri, F.; Fehlings, M.G. Neural precursor cell transplantation enhances functional recovery and reduces astrogliosis in bilateral compressive/contusive cervical spinal cord injury. Stem Cells Transl. Med. 2014, 3, 1148–1159. [Google Scholar] [CrossRef]
- Basso, D.M.; Beattie, M.S.; Bresnahan, J.C. A sensitive and reliable locomotor rating scale for open field testing in rats. J. Neurotrauma 1995, 12, 1–21. [Google Scholar] [CrossRef]
- Hamers, F.P.; Lankhorst, A.J.; van Laar, T.J.; Veldhuis, W.B.; Gispen, W.H. Automated quantitative gait analysis during overground locomotion in the rat: Its application to spinal cord contusion and transection injuries. J. Neurotrauma 2001, 18, 187–201. [Google Scholar] [CrossRef] [PubMed]
- Datto, J.P.; Bastidas, J.C.; Miller, N.L.; Shah, A.K.; Arheart, K.L.; Marcillo, A.E.; Dietrich, W.D.; Pearse, D.D. Female Rats Demonstrate Improved Locomotor Recovery and Greater Preservation of White and Gray Matter after Traumatic Spinal Cord Injury Compared to Males. J. Neurotrauma 2015, 32, 1146–1157. [Google Scholar] [CrossRef] [PubMed]
- Imani, S.; Zagari, Z.; Rezaei Zarchi, S.; Jorjani, M.; Nasri, S. Functional Recovery of Carbon Nanotube/Nafion Nanocomposite in Rat Model of Spinal Cord Injury. Artif. Cells Nanomedi. Biotechnol. 2016, 44, 144–149. [Google Scholar] [CrossRef] [PubMed]
- Dai, H.; Macarthur, L.; McAtee, M.; Hockenbury, N.; Das, P.; Bregman, B.S. Delayed rehabilitation with task-specific therapies improves forelimb function after a cervical spinal cord injury. Restor. Neurol. Neurosci. 2011, 29, 91–103. [Google Scholar] [CrossRef]
- Swinscow, T.; Campbell, M. Statistics at Square One. Br. Med. J. 1976, 1, 1240. [Google Scholar]
- Koopmans, G.C.; Deumens, R.; Honig, W.M.M.; Hamers, F.P.T.; Steinbusch, H.W.M.; Joosten, E.A.J. The assessment of locomotor function in spinal cord injured rats: The importance of objective analysis of coordination. J. Neurotrauma 2005, 22, 214–225. [Google Scholar] [CrossRef]
- Iwasaki, M.; Wilcox, J.T.; Nishimura, Y.; Zweckberger, K.; Suzuki, H.; Wang, J.; Liu, Y.; Karadimas, S.K.; Fehlings, M.G. Synergistic effects of self-assembling peptide and neural stem/progenitor cells to promote tissue repair and forelimb functional recovery in cervical spinal cord injury. Biomaterials 2014, 35, 2617–2629. [Google Scholar] [CrossRef]
- Garcia-Ovejero, D.; González, S.; Paniagua-Torija, B.; Lima, A.; Molina-Holgado, E.; De Nicola, A.F.; Labombarda, F. Progesterone reduces secondary damage, preserves white matter, and improves locomotor outcome after spinal cord contusion. J. Neurotrauma 2014, 31, 857–871. [Google Scholar] [CrossRef]
- Gensel, J.C.; Tovar, C.A.; Hamers, F.P.T.; Deibert, R.J.; Beattie, M.S.; Bresnahan, J.C. Behavioral and histological characterization of unilateral cervical spinal cord contusion injury in rats. J. Neurotrauma 2006, 23, 36–54. [Google Scholar] [CrossRef]
- Hamers, F.P.T.; Koopmans, G.C.; Joosten, E.A.J. CatWalk-assisted gait analysis in the assessment of spinal cord injury. J. Neurotrauma 2006, 23, 537–548. [Google Scholar] [CrossRef]
- Barrière, G.; Leblond, H.; Provencher, J.; Rossignol, S. Prominent role of the spinal central pattern generator in the recovery of locomotion after partial spinal cord injuries. J. Neurosci. 2008, 28, 3976–3987. [Google Scholar] [CrossRef]
- Lovely, R.G.; Gregor, R.J.; Roy, R.R.; Edgerton, V.R. Weight-bearing hindlimb stepping in treadmill-exercised adult spinal cats. Brain Res. 1990, 514, 206–218. [Google Scholar] [CrossRef]
- Barbeau, H.; Rossignol, S. Recovery of locomotion after chronic spinalization in the adult cat. Brain Res. 1987, 412. [Google Scholar] [CrossRef]
- Lovely, R.G.; Gregor, R.J.; Roy, R.R.; Edgerton, V.R. Effects of training on the recovery of full-weight-bearing stepping in the adult spinal cat. Exp. Neurol. 1986, 92, 421–435. [Google Scholar] [CrossRef]
- Reier, P.J.; Lane, M.A.; Hall, E.D.; Teng, Y.D.; Howland, D.R. Translational spinal cord injury research: Preclinical guidelines and challenges. Handb. Clin. Neurol. 2012, 109, 411–433. [Google Scholar] [CrossRef] [PubMed]
- Brennan, F.H.; Jogia, T.; Gillespie, E.R.; Blomster, L.V.; Li, X.X.; Nowlan, B.; Williams, G.M.; Jacobson, E.; Osborne, G.W.; Meunier, F.A.; et al. Complement receptor C3aR1 controls neutrophil mobilization following spinal cord injury through physiological antagonism of CXCR2. JCI Insight 2019, 4. [Google Scholar] [CrossRef] [PubMed]
- Huang, W.-C.; Kuo, W.-C.; Hsu, S.-H.; Cheng, C.-H.; Liu, J.-C.; Cheng, H. Gait analysis of spinal cord injured rats after delivery of chondroitinase ABC and adult olfactory mucosa progenitor cell transplantation. Neurosci. Lett. 2010, 472, 79–84. [Google Scholar] [CrossRef]
- Wang, J.-M.; Zeng, Y.-S.; Wu, J.-L.; Li, Y.; Teng, Y.D. Cograft of neural stem cells and schwann cells overexpressing TrkC and neurotrophin-3 respectively after rat spinal cord transection. Biomaterials 2011, 32, 7454–7468. [Google Scholar] [CrossRef] [PubMed]
- Metz, G.A.; Curt, A.; van de Meent, H.; Klusman, I.; Schwab, M.E.; Dietz, V. Validation of the weight-drop contusion model in rats: A comparative study of human spinal cord injury. J. Neurotrauma 2000, 17, 1–17. [Google Scholar] [CrossRef]
- Kjell, J.; Olson, L. Rat models of spinal cord injury: From pathology to potential therapies. Dis. Model. Mech. 2016, 9. [Google Scholar] [CrossRef] [PubMed]
- Yousefifard, M.; Rahimi-Movaghar, V.; Nasirinezhad, F.; Baikpour, M.; Safari, S.; Saadat, S.; Moghadas Jafari, A.; Asady, H.; Razavi Tousi, S.M.T.; Hosseini, M. Neural stem/progenitor cell transplantation for spinal cord injury treatment; A systematic review and meta-analysis. Neuroscience 2016, 322, 377–397. [Google Scholar] [CrossRef] [PubMed]
- Siegenthaler, M.M.; Tu, M.K.; Keirstead, H.S. The extent of myelin pathology differs following contusion and transection spinal cord injury. J. Neurotrauma 2007, 24, 1631–1646. [Google Scholar] [CrossRef]
- JC, F.; MG, F. The impact of age on mortality, impairment, and disability among adults with acute traumatic spinal cord injury. J. Neurotrauma 2009, 26. [Google Scholar] [CrossRef]
- Zweckberger, K.; Liu, Y.; Wang, J.; Forgione, N.; Fehlings, M.G. Synergetic use of neural precursor cells and self-assembling peptides in experimental cervical spinal cord injury. J. Vis. Exp. 2015, e52105. [Google Scholar] [CrossRef]
- Fink, K.L.; Cafferty, W.B.J. Reorganization of Intact Descending Motor Circuits to Replace Lost Connections after Injury. Neurotherapeutics 2016, 13, 370–381. [Google Scholar] [CrossRef]
- Rasmussen, R.; Carlsen, E.M. Spontaneous Functional Recovery from Incomplete Spinal Cord Injury. J. Neurosci. 2016, 36, 8535–8537. [Google Scholar] [CrossRef]
- Hilton, B.J.; Assinck, P.; Duncan, G.J.; Lu, D.; Lo, S.; Tetzlaff, W. Dorsolateral funiculus lesioning of the mouse cervical spinal cord at C4 but not at C6 results in sustained forelimb motor deficits. J. Neurotrauma 2013, 30, 1070–1083. [Google Scholar] [CrossRef]
- Jeong, M.; Plunet, W.; Streijger, F.; Lee, J.H.T.; Plemel, J.R.; Park, S.; Lam, C.K.; Liu, J.; Tetzlaff, W. Intermittent fasting improves functional recovery after rat thoracic contusion spinal cord injury. J. Neurotrauma 2011, 28, 479–492. [Google Scholar] [CrossRef] [PubMed]
- Kanno, H.; Pressman, Y.; Moody, A.; Berg, R.; Muir, E.M.; Rogers, J.H.; Ozawa, H.; Itoi, E.; Pearse, D.D.; Bunge, M.B. Combination of engineered Schwann cell grafts to secrete neurotrophin and chondroitinase promotes axonal regeneration and locomotion after spinal cord injury. J. Neurosci. 2014, 34, 1838–1855. [Google Scholar] [CrossRef] [PubMed]
- Hunanyan, A.S.; Petrosyan, H.A.; Alessi, V.; Arvanian, V.L. Combination of chondroitinase ABC and AAV-NT3 promotes neural plasticity at descending spinal pathways after thoracic contusion in rats. J. Neurophysiol. 2013, 110, 1782–1792. [Google Scholar] [CrossRef] [PubMed][Green Version]
- Singh, A.; Balasubramanian, S.; Murray, M.; Lemay, M.; Houle, J. Role of spared pathways in locomotor recovery after body-weight-supported treadmill training in contused rats. J. Neurotrauma 2011, 28, 2405–2416. [Google Scholar] [CrossRef] [PubMed]
- van Gorp, S.; Leerink, M.; Nguyen, S.; Platoshyn, O.; Marsala, M.; Joosten, E.A. Translation of the rat thoracic contusion model; part 2—forward versus backward locomotion testing. Spinal Cord 2014, 52, 529–535. [Google Scholar] [CrossRef]
- Petrosyan, H.A.; Hunanyan, A.S.; Alessi, V.; Schnell, L.; Levine, J.; Arvanian, V.L. Neutralization of inhibitory molecule NG2 improves synaptic transmission, retrograde transport, and locomotor function after spinal cord injury in adult rats. J. Neurosci. 2013, 33, 4032–4043. [Google Scholar] [CrossRef]
- Joosten, E.A.J.; Veldhuis, W.B.; Hamers, F.P.T. Collagen containing neonatal astrocytes stimulates regrowth of injured fibers and promotes modest locomotor recovery after spinal cord injury. J. Neurosci. Res. 2004, 77, 127–142. [Google Scholar] [CrossRef]
- Lankhorst, A.J.; ter Laak, M.P.; van Laar, T.J.; van Meeteren, N.L.; de Groot, J.C.; Schrama, L.H.; Hamers, F.P.; Gispen, W.H. Effects of enriched housing on functional recovery after spinal cord contusive injury in the adult rat. J. Neurotrauma 2001, 18, 203–215. [Google Scholar] [CrossRef]
- Van Meeteren, N.L.U.; Eggers, R.; Lankhorst, A.J.; Gispen, W.H.; Hamers, F.P.T. Locomotor recovery after spinal cord contusion injury in rats is improved by spontaneous exercise. J. Neurotrauma 2003, 20, 1029–1037. [Google Scholar] [CrossRef]
- Weder, N.; Zhang, H.; Jensen, K.; Yang, B.Z.; Simen, A.; Jackowski, A.; Lipschitz, D.; Douglas-Palumberi, H.; Ge, M.; Perepletchikova, F.; et al. Child abuse, depression, and methylation in genes involved with stress, neural plasticity, and brain circuitry. J. Am. Acad. Child Adolesc. Psychiatry 2014, 53, 417–424. [Google Scholar] [CrossRef]
- Forgione, N.; Karadimas, S.K.; Foltz, W.D.; Satkunendrarajah, K.; Lip, A.; Fehlings, M.G. Bilateral contusion-compression model of incomplete traumatic cervical spinal cord injury. J. Neurotrauma 2014, 31, 1776–1788. [Google Scholar] [CrossRef] [PubMed]
- Vrinten, D.H.; Hamers, F.F.T. “CatWalk” automated quantitative gait analysis as a novel method to assess mechanical allodynia in the rat; a comparison with von Frey testing. Pain 2003, 102, 203–209. [Google Scholar] [CrossRef]
- Crowley, S.T.; Kataoka, K.; Itaka, K. Combined CatWalk Index: An improved method to measure mouse motor function using the automated gait analysis system. BMC Res. Notes 2018, 11, 263. [Google Scholar] [CrossRef] [PubMed]
- Fagoe, N.D.; Attwell, C.L.; Eggers, R.; Tuinenbreijer, L.; Kouwenhoven, D.; Verhaagen, J.; Mason, M.R.J. Evaluation of Five Tests for Sensitivity to Functional Deficits following Cervical or Thoracic Dorsal Column Transection in the Rat. PLoS ONE 2016, 11, e0150141. [Google Scholar] [CrossRef] [PubMed]
Publisher’s Note: MDPI stays neutral with regard to jurisdictional claims in published maps and institutional affiliations. |
© 2021 by the authors. Licensee MDPI, Basel, Switzerland. This article is an open access article distributed under the terms and conditions of the Creative Commons Attribution (CC BY) license (https://creativecommons.org/licenses/by/4.0/).