Article

Wildlife Monitoring Using a Multi-UAV System with Optimal Transport Theory

Department of Mechanical Engineering, New Mexico Institute of Mining and Technology, Socorro, NM 87801, USA
*
Author to whom correspondence should be addressed.
Appl. Sci. 2021, 11(9), 4070; https://doi.org/10.3390/app11094070
Submission received: 19 March 2021 / Revised: 1 April 2021 / Accepted: 23 April 2021 / Published: 29 April 2021
(This article belongs to the Special Issue Cutting-Edge Technologies of the Unmanned Aerial Vehicles (UAVs))

Abstract

:
This paper addresses a wildlife monitoring problem using a team of unmanned aerial vehicles (UAVs) with the optimal transport theory. The state-of-the-art technology using UAVs has been an increasingly popular tool to monitor wildlife compared to the traditional methods such as satellite imagery-based sensing or GPS trackers. However, there still exist unsolved problems as to how the UAVs need to cover a spacious domain to detect animals as many as possible. In this paper, we propose the optimal transport-based wildlife monitoring strategy for a multi-UAV system, to prioritize monitoring areas while incorporating complementary information such as GPS trackers and satellite-based sensing. Through the proposed scheme, the UAVs can explore the large-size domain effectively and collaboratively with a given priority. The time-varying nature of wildlife due to their movements is modeled as a stochastic process, which is included in the proposed work to reflect the spatio-temporal evolution of their position estimation. In this way, the proposed monitoring plan can lead to wildlife monitoring with a high detection rate. Various simulation results including statistical data are provided to validate the proposed work. In all different simulations, it is shown that the proposed scheme significantly outperforms other UAV-based wildlife monitoring strategies in terms of the target detection rate up to 3.6 times.

1. Introduction

Over decades, biodiversity has been threatened by several factors such as land-use change and habitat fragmentation, overhunting, invasive species, and environmental change. According to [1], 25% of all mammal species are in danger due to the above factors. This necessitates informed management of wildlife to maintain biodiversity as well as to prevent the extinction of some species. Traditionally, ground-based surveys have been widely adopted to assess and monitor wildlife biodiversity, which is time-consuming, financially expensive, and logistically challenging in remote areas [2]. Due to the high cost, surveys have not been conducted at the frequency required for proper analysis and monitoring of population trends [3]. Moreover, some areas may not be easy to collect data because of difficult and inaccessible terrains [4].
As an alternative, ecologists, conservation researchers, and practitioners have utilized satellite imagery-based remote sensing associated with a geographic information system (GIS) for the monitoring purpose of wildlife to cope with prevailing environmental challenges. Unfortunately, this type of remote sensing technology might not be ideal for accurate wildlife monitoring at the landscape level due to its obvious disadvantages: limited time to observe a certain area and low resolutions for satellite images. Moreover, persistent cloud cover may obscure the satellite remote sensing unexpectedly [5].
Deploying GPS collars on the target animals is another way to identify detailed wildlife movements. This method itself is, however, known to be costly and time-consuming with a lot of human efforts. In [6], the total cost of activities to capture animals, deploy GPS collars, and analyze data are more than $300,000 in a year only in the state of Colorado, USA. Also, the GPS trackers used to track the animals have some drawbacks such as intermittent GPS data transmission due to the limited energy of the device, unavailability of the GPS tracker depending on their locations, and partial information without details (e.g., population size, age and gender ratios, foraging strategies, etc.).
Other technologies to monitor wildlife include camera traps [7,8], acoustic recording devices [9,10], environmental DNA monitoring for tracking community composition [11,12], and genetic monitoring for identifying individuals within populations [13]. These methods alone are not effective as they cannot cover a wide range and the installation of sensors requires some preliminary data to choose proper locations.
Thus, there have been attempts to utilize the new technology using unmanned aerial vehicles (UAVs), or equivalently drones, in order to efficiently gather more detailed data with less time and cost [14,15,16,17]. In general, UAVs are referred to as aircraft piloted by remote control or embedded computer programs without human onboard as broadly defined in [18,19]. It has been reported that UAV-based sensing is an increasingly popular and promising conservation tool in ecological monitoring [20,21,22]. The data from UAVs can provide useful information for timely management responses [23]. The UAVs can be deployed quicker than manned airplanes [24] and are known to be less sensitive to ground survey techniques for wildlife monitoring [25]. As a consequence, many researchers and ecologists applied the UAV technologies to supplementing the conventional techniques for monitoring, conservation, and management practices [25,26,27].
Despite many advantages of UAV-based monitoring, detecting animal herds using UAVs is still a challenging problem due to the large domain size, limited energy of UAVs, and wildlife movements. Further, no systematized approaches have been developed in efforts to incorporate other complementary monitoring tools (e.g., GPS trackers) in the UAV-based monitoring. To tackle the above problem, this paper investigates a new wildlife monitoring scheme using a multi-UAV system. We develop the optimal transport-based multi-UAV monitoring strategy that prioritizes the monitoring areas by reflecting partial information such as GPS trackers. The major contributions of this paper are summarized as follows. Based on the optimal transport theory, we formulate the multi-UAV monitoring problem to increase the detection rate of animal herds, particularly medium-to-large mammals having group behavior like deer. This problem setup includes which area needs to be monitored as well as how a team of UAVs cover the spacious domain collaboratively. The control algorithm for the team of UAVs is then developed under the proposed optimal transport framework. The time-varying nature of the wildlife location is incorporated into the proposed plan, dramatically increasing the detection rate. The proposed scheme has the potential to significantly improve the wildlife detection rate while saving time, costs, and resources by incorporating complementary information (e.g., GPS tracker, camera traps, and acoustic recording devices) into the monitoring plan.
The rest of this paper is organized as follows. Section 2 describes the problem to solve for the wildlife monitoring problem with a theoretical background on the optimal transport theory. The main results are provided in Section 3, which includes animal movement modeling, optimal transport-based multi-UAV monitoring strategy, sample point propagation, and other monitoring methods for performance comparison. To support our proposed works, various simulation results are presented in Section 4. Finally, Section 5 concludes the paper.

2. Problem Description and Theoretical Background

A set of real and natural numbers are denoted by R and N , respectively. Further, N 0 = N { 0 } . The symbols · and T , respectively, denote the Euclidean norm and the transpose operator. The symbol R ( x , r ) represents a set of points within the circle centered at x with a radius r. The symbol # indicates the cardinality of a given set. The variable t N 0 is used to denote a discrete-time index.
Suppose that a team of UAVs is deployed to monitor wildlife as shown in Figure 1. Due to the time-varying nature of wildlife locations, it is not an easy task to detect animal herds using a team of UAVs even if locational information is available from the GPS trackers. The GPS trackers only provide limited information with intermittent data to save the battery. The size of the domain is another factor obstructing the detection of animal herds as it is in general very spacious. Moreover, UAVs have limited energy and thus, are not able to cover the entire domain because of its huge size.
Throughout the paper, we assume that the locations of UAVs are accurately known by GPS signals. Also, it is assumed that the UAVs can detect animals during the monitoring mission via onboard image processing such as machine learning technology. Although the animal recognition and detection problem itself is another important research area for wildlife monitoring, it is out of scope in this study. Rather, we are more interested in which areas the UAVs should cover to increase the wildlife detection rate, which is a challenging problem as stated above.
There needs a wildlife monitoring strategy using a multi-UAV system to maximize the wildlife detection rate. In this study, we propose that a team of UAVs search for animal herds reflecting the density distribution that describes the probability of finding animals in the domain. This density distribution can be constructed from the last-received GPS tracker information or satellite images. In this case, the UAVs should spend more time on the high probability area while exploring the low probability area with less time since the probability of the given distribution indicates how likely the UAVs can find animals. As animals do not necessarily stay at one location and move around the domain, the density distribution also needs to change for the spatio-temporal evolution of the distribution.
Looking from the above perspective, the proposed wildlife monitoring strategy must address the following research questions: (1) what is the proper metric to measure the similarity between the distribution formed by the trajectories of UAVs and the given density distribution? (2) what is the control method for the team of UAVs to achieve the similarity between the two distributions? (3) how to incorporate the spatio-temporal evolution of the given density distribution for the wildlife movement into the control method?
Regarding the first question, we introduce the Optimal Transport (OT) problem. Traditionally, the objective of the optimal transport is to obtain an optimal solution for a resource allocation problem [28], where the focus is to determine how a distribution can be transformed into another distribution with minimum effort. This minimum effort can be quantified using the Wasserstein distance for the continuous marginal case. This metric has been utilized in wide range of dynamical systems including system analysis [29,30,31] and controller synthesis [32,33] problems. The Wasserstein distance [28] of order p can be written in the following form.
  • Wasserstein distance:
W p ( μ , ν ) : = inf ψ Ψ ( μ , ν ) X × Y x y p d ψ ( x , y ) | ψ Ψ ( μ , ν ) 1 p ,
where ψ is a probability measure, Ψ ( μ , ν ) indicates the collection of all probability measure with marginals μ and ν on spaces X and Y, respectively and c ( x , y ) = x y p is the Euclidean distance with pth order ( p 1 ) between x R 2 and y R 2 (for two dimensional case). This Wasserstein distance (1) describes the least amount of effort required to convert one distribution μ into another one ν .
For the transportation problem in the discrete marginal case with μ and ν indicating particles of the given two distributions, the following linear programming (LP) formulation is equivalent to the Wasserstein distance where the given distributions are represented by the sample points.
  • Linear Programming problem: (for p = 1 )
minimize π i j i , j π i j x i y j subject to π i j 0 , j = 1 N π i j = m ( x i ) , i = 1 , 2 , , M , i = 1 M π i j = n ( y j ) , j = 1 , 2 , , N ,
where x i , y j R 2 are the locations sample points of the ensemble (for two-dimensional scenarios), m ( x i ) , n ( y j ) R are some non-negative constants representing the mass or weight assigned to each particle in the ensemble. The variable π i j denotes the transportation plan which indicates the amount of weight that needs to be delivered from x i to y j . Hence, the optimal transport plan π i j * can be interpreted as the minimum effort required to transport the mass from each x i to y j .
The Wasserstein distance in the LP form will be employed to measure the similarity between the two distributions, one from the trajectories of the UAVs and the other from the given reference distribution.
For the second research question, which is how to control the UAVs to achieve the similarity, the OT-based multi-UAV exploration strategy is proposed in Section 3.2 The formal procedure to generate a multi-UAV trajectory based on the OT theory is briefly describe in Figure 2). For the time-varying spatial distribution case associated with the third research question, we extend our results to the spatio-temporal distribution case in Section 3.3. Prior to further discussions on the proposed multi-UAV exploration scheme, the animal movement modeling is discussed first in the following section.

3. Method

3.1. Animal Movement Modeling

Among numerous different models to predict and model stochastic animal movement behavior, the simplest approach to explain the stochastic nature of the animal movement is the uncorrelated and unbiased random walk based on the Brownian motion. In this model, the animal movement directions are assumed to be uncorrelated—the current heading direction of the animal is not influenced by the previous heading directions and unbiased—the animal movement direction is not influenced by a specific direction or location. The location of the animal at any time is simply influenced by the previous location, and the heading direction at any time is completely random. However, due to the two biological constraints related to most animals: bilateral symmetry and cephalocaudal polarization (responsible for an animal’s tendency to move forward) according to [34], this simple random walk model is unable to represent a realistic animal movement behavior. Additionally, in many realistic scenarios, the animals are inclined to go to specific locations for food, shelter, migrations, etc., which also cannot be included in the uncorrelated and unbiased random walk models.
To incorporate the aforementioned biological constraints and global directional bias in the animal movement modeling, two separate random walk models were derived from the uncorrelated and unbiased random walk model: the Correlated Random Walk (CRW) and the Biased Random Walk (BRW).
The CRW model is developed under the assumption that there exists a correlation between consecutive heading directions of animals, which is defined as ‘persistence’. The persistence term explains local directional bias for an animal since the current heading direction is biased by the previous heading angle, which ensures that the animal intends to move in the forward direction. However, there exists some uncertainty associated with the heading directions, which results in making the heading direction different from the initial heading direction and therefore, the effect of the initial heading direction decreases in time.
In the BRW model, there exists global directional bias in the animal movement directions, meaning that an animal following the BRW model will intend to move towards a specific direction or a location at all times. This directional bias can be long term (annual migration) or short term (i.e., daily foraging for food) and the specific location for the directional bias be can be either moving (i.e., herd center) or stationary (i.e., food, water, shelter). Similar to the CRW model, there will be some uncertainty regarding the movement direction at any time although the animal will have a higher probability to move towards the target location or direction. Given that there exists some persistence in the direction of the animals while moving towards a specific direction, this special form of BRW is defined as the Biased-Correlated Random Walk (BCRW). Here, the animal movement direction at any time is influenced by both the previous heading direction (local directional bias) and the specific direction (global directional bias).
The Correlated Random Walk (CRW) model has been adopted in broad literature to explain individual behavior of stochastic movement for animals, fishes, insects, etc. [34,35,36,37,38]. In the meantime, this random walk model can hardly be utilized to replicate the group behavior of animal herds since this model cannot establish a link between individual animal movement direction and the overall herd location, which is essential for maintaining the integrity of animal herds.
An animal movement strategy to explain the group behavior of animal herds was proposed in [39], where the movement of the animal group centers was modeled using BCRW and the individual animal movements were followed by either CRW or BRW, where the animals for the BRW model were biased to the herd center. This study demonstrated that the group dynamics model can explain the group-influenced behavior of animals. In this work, a simplified version of [39] is implemented, where the center of the animal herds and individual animals in the herds follow CRW and BRW with a bias toward the herd center, respectively. The implemented model helps ensure the following: The members of the animal herds are biased to move towards the herd center, which ensures herd integrity. The herd centers and the overall herd maintain a stochastic free foraging behavior.
The CRW and BRW models employed in this paper to model the group behavior of animal herds are
  • Group center movement model (CRW):
u T + 1 = u T + [ r u , T + 1 cos ( θ u , T + 1 ) r u , T + 1 sin ( θ u , T + 1 ) ] Δ t θ u , T + 1 = θ u , T + v u , T + 1
  • Individual animal movement model (BRW):
z T + 1 q = z T q + [ r q , T + 1 cos ( θ q , T + 1 ) r q , T + 1 sin ( θ q , T + 1 ) ] Δ t θ q , T + 1 = arctan u y , T + 1 z y , T + 1 q u x , T + 1 z x , T + 1 q + v q , T + 1 ,
where T N is discrete time, u T = [ u x , T , u y , T ] is the herd center location, z T q = [ z x , T q , z y , T q ] is the qth animal position. Also, r ( · ) , T + 1 denote speeds of herd centers and individual animals, where r ( · ) , T + 1 Γ ( μ γ , σ γ ) are random variables with the gamma distribution Γ with a mean μ γ and standard deviation σ γ . To introduce randomness in movement directions of both herd centers and individual animals, the random variables v ( · ) , T + 1 are added to the heading directions θ ( · ) , T + 1 , where v ( · ) , T + 1 V ( μ v m , κ v m ) follow von Mises distribution V with a mean μ v m and concentration measure κ v m . The time interval between consecutive time steps is denoted by Δ t .

3.2. OT-Based Multi-UAV Exploration: Time-Invariant Case

This section presents a detailed explanation for the multi-UAV exploration strategy for the time-invariant distribution case. The extension to the time-varying case is provided in the next section. Given n a N numbers of UAVs deployed for the wildlife monitoring, the proposed exploration strategy is to determine the trajectory for the UAV k, k = 1 , , n a in the team. The OT-based multi-agent exploration strategy is developed considering the limited energy for the agents to carry out the monitoring mission with the given reference spatial distribution. This limited energy of the UAVs also limits the total flight time of the agents, which can be transformed into the total number of UAV points M a N for each agent by the specified velocity and discrete-time interval Δ t . Here, it is assumed that all agents have identical energy levels initially and therefore, the UAV points M a is the same across all agents. Given that the agent k has M a numbers of points, each UAV point is assumed to be uniformly distributed with the weight m ( x t k ) = 1 M a , t = 1 , , M a at any discrete-time t N . The weight m ( x t k ) is assigned to each UAV point, describing the time-averaged behavior of the UAVs.
Similar to the weights for each UAV point, the weights are uniformly assigned to each sample point in the given reference distribution. Given N N numbers of sample points, each sample point has the equal weight n t = 1 ( y j ) = 1 N initially. Unlike the weight of UAV points m ( x t k ) , the weights for sample points are time-dependent and decrease over time. This is because a sample point closely located to the UAV position can be considered as visited and hence, the sample point will lose its weight (priority) as the UAVs explore the given domain, which is reflected by the time-varying weight n t ( y j ) . This weight change for the sample points depends on the weight update law, which will be explained later in detail.
Consider that there are n a N numbers of agents deployed for the wildlife monitoring. In the beginning (when t = 1 ), all the UAV points { { x t k } t = 1 M } k = 1 n a are accumulated at the current positions { x t = 1 k } k = 1 n a . The UAVs move to new locations { x t = 2 k } k = 1 n a in the next discrete-time step t = 2 based on the proposed exploration strategy (which will be explain later in this section) and then, each of them leaves one particle at their previous locations { x t = 1 k } k = 1 n a while taking all the remaining UAV points { { x t k } t = 2 M } k = 1 n a with them to the new location { x t = 2 k } k = 1 n a . In this case, each of the previous UAV positions { x t = 1 k } k = 1 n a has the weight of m ( x t = 1 k ) = 1 M a and the weight for each new UAV position is m ( x t = 2 k ) = M a 1 M a . The schematic for this concept is illustrated in Figure 3.
The following assumption is provided to generalize this policy on the UAV point update.   
Assumption 1.
Given the current UAV position of agent k, x t = T k at any time T N , the weight m ( x t k ) , t = 1 , 2 , , T 1 , for the past UAV points is evenly distributed by 1 M a . The undetermined future UAV points { x t k } t = T + 1 M and the current UAV point of agent k are all accumulated in the current UAV position, x t = T k , which has remaining weights t = T M a 1 M a = M a T + 1 M a .
For notational ease, x t = T k will be replaced by x T k to indicate the position of agent k at time T when the meaning is clear. Next, we introduce the OT-based multi-UAV wildlife monitoring scheme under Assumption 1.

3.2.1. A Three-Stage Approach

During the monitoring mission, each agent follows the three-stage approach: the next goal point determination, the weight update, and the weight information exchange and update stage. Each stage is explained in detail as follows.
  • Next goal point ( g x T + 1 k ) determination stage:
Given that the agents are located at { x T k } k = 1 n a at any discrete-time step T N , the agents determine the next goal position for the next time step { g x T + 1 k } k = 1 n a as following. Each agent creates a circle with the center at the current agent location x T k and the initial radius r 0 . The radius of the circle increases incrementally by a radius increment δ until the agent finds h number of sample points within the circle. Then, the agent generates all possible trajectories connecting the sample points found in the circle, starting from the current agent position x T k . To generate the possible trajectories, each agent creates its own tree structure representing all candidate trajectories formed by connecting the sample points in the circle starting from the current agent position x T k . For h numbers of sample points within the search circle, a total of h ! trajectories can be generated by each agent in the tree structure. A schematic for the process to determine one possible trajectory is illustrated in Figure 4a and the complete tree structure is presented in Figure 4b (in this case, h = 3 ).
The sequence of sample points in lth candidate trajectory can be denoted by σ j l , j { 1 , 2 , , h } , where j indicates the sample point index and l { 1 , 2 , , h ! } is an index that represents a specific candidate trajectory in the tree structure. In the illustrative example provided in Figure 4b, the sequence of sample points in the third trajectory (when l = 3 ) is given by { σ j l = 3 } j = 1 3 = { y 2 , y 1 , y 3 } .
Once completed, the cost corresponding to each trajectory is calculated, where the cost function is defined to determine the local-optimal trajectory for kth agent as follows.
C k ( l ) = y σ 1 l x T k n T k ( y σ 1 l ) + j = 2 h y σ j l y σ j 1 l n T k ( y σ j l ) ,
where y σ j l , j = 1 , , h , denote the sample points found within the circle such that σ j 1 l σ j l and n T k ( y σ j l ) is the weight information of the sample points located within the circle known to agent k.
The cost function C k ( l ) in (5) is defined in this way to ensure that each agent follows a trajectory with a shorter travel length in terms of the total Euclidean distance as well as that connects the sample points y j with the high weights n T k ( y j ) in the circle first in order to drive the agent towards high priority sample points.
Given the definition of the h-step trajectory from time T + 1 to T + h for agent k, x T + 1 : T + h k : = { x T + 1 k , x T + 2 k , , x T + h k } , the candidate trajectory for the agent c x T + 1 : T + h k ( l ) , l = 1 , 2 , , h ! , can be obtained from the tree structure. From the candidate trajectories, the h-step local-optimal trajectory g x T + 1 : T + h k is determined by
g x T + 1 : T + h k = { c x T + 1 : T + h k ( l ) | l = argmin l C k ( l ) }
Each agent considers the first point of the h-step local-optimal trajectory g x T + 1 : T + h k as the next goal point g x T + 1 k in the next time step T + 1 and then, heads toward that location with the given UAV dynamics.
  • Weight update stage:
After arriving at a new location x T + 1 k , which may differ from the next goal point location g x T + 1 k , the agents update their own weight information n T + 1 k ( y j ) of the sample points y j from the weight update law given by
n T + 1 k ( y j ) = n T k ( y j ) π ( T + 1 ) j k , j
where π ( T + 1 ) j k denotes the optimal transport plan for agent k at time T + 1 depicting the weight distribution plan from the current agent position x T + 1 k to the sample points { y j } j = 1 N . The optimal transport plan can be obtained from the solution of the following LP problem.
minimize π ( T + 1 ) j k j π ( T + 1 ) j k x T + 1 k y j subject to π ( T + 1 ) j k 0 , j = 1 N π ( T + 1 ) j k = 1 M a , π ( T + 1 ) j k min n T k ( y j ) , 1 M a , j .
The optimal solution π ( T + 1 ) j k for the LP problem (8) provides the information about how much weight should be distributed from 1 M a for the new agent k position x T + 1 k to the sample point weight n T k ( y j ) for each sample point y j . Although all the new and future UAV points { x t k } t = T + 1 M a are concentrated at the new agent position x T + 1 k , agent k is allowed to distribute only the assigned weight 1 M a to the sample points { y j } j = 1 N . This is mainly because the future UAV points { x t } t = T + 2 M a are still undetermined and therefore, agent k can only distribute the weight for the future UAV points in the future time steps.
The first constraint in (8) ensures that the transport plan π ( T + 1 ) j from x T + 1 k to { y j } j = 1 N has a non-negative value. The second constraint is included to guarantee that the law of mass conversation is satisfied, meaning that the total weight distributed from the new agent position x T + 1 k for agent k and the weight received by the sample points { y j } j = 1 N , both must be the same. The last constraint guarantees that the transport plan π ( T + 1 ) j should not exceed the maximum weight capacities of the sample points and the UAV point. After calculating the optimal solution π ( T + 1 ) j k of (8), the weight of the sample points is updated by agent k using (7).
Since the new UAV location x T + 1 k for agent k is a single point, the analytical solution for (8) can be obtained by the following proposition.
Proposition 1.
The optimal solution for the LP problem (8) is obtained by repeating
π ( T + 1 ) j k = min n T k ( y j ) , m ( x T + 1 k ) , w h e r e j = arg min j { j | n T k ( y j ) > 0 } x T + 1 k y j m ( x T + 1 k ) = m ( x T + 1 k ) π ( T + 1 ) j k n T k ( y j ) = n T k ( y j ) π ( T + 1 ) j k
until m ( x T + 1 k ) becomes zero.
Proof. 
Given the new position of agent k at time T + 1 , x T + 1 k , the optimal transport plan for agent k is to deliver the maximum permissible weight to the closest points with positive weights in order until the weight m ( x T + 1 k ) remains positive.    □
  • Weight information exchange and update stage:
Once the weight update of the sample points is completed by all agents, this information is shared with the central agent that receives all information { { n T k ( y j ) } j = 1 N } k = 1 n a from agents and transmits the common value to them in every time step. The weight update process for the common weight n T ( y j ) is provided as follows:
n T ( y j ) = min ( n T k ( y j ) ) , k = 1 , 2 , , n a
This common weight information is transmitted to all agents at each time step. By sharing the common weight information, each UAV can know which areas are already covered by other UAVs. Thus, the team of UAVs can explore the given spacious domain effectively.

3.2.2. Algorithm

The formal algorithm of the OT-based multi-UAV exploration strategy is presented in Algorithm 1.
Algorithm 1 Multi-Agent Exploration Algorithm
1:
initialize x 1 k , y j , M a , N, r 0 , δ , h, n a , T 1
2:
while  T M a  do
3:
    each agent implements the following
4:
    for  k 1 to n a  do
5:
        initialize circle’s radius by r r 0
6:
        while  # R ( x T k , r ) h and n T k ( y j ) > 0  do
7:
            r r + δ
8:
        end while
9:
        calculate the cost function C k ( l ) associated with all possible candidate trajectories c x T + 1 : T + h k ( l )
10:
        obtain g x T + 1 k from (6)
11:
        update the UAV position x T k with the given UAV dynamics with the calculated next goal position g x T + 1 k
12:
        update the individual weight n T k ( y j ) by (7)
13:
    end for
14:
    the central agent
15:
          receives information about n T k ( y j ) from all agents
16:
          updates the common weight n T ( y j ) from (10)
17:
          transmits n T ( y j ) to all corresponding agents
18:
    each agent receives n T ( y j ) from the central agent and n T k ( y j ) n T ( y j )
19:
     T T + 1
20:
end while
At the beginning of the exploration, all parameters are initialized as in the first line of Algorithm 1. At any time T M a , each agent creates a circle centered at the current UAV position x T k and increases the circle radius r by δ until there are h number of sample points with positive weight in R ( x T k , r ) , which denotes the set of sample points located within the search circle centered at x T k and radius r. Next, a tree structure is generated by each agent for all possible trajectories connecting the sample points with positive weight located in the search circle, starting from the current UAV position x T k . Then, the cost for each trajectory is calculated from (5) and the next goal position g x T + 1 k is determined using (6). Once the next goal point is determined, the agent heads towards its corresponding goal point using its motion controller and moves to a new location x T + 1 k . After reaching a new location, each agent distributes 1 M a amount to weight to the sample points { y j } j = 1 N and updates the weight information n T k ( y j ) using (7). Then, the central agent receives the updated individual weight information n T k ( y j ) from other agents, updates the common weight information n T ( y j ) from (10), and transmits the common weight information to all agents. These procedures are performed in every time step T until the current time step T becomes M a .

3.3. Sample Point Generation and Propagation: Time-Varying Case

In the previous section, the OT-based multi-UAV exploration strategy is proposed for the time-invariant case, which is not appropriate for the animal herds wandering around their habitat. Therefore, the reference distribution (or the sample points) needs to be time-varying as well to reflect the time-varying nature of the animal herd locations. This section will provide the method to generate and propagate the sample points.
At any time T, let Z = { z T q } q = 1 G be the tracking information containing the locations of G numbers of tracked animals obtained by the GPS trackers. If the distance between any two tracked animals is within a specific distance given as a threshold, they are considered as the same herd. Otherwise, they will be members of different herds.
Since the animal herd locations are mostly unknown, clusters of sample points need to be assigned to the herds which are determined from the available tracking information. For the animal herd with tracked animals, its distribution is given as Gaussian distribution initially. The center of each distribution is assigned to the tracked animal locations in the herd. If more than one tracked animal is in the herd, the center of the corresponding Gaussian distribution is considered as the mean of the locations of the tracked animals. The covariance of the distribution is considered as a user-defined parameter.
The next step is to propagate the sample points for the estimation of the animal herds wandering around. To this end, the Correlated Random Walk model in (3) is employed to propagate each sample point, since the CRW model is associated with the drift of the animal herds. The variables u T + 1 , r u , T + 1 , θ u , T + 1 and v u , T + 1 in (3) can be replaced by variables y j , T + 1 , r j , T + 1 , θ j , T + 1 and v j , T + 1 , followed by the sample point propagation based on (3).
The sample point propagation using the CRW model alone cannot improve the performance of the monitoring as it does not incorporate an estimation correction procedure if the agents detect any animals during the monitoring mission. Hence, the center of the sample points associated with the herd of the detected animal is relocated to z T + τ q when an animal located at z T + τ q is detected by the UAV at time T + τ , where τ represents the time elapsed after the tracking information is received. After this relocation, the sample points in the distribution with the mean located at z T + τ q continue propagating using (3). As the proposed method is for the centralized scheme, the sample point propagation, animal herd detection, and sample point correction are shared with all agents through communication and information sharing.
Regarding the communication between UAVs, either air-to-air or air-to-ground wireless communications, several different communication technologies can be adopted such as direct link, satellite, ad hoc network, and cellular network (see [19] for more details of each technology). For example, the satellite-based communication technology provides global coverage, which might be useful for wildlife monitoring applications as it enables the multi-UAV system to communicate with each other through satellites even in remote areas without terrestrial network (e.g., Wi-Fi or cellular).

3.4. Other Exploration Strategy: Lawn Mower Method

For the performance comparison purpose, we introduce another monitoring strategy—lawn mower exploration scheme, one of the most widely used methods to explore the given domain. A description of the lawn mower exploration method is provided below.
In the lawn mower monitoring strategy, a single or multiple agents are tasked with exploring an area of interest uniformly in a zigzag manner. For the wildlife monitoring application, the exploration area can be determined from the tracked animal information. If multiple agents are deployed for exploration, then the exploration area is divided equally between multiple agents for independent but balanced exploration. Each agent generates equally spaced horizontal and vertical line segments to create waypoints and explores the assigned region uniformly as depicted in Figure 5.
Figure 5a provides the conceptual drawing to show how the exploration area is determined and Figure 5b illustrates the waypoint generation for the two-agent case. Given that G N numbers of animals are being tracked and the locations of these animals { z T q } q = 1 G at time T are known from the GPS trackers (presented as red triangle symbols in Figure 5a), the sets of x-coordinates and y-coordinates for these known animal locations are X a = { z x 1 , z x 2 , , z x G } and Y a = { z y 1 , z y 2 , , z y G } , respectively. Then, the parameters X m i n , Y m i n , X m a x , Y m a x to determine the initial search area (rectangular area ABCD in Figure 5a) can be calculated by
X m i n = m i n ( X a ) , Y m i n = m i n ( Y a ) X m a x = m a x ( X a ) , Y m a x = m a x ( Y a ) ,
where X m i n , X m a x R (or Y m i n , Y m a x R ) are the minimum and maximum x-coordinates (or y-coordinates) of the initial search area, respectively.
In practical scenarios, the base station for the team of UAVs may be located far away from the location of the detected animal herds by the GPS trackers. When the UAVs arrive at the last updated GPS locations, the animals may not be there anymore as they may have moved to another location. Thus, the monitoring domain should be expanded considering the time delay after dispatching a team of UAVs. The expansion will be given in both horizontal and vertical directions in an unbiased manner since the animal movement directions are completely unknown. The parameters X m i n , Y m i n , X m a x , Y m a x for the expanded search area (rectangular area A’B’C’D’ in Figure 5a) can be calculated from
X m i n = X m i n f X ( X m a x X m i n ) Y m i n = Y m i n f Y ( Y m a x Y m i n ) X m a x = X m a x + f X ( X m a x X m i n ) Y m a x = Y m a x + f Y ( Y m a x Y m i n ) ,
where X m i n , X m a x R (or Y m i n , Y m a x R ) denote the minimum and maximum value of the x-coordinates (or y-coordinates) of the expanded search area, respectively. Moreover, f X , f Y R are defined as the expansion factors in the horizontal and vertical directions, respectively.
Once the expanded search area is determined, the area is divided equally based on the number of agents n a N as shown in Figure 5b. The initial waypoint for each agent can be determined recursively as follows:
x 0 k = x 0 k 1 + X m a x X m i n n a , Y m i n k = 1 , 2 , , n a ,
where x 0 k 1 R is the x-coordinate of the initial position for ( k 1 ) th agent. For the first agent, x 0 1 = X m i n .
In this work, the total exploration area, which is the expanded search area, is partitioned vertically, meaning the range of the exploration region assigned to each agent in the vertical direction is the same as the range of the total exploration area in the same direction. Only the range of the exploration region assigned to each agent in the horizontal direction is limited, which varies from x 0 k to x 0 k + 1 for any agent k. For instance, the exploration region for agent 1 is limited by x 0 1 to x 0 2 in the horizontal direction and Y m i n to Y m a x in the vertical direction and the rest of the area is assigned to agent 2.
Next, the waypoints for each agent are provided in the following manner. The distance between two consecutive waypoints on the vertical line is given as d w and the spacing between two adjacent vertical line is denoted by d v . The parameters d w and d v can vary to adjust how densely the total exploration area needs to be monitored.

4. Simulation Results

In this section, various simulation results are presented to validate the effectiveness of the proposed multi-UAV wildlife monitoring scheme. Two major factors considered as simulation parameters are the number of agents and exploration time (caused by energy limit). To compare the performance of the OT-based multi-UAV monitoring scheme with time-varying spatial distribution OT (TV-Gauss), two other exploration strategies are employed: Lawn Mower method with time-invariant uniform exploration, LM (TI-Uni), and OT-based multi-UAV monitoring strategy with time-invariant uniform distribution, OT (TI-Uni). For all simulation scenarios, the unicycle robot dynamics is considered for the UAV dynamics. A brief description of the unicycle robot dynamics is provided below.

4.1. Unicycle Robot Dynamics

Given the UAV located at x T = [ x T , y T ] T with x T , y T R at any time T N , the UAV position for the next time step T + 1 is updated by using the following unicycle model:
x T + 1 = x T + v cos θ T + ω Δ t Δ t y T + 1 = y T + v sin θ T + ω Δ t Δ t θ T + 1 = θ T + Δ θ T ,
where v and ω denote the linear and angular velocity of the UAV, respectively, θ T and Δ θ T , respectively, indicate the heading angle and change of the heading angle for the UAV, and Δ t is the time interval between consecutive discrete-time steps.
From the current location x T at time T, if the next goal point is given by g x T + 1 , then the positional error is defined as x e = g x T + 1 x T and the required transnational velocity v to compensate the positional error can be determined by
v = K x · x e Δ t ,
where K x denotes the positional error gain.
Also, for the current heading angle error θ e = g θ T + 1 θ T , where g θ T + 1 = arctan g y T + 1 y T g x T + 1 x T , the angular velocity ω required for minimizing the heading angle error is obtained from the following equation.
ω = K θ · θ e Δ t ,
where K θ represents the angular error gain.

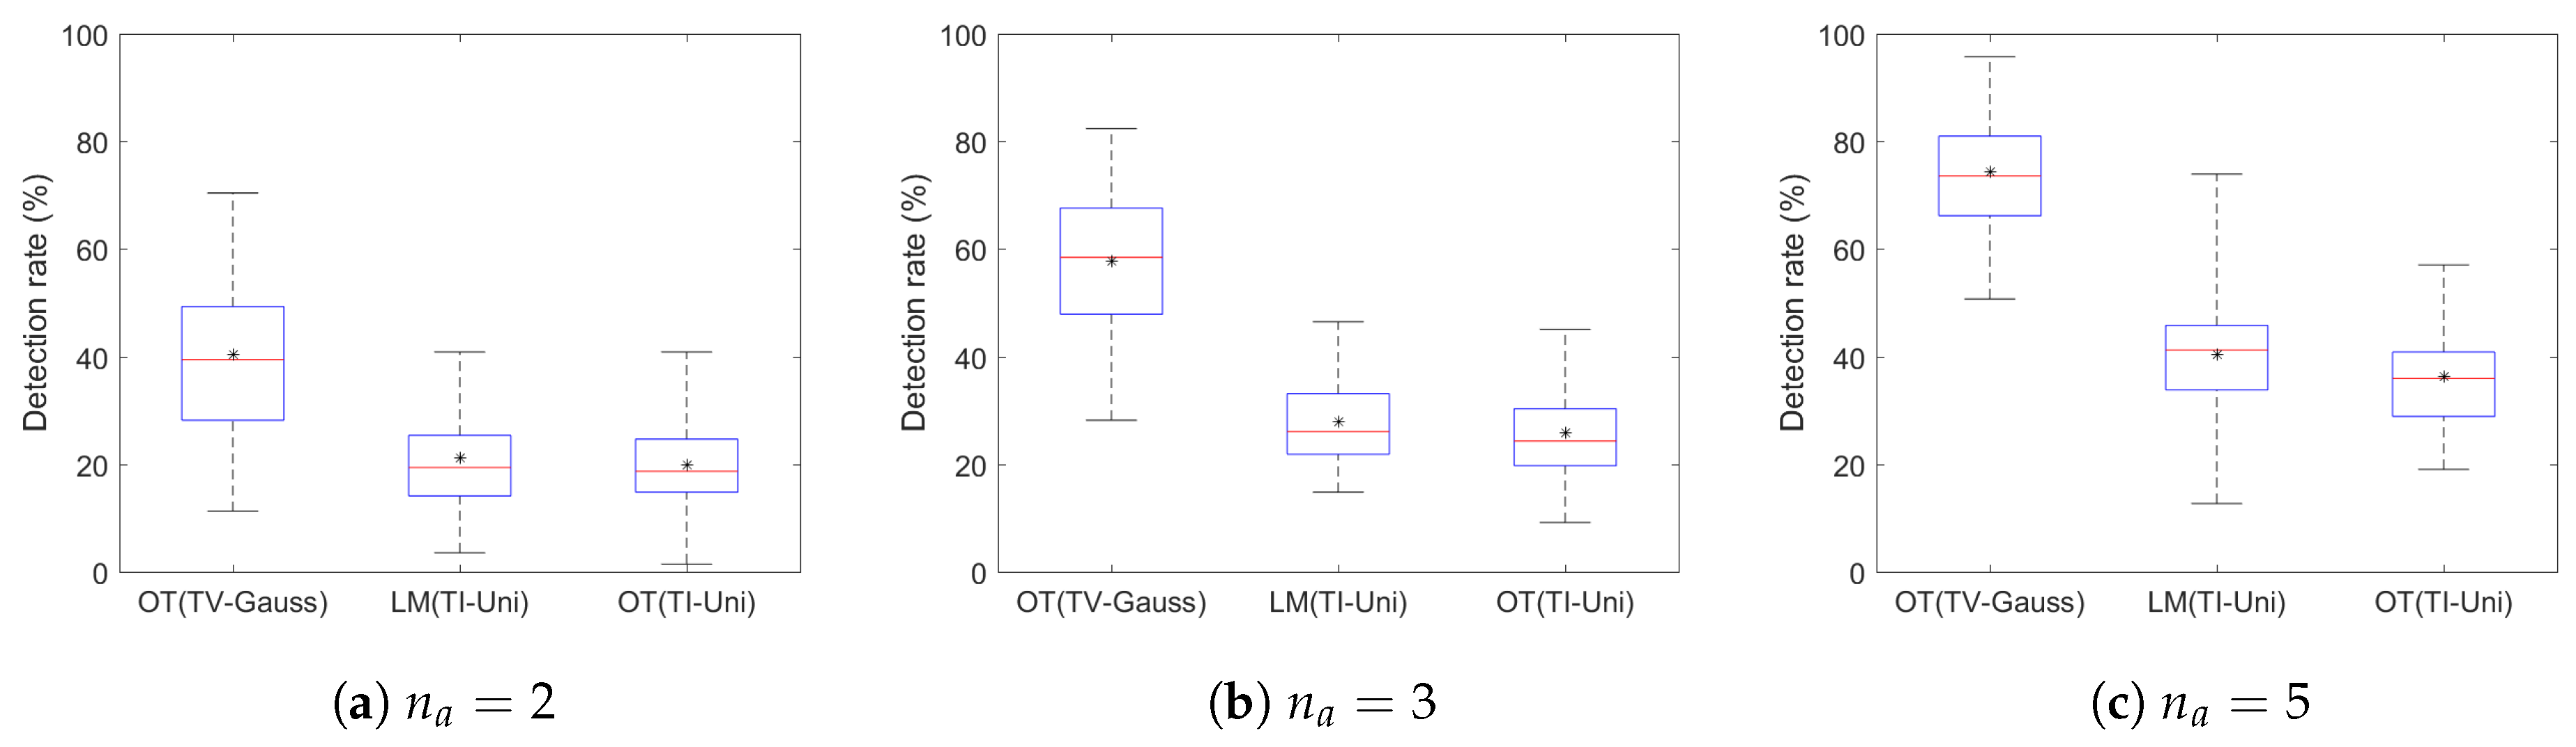
4.2. Variation in the Number of Agents

Since one of the parameters that significantly affect the monitoring performance (detection rate) is the number of agents, we test how the different number of UAVs results in the performance variation. The simulations were carried out with the following simulation parameters presented in Table 1, which also includes the major outputs of the simulations.
The time delay (or equivalently the traveling time) in this context indicates the total time for the UAVs to travel from the base station to the monitoring region. The UAVs are regarded as having a monitoring mission when they arrived at the predefined initial positions for the monitoring.
OT (TI-Uni) is implemented to compare the performance with the proposed scheme, OT (TV-Gauss). Similar to the Lawn Mower method, an initial rectangular exploration area for OT (TI-Uni) method is determined from the animal locations obtained from the GPS trackers by (11). Next, the total exploration area is determined from the initial search area using (12). Then, this area is filled with randomly generated sample points with uniform distribution. Based on this uniform sample point representation, multiple UAVs carry out the monitoring mission using the three-stage approach. All agents explore the monitoring area as a team, unlike the Lawn Mower method, where each agent is assigned to a pre-partitioned monitoring area.
The spacing between adjacent vertical line segments d v for LM (TI-Uni) varies with the number of agents such that the agents can cover most of their assigned monitoring regions within the given amount of time for exploration. With a higher number of agents, the area can be monitored thoroughly and therefore, d v decreases.
The discrete-time interval Δ t is assumed to be 1 s for all simulation scenarios. Hence, 900 s exploration time corresponds to 900 robot steps for all exploration strategies, meaning that the robot positions are updated using the implemented unicycle robot dynamics in every second.
For OT (TI-Uni), the initial UAV positions, the number of sample points N, the total number of UAV steps for each agent for exploration M a , h, r 0 and δ are the same as that for OT (TV-Gauss). Additionally, the parameters f X , f Y to determine the monitoring area for OT (TI-Uni) is identical to f X , f Y for LM (TI-Uni).
As the initially detected animal locations can be a critical factor affecting the performance (detection rate), a total of 30 simulations were carried out by randomly generating their detected locations in the beginning. The snapshots of one specific simulation for three different monitoring strategies are presented in Figure 6 as examples. This result illustrates how different the UAV trajectories are from each other. The following scenario is considered for all the simulation cases. Among a total of 142 animals in 9 herds, only 9 animals are being tracked via the GPS trackers at time T = 600 (600 s before the start of the monitoring mission). Since these tracker locations are the only available information, it is unknown which animal belongs to which herd and how many animals are there in each herd. The received tracker information is presented in Table 1 for the OT (TV-Gauss) method in Figure 6a–c. For the OT (TV-Gauss) method, the estimated animal herd center and tracked animals that belong to each herd number are given in Table 1 as well according to the proposed policy in Section 3.3.
We generated more numbers of sample distributions than the estimated numbers of animal herds. This is mainly because each herd location is unknown to the UAVs when they’ve arrived at the monitoring region and thus, more sample distributions with the proposed sample propagation method can better estimate the possible location of animal herds. If animals are detected by the UAV, then the sample distribution is relocated (both mean and covariance of the Gaussian) for the correction. Based on the proposed scheme for the OT (TV-Gauss) in Figure 6a–c, the UAVs detected total 53 animals out of 142 (detection rate: 37.32 % ). For LM (TI-Uni), a time-invariant rectangular monitoring area is obtained from (11) and (12) by using the tracker information. The agents start the monitoring mission from the locations determined by (13) after a 600 s time delay. The agents explored their assigned areas in a zigzag manner and finished the exploration 900 s after the monitoring started. The detection rate for LM (TI-Uni) in Figure 6d–f was 10.56 % . In the case of OT (TI-Uni), the detection rate in Figure 6g–i was 25.35 % .
To better compare the performance of each method, the statistical results for 30 simulation runs are presented in Figure 7, where the initial locations of detected animals were randomly generated in each run. The average detection rates for different numbers of agents are also presented in Table 1 to provide a better understanding of the effect of the number of UAVs on the exploration performance. Although it is observed that the performance of all the monitoring strategies has gradually improved by increasing the number of agents, the performance increase of LM (TI-Uni) and OT (TI-Uni) are less significant than OT (TV-Gauss). For all three scenarios in Figure 7, the proposed method OT (TV-Gauss) outperformed the other two methods. Notice that for all three scenarios, the UAVs had the same energy level (or alternatively the same UAV points) in the beginning for the fair comparison, however, the detection rate for the OT (TV-Gauss) method significantly overwhelmed the other two. Thus, it is verified that the proposed method is able to monitor wildlife effectively as the scheme can take into account the time-varying nature of wildlife locations in the monitoring plan and explore areas accordingly.

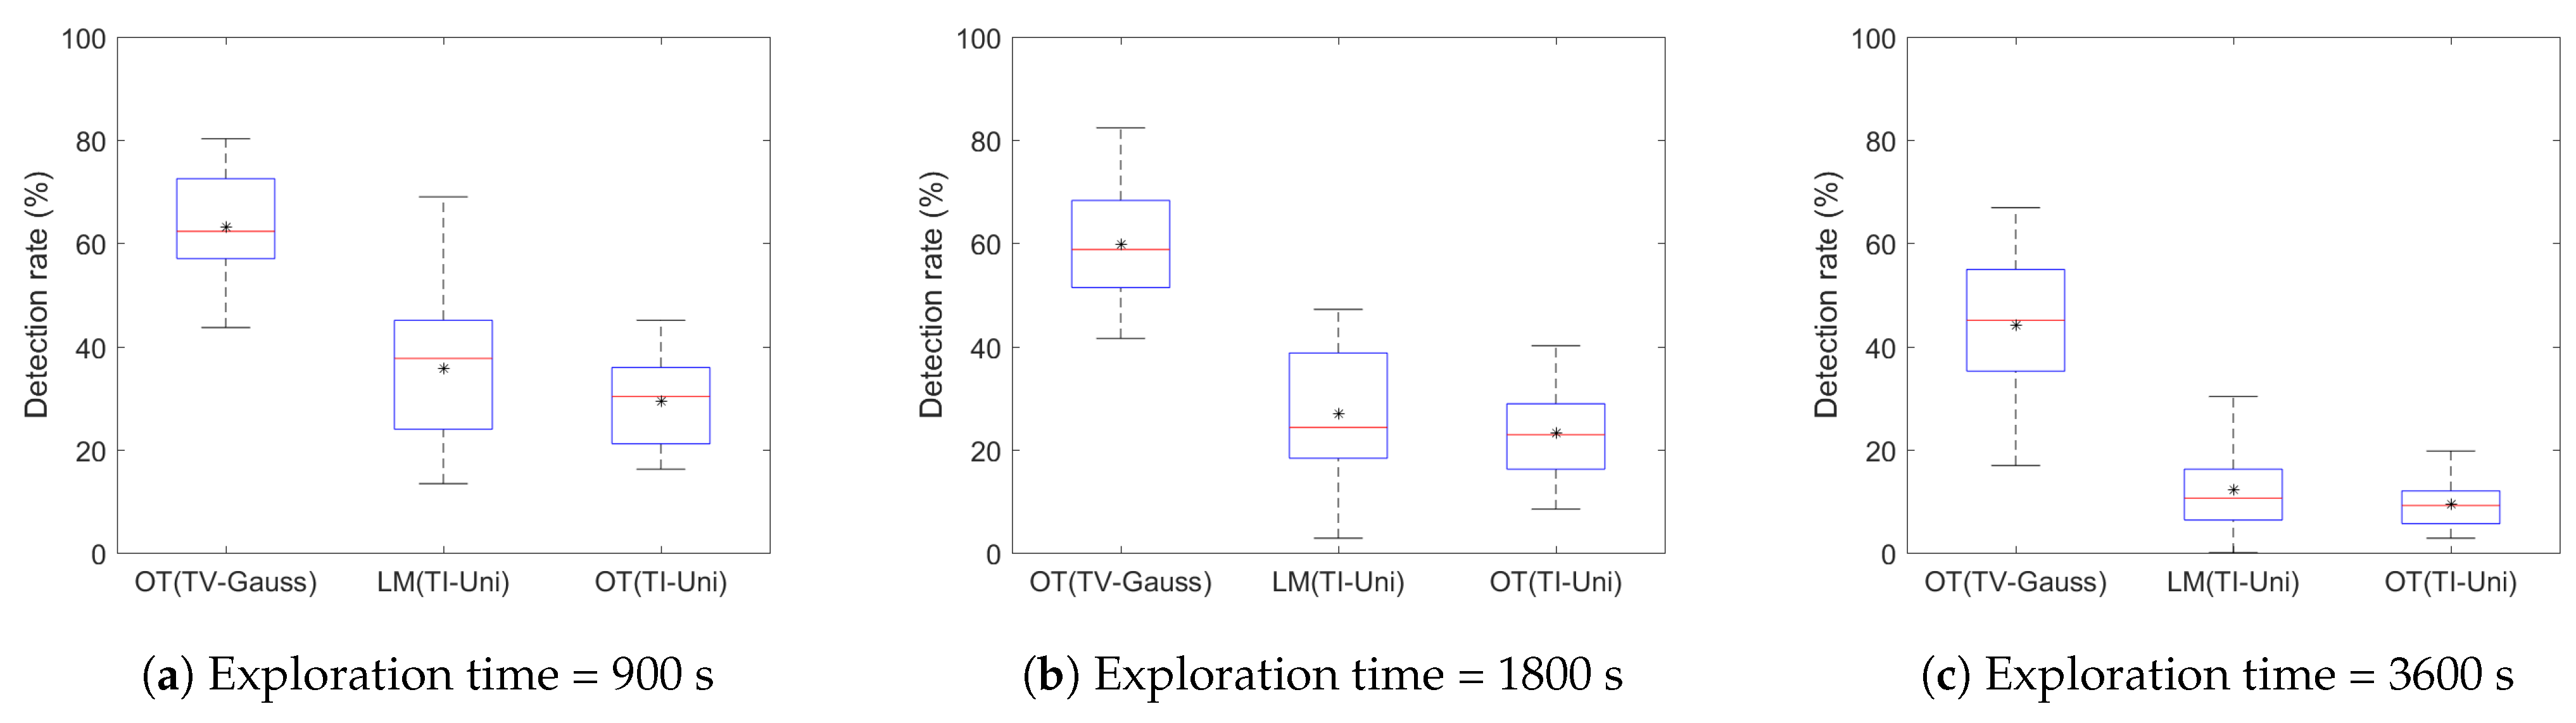
4.3. Variation in Exploration Time

In order to investigate the effect of exploration time on the performance, other simulations were conducted with the simulation parameters provided in Table 2. Since most of the simulation parameters for this case are identical to the parameters for the previous scenario, only the parameters different from the previous ones are provided in Table 2. The parameters f X , f Y and d v for LM (TI-Uni) are adjusted such that the UAVs can explore most of the regions within the corresponding exploration time.
Similar to the simulation for the variation in the number of agents, there are total of 9 tracked animals and 12 Gaussian sample point distributions are generated at the estimated herd centers and then, propagated in every time step. If an animal is detected by the UAVs, a sample distribution is assigned to the detected animal herd and the center of that distribution is relocated to the detected animal’s location. The snapshots of one particular simulation result (when the exploration time is 1800 s with a time delay of 600 s) are provided in Figure 8, to illustrate the UAV trajectories. For OT (TV-Gauss) in Figure 8a–c, the three UAVs detected a total of 93 animals out of 142 (detection rate: 65.49 % ), whereas the detection rate for LM (TI-Uni) and OT (TI-Uni) were 28.87 % and 10.56 % , respectively.
The statistical data for a total of 30 simulation runs are presented in Figure 9 for three different exploration times (900, 1800, and 3600 s). Also, the average detection rates for different exploration times are provided in Table 2. These results show that increasing the exploration time resulted in the decrease of the average detection rate for all monitoring strategies, which is because the domain size has increased as well with the exploration time increase. From the statistical data in Figure 9, it is clearly shown that OT (TV-Gauss) outperforms the other two strategies, where the time-varying scenarios cannot be incorporated. As a result, their animal detection rates are quite low compared to the proposed scheme OT (TV-Gauss). The average detection rate for OT (TV-Gauss) is up to 3.6 times higher than that for LM (TI-Uni) in the 3600 exploration time case. Therefore, these results demonstrate the effectiveness of the proposed method for the wildlife monitoring mission.

5. Conclusions

In this paper, a new wildlife monitoring strategy was proposed using a team of UAVs based on the optimal transport theory. The proposed works can incorporate complementary information such as GPS trackers into the plan, to increase the wildlife detection rate. Through the OT-based wildlife monitoring scheme, the UAV trajectories were generated enabling UAVs to collaboratively monitor the wildlife with a given priority. Moreover, the spatio-temporal evolution of animals’ locations was combined with the proposed monitoring scheme, leading to an increase in the wildlife detection rate. Numerous simulations were conducted with variation in the number of UAVs and exploration time while randomly generating the animal locations to validate the proposed method. The statistical data for numerously different scenarios demonstrated that the proposed wildlife monitoring scheme can result in high performance in terms of detection rate.
Although the satellite-based communication technology can be adopted for the global coverage, and hence centralized communication between UAVs, it is known that this type of communication device is heavy and bulky with high energy-consumption, reducing the capability of the multi-UAV system. Therefore, decentralized communication is more desirable because it is unnecessary for UAVs to have all-time communications between all of them during the monitoring mission. As future works, we will thus focus on the decentralized communication scheme to extend the capability of the proposed multi-UAV wildlife monitoring method.

Author Contributions

Conceptualization, K.L.; methodology, K.L.; software, R.H.K. and K.L.; validation, R.H.K. and K.L.; formal analysis, R.H.K. and K.L.; investigation, R.H.K. and K.L.; resources, R.H.K. and K.L.; data curation, R.H.K. and K.L.; writing—original draft preparation, K.L.; writing—review and editing, R.H.K. and K.L.; visualization, R.H.K. and K.L.; supervision, K.L.; project administration, K.L.; funding acquisition, K.L. All authors have read and agreed to the published version of the manuscript.

Funding

This work was supported by New Mexico NASA EPSCoR Research Infrastructure Development (RID) Program with Cooperative Agreement 80NSSC19M0181.

Institutional Review Board Statement

Not applicable.

Informed Consent Statement

Not applicable.

Data Availability Statement

Not applicable.

Conflicts of Interest

The authors declare no conflict of interest.

References

  1. Tilman, D.; Clark, M.; Williams, D.R.; Kimmel, K.; Polasky, S.; Packer, C. Future threats to biodiversity and pathways to their prevention. Nature 2017, 546, 73–81. [Google Scholar] [CrossRef]
  2. Gardner, T.A.; Barlow, J.; Araujo, I.S.; Ávila-Pires, T.C.; Bonaldo, A.B.; Costa, J.E.; Esposito, M.C.; Ferreira, L.V.; Hawes, J.; Hernandez, M.I.; et al. The cost-effectiveness of biodiversity surveys in tropical forests. Ecol. Lett. 2008, 11, 139–150. [Google Scholar] [CrossRef]
  3. Meijaard, E.; Wich, S.; Ancrenaz, M.; Marshall, A.J. Not by science alone: Why orangutan conservationists must think outside the box. Ann. N. Y. Acad. Sci. 2012, 1249, 29–44. [Google Scholar] [CrossRef] [PubMed]
  4. Palace, M.; Keller, M.; Asner, G.P.; Hagen, S.; Braswell, B. Amazon forest structure from IKONOS satellite data and the automated characterization of forest canopy properties. Biotropica 2008, 40, 141–150. [Google Scholar] [CrossRef]
  5. Stapleton, S.; LaRue, M.; Lecomte, N.; Atkinson, S.; Garshelis, D.; Porter, C.; Atwood, T. Polar bears from space: Assessing satellite imagery as a tool to track Arctic wildlife. PLoS ONE 2014, 9, e101513. [Google Scholar] [CrossRef]
  6. Mammals Program, Colorado Division of Wildlife. Year: July 2003–June 2004. Available online: https://spl.cde.state.co.us/artemis/nrserials/nr616internet/nr616200304internet.pdf (accessed on 15 March 2021).
  7. Zimmermann, F.; Foresti, D.; Rovero, F. Behavioural studies. Camera Trapping for Wildlife Research; Pelagic Publishing Ltd.: Exeter, UK, 2016; pp. 142–167. [Google Scholar]
  8. Murphy, A.J.; Goodman, S.M.; Farris, Z.J.; Karpanty, S.M.; Andrianjakarivelo, V.; Kelly, M.J. Landscape trends in small mammal occupancy in the Makira–Masoala protected areas, northeastern Madagascar. J. Mammal. 2017, 98, 272–282. [Google Scholar] [CrossRef]
  9. Alvarez-Berríos, N.; Campos-Cerqueira, M.; Hernández-Serna, A.; Amanda Delgado, C.; Román-Dañobeytia, F.; Aide, T.M. Impacts of small-scale gold mining on birds and anurans near the Tambopata Natural Reserve, Peru, assessed using passive acoustic monitoring. Trop. Conserv. Sci. 2016, 9, 832–851. [Google Scholar] [CrossRef] [Green Version]
  10. Deichmann, J.L.; Hernandez-Serna, A.; Campos-Cerqueira, M.; Aide, T.M. Soundscape analysis and acoustic monitoring document impacts of natural gas exploration on biodiversity in a tropical forest. Ecol. Indic. 2017, 74, 39–48. [Google Scholar] [CrossRef] [Green Version]
  11. Biggs, J.; Ewald, N.; Valentini, A.; Gaboriaud, C.; Dejean, T.; Griffiths, R.A.; Foster, J.; Wilkinson, J.W.; Arnell, A.; Brotherton, P.; et al. Using eDNA to develop a national citizen science-based monitoring programme for the great crested newt (Triturus cristatus). Biol. Conserv. 2015, 183, 19–28. [Google Scholar] [CrossRef]
  12. Valentini, A.; Taberlet, P.; Miaud, C.; Civade, R.; Herder, J.; Thomsen, P.F.; Bellemain, E.; Besnard, A.; Coissac, E.; Boyer, F.; et al. Next-generation monitoring of aquatic biodiversity using environmental DNA metabarcoding. Mol. Ecol. 2016, 25, 929–942. [Google Scholar] [CrossRef] [PubMed] [Green Version]
  13. Gray, M.; Roy, J.; Vigilant, L.; Fawcett, K.; Basabose, A.; Cranfield, M.; Uwingeli, P.; Mburanumwe, I.; Kagoda, E.; Robbins, M.M. Genetic census reveals increased but uneven growth of a critically endangered mountain gorilla population. Biol. Conserv. 2013, 158, 230–238. [Google Scholar] [CrossRef]
  14. Zanol, R.; Chiariotti, F.; Zanella, A. Drone mapping through multi-agent reinforcement learning. In Proceedings of the 2019 IEEE Wireless Communications and Networking Conference (WCNC), Marrakesh, Morocco, 15–18 April 2019; pp. 1–7. [Google Scholar]
  15. Li, X.; Huang, H.; Savkin, A.V. Use of A UAV Base Station for Searching and Bio-inspired Covert Video Surveillance of Tagged Wild Animals. In Proceedings of the 2020 IEEE Australian and New Zealand Control Conference (ANZCC), Gold Coast, QLD, Australia, 26–27 November 2020; pp. 87–90. [Google Scholar]
  16. Kellenberger, B.; Volpi, M.; Tuia, D. Fast animal detection in UAV images using convolutional neural networks. In Proceedings of the 2017 IEEE International Geoscience and Remote Sensing Symposium (IGARSS), Fort Worth, TX, USA, 23–28 July 2017; pp. 866–869. [Google Scholar]
  17. Caballero, L.C.; Saito, C.; Micheline, R.B.; Paredes, J.A. On the design of an UAV-based store and forward transport network for wildlife inventory in the western Amazon rainforest. In Proceedings of the 2017 IEEE XXIV International Conference on Electronics, Electrical Engineering and Computing (INTERCON), Cusco, Peru, 15–18 August 2017; pp. 1–4. [Google Scholar]
  18. Valavanis, K.P.; Vachtsevanos, G.J. Handbook of Unmanned Aerial Vehicles; Springer: Berlin/Heidelberg, Germany, 2015; Volume 1. [Google Scholar]
  19. Zeng, Y.; Wu, Q.; Zhang, R. Accessing from the sky: A tutorial on UAV communications for 5G and beyond. Proc. IEEE 2019, 107, 2327–2375. [Google Scholar] [CrossRef] [Green Version]
  20. Dufour, S.; Bernez, I.; Betbeder, J.; Corgne, S.; Hubert-Moy, L.; Nabucet, J.; Rapinel, S.; Sawtschuk, J.; Trollé, C. Monitoring restored riparian vegetation: How can recent developments in remote sensing sciences help? Knowl. Manag. Aquat. Ecosyst. 2013, 410, 10. [Google Scholar] [CrossRef]
  21. Evans, I.; Jones, T.H.; Pang, K.; Evans, M.N.; Saimin, S.; Goossens, B. Use of drone technology as a tool for behavioral research: A case study of crocodilian nesting. Herpetol. Conserv. Biol. 2015, 10, 90–98. [Google Scholar]
  22. Ivosevic, B.; Han, Y.G.; Cho, Y.; Kwon, O. The use of conservation drones in ecology and wildlife research. J. Ecol. Environ. 2015, 38, 113–118. [Google Scholar] [CrossRef] [Green Version]
  23. Lorah, P.; Ready, A.; Rinn, E. Using drones to generate new data for conservation insights. Int. J. Geospat. Environ. Res. 2018, 5, 2. [Google Scholar]
  24. Lu, B.; He, Y. Species classification using Unmanned Aerial Vehicle (UAV)-acquired high spatial resolution imagery in a heterogeneous grassland. ISPRS J. Photogramm. Remote Sens. 2017, 128, 73–85. [Google Scholar] [CrossRef]
  25. Chabot, D.; Bird, D.M. Wildlife research and management methods in the 21st century: Where do unmanned aircraft fit in? J. Unmanned Veh. Syst. 2015, 3, 137–155. [Google Scholar] [CrossRef] [Green Version]
  26. Koh, L.P.; Wich, S.A. Dawn of drone ecology: Low-cost autonomous aerial vehicles for conservation. Trop. Conserv. Sci. 2012, 5, 121–132. [Google Scholar] [CrossRef] [Green Version]
  27. Linchant, J.; Lisein, J.; Semeki, J.; Lejeune, P.; Vermeulen, C. Are unmanned aircraft systems (UAS s) the future of wildlife monitoring? A review of accomplishments and challenges. Mammal Rev. 2015, 45, 239–252. [Google Scholar] [CrossRef]
  28. Villani, C. Optimal Transport: Old and New; Springer Science & Business Media: Berlin/Heidelberg, Germany, 2008; Volume 338. [Google Scholar]
  29. Lee, K.; Halder, A.; Bhattacharya, R. Probabilistic robustness analysis of stochastic jump linear systems. In Proceedings of the 2014 IEEE American Control Conference (ACC), Portland, OR, USA, 4–6 June 2014; pp. 2638–2643. [Google Scholar]
  30. Lee, K.; Halder, A.; Bhattacharya, R. Performance and robustness analysis of stochastic jump linear systems using wasserstein metric. Automatica 2015, 51, 341–347. [Google Scholar] [CrossRef] [Green Version]
  31. Lee, K. Analysis of Large-Scale Asynchronous Switched Dynamical Systems. Ph.D. Thesis, Texas A & M University, College Station, TX, USA, 2015. [Google Scholar]
  32. Lee, K.; Bhattacharya, R. Optimal switching synthesis for jump linear systems with gaussian initial state uncertainty. In Proceedings of the ASME 2014 Dynamic Systems and Control Conference, San Antonio, TX, USA, 22–24 October 2014; American Society of Mechanical Engineers: San Antonio, TX, USA, 2014; p. V002T24A003. [Google Scholar]
  33. Lee, K.; Bhattacharya, R. Optimal controller switching for resource-constrained dynamical systems. Int. J. Control. Autom. Syst. 2018, 16, 1323–1331. [Google Scholar] [CrossRef]
  34. Bovet, P.; Benhamou, S. Spatial analysis of animals’ movements using a correlated random walk model. J. Theor. Biol. 1988, 131, 419–433. [Google Scholar] [CrossRef]
  35. Bergman, C.M.; Schaefer, J.A.; Luttich, S. Caribou movement as a correlated random walk. Oecologia 2000, 123, 364–374. [Google Scholar] [CrossRef]
  36. Halstead, B.J.; McCoy, E.D.; Stilson, T.A.; Mushinsky, H.R. Alternative foraging tactics of juvenile gopher tortoises (Gopherus polyphemus) examined using correlated random walk models. Herpetologica 2007, 63, 472–481. [Google Scholar] [CrossRef]
  37. Kadota, M.; Torisawa, S.; Takagi, T.; Komeyama, K. Analysis of juvenile tuna movements as correlated random walk. Fish. Sci. 2011, 77, 993–998. [Google Scholar] [CrossRef]
  38. Kareiva, P.; Shigesada, N. Analyzing insect movement as a correlated random walk. Oecologia 1983, 56, 234–238. [Google Scholar] [CrossRef] [PubMed]
  39. Langrock, R.; Hopcraft, J.G.C.; Blackwell, P.G.; Goodall, V.; King, R.; Niu, M.; Patterson, T.A.; Pedersen, M.W.; Skarin, A.; Schick, R.S. Modelling group dynamic animal movement. Methods Ecol. Evol. 2014, 5, 190–199. [Google Scholar] [CrossRef] [Green Version]
Figure 1. Illustration of wildlife monitoring using a team of UAVs.
Applsci 11 04070 g001
Figure 2. Procedure to generate the multi-UAV trajectory using the optimal transport theory.
Applsci 11 04070 g002
Figure 3. Schematic of UAV points with their relative locations at different time steps for two agents. Initial points: { x t = 1 k } k = 1 2 , past points: { { x t k } t = 2 T 1 } k = 1 2 , and current and future points: { { x t } t = T M a } k = 1 2 .
Applsci 11 04070 g003
Figure 4. Schematic of the next goal point g x T + 1 k determination process for agent k: (a) increase the radius of the search circle until h numbers of sample points are found; (b) construct a tree associated with the found points y j and then select a particular path (red arrows) that has a minimum cost.
Applsci 11 04070 g004
Figure 5. Schematic for the Lawn Mower exploration strategy with two agents.
Applsci 11 04070 g005
Figure 6. Snapshots of different monitoring strategies for the 2-agent case: (ac) OT (TV-Gauss); (df) LM (TI-Uni); (gi) OT (TI-Uni). The negative time indicates the time to travel from the base station to the pre-specified location before the initiation of the monitoring mission. The monitoring mission starts at T = 1 s and continues until 900 s.
Applsci 11 04070 g006aApplsci 11 04070 g006b
Figure 7. Statistical data for the performance comparison among OT (TV-Gauss), OT (TI-Uni), and LM (TI-Uni) with the variation in the number of UAVs: (a) n a = 2 ; (b) n a = 3 ; and (c) n a = 3 . Mean values for the boxplots are indicated by the asterisk symbols.
Applsci 11 04070 g007
Figure 8. Snapshots of different monitoring strategies when the exploration time is given by 1800 s: (ac) OT (TV-Gauss); (df) LM (TI-Uni); (gi) OT (TI-Uni). The negative time indicates the time to travel from the base station to the pre-specified location before the initiation of the monitoring mission. The monitoring mission starts at T = 1 s and continues until 1800 s.
Applsci 11 04070 g008
Figure 9. Statistical data for the performance comparison among OT (TV-Gauss), LM (TI-Uni) and OT (TI-Uni) with 600 s delay and 3 agents: boxplots for target detection rates for (a) exploration time = 900 s; (b) exploration time = 1800 s; and (c) exploration time = 3600 s. Mean values for the boxplots are indicated by asterisk symbols.
Applsci 11 04070 g009
Table 1. Parameters for simulation performed for variation of number of UAVs.
ParametersParameter Values
Exploration strategies3 (OT (TV-Gauss), LM (TI-Uni), OT (TI-Uni))
No. of agents2, 3, 5 (for each strategy)
No. of simulations30 (for each strategy with a specific no. of agents)
Exploration time900 s
Time delay600 s
No. of animal herds9
Initial locations (m) of the animal herds and populations in each herd1: [ 300 , 400 ] T , 10 ,   2: [ 800 , 800 ] T , 15
3: [ 400 , 650 ] T , 18 ,   4: [ 750 , 550 ] T , 20
5: [ 150 , 750 ] T , 15 ,   6: [ 0 , 400 ] T , 20
7: [ 500 , 500 ] T , 15 ,   8: [ 700 , 300 ] T , 13
9: [ 200 , 200 ] T , 16
Initial GPS tracker information for 9 tracked animals (m)1: [ 0.58 , 402.60 ] T ,   2: [ 402.11 , 651.83 ] T
3: [ 296.22 , 398.91 ] T ,   4: [ 297.10 , 396.19 ] T
5: [ 151.90 , 747.73 ] T ,   6: [ 199.65 , 205.11 ] T
7: [ 503.16 , 496.32 ] T ,   8: [ 404.92 , 648.39 ] T
9: [ 305.28 , 403.58 ] T
Estimated herd center (m) from
Section 3.3 with tracked animal no.
1: [ 299.53 , 399.56 ] T , 3,4,9,    2: [ 151.90 , 747.73 ] T , 5
3: [ 0.58 , 402.60 ] T , 1,          4: [ 503.16 , 496.32 ] T , 7
5: [ 403.52 , 650.11 ] T , 2,8,         6: [ 199.65 , 205.11 ] T , 6
Distribution parameters for animalherd movement r u , T + 1 , r k , T + 1 Γ ( μ γ = 0.4 m/s, σ γ = 1 m/s)
v u , T + 1 V ( μ v m = 0 , k v m = 100 )
v k , T + 1 V ( μ v m = 0 , k v m = 2 )
90 v u , T + 1 90
θ u , 0 = v u , 0 V ( μ v m = 0 , k v m = 0 )
Exploration domain size2500 m × 3000 m
Maximum velocity of the UAVs30 m/s
Minimum velocity of the UAVs10 m/s
Angular velocity limit30 deg / s
Positional error gain, K x 0.4
Angular error gain, K θ 1
UAV sensor range to detect animals, r sensing 15 m
Specific parameters for OT (TV-Gauss)Number of sample points, N3600
Number of UAV steps for each agent for exploration, M a 900
Initial covariance for the sample point clusters Q = 1000 0 0 1000
Herd threshold50 m
Horizon length, h5
Search radius, r0.1 m
Radius increment, δ 0.05 m
Initial robot positions[100 m, 400 m] T
[200 m, 600 m] T
[200 m, 150 m] T
[150 m, 400 m] T
[400 m, 750 m] T
Distribution parameters for the sample point propagation r j , T + 1 Γ ( μ γ = 0.6 m/s, σ γ = 0.05 m/s)
v j , T + 1 V ( μ v m = 0 , k v m = 150 )
θ j , 0 = v j , 0 V ( μ v m = 0 , k v m = 0 )
Specific parameters for LM (TI-Uni)Horizontal and vertical expansion factors, f X , f Y 1
Distance between adjacent waypoints, d w 10 m
Spacing between adjacent vertical lines d v 120 m, 70 m, 40 m for n a = 2 , 3, 5, respectively
Simulation outputNo. of UAVsAverage Detection Rate (%)
OT(TV-Gauss)LM(TI-Uni)OT(TI-Uni)
240.4521.0819.86
357.7227.8625.85
574.3440.3136.22
Table 2. Parameters for simulations performed for variation of exploration time.
ParametersParameter Values
Exploration strategies3 (OT (TV-Gauss), LM (TI-Uni), OT (TI-Uni))
Exploration time900, 1800, 3600 s (for each strategy)
No. of UAVs3
Time delay600
No. of simulations30 (for each strategy with a specific exploration time
Initial UAV positions (m) (OT(TV-Gauss) and OT(TI-Uni)) [ 100 , 900 ] T
[ 200 , 600 ] T
[ 500 , 150 ] T
Parameters varied with exploration time   Exploration Time
90018003600
Exploration domain size(m2)2500 × 25003000 × 40007000 × 7000
Number of UAV steps for each agent for exploration, M a (OT(TV-Gauss))90018003600
Horizontal and vertical expansion factors, f X , f Y (LM(TI-Uni))1 0.7 0.5
Spacing between adjacent vertical lines d v ( m ) (LM(TI-Uni))1207040
Simulation outputExploration StrategyAverage Detection Rate (%)
90018003600
OT (TV-Gauss)63.0859.8444.08
LM (TI-Uni)35.6326.9012.16
OT (TI-Uni)29.3423.199.39
Publisher’s Note: MDPI stays neutral with regard to jurisdictional claims in published maps and institutional affiliations.

