Article

Thermometric Characterization of Fluorescent Nanodiamonds Suitable for Biomedical Applications

by
Francisco Pedroza-Montero
1,
Karla Santacruz-Gómez
2,
Mónica Acosta-Elías
3,
Erika Silva-Campa
3,
Diana Meza-Figueroa
4,
Diego Soto-Puebla
3,
Beatriz Castaneda
2,
Efraín Urrutia-Bañuelos
3,
Osiris Álvarez-Bajo
3,
Sofía Navarro-Espinoza
5,
Raúl Riera
3 and
Martín Pedroza-Montero
3,*
1
Physics PhD Program, Department of Physics Research, University of Sonora, Rosales and Encinas, Hermosillo 83000, Sonora, Mexico
2
Department of Physics, University of Sonora, Rosales y Encinas, Hermosillo 83000, Sonora, Mexico
3
Department of Physics Research, University of Sonora, Rosales and Encinas, Hermosillo 83000, Sonora, Mexico
4
Department of Geology, University of Sonora, Rosales and Encinas, Hermosillo 83000, Sonora, Mexico
5
Nanotechnology PhD Program, Department of Physics, University of Sonora, Rosales y Encinas, Hermosillo 83000, Sonora, Mexico
*
Author to whom correspondence should be addressed.
Appl. Sci. 2021, 11(9), 4065; https://doi.org/10.3390/app11094065
Submission received: 9 April 2021 / Revised: 26 April 2021 / Accepted: 27 April 2021 / Published: 29 April 2021
(This article belongs to the Section Nanotechnology and Applied Nanosciences)

Abstract

:
Nanodiamonds have been studied for several biomedical applications due to their inherent biocompatibility and low cytotoxicity. Recent investigations have shown perspectives in using fluorescent nanodiamonds as nanothermometers because of their optical properties’ dependence on temperature. Easy and accurate localized temperature sensing is essential in a wide variety of scientific fields. Our work demonstrated how the fluorescence spectrum of high-pressure high-temperature fluorescent nanodiamonds of three different sizes: 35 nm, 70 nm and 100 nm, changes with temperature within an important biological temperature range (25 °C to 60 °C). Taking advantage of this phenomenon, we obtained nanothermic scales (NS) from the zero phonon lines (ZPL) of the NV0 and NV colour centres. In particular, the 100 nm-sized features the more intense fluorescence spectra whose linear dependence with temperature achieved 0.98 R2 data representation values for both NV0 and NV. This model predicts temperature for all used nanodiamonds with sensitivities ranging from 5.73% °C−1 to 6.994% °C−1 (NV0) and from 4.14% °C−1 to 6.475% °C−1 (NV). Furthermore, the non-cytotoxic interaction with HeLa cells tested in our study enables the potential use of fluorescence nanodiamonds to measure temperatures in similar nano and microcellular aqueous environments with a simple spectroscopic setup.

Graphical Abstract

1. Introduction

A large number of nanoparticles are currently being considered for biomedical applications, such as imaging, diagnostics and drug delivery. However, many of these nanoparticles possess intrinsic limitations for their use in biological systems, such as control of surface properties, increased dispersion in physiological solutions, biocompatibility issues and effective targeting to intracellular locations [1]. Recently, carbon nanostructures attracted the scientific community’s attention due to their potential applications in biomedicine and nanoscale device engineering [2,3,4].
Nanodiamonds receive special attention within the range of nanocarbon materials due to their outstanding physical and chemical features [5,6]. This versatile material exhibits low cytotoxicity at the cellular level [7,8] and is considered the most biocompatible of all carbon-containing derivatives [9,10]. Moreover, given their high surface-to-volume ratio [11] and charged surface [12], nanodiamonds exhibit remarkable loading/binding capacities for a wide variety of therapeutic compounds [13,14,15,16,17]. With highly ordered aspect ratios close to unity, nanodiamonds have shown to be biologically stable [18], enabling them to prevent stress-inflammatory and apoptotic cellular reactions [19]. Some studies have supported nanodiamonds inherently susceptible biological performance in water suspension once incubated with cells [11,20].
Diamonds may contain luminescent defects or colour centres due to different impurities or defects embedded within the crystal lattice [21,22]. Amongst these diamond colour centres, the nitrogen-vacancy (NV) colour centres are the most notable as they possess a stable fluorescence spectrum spanning from the visible and near-infrared regions of the electromagnetic spectrum [22], which also broadens and quenches as the nanodiamond particle size decreases [23,24]. Characteristic emission lines are at 575 nm (NV0) and 637 nm (NV) corresponding to the neutral or negatively charged centre, respectively. These colour centres are known to allocate 5 (NV0) or 6 (NV) electrons and give rise to two possible electronic structures [25,26,27]. Each charge state population can be tuned to match a maximum of luminescent intensity given an excitation’s wavelength and power [28]. Additionally, an excitation wavelength within 450–575 nm origins that the NV centres continuously switch between the two charge states [29]. Further studies show that under the typical 532 nm excitation wavelength, the probabilities of finding the NV centre in the NV and NV0 configurations are 70% and 30%, respectively [28,30]. These optical properties make fluorescent nanodiamonds a suitable probe for bioimaging and thermic sensing applications in cellular environments [31,32]. Moreover, the NV centre is highly photostable, with no photobleaching signs, even under high power excitation at the single-molecule level [7,8].
Many cellular events are temperature dependent [33,34,35] and several studies have demonstrated how cancer cells exhibit a higher temperature than healthy cells due to increased metabolism [35,36]. At this point, accurate data on the local temperature in biological systems is necessary to understand their dynamical behaviour and general state [37]. In these systems, it is desirable to have a non-invasive method to perform local temperature measurements at micron and sub-micron scales. A solution to this problem is fluorescence thermometry, which makes use of fluorescent materials such as quantum dots, rare-earth-doped crystals [38,39,40], organic compounds [41,42] and nanodiamonds [43,44,45] to determine temperature without contact. However, doubts arise about the biocompatibility and toxicity of rare-earth-doped nanostructures [46]; for this reason, nanodiamonds are preferred due to their inherent biocompatibility [47]. Another nanodiamond advantage is NV centres are immobile at room temperature, conferring excellent stability and sensitivity [43]. Then, the thermometry based on nanodiamond fluorescence becomes an excellent alternative to assess the intracellular structures. Nevertheless, most works consider the changes in the electron spin resonances of NV centres when a magnetic field is applied [44,48,49]. The obtained optically detected magnetic resonances (ODMR) of NV centres under different temperatures have an excellent low-temperature uncertainty. Still, the implementation of those techniques demands high requirements of sophisticated experimental infrastructure [50,51,52]. In contrast, thermometry scales build from NV centres luminescence can be constructed with a simple experimental setup getting sensitivities around ± 1.3 °C for both NV centres. Examples are nano-thermometry using the Debye-Weller factor (DWF), that is the ratio of the area under the ZPL and the total emission band of the NV [44,53], the detection of small changes in the width, the area and the peak wavelength of the ZPL [54], recording of spectral shifts of ZPL [45] or the measurement of energy level shifts of NV centres by Raman and photoluminescence (PL) spectra [50].
In this work, we performed a thermometric characterization in a biological temperature range (25–60 °C) of commercial high-pressure high-temperature fluorescent nanodiamonds (HPHT FNDs) with three sizes: 35 nm, 70 nm and 100 nm. Our results showed that it is possible to establish nanothermic scales based on HPHT FNDs with affordable fluorescence microscope equipment. Additionally, the temperature measurement with NV0 may apport an additional calibration tool. As an early biomedical application, the thermal bioimage of HeLa cells at RT was obtained, opening a new perspective of using FNDs as nanothermometers in living cellular environments for thermal imaging and diagnosis aid.

2. Materials and Methods

2.1. High-Pressure High-Temperature Nanodiamonds

HPHT FNDs in aqueous solution were acquired from Sigma Aldrich with average particle sizes of 35 nm, 70 nm and 100 nm each (Table 1). HPHT FNDs of 100 nm of particle size were concentrated to 0.1%, 0.5% and 0.01% w/v with purified water (Milli-Q model C85358, Millipore Sigma) for the cytotoxicity assay and HeLa cells culture study.

2.2. Fluorescent Thermometry

The fluorescence spectra of 35 nm and 70 nm-sized nanodiamonds were recorded at different temperatures using a laser scanning confocal microscope Olympus BX41 (Japan) equipped an InGaAs detector using a 10x long working distance microscope objective with a NA 0.25 and an OBIS 532 nm laser with 20 mW of continuous power as the optical excitation. The laser was directed through a series of mirrors into the microscope system. Then, the laser was focused on the sample, the detector collected the signal, and then processed with Horiba Scientifics LabSpec software. Once these colour centres were well-localised and the optimal microscope parameters established for a maximised output signal, fluorescence spectra were recorded at different temperatures within the physiological range of 25 °C to 60 °C with the help of a heating plate in steps of 1 °C and 20 min of thermal equilibrium time. Fluorescence spectra were recorded using a detection range from 550 nm to 850 nm in steps of 1 nm with a 2 nm wide slit and 0.1 s of integration time.
The fluorescence spectra of 100 nm-sized nanodiamonds were recorded at different temperatures using a Horiba Scientifics Fluorolog®-3 FL3-22 (Japan) equipped with a photomultiplier tube Hamamatsu R928P and an OBIS 532 nm laser with 20 mW of continuous power as optical excitation. The temperature control was achieved with the F-3030 temperature bath and the FL-1027 Single-Position Thermostatted Cell Holder accessories from Horiba Scientifics. The software FluorEssense (Horiba Scientifics, Japan) was set for an emission scan from 25 °C to 60 °C in steps of 1 °C with a tolerance of 0.1 °C and 20 min of thermal equilibrium time. The fluorescence spectra were recorded using a detection range from 550 nm to 850 nm in steps of 1 nm with a 2 nm wide slit and 0.1 s of integration time.
The software Origin (OriginLab, Northampton, MA, USA) was used to obtain peak information of the NV colour centres’ zero phonon lines characteristics (NV0, 575 nm and NV, 637 nm) in the form of intensity, full width at half maximum and position through a Gaussian fit. First, all the spectra were normalized from 0 to 1. Then, they had their baseline adjusted to include the phonon sidebands below ZPL, similarly to the background subtraction performed by Plathotnik et al. [44]. Finally, they had their NV centre peaks fit with a Gaussian curve. A linear fit was calculated for the thermal evolution of the NV centres’ fluorescence, yielding very accurate results regarding their R2 quality of fit value. Relative sensitivities were calculated according to the following equation:
SQ = (1/Q)(dQ/dT)
where SQ represents the sensibility, Q is the NV centre’s fluorescence and T is the temperature.

2.3. HeLa Images and Cytotoxicity Assays

HeLa cells were seeded on a sterile 96 well plate and cultured in DMEM (Dulbecco’s modified eagle medium), supplemented with FBS (10%), sodium pyruvate (1 mM), penicillin (10 μg/mL), streptomycin (0.1 mg/mL) and incubated at 37 °C, CO2 (5%) and 80% humidity; until reaching 80% of a monolayer.
For nanodiamonds-cells interaction, the cells were washed with phosphate-buffered saline (PBS) solution to remove non-adherents, dead and rest of metabolized medium. The 100 nm nanodiamonds solution concentrated to 0.01% w/v was diluted in sterile DMEM at 0.01% w/v and 200 µL of the solution was added to each well, incubated for 1 h under the same conditions described previously. The cells were stirred in the dark, then the solution was removed, and they were subjected to 3 washing steps with PBS before observation at the microscope. The images of the interaction between nanodiamond and HeLa cells were obtained with a confocal microscope Nikon Eclipse Ti (Japan). The 532 nm laser beam of 5–6 mW was focused onto the samples by a 20x objective (air, NA 0.95) and fluorescence images (1024 × 1024 pixels) were processed with the imaging software NIS-Elements (Nikon, Japan).
The viability of HeLa cells exposed to nanodiamonds was measured using the well-known 3-(4,5-dimethylthiazol-2-yl)-2,5-diphenyltetrazolium bromide (MTT) assay. For this assay, serial dilutions of nanodiamonds were prepared in a sterile saline solution of DMEM (10−2, 10−3, 10−4, 10−5, 10−6, 10−7 and 0% as a viability control). The culture medium was removed and replaced with each dispersion of nanodiamonds solutions (four replicates for each concentration per assay). The protocol was previously reported by Fernández-Quiroz in 2019 [55]. MTT was diluted in PBS (5 mg/mL) and filtered through a 0.22 μm sterile filter. After 24 h of incubation, the stimulus was removed. MTT diluted in DMEM (100 μL, 12 mM) was added to the wells and incubated at 37 °C (5% CO2) for 2 h. MTT reactive was carefully removed, and a 100 μL of Dimethyl sulfoxide (DMSO) was added to solubilize the formazan crystals formed. Then, the absorbance was measured at 570 nm in a UV spectrophotometer (Thermo Scientific Multiskan GO), and the results were compiled using SkanIt software (Thermo Fisher Scientific, Waltham, MA, USA). Unstimulated-negative control cells were incubated with the respective complete medium. Positive control cells were treated with 10% DMSO to cause cell death. Cell viability is expressed as a percentage of the negative control, given by Equation (2).
Cell Viability (%) = (ASample/AControl)(100%)
where ASample represents the measurement from wells treated with nanodiamonds solutions, and AControl represents the value obtained from the wells treated with complete medium.

3. Results and Discussion

3.1. NV Centre Electronic Structure

In general, the electronic structure of the NV centre has six electrons. Two coming from the nitrogen atom, and another three are dangling bonds from the three carbon atoms surrounding the vacancy. The sixth electron is captured from the lattice, resulting in NV charge state [56]. During the FNDs crystal growing others NV charge states may occur, such as NV0 and NV+. Among the created centres, NV0 and NV are optically active but only NV is both magnetically and optically active. The electron density of those centres is distributed in a plane vertical to the central NV axis, with the highest density on the three carbon atoms and the vacant site [57,58]. In this scheme, the electronic structure of NV0 has a 2E ground state, 2A2 optical excited level, and an intermediate metastable 4A2 level. The 2A2 has no orbital degeneracy and exhibits no zero-field fine structure, but the ground state 2E has orbital degeneracy causing a spin-orbit fine structure [59]. For NV centre, the ground base (3A2) is a spin-triplet that at zero field state split in three sub-spin levels: a doublet (ms = ± 1) and a singlet (ms = 0). Moreover, the NV centre presents an additional 1A1 metastable state [60]. In contrast, the excited electronic state 3E exhibits a complex fine structure composed mainly by spin-spin and spin-orbit interactions [61]. Figure 1a. Thermal energy enhances all the luminescent relaxation processes but also actives surface or defects states. These nonradiative relaxation channels are activated as temperature rises. The thermal relaxations may compete directly with the radiative response from ZPL in FNDs, diminishing their fluorescence signal [62].

3.2. Nanothermic Scale of High-Pressure High-Temperature Nanodiamonds

The fluorescence spectrum of 35 nm, 70 nm and 100 nm-sized nanodiamonds are shown in Figure 1b. The two fluorescence peaks detected at 575 nm and 637 nm correspond to the NV0 and NV colour centres defects’ fluorescence, respectively. An energy level diagram for both charge states is shown in Figure 1a, illustrating which energy levels are found in either charge state configuration symmetry. The NV0 zero-phonon line transition 2A2-2E has an energy of 2.15 eV corresponding to 575 nm. The NV zero-phonon line transition 3E-3A2 has an energy of 1.94 eV corresponding to 637 nm. The two peaks detected at 659 nm and 680 nm are NV phonon sidebands ascribed to an electron-phonon coupling [63,64]. Optical excitation and emission are separated into zero-phonon lines and phonon sidebands. Vibrational properties determine the shape and extent of the phonon sidebands. In a radiative transition, the initial state is a vibrational ground state of an excited energy level, while the final state can be any vibrational state of the electronic ground state; hence, the phonon sideband transitions are usually Stokes-shifted [59,64,65]. The radiative transition 1A1-1E of energy 1.19 eV corresponds to an infrared photon of a wavelength of 1042 nm and lies within the NV electronic structure.
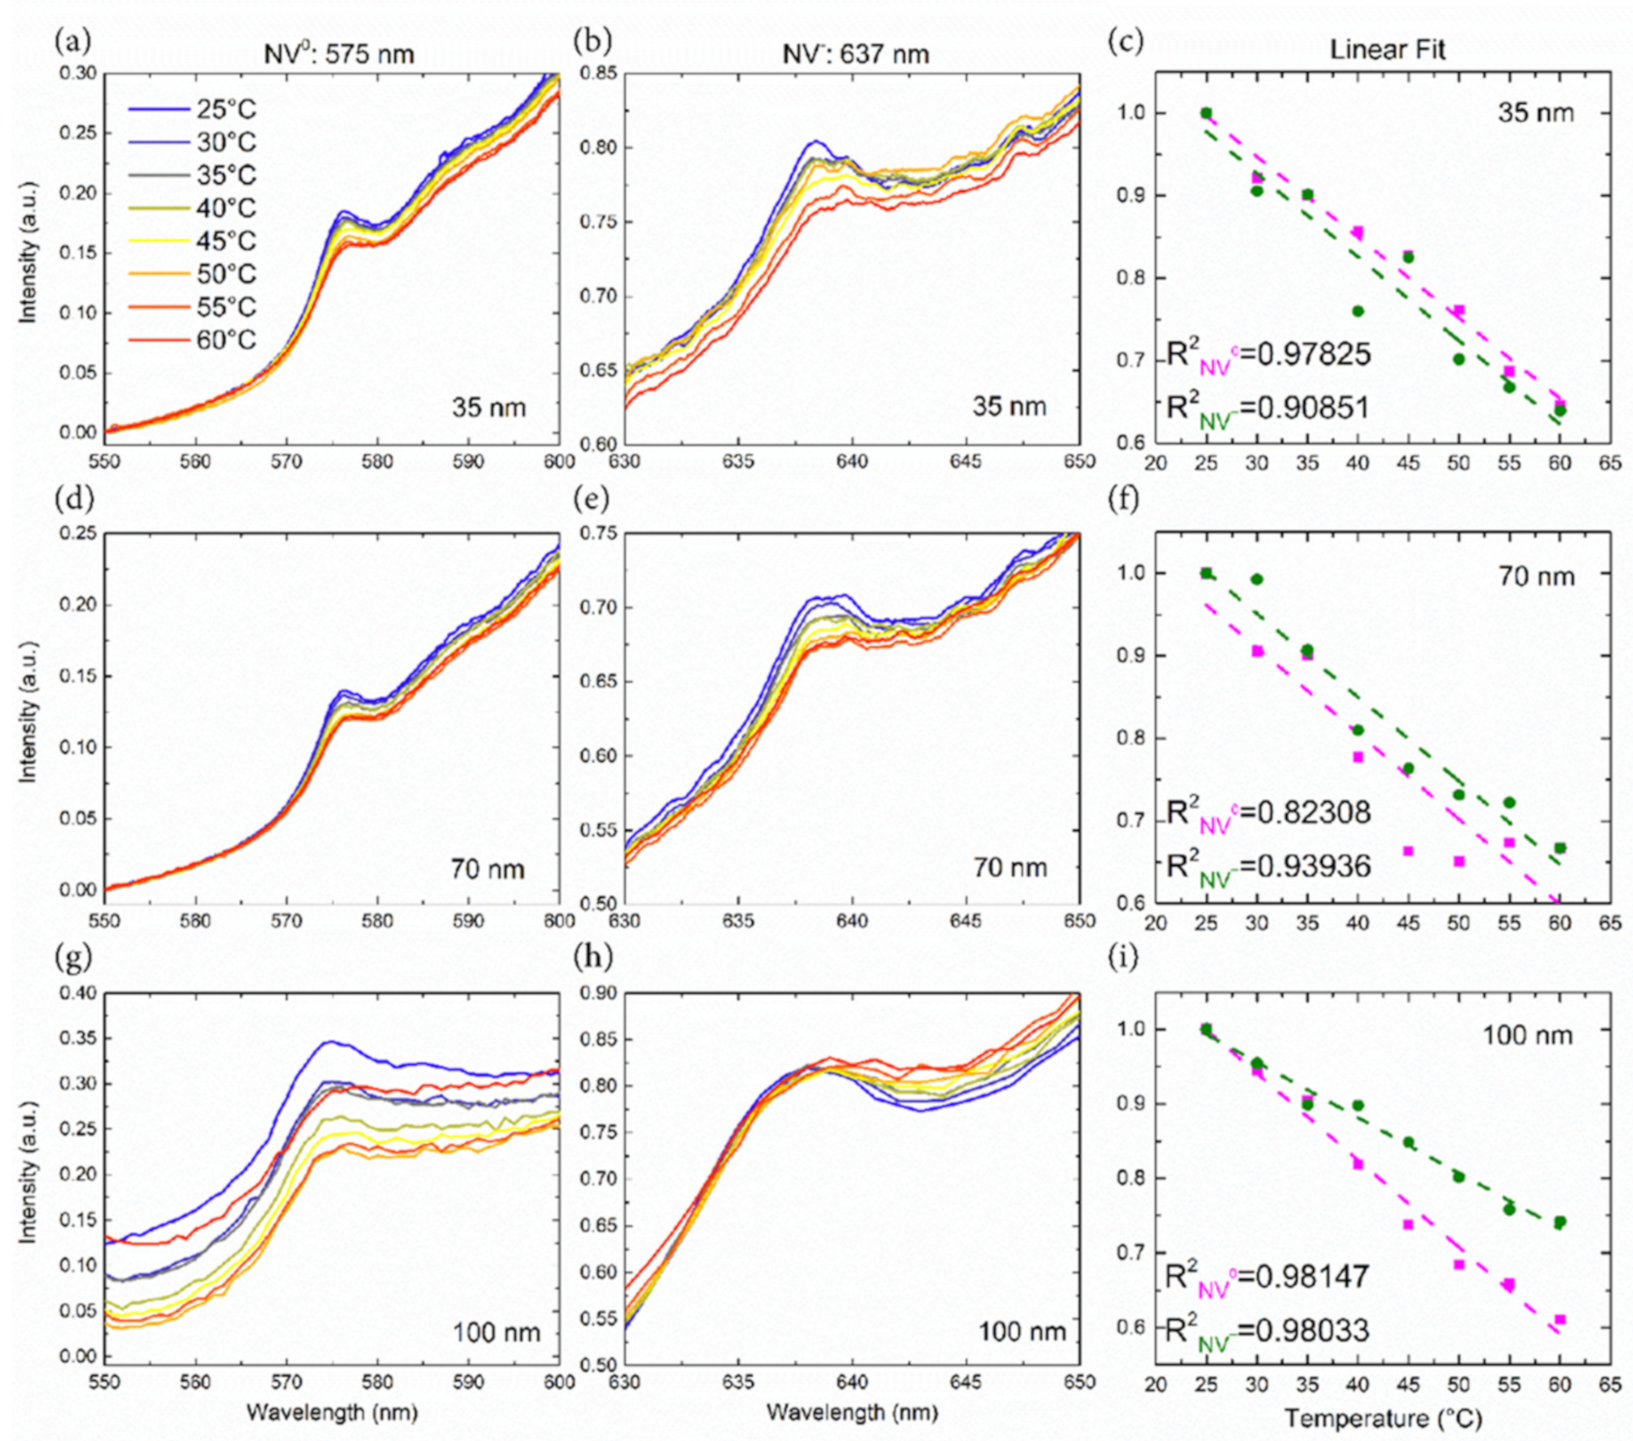
Our results demonstrated how the NV centres’ fluorescence from nanodiamonds is sensitive to temperature changes and can be accurately described by a linear model within the 25 °C to 60 °C range. Figure 2 shows how both charge states’ fluorescence transforms concerning to temperature changes and their nanothermic scales adjusted employing a linear fit.
The 35 nm nanodiamonds yielded a very accurate linear data representation and sensitivities of 97%, 5.37% °C−1 (NV0) and 90%, 5.618%° C−1 (NV), demonstrating outstanding thermometric performance. The 70 nm nanodiamonds yielded linear data representations of 82%, 6.365% °C−1 (NV0) and 93%, 6.475% °C−1 (NV), performing slightly worse than the 35 nm-sized ones. The 100 nm nanodiamonds performed best among all the samples. They exhibited superior linear data representations of 98%, 6.994% °C−1 (NV0) and 98%, 4.14% °C−1 (NV) than the other samples, mainly attributed to their high nitrogen-vacancy centre concentration [66,67,68] and their enhanced fluorescence signal of the NV dominant charge state [23]. Remarkably, the reported sensitivities represent uncertainties around ± 1.3 °C for both NV centres marginally bigger than those reported in ODMR experiments (≈0.5–1 °C) [69,70].
We observed how the 70 nm-sized nanodiamonds’ NV0 intensity exhibited an anomalous feature in the analysis, where a linear curve could only represent 82% of the data, whereas the 35 nm (93%) and 100 nm (98%) sized ones reached higher R2 values. This fact may be attributed to sp2 carbon contamination of the surface during the growth process [71] and the proximity of NV centres to her [72]. Furthermore, the nanothermic scales for 35 nm-sized nanodiamonds performed nearly as good as the 100 nm-sized nanodiamonds, differing in the overall spectrum broadening due to a smaller particle size [23].
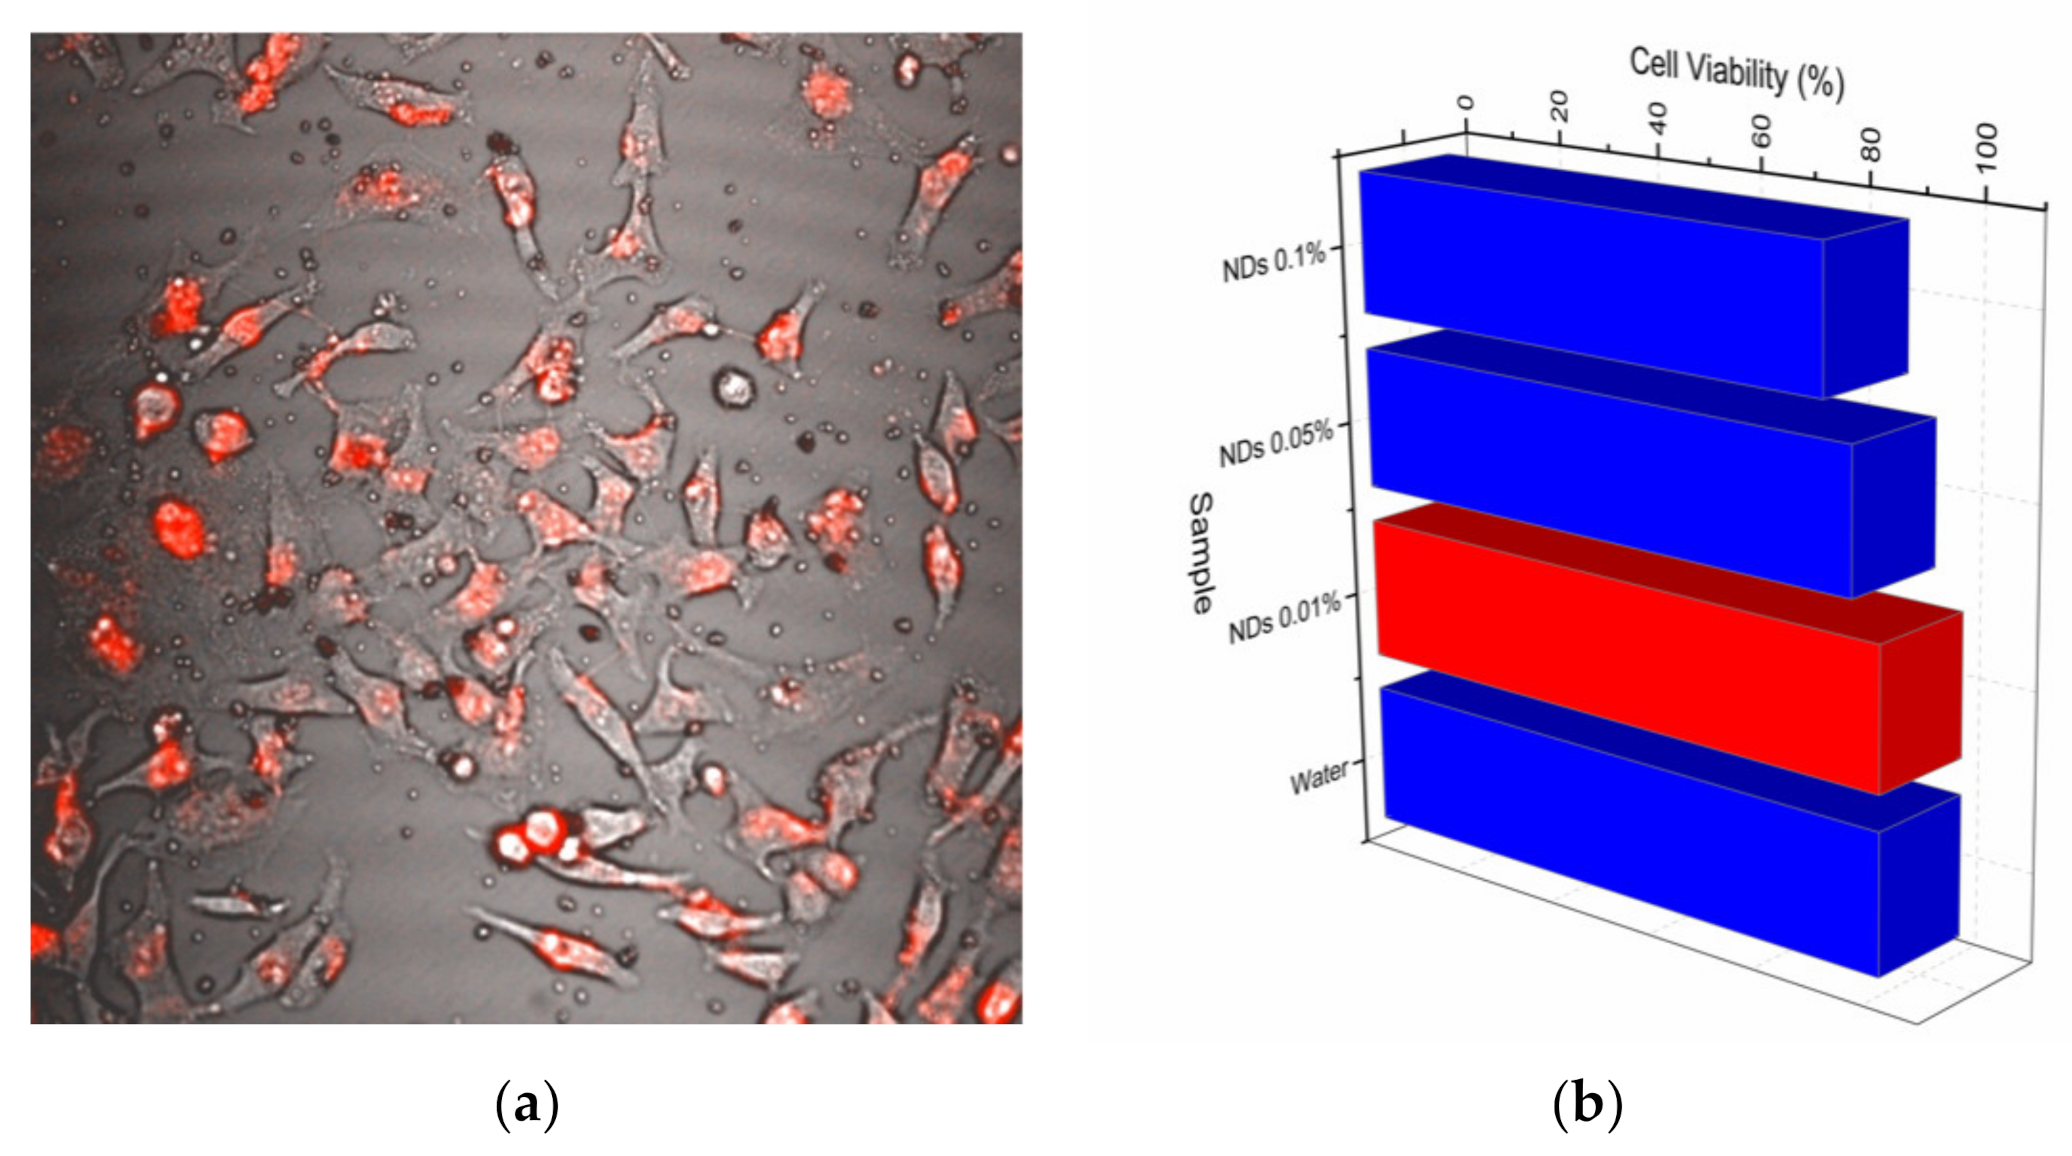
As an example of thermal bioimaging at room temperature, a fluorescence image of the HeLa cells incubated with 100 nm nanodiamonds is shown in Figure 3a. Moreover, their original shape remains unaltered because of a non-cytotoxic interaction. The HPHT FNDs rendered biocompatible (>90%) for concentrations up to 0.1%, as depicted in Figure 3b. We observe that most nanodiamonds are accumulated preferentially on the protuberance generated by the nucleus’ volume (Figure 3a). This feature has been used to indirectly measure the temperature on the malignant cell’s nucleus, which presents a higher gene expression rate and protein production and demands higher energy levels of ATP consumption [73]. The thermal bioimaging for measuring cell temperature of protuberances may be an efficient technique to differentiate between healthy and infected cells [74]. Improvements to thermal bioimage could be achieved with the implantation of selected ions to the surface of FNDs to slow NV to NV0 conversion energy. Being H, an efficient fluorescent termination as demonstrated by Kratochvílova et al. [75].

4. Conclusions

In general, the overall fluorescence intensity of the fluorescent nanodiamonds used for this work decreases as temperature rises within the range of biologically relevant temperatures (25 °C to 60 °C). We demonstrated how this fluorescence intensity mostly follows a linear dependence with the local nanodiamond temperature. Furthermore, there is a size dependency on the processes involved in the changes in the overall fluorescence spectrum of nanodiamonds which relates the smaller nanodiamonds with a broader and less intense signal, while larger nanodiamonds with a sharper and brighter spectrum. However, the ZPL position remains unaltered in all cases, and then the fitting process can discriminate and account for them successfully.
The NV0 and NV centres’ fluorescence allowed the construction of nanothermic scales. Additionally, this study unveils the possibility of using nanodiamonds as nanothermometers to distinguish delimitation of tumoral margins and several types of pathologies through the point measurement of the membrane’s temperature (70 nm or 100 nm size nanodiamonds) or inner structures of malignant cells (with 35 nm or smaller nanodiamonds). Here, biomedical applications such as, the imaging and diagnosing instrumentation based on fluorescence became simple and could be implemented easily in biomedicals facilities inside hospitals and health clinics.

Author Contributions

Conceptualization, D.M.-F., R.R. and M.P.-M.; methodology, K.S.-G., M.A.-E. and E.S.-C.; validation, S.N.-E.; formal analysis, F.P.-M., K.S.-G., M.A.-E., E.S.-C., O.Ã.-B. and M.P.-M.; investigation, F.P.-M.; data curation, F.P.-M., K.S.-G., M.A.-E., E.S.-C. and O.Ã.-B.; writing—original draft preparation, F.P.-M.; writing—review and editing, D.M.-F., D.S.-P., B.C., E.U.-B., S.N.-E. and R.R.; supervision, M.P.-M.; project administration, M.P.-M.; funding acquisition, D.M.-F. and M.P.-M. All authors have read and agreed to the published version of the manuscript.

Funding

This research was funded by CONACYT (Mexico) under Contract PDCPN2014-01/248982 and fellowship of F. Pedroza-Montero.

Data Availability Statement

For data acquiring please send an e-mail to F.P.-M.’s institutional e-mail: [email protected].

Acknowledgments

Results of this paper are part of a Ph.D. thesis by F.P.-M. under the advice of M.P.-M.

Conflicts of Interest

The authors declare no conflict of interest.

References

  1. Neves, A.R.; Reis, S. Nanoparticles in Life Sciences and Biomedicine; Neves, A.R., Reis, S., Eds.; Pan Stanford Publishing Pte. Ltd.: Singapore, 2018; ISBN 978-1-351-20735-5. [Google Scholar]
  2. Pan, M.; Annamalai, K.; Tao, Y. Applications of Nanocarbons in Bio-Medical Devices. Recent Innov. Chem. Eng. Former. Recent Pat. Chem. Eng. 2016, 8, 67–74. [Google Scholar] [CrossRef]
  3. Wang, X.; Nakamoto, T.; Dulińska-Molak, I.; Kawazoe, N.; Chen, G. Regulating the stemness of mesenchymal stem cells by tuning micropattern features. J. Mater. Chem. B 2016, 4, 37–45. [Google Scholar] [CrossRef]
  4. Panwar, N.; Soehartono, A.M.; Chan, K.K.; Zeng, S.; Xu, G.; Qu, J.; Coquet, P.; Yong, K.-T.; Chen, X. Nanocarbons for Biology and Medicine: Sensing, Imaging, and Drug Delivery. Chem. Rev. 2019, 119, 9559–9656. [Google Scholar] [CrossRef] [PubMed]
  5. Mitura, S. Nanodiamonds. J. Achiev. Mater. Manuf. Eng. 2007, 24, 7. [Google Scholar]
  6. Nunn, N.; Torelli, M.; McGuire, G.; Shenderova, O. Nanodiamond: A high impact nanomaterial. Curr. Opin. Solid State Mater. Sci. 2017, 21, 1–9. [Google Scholar] [CrossRef]
  7. Yu, S.-J.; Kang, M.-W.; Chang, H.-C.; Chen, K.-M.; Yu, Y.-C. Bright Fluorescent Nanodiamonds: No Photobleaching and Low Cytotoxicity. J. Am. Chem. Soc. 2005, 127, 17604–17605. [Google Scholar] [CrossRef]
  8. Hui, Y.Y.; Cheng, C.-L.; Chang, H.-C. Nanodiamonds for optical bioimaging. J. Phys. Appl. Phys. 2010, 43, 374021. [Google Scholar] [CrossRef]
  9. Vaijayanthimala, V.; Tzeng, Y.-K.; Chang, H.-C.; Li, C.-L. The biocompatibility of fluorescent nanodiamonds and their mechanism of cellular uptake. Nanotechnology 2009, 20, 425103. [Google Scholar] [CrossRef]
  10. Elena, P.; Jani, M.; Cheng, C.-L. Applications of Nanomaterials; Ramesh, S.C., Shrikan, C.W., Eds.; American Scientific Publishers: Valencia, CA, USA, 2013; ISBN 978-1-58883-181-1. [Google Scholar]
  11. Schrand, A.M.; Huang, H.; Carlson, C.; Schlager, J.J.; Ōsawa, E.; Hussain, S.M.; Dai, L. Are Diamond Nanoparticles Cytotoxic? J. Phys. Chem. B 2007, 111, 2–7. [Google Scholar] [CrossRef]
  12. Manus, L.M.; Mastarone, D.J.; Waters, E.A.; Zhang, X.-Q.; Schultz-Sikma, E.A.; MacRenaris, K.W.; Ho, D.; Meade, T.J. Gd(III)-Nanodiamond Conjugates for MRI Contrast Enhancement. Nano Lett. 2010, 10, 484–489. [Google Scholar] [CrossRef] [Green Version]
  13. Yeap, W.S.; Chen, S.; Loh, K.P. Detonation Nanodiamond: An Organic Platform for the Suzuki Coupling of Organic Molecules. Langmuir 2009, 25, 185–191. [Google Scholar] [CrossRef] [PubMed]
  14. Ali, M.S.; Metwally, A.A.; Fahmy, R.H.; Osman, R. Nanodiamonds: Minuscule gems that ferry antineoplastic drugs to resistant tumors. Int. J. Pharm. 2019, 558, 165–176. [Google Scholar] [CrossRef] [PubMed]
  15. Gao, G.; Guo, Q.; Zhi, J. Nanodiamond-Based Theranostic Platform for Drug Delivery and Bioimaging. Small 2019, 15, 1902238. [Google Scholar] [CrossRef]
  16. Garg, S.; Garg, A.; Sahu, N.K.; Yadav, A.K. Synthesis and characterization of nanodiamond-anticancer drug conjugates for tumor targeting. Diam. Relat. Mater. 2019, 94, 172–185. [Google Scholar] [CrossRef]
  17. Terada, D.; Genjo, T.; Segawa, T.F.; Igarashi, R.; Shirakawa, M. Nanodiamonds for bioapplications–specific targeting strategies. Biochim. Biophys. Acta BBA Gen. Subj. 2020, 1864, 129354. [Google Scholar] [CrossRef] [PubMed]
  18. Chang, Y.-R.; Lee, H.-Y.; Chen, K.; Chang, C.-C.; Tsai, D.-S.; Fu, C.-C.; Lim, T.-S.; Tzeng, Y.-K.; Fang, C.-Y.; Han, C.-C.; et al. Mass production and dynamic imaging of fluorescent nanodiamonds. Nat. Nanotechnol. 2008, 3, 284–288. [Google Scholar] [CrossRef]
  19. Schrand, A.M.; Lin, J.B.; Hens, S.C.; Hussain, S.M. Temporal and mechanistic tracking of cellular uptake dynamics with novel surface fluorophore-bound nanodiamonds. Nanoscale 2011, 3, 435–445. [Google Scholar] [CrossRef]
  20. Xing, Y.; Dai, L. Nanodiamonds for nanomedicine. Nanomedicine 2009, 4, 207–218. [Google Scholar] [CrossRef]
  21. Alkahtani, M.H.; Alghannam, F.; Jiang, L.; Almethen, A.; Rampersaud, A.A.; Brick, R.; Gomes, C.L.; Scully, M.O.; Hemmer, P.R. Fluorescent nanodiamonds: Past, present, and future. Nanophotonics 2018, 7, 1423–1453. [Google Scholar] [CrossRef]
  22. Jelezko, F.; Wrachtrup, J. Single defect centres in diamond: A review. Phys. Status Solidi A 2006, 203, 3207–3225. [Google Scholar] [CrossRef]
  23. Wilson, E.R.; Parker, L.M.; Orth, A.; Nunn, N.; Torelli, M.; Shenderova, O.; Gibson, B.C.; Reineck, P. The effect of particle size on nanodiamond fluorescence and colloidal properties in biological media. Nanotechnology 2019, 30, 385704. [Google Scholar] [CrossRef]
  24. Shershulin, V.A.; Sedov, V.S.; Ermakova, A.; Jantzen, U.; Rogers, L.; Huhlina, A.A.; Teverovskaya, E.G.; Ralchenko, V.G.; Jelezko, F.; Vlasov, I.I. Size-dependent luminescence of color centers in composite nanodiamonds. Phys. Status Solidi A 2015, 212, 2600–2605. [Google Scholar] [CrossRef]
  25. Fedyanin, D.Y.; Agio, M. Ultrabright single-photon source on diamond with electrical pumping at room and high temperatures. New J. Phys. 2016, 18, 073012. [Google Scholar] [CrossRef]
  26. Su, Z.; Ren, Z.; Bao, Y.; Lao, X.; Zhang, J.; Zhang, J.; Zhu, D.; Lu, Y.; Hao, Y.; Xu, S. Luminescence landscapes of nitrogen-vacancy centers in diamond: Quasi-localized vibrational resonances and selective coupling. J. Mater. Chem. C 2019, 7, 8086–8091. [Google Scholar] [CrossRef]
  27. Vervald, A.; Burikov, S.; Borisova, N.; Vlasov, I.; Laptinskiy, K.; Laptinskaya, T.; Shenderova, O.; Dolenko, T. Fluorescence properties of nanodiamonds with NV centers in water suspensions: Fluorescence properties of ND-NV in water. Phys. Status Solidi A 2016, 213, 2601–2607. [Google Scholar] [CrossRef]
  28. Aslam, N.; Waldherr, G.; Neumann, P.; Jelezko, F.; Wrachtrup, J. Photo induced ionization dynamics of the nitrogen vacancy defect in diamond investigated by single shot charge state detection. New J. Phys. 2013, 15, 013064. [Google Scholar] [CrossRef]
  29. Beha, K.; Batalov, A.; Manson, N.B.; Bratschitsch, R.; Leitenstorfer, A. Optimum Photoluminescence Excitation and Recharging Cycle of Single Nitrogen-Vacancy Centers in Ultrapure Diamond. Phys. Rev. Lett. 2012, 109, 097404. [Google Scholar] [CrossRef]
  30. Waldherr, G.; Beck, J.; Steiner, M.; Neumann, P.; Gali, A.; Frauenheim, T.; Jelezko, F.; Wrachtrup, J. Dark States of Single Nitrogen-Vacancy Centers in Diamond Unraveled by Single Shot NMR. Phys. Rev. Lett. 2011, 106, 157601. [Google Scholar] [CrossRef] [PubMed] [Green Version]
  31. Petrini, G.; Moreva, E.; Bernardi, E.; Traina, P.; Tomagra, G.; Carabelli, V.; Degiovanni, I.P.; Genovese, M. Is a Quantum Biosensing Revolution Approaching? Perspectives in NV-Assisted Current and Thermal Biosensing in Living Cells. Adv. Quantum Technol. 2020, 3, 2000066. [Google Scholar] [CrossRef]
  32. Claveau, S.; Bertrand, J.-R.; Treussart, F. Fluorescent Nanodiamond Applications for Cellular Process Sensing and Cell Tracking. Micromachines 2018, 9, 247. [Google Scholar] [CrossRef] [PubMed] [Green Version]
  33. Pandey, P.C.; Shukla, S.; Pandey, G.; Narayan, R.J. Nanostructured diamond for biomedical applications. Nanotechnology 2021, 32, 132001. [Google Scholar] [CrossRef] [PubMed]
  34. Chrétien, D.; Bénit, P.; Ha, H.-H.; Keipert, S.; El-Khoury, R.; Chang, Y.-T.; Jastroch, M.; Jacobs, H.T.; Rustin, P.; Rak, M. Mitochondria are physiologically maintained at close to 50 °C. PLoS Biol. 2018, 16, e2003992. [Google Scholar] [CrossRef] [PubMed] [Green Version]
  35. Bai, T.; Gu, N. Micro/Nanoscale Thermometry for Cellular Thermal Sensing. Small 2016, 12, 4590–4610. [Google Scholar] [CrossRef]
  36. Karnebogen, M.; Singer, D.; Kallerhoff, M.; Ringert, R.-H. Microcalorimetric investigations on isolated tumorous and non-tumorous tissue samples. Thermochim. Acta 1993, 229, 147–155. [Google Scholar] [CrossRef]
  37. Suzuki, M.; Tseeb, V.; Oyama, K.; Ishiwata, S. Microscopic Detection of Thermogenesis in a Single HeLa Cell. Biophys. J. 2007, 92, L46–L48. [Google Scholar] [CrossRef] [Green Version]
  38. Vetrone, F.; Naccache, R.; Zamarrón, A.; Juarranz de la Fuente, A.; Sanz-Rodríguez, F.; Martinez Maestro, L.; Martín Rodriguez, E.; Jaque, D.; García Solé, J.; Capobianco, J.A. Temperature Sensing Using Fluorescent Nanothermometers. ACS Nano 2010, 4, 3254–3258. [Google Scholar] [CrossRef]
  39. Drabik, J.; Cichy, B.; Marciniak, L. New Type of Nanocrystalline Luminescent Thermometers Based on Ti 3+/Ti 4+ and Ti 4+/Ln 3+ (Ln 3+ = Nd 3+, Eu 3+, Dy 3+) Luminescence Intensity Ratio. J. Phys. Chem. C 2018, 122, 14928–14936. [Google Scholar] [CrossRef]
  40. Elzbieciak-Piecka, K.; Matuszewska, C.; Marciniak, L. Step by step designing of sensitive luminescent nanothermometers based on Cr3+,Nd3+ co-doped La3−xLuxAl5−yGayO12 nanocrystals. New J. Chem. 2019, 43, 12614–12622. [Google Scholar] [CrossRef]
  41. Lupton, J.M. A molecular thermometer based on long-lived emission from platinum octaethyl porphyrin. Appl. Phys. Lett. 2002, 81, 2478–2480. [Google Scholar] [CrossRef]
  42. Wu, Y.; Liu, J.; Ma, J.; Liu, Y.; Wang, Y.; Wu, D. Ratiometric Nanothermometer Based on Rhodamine Dye-Incorporated F127-Melamine-Formaldehyde Polymer Nanoparticle: Preparation, Characterization, Wide-Range Temperature Sensing, and Precise Intracellular Thermometry. ACS Appl. Mater. Interfaces 2016, 8, 14396–14405. [Google Scholar] [CrossRef]
  43. Kucsko, G.; Maurer, P.C.; Yao, N.Y.; Kubo, M.; Noh, H.J.; Lo, P.K.; Park, H.; Lukin, M.D. Nanometre-scale thermometry in a living cell. Nature 2013, 500, 54–58. [Google Scholar] [CrossRef] [PubMed]
  44. Plakhotnik, T.; Doherty, M.W.; Cole, J.H.; Chapman, R.; Manson, N.B. All-Optical Thermometry and Thermal Properties of the Optically Detected Spin Resonances of the NV–Center in Nanodiamond. Nano Lett. 2014, 14, 4989–4996. [Google Scholar] [CrossRef] [PubMed] [Green Version]
  45. Tsai, P.-C.; Epperla, C.P.; Huang, J.-S.; Chen, O.Y.; Wu, C.-C.; Chang, H.-C. Measuring Nanoscale Thermostability of Cell Membranes with Single Gold-Diamond Nanohybrids. Angew. Chem. Int. Ed. 2017, 56, 3025–3030. [Google Scholar] [CrossRef] [PubMed]
  46. Montes-Frausto, J.B.; Juarez-Moreno, K.; Can-Uc, B.; Hirata-Flores, G.A. Synthesis and cytotoxic effects of SrAl2O4 persistent luminescence nanoparticles co-doped with Eu2+/Dy3+ ions. Opt. Mater. Express 2016, 6, 1488–1499. [Google Scholar] [CrossRef]
  47. Acosta-Elías, M.; Sarabia-Sainz, A.; Pedroso-Santana, S.; Silva-Campa, E.; Santacruz-Gomez, K.; Angulo-Molina, A.; Castaneda, B.; Soto-Puebla, D.; Barboza-Flores, M.; Melendrez, R.; et al. Carboxylated nanodiamond and re-oxygenation process of gamma irradiated red blood cells: Re-oxygenation process of gamma irradiated red blood cells. Phys. Status Solidi A 2015, 212, 2437–2444. [Google Scholar] [CrossRef]
  48. Hsiao, W.W.-W.; Hui, Y.Y.; Tsai, P.-C.; Chang, H.-C. Fluorescent Nanodiamond: A Versatile Tool for Long-Term Cell Tracking, Super-Resolution Imaging, and Nanoscale Temperature Sensing. Acc. Chem. Res. 2016, 49, 400–407. [Google Scholar] [CrossRef]
  49. Fujiwara, M.; Sun, S.; Dohms, A.; Nishimura, Y.; Suto, K.; Takezawa, Y.; Oshimi, K.; Zhao, L.; Sadzak, N.; Umehara, Y.; et al. Real-time nanodiamond thermometry probing in vivo thermogenic responses. Sci. Adv. 2020, 6, 9. [Google Scholar] [CrossRef]
  50. Yang, M.; Yuan, Q.; Gao, J.; Shu, S.; Chen, F.; Sun, H.; Nishimura, K.; Wang, S.; Yi, J.; Lin, C.-T.; et al. A Diamond Temperature Sensor Based on the Energy Level Shift of Nitrogen-Vacancy Color Centers. Nanomaterials 2019, 9, 1576. [Google Scholar] [CrossRef] [Green Version]
  51. Yue, Y.; Wang, X. Nanoscale thermal probing. Nano Rev. 2012, 3, 11586. [Google Scholar] [CrossRef]
  52. Brown, S. Taking the temperature of a cell. Nat. Nanotechnol. 2013, 500, 54–58. [Google Scholar] [CrossRef]
  53. Plakhotnik, T.; Aman, H.; Chang, H.-C. All-optical single-nanoparticle ratiometric thermometry with a noise floor of 0.3 K Hz −1/2. Nanotechnology 2015, 26, 245501. [Google Scholar]
  54. Plakhotnik, T. Diamonds for quantum nano sensing. Curr. Opin. Solid State Mater. Sci. 2017, 21, 25–34. [Google Scholar] [CrossRef]
  55. Fernández-Quiroz, D.; Loya-Duarte, J.; Silva-Campa, E.; Argüelles-Monal, W.; Sarabia-Sainz, A.; Lucero-Acuña, A.; del Castillo-Castro, T.; San Román, J.; Lizardi-Mendoza, J.; Burgara-Estrella, A.J.; et al. Temperature stimuli-responsive nanoparticles from chitosan-graft-poly(N-vinylcaprolactam) as a drug delivery system. J. Appl. Polym. Sci. 2019, 136, 47831. [Google Scholar] [CrossRef]
  56. Schirhagl, R.; Chang, K.; Loretz, M.; Degen, C.L. Nitrogen-Vacancy Centers in Diamond: Nanoscale Sensors for Physics and Biology. Annu. Rev. Phys. Chem. 2014, 65, 83–105. [Google Scholar] [CrossRef] [Green Version]
  57. Gali, A.; Fyta, M.; Kaxiras, E. Ab initio supercell calculations on nitrogen-vacancy center in diamond: Electronic structure and hyperfine tensors. Phys. Rev. B 2008, 77, 155206. [Google Scholar] [CrossRef]
  58. Smeltzer, B.; Childress, L.; Gali, A. 13 C hyperfine interactions in the nitrogen-vacancy centre in diamond. New J. Phys. 2011, 13, 025021. [Google Scholar] [CrossRef]
  59. Barson, M.S.J.; Krausz, E.; Manson, N.B.; Doherty, M.W. The fine structure of the neutral nitrogen-vacancy center in diamond. Nanophotonics 2019, 8, 1985–1991. [Google Scholar] [CrossRef]
  60. Redman, D.A.; Brown, S.; Sands, R.H.; Rand, S.C. Spin dynamics and electronic states of N-V centers in diamond by EPR and four-wave-mixing spectroscopy. Phys. Rev. Lett. 1991, 67, 4. [Google Scholar] [CrossRef] [PubMed] [Green Version]
  61. Martin, J.P.D. Fine structure of excited _E state in nitrogen-vacancy centre of diamond. J. Lumin. 1999, 81, 237–247. [Google Scholar] [CrossRef]
  62. Su, L.-X.; Lou, Q.; Zang, J.-H.; Shan, C.-X.; Gao, Y.-F. Temperature-dependent fluorescence in nanodiamonds. Appl. Phys. Express 2017, 10, 025102. [Google Scholar] [CrossRef]
  63. Alkauskas, A.; Buckley, B.B.; Awschalom, D.D.; Van de Walle, C.G. First-principles theory of the luminescence lineshape for the triplet transition in diamond NV centres. New J. Phys. 2014, 16, 073026. [Google Scholar] [CrossRef]
  64. Davies, G. The Jahn-Teller effect and vibronic coupling at deep levels in diamond. Rep. Prog. Phys. 1981, 44, 787–830. [Google Scholar] [CrossRef]
  65. Treussart, F.; Vlasov, I.I. Photoluminescence of color centers in nanodiamonds. In Nanodiamonds; Elsevier: Amsterdam, The Netherlands, 2017; pp. 155–181. ISBN 978-0-323-43029-6. [Google Scholar]
  66. Rondin, L.; Dantelle, G.; Slablab, A.; Grosshans, F.; Treussart, F.; Bergonzo, P.; Perruchas, S.; Gacoin, T.; Chaigneau, M.; Chang, H.-C.; et al. Surface-induced charge state conversion of nitrogen-vacancy defects in nanodiamonds. Phys. Rev. B 2010, 82, 115449. [Google Scholar] [CrossRef] [Green Version]
  67. Shenderova, O.; Nunn, N.; Oeckinghaus, T.; Torelli, M.; McGuire, G.; Smith, K.; Danilov, E.; Reuter, R.; Wrachtrup, J.; Shames, A.; et al. Commercial Quantities of Ultrasmall Fluorescent Nanodiamonds Containing Color Centers; Hasan, Z.U., Hemmer, P.R., Lee, H., Migdall, A.L., Eds.; International Society for Optics and Photonics: San Francisco, CA, USA, 2017; Volume 10118, pp. 1–17. [Google Scholar]
  68. Robinson, M.E.; Ng, J.D.; Zhang, H.; Buchman, J.T.; Shenderova, O.A.; Haynes, C.L.; Ma, Z.; Goldsmith, R.H.; Hamers, R.J. Optically Detected Magnetic Resonance for Selective Imaging of Diamond Nanoparticles. Anal. Chem. 2018, 90, 769–776. [Google Scholar] [CrossRef]
  69. Yanagi, T.; Kaminaga, K.; Kada, W.; Hanaizumi, O.; Igarashi, R. Optimization of Wide-Field ODMR Measurements Using Fluorescent Nanodiamonds to Improve Temperature Determination Accuracy. Nanomaterials 2020, 10, 2282. [Google Scholar] [CrossRef]
  70. Sekiguchi, T.; Sotoma, S.; Harada, Y. Fluorescent nanodiamonds as a robust temperature sensor inside a single cell. Biophys. Physicobiology 2018, 15, 229–234. [Google Scholar] [CrossRef] [Green Version]
  71. Basso, L.; Cazzanelli, M.; Orlandi, M.; Miotello, A. Nanodiamonds: Synthesis and Application in Sensing, Catalysis, and the Possible Connection with Some Processes Occurring in Space. Appl. Sci. 2020, 10, 4094. [Google Scholar] [CrossRef]
  72. 72. Bradac, C.; Gaebel, T.; Pakes, C.I.; Say, J.M.; Zvyagin, A.V.; Rabeau, J.R. Effect of the Nanodiamond Host on a Nitrogen-Vacancy Color-Centre Emission State. Small 2013, 9, 132–139. [Google Scholar] [CrossRef] [PubMed]
  73. Pavlova, N.N.; Thompson, C.B. The Emerging Hallmarks of Cancer Metabolism. Cell Metab. 2016, 23, 27–47. [Google Scholar] [CrossRef] [Green Version]
  74. Maruyama, H.; Kimura, T.; Liu, H.; Ohtsuki, S.; Miyake, Y.; Isogai, M.; Arai, F.; Honda, A. Influenza virus replication raises the temperature of cells. Virus Res. 2018, 257, 94–101. [Google Scholar] [CrossRef] [PubMed]
  75. Kratochvílová, I.; Šebera, J.; Ashcheulov, P.; Golan, M.; Ledvina, M.; Míčová, J.; Mravec, F.; Kovalenko, A.; Zverev, D.; Yavkin, B.; et al. Magnetical and Optical Properties of Nanodiamonds Can Be Tuned by Particles Surface Chemistry: Theoretical and Experimental Study. J. Phys. Chem. C 2014, 118, 25245–25252. [Google Scholar] [CrossRef]
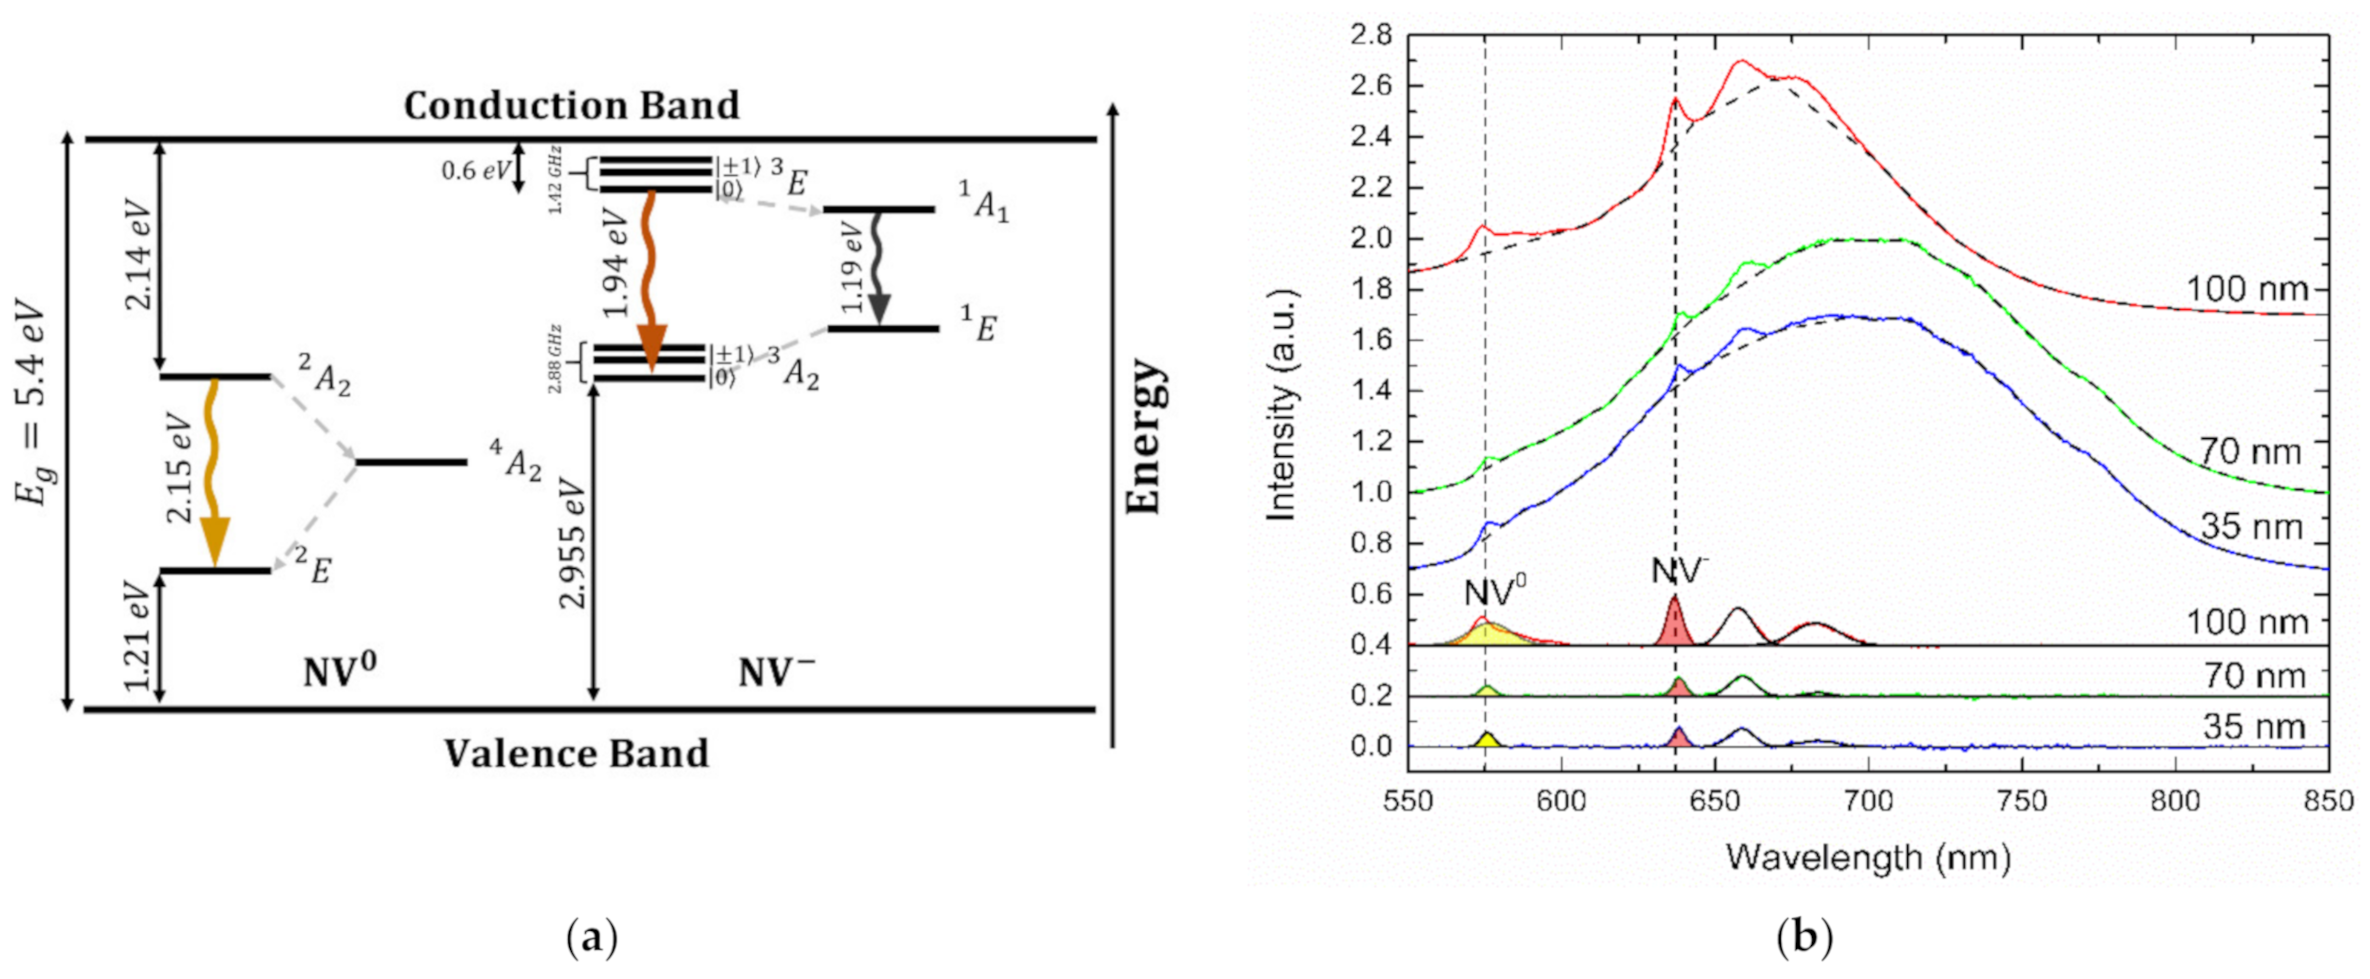
Figure 1. (a) Energy level diagram of the NV0 and NV centres in the diamond crystal lattice. The solid arrows denote the energy separation from the energy level to the valence or conduction band, and Eg is the diamond’s bandgap. The dashed arrows characterize the intersystem crossing between two energy levels. The wavy coloured arrows are the observed radiative transitions. (b) Fluorescence spectra of HPHT nanodiamonds of different sizes recorded at 25 °C. The top-coloured lines are normalized fluorescence spectra, the top dashed black lines are the baselines, the bottom-coloured lines are the filtered spectra, the bottom solid black lines are the Gaussian fits, and the bottom-coloured areas correspond to fluorescence peaks of the NV centres.
Applsci 11 04065 g001
Figure 2. Fluorescence spectra of NV0 and NV centres in HPHT nanodiamonds of 35 nm (a,b), 70 nm (d,e) and 100 nm (g,h) for temperatures from 25 °C to 60 °C. The dependence of the maximum fluorescence intensity on temperature (c,f,i) is obtained through normalization and using a Gaussian model. A linear fit gives R2 values are 0.97825, 0.82308 and 0.98147 for the NV0 centre and 0.90851, 0.93936 and 0.98033 for the NV centre, for nanodiamonds of 35 nm, 70 nm and 100 nm, respectively.
Applsci 11 04065 g002
Figure 3. (a) Fluorescence of 100 nm HPHT FNDs in HeLa cells. The fluorescence image was recorded around the membrane after 24 h of incubation at 37 °C. (b) MTT Cytotoxicity assay of different concentrations of 100 nm HPHT FNDs in HeLa cells, the red bar corresponds to the concentration used in (a).
Applsci 11 04065 g003
Table 1. Sigma Aldrich’s nanodiamonds specifications.
Part NumberConcentrationNV Centres/ParticleSize
900172-5 mL1 mg/mL≤435 nm
798169-5 mL1 mg/mL>30070 nm
900174-5 mL1 mg/mL>900100 nm
Publisher’s Note: MDPI stays neutral with regard to jurisdictional claims in published maps and institutional affiliations.