Featured Application
This paper provides a theoretical basis for the calculation of particle breakage at weak points of coarse-grained soil materials.
Abstract
Contact breakage of particles makes a large difference in the strength of coarse-grained soils, and exploring the characteristics within the process of the breakage is of great significance. Ignoring the influence of particle shape, the micromechanism of two spherical particles breaking under normal–tangential contact conditions was investigated theoretically and experimentally. Through theoretical analysis, the breakage form, the shape and size of the conical core, and the relationship between the normal and tangential forces at crushing were predicted. Particle contact tests of two gypsum spheres were carried out, in which the breakage forms, features of the conical cores and the normal and tangential forces at crushing were recorded for comparison with the predicted values. The test results and the theoretical predictions showed good agreement. Both the analysis and test demonstrate that the presence of tangential forces causes the conical core to assume the shape of an oblique cone, and the breakage form to change. Moreover, with increasing normal contact force, the tangential force needed for crushing increases gradually first and then decreases suddenly.
1. Introduction
Coarse-grained soils, such as gravel, are used in many fields, including earth dams, harbor facilities, nuclear power waste storage areas, and roadbed materials [1]. As a result of the large particle size, coarse-grained soils, in which the particle sizes are in the range of some cm to some dozen cm, usually have different mechanical properties compared with other soils. Since the 1960s, scholars worldwide have used theoretical analysis [2,3,4,5,6,7], laboratory tests [8,9,10,11] and numerical simulations [12,13,14,15,16,17] to study the strength and deformation characteristics of coarse-grained soils. In recent years, high-fill engineering projects have become increasingly common due to the construction of dams or embankments for infrastructures in mountainous regions. The problem of particle fragmentation in such projects, which directly affects the reliability of the overall structure, has attracted the attention of a growing number of academics [9,14,18,19,20].
Common methods used to study the fragmentation of coarse-grained soil particles include the shear test [11,21,22,23,24,25], the triaxial test [9,26,27,28], the uniaxial compression test [24,29] and the particle contact test [30,31,32], in which the first three methods are all about the effect of particle breakage on soil properties. The particle contact test was first proposed by Zhou [33], and has been increasingly adopted by scholars to study the mechanical properties of the breakage of a single particle, as research on the macromechanical properties of soils due to particle fragmentation has hit a bottleneck. There are many factors that influence the crushing characteristics of particles, such as the particle shape [34], material [35], contact form [30,31,32] and force state [34,36], in which the effect of particle shape has a strong uncertainty due to its randomness. The research on the features of a single particle in the process of contact breakage is still in the initial stages, and some scholars start from the simplest spherical particles to explore the micromechanism of particle breakage. For instance, using a statistical approach, Zhou [35] investigated the spherical particle crushing patterns of three materials, sandstone, limestone and slate, and derived empirical equations for the conical core size and the critical normal force at overall crushing. Through a combination of experiments and numerical simulations, Yu [37] studied the micromechanism of ball–plane normal contact breakage of spherical particles. Current studies on particle contact breakage have mainly focused on experimental studies and numerical simulations, with relatively little theoretical research on this problem.
Theoretical analysis of the internal stress state of spherical rock particles subjected to external forces has been carried out since the 1950s [3,38,39,40,41]. Based on the Hertz contact model, many scholars have proposed various models to solve different contact problems, such as Mindlin and Deresiewicz [42]. One of the most popular tests is the compression test of spheres between a pair of diametrical concentrated loads, and the mechanical model proposed by Hiramatsu and Oka [43] has been applied by various authors [40,44,45,46,47]. To date, most of the experimental studies on the breakage mechanism of brittle spherical rock materials subjected to external forces have been based on this model. It assumed the brittle rock sphere as an isotropic elastic material and equated loads acting on both ends of the sphere as uniform loads acting on a small area pointing to the center of the sphere, which does not change with the loading. However, during the contact crushing of two spherical particles, local compaction occurs at the contact point due to the stress concentration, resulting in the emergence of a circular plane, which causes the boundary conditions to change as the contact process progresses. The model of a sphere squeezed by a symmetrical pair of concentrated loads cannot be applied to the conditions of contact crushing between two spherical particles since the mechanism of the whole crushing process cannot be revealed. In order to reveal the formation mechanism of the conical core, the Hertz contact model is not suitable for this experiment since it is mainly used to solve static stress distribution in an elastic body, while the formation process of the conical core is a plastic deformation process.
According to the numerical simulation by Yu [37], Niu [48] divided the process of particle contact breakage into three stages—local compaction, elastic deformation and integral crushing—and gave solutions to the force–displacement curve, the conical core size and the critical force at fracture under the condition of ball–ball normal contact, in which only the normal force existed at the contact point. Nevertheless, in actual conditions, there are not only normal forces but also tangential forces at the contact point of two particles. Hence, it is necessary to explore the mechanism of contact fracture between two spherical particles under normal–tangential contact conditions.
In this study, the particle breakage of two spheres under normal–tangential contact conditions is discussed theoretically and experimentally. In the theoretical analysis, the breakage form, the shape and size of the conical core, and the relationship between the normal and tangential forces at failure are studied on the basis of the normal contact test [48]. Then, particle contact tests of two gypsum spheres under normal–tangential contact conditions are carried out to make a comparison with the theory. The theoretical research and experimental results in this paper are in good agreement. This study summarizes the variation rules of the breakage form and the conical core characteristics in different force states, and gives a solution to the normal and tangential forces required for particle crushing.
2. Theoretical Analysis
In this section, we derive a new solution applicable to the situation of normal–tangential contact based on the theoretical analysis of the normal contact test [48]. In this paper, we assume that the spherical particles are of isotropic brittle material. Before the analysis, the results of the normal contact test are reported here briefly.
2.1. Normal Contact
Niu [48] divided the process of the normal contact breakage of two spherical particles into three stages—local compaction, elastic deformation and integral crushing (see Figure 1)—and within this process, the relationship between the normal force Fn and the displacement of contact point s is as follows:
where δ, E and ν are hardness or crushing modulus, Young’s modulus and Poisson’s ratio of the material, respectively; R is the radius of the sphere; Fcr is the normal force when breakage occurs under normal contact conditions; s0 is the critical displacement separating the local compaction stage and the elastic deformation stage, and in the following:
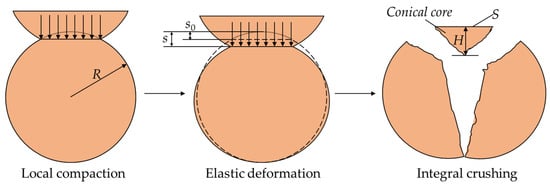
Figure 1.
A sketch of the contact crushing process of spherical particles under normal contact conditions. S and H are the bottom area and the height of the conical core, respectively.
α is a dimensionless parameter determined by Young’s modulus, Poisson’s ratio and hardness modulus, which has a powerful effect on the size of the conical core.
In the stage of local compaction, due to stress concentration, the contact point turns into a circular compacted flat region that gradually gets larger with the generation and gradual increase in the contact pressure, while the elastic deformation of the whole sphere is so small to be neglected. As the elastic deformation stage starts, the local compacted region no longer enlarges and all the displacements of the contact point come from the elastic deformation of the whole sphere until the breakage occurs. The solutions of the conical core size are [48], as follows:
2.2. Normal–Tangential Contact
Unlike the normal contact breakage, the breakage under normal–tangential contact conditions needs to be discussed in two cases—the high–normal force level and the low–normal force level. For the case of high–normal force level, the static frictional force between the two spheres is able to reach the tangential force required for breaking, and there is no relative sliding between them before the breakage occurs. On the other hand, for the low–normal force level, relative slippage between the two spheres occurs as the tangential force required for the particle crushing exceeds the maximum static frictional force the contact surface can provide. These two cases are separately discussed in detail in the following subsections.
2.2.1. High–Normal Force Level
In the case of the high–normal force level, the maximum static frictional force on the contact surface between the two spheres is larger than the tangential force required for any one sphere crushing, that is μFncr > Ftcr, and the breakage occurs without relative sliding between the two particles. Fncr and Ftcr are the normal force and the tangential force at crushing, respectively, and μ is the surface sliding friction coefficient of the material. In the stages of local compaction and elastic deformation, only the normal force does work, while the tangential force does not. As a result, the mechanism of these two stages is similar to that under normal contact conditions, and only the integral crushing of the particle is to be discussed next.
The solutions of stresses within the half-space along the line normal to and through the center of the contact area and the displacement at the center of the contact area are of interest as the area of the contact zone is much smaller than the particle size and they lend themselves to simple mathematical manipulation. The normal stress components at a point in the half-space (see Figure 2), under the action of a concentrated force P, are as follows [49]:
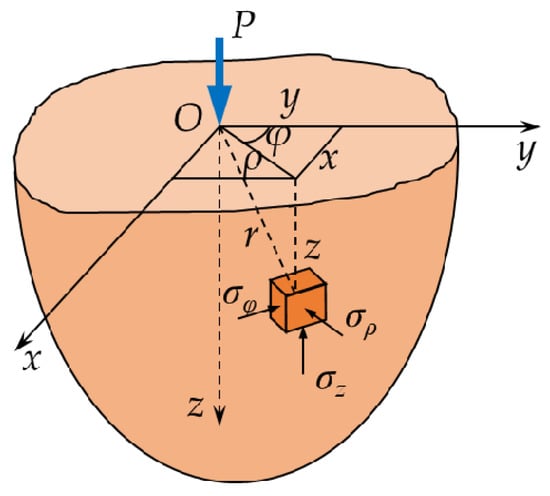
Figure 2.
Cylindrical coordinates ρ~φ~z and orthogonal normal stresses σρ, σφ and σz. ρ and z are the horizontal and vertical distances from the action point of the force P to the location of interest, respectively. φ is the horizontal rotation angle of the location of interest relative to the y-axis.
The cylindrical coordinate system shown in Figure 3a is established with the central point of the compacted area as the origin, and the z-axis is in the same direction as the resultant force F between the two spheres. The stress components at the point M on the z-axis inside the sphere can be obtained by superimposing Equations (6)–(8) on the contact surface. Figure 3b shows an inclined plane subjected to two vertical concentrated loads P symmetrical to the origin O, in which θ is very small, and the normal stress component σz of the point M on the z-axis is as follows:
which are close to the calculation results in Figure 3c. The same conclusions are obtained for σρ and σφ. Consequently, the stress components at the point M in Figure 3a are obtained through equivalenting the boundary condition as a uniform load q acting on a horizontal circular area with radius a, as follows:
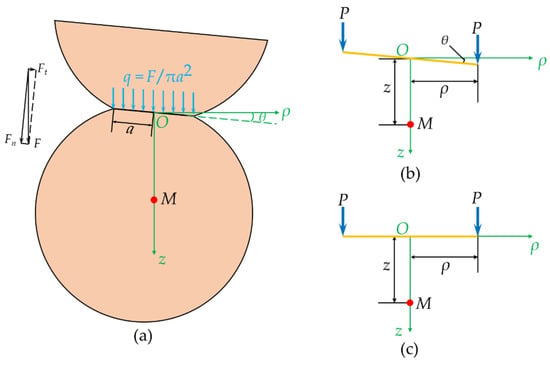
Figure 3.
(a) The coordinate system with the center of the compacted area as the coordinate origin. Fn and Ft are the normal and tangential forces between the two spheres, respectively. F is the resultant force of Fn and Ft.; (b) a pair of concentrated loads P symmetrical to point O act on an inclined plane with an inclination angle θ; (c) a pair of concentrated loads P symmetrical to point O act on a horizontal plane. M is a point on the z-axis.
In this study, the simple two-parameter multiaxial failure criterion for brittle materials proposed by Christensen [50,51] is applied. The criterion states that a material is at failure when the following applies:
where the parameter ψ and Κ are as follows:
respectively. Russell and Muir [46] improved this criterion for ease of application, and stated that a material is at failure when the following applies:
where sijsij and σii are the second invariant of the deviatoric stress tensor and the first invariant of the stress tensor, respectively. According to Equations (10) and (11), they take the values from the following:
By combining Equations (13), (14) and (16)–(18), the plot of Κmob within the sphere along the z-axis is shown in Figure 4a. The point at which the Κmob value first reaches Κ is the place where the crack starts from, and is also the vertex of the conical core. The crack expands in the direction of the resultant force between two particles and eventually penetrates the entire sphere, evolving into a rupture surface as shown in Figure 4c. The angle between the rupture surface and the diameter passing through the center of the bottom surface of the conical core is θ, which is called the inclination of the rupture surface. Different from the right conical core in the normal contact test, the conical core in the normal–tangential contact test is an oblique cone with an inclination of θ since its vertex must be on the z-axis, as shown in Figure 4b. The bottom area S of the conical core can still be calculated by Equation (4), while its height is calculating using the following:
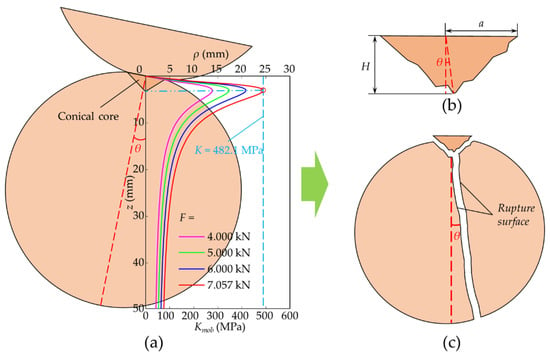
Figure 4.
(a) A plot of Κmob along the line passing through the center of the compacted area and in the direction of the resultant force for the following material parameters: σc = 50 MPa, σt = 3 MPa, ν = 0.3, a = 2.7 mm and R = 25 mm; (b) the size and shape of the conical core; (c) a sketch showing the breakage form of a sphere.
Through Equations (13)–(18), it is easy to know that the resultant force when integral fragmentation occurs is Fcr—the normal force at failure under normal contact conditions—of which the value is determined by the property of the material. Furthermore, the relationship between the normal and tangential forces when integral crushing occurs is as follows:
2.2.2. Low Normal Force Level
If the maximum static frictional force on the surface of the contact point is less than the tangential force required for either sphere crushing, relative sliding between the two particles will occur before breakage (see Figure 5a), which results in a reduction in the contact area (see Figure 5b). The decrease in contact area leads to the increase in force per unit area on the surface of the contact point. It is assumed that when the relative slip between the two spheres is small, the increase in force per unit area on the surface of the contact point does not cause a secondary occurrence of local compaction. With the increasing uniform load q at the contact surface, the values of Kmob at each point inside the sphere along the z-axis increase. Once the Κmob value at a point of the inner sphere along the z-axis passing through the center of the bottom surface of the conical core reaches Κ, the whole sphere crushes (see Figure 5c). Meanwhile, the relationship between the normal and tangential forces at the moment of particle crushing is . When the normal force is small enough, the relative slip is large, resulting in a small contact area between the two particles and thus local compaction under the contact surface caused by stress concentration occurs again rather than integral crushing.
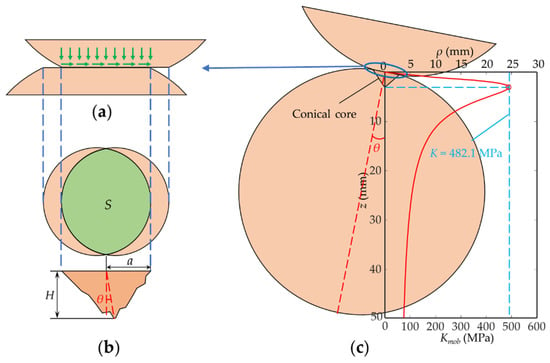
Figure 5.
(a) Relative slip occurring on the contact surface; (b) a detailed sketch of the shape and size of the conical core; (c) distribution of Kmob values inside the sphere along the z-axis at the moment of breakage. σc = 50 MPa, σt = 3 MPa, ν = 0.3 and R = 25 mm.
To sum up, the relationship between the normal and tangential forces in the normal–tangential contact test when the overall crushing occurs is obtained using the following:
where Fnmin is the minimum normal force required for spherical particle crushing under normal–tangential contact conditions. If , there will be a secondary occurrence of local compaction at the contact point rather than particle breakage. Different from the normal contact test, both the rupture surface and the conical core have the same inclination that takes the value of the following:
The bottom area and the height of the conical core are solved using Equations (4) and (19), respectively.
3. Particle Contact Test
To verify the above theory, the authors performed normal–tangential contact tests between two gypsum spherical particles, which is discussed in detail next.
3.1. Materials and Methods
The particular gypsum used in this study is the Sanxin dental plaster produced by Yuyao Xinshi Gypsum Products Co., Ltd., Yuyao, Zhejiang, China. For 25% water content (defined as the mass of water divided by the mass of dental stone powder), the 1-h and long-term compressive strengths of the plaster made by the dental stone powder are about 35 and 75 MPa, respectively. The reason why gypsum was chosen as the test material was that the sample preparation was simple, the influence of natural cracks in the rock could be eliminated, and the isotropic brittle material could be well simulated. In this experiment, gypsum was made by using water contents of 35% during mixing, and the mixing time and curing time were 5 min and 14 days, respectively. Spheres with a diameter of approximately 48 mm were prepared. This particle size was chosen because if the sphere is too small, it would be hard to observe and measure the shape and size of the conical core, and if it is too large, the exothermic hardening process of the gypsum may induce temperature cracking inside the specimen. The basic mechanical parameters acquired by rock tests of this high-strength gypsum material used in the test are shown in Table 1.

Table 1.
Physical parameters of the gypsum material.
Among these mechanical parameters, Young’s modulus, Poisson ratio and UCS were obtained by compressing solid circular cylinders of the material with a length of 100 mm and a diameter of 50 mm, while UTS was obtained by the Brazilian splitting test of solid circular cylinders of the material with a length of 50 mm and a diameter of 50 mm. Particle contact tests under ball–plane contact conditions were performed to obtain crushing modulus of the spheres [48]. The surface sliding friction coefficient of gypsum material in this test was obtained by the device shown in Figure 6 and the following equation:
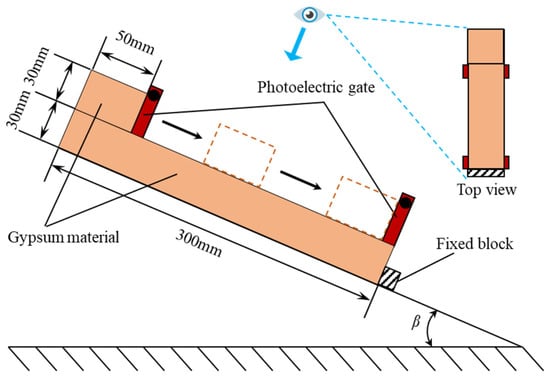
Figure 6.
A device for measuring the surface sliding friction coefficient of the material. Both gypsum cubes were fabricated by the same process as the spheres used in the formal test, and the lower cube was fixed on the slope. Two photoelectric gates were used to record the time interval t as the upper gypsum cubes passed through them.
All of the results are the means of 5 repeated tests.
The equipment used in the test was the rock rheological testing system (see Figure 7) in the Key Laboratory of Geotechnical and Underground Engineering, Tongji University, China, which can provide a maximum vertical pressure of 500 kN and a horizontal pressure of 300 kN. The minimum controllable deformation value of this rock rheological testing system is 0.001 mm and the minimum controllable mechanical value is 5 N. The system is equipped with a high-speed static force–displacement acquisition system, and the highest acquisition frequency is 100 times per second. In the present study, the acquisition frequency was set to 5 times per second. The upper and lower spheres are fixed with circular arc-shaped supports.
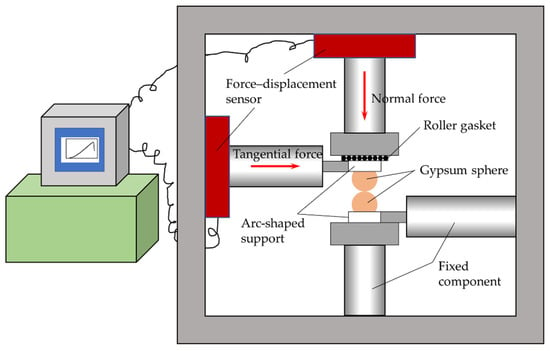
Figure 7.
An illustration of the rock rheological testing system. The roller gasket is used to eliminate the influence of friction between the arc-shaped support and the loading component.
In order to accurately control and measure the vertical and transverse forces, respectively, the following loading methods are adopted. First, the vertical loading component slowly applies a pressure to the upper sphere to a certain normal force grade Fn (Fn < Fcr). Then, keep the vertical force unchanged and slowly apply a transverse force to the upper sphere by using the transverse loading component until one of the spheres crushes. The vertical loading component is controlled by force at a rate of 5 N/s, while the transverse loading component is controlled by displacement at a rate of 0.001 mm/s. The air temperature and relative humidity in the laboratory were 28 °C and 49%, respectively.
Before the formal tests, the authors derived the force required for the sphere crushing under normal contact conditions by combining Equations (13)–(18), and . Therefore, a total of 9 groups of normal–tangential contact tests were performed, and their normal force grades were 6.016 kN, 6.417 kN, 6.818 kN, 7.219 kN, 7.620 kN, 7.700 kN, 7.780 kN, 7.861 kN and 7.941 kN, separately. For each normal force grade, 3 sets of replicate tests were carried out. In the test, the tangential forces when particle breakage occurred were recorded. Moreover, the inclination of the conical core and the rupture surface, as well as the size of the conical core, were measured after particle breakage occurred.
3.2. Results
Table 2 shows a comparison between the test and the theoretical analysis, and they are in good agreement. The heights of the conical cores are all about 2.9 mm and are not listed here since their changes are very small for different normal force grades. It is clear that in the normal–tangential contact test, the normal force grade has a great influence on the features of particle breakage. In the low–normal force level, the size of the conical core increases with the increasing normal force grade, while the inclination of the conical core and the rupture surface is fixed. In the high–normal force level, the inclination of the conical core and the rupture surface decreases with the increasing normal force grade, and the conical core has a fixed size.

Table 2.
Comparison between the predicted and measured values including the inclinations of the rupture surface and the conical core, and the bottom areas of conical core. The heights of the conical cores are not listed due to the small differences.
Figure 8 shows the relationship between Fncr and Ftcr, including the theoretical predictions and the data measured in the particle contact test. Obviously, when Fncr < 7.639 kN (), the relationship between Ftcr and Fncr presents a titled straight line with a slope of 0.32 (μ); when Fncr ≥ 7.639 kN (), the Ftcr–Fncr curve is a circular arc centered at the origin of the coordinate. The test under normal contact conditions [48] can be regarded as a specific situation where the tangential force on the contact surface is zero (see the purple circle in Figure 8). From the plot, the data measured in the test are in good agreement with the predicted values. If the normal force is too small, the relative slippage of the two spheres is too large, bringing about a secondary occurrence of local compaction rather than the overall breakage. This situation is too complex and therefore is not discussed in this paper.
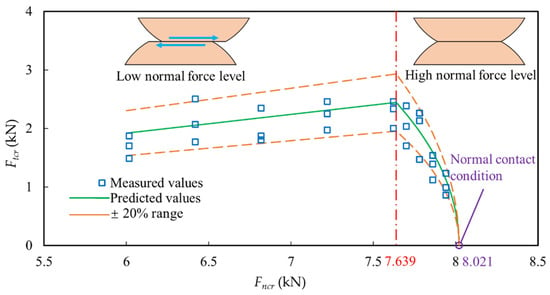
Figure 8.
The predicted relationship between the normal and tangential forces at failure as well as the experimental data. The red dot dash line divides the curve into the following two parts: the low–normal force level and the high–normal force level.
4. Discussion
In the present study, particle breakage of two spheres under normal–tangential contact conditions is investigated by theoretical analysis and experimental research. Considering different normal forces, there are the following two types of particle breakage: the high–normal force level in which there is no relative slippage between the spheres, and the low–normal force level in which relative slippage occurs between the spheres.
In the high–normal force level, the size of the conical core is almost the same as that in the normal contact test. The difference is that under normal contact conditions, the conical core is a positive cone, while under normal–tangential contact conditions, it is an inclined cone. Different from the normal contact test, there is an angle between the rupture surface and the diameter passing through the center of the contact point. Furthermore, the conical core and the rupture surface have the same inclination, which becomes smaller with increasing normal force. The tangential force required for particle breaking decreases with the increasing normal force, and the relationship between the normal and tangential forces presents an arc with the origin of the coordinate as the center of the circle.
In the low–normal force level, both the bottom area and the height of the conical core reduce as the normal force decreases, and the bottom is not a circle anymore. The inclination of the conical core and the rupture surface has a fixed value—. The tangential force when particle breakage occurs is the sliding frictional force between the two spheres, and it increases with the increasing normal force. When the normal force is less than a certain value, and the contact area between the two spheres decreases to a certain extent due to relative slippage, local compaction occurs again rather than particle breakage, which is not discussed here due to its complexity.
5. Conclusions
In this paper, the micromechanism of the breakage of two spherical gypsum particles under normal–tangential contact conditions is investigated both theoretically and experimentally. The theoretical analysis in this paper is based on the normal contact test. The purpose of particle contact tests is to verify the validity of the theory. The test data are in good agreement with the theoretical prediction. The following conclusions are made:
- The normal–tangential contact breakage of two spherical particles is divided into two cases depending on whether there is relative sliding—the high–normal force level and the low–normal force level;
- In the high–normal force level, the size of the conical core does not change with the variation in the contact force, while its inclination decreases with the increasing normal force. In the low–normal force level, the inclination of the conical core does not change with the variation in the contact force, while the size becomes smaller with the decreasing normal force;
- The rupture surface when the breakage occurs has a fixed inclination in the low–normal force level. However, it decreases with the increasing normal force in the high–normal force level. The rupture surface and conical core always have the same inclination;
- As the normal force increases, the tangential force required for the overall breakage increases first and then decreases.
Author Contributions
Conceptualization, J.Z. and Y.N.; formal analysis, Y.N.; software, S.Y. and L.L.; data curation, Y.Z.; writing—original draft, Y.N.; writing—review & editing, Y.N. and L.L. All authors have read and agreed to the published version of the manuscript.
Funding
This research was funded by the National Natural Science Foundation of China (No. 51479138).
Institutional Review Board Statement
Not applicable.
Informed Consent Statement
Not applicable.
Data Availability Statement
The data presented in this study are available in insert article.
Conflicts of Interest
The authors declare no conflict of interest. The funders had no role in the design of the study; in the collection, analyses, or interpretation of data; in the writing of the manuscript, or in the decision to publish the results.
References
- Kim, D.; Ha, S. Effects of Particle Size on the Shear Behavior of Coarse Grained Soils Reinforced with Geogrid. Materials 2014, 7, 963–979. [Google Scholar] [CrossRef]
- Brown, S.F.; Kwan, J.; Thom, N.H. Identifying the Key Parameters That Influence Geogrid Reinforcement of Railway Ballast. Geotext. Geomembr. 2007, 25, 326–335. [Google Scholar] [CrossRef]
- Chau, K.T. Analytic Solutions for Diametral Point Load Strength Tests. J. Eng. Mech. 1998, 124, 875–883. [Google Scholar] [CrossRef]
- Ennio, M.P. Soil–Geosynthetic Interaction: Modelling and Analysis—Sciencedirect. Geotext. Geomembr. 2009, 27, 368–390. [Google Scholar] [CrossRef]
- Modoni, G.; Koseklt, J.; Anh Dan, L.Q. Cyclic Stress-Strain Response of Compacted Gravel. Geotechnique 2011, 61, 473–485. [Google Scholar] [CrossRef]
- Matsuo, S. Microscopic Study on Deformation and Strength of Clays; ICSMFE: Tokyo, Japan, 1977. [Google Scholar]
- Rowe, P.W. The Stress-Dilatancy Relation for Static Equilibrium of an Assembly of Particles in Contact. Proc. R. Soc. A 1962, 269, 500–527. [Google Scholar]
- Kujundžić, T.; Klanfar, M.; Korman, T.; Briševac, Z. Influence of Crushed Rock Properties on the Productivity of a Hydraulic Excavator. Appl. Sci. 2021, 11, 2345. [Google Scholar] [CrossRef]
- Lee, K.L.; Farhoomand, I. Compressibility and Crushing of Granular Soil in Anisotropic Triaxial Compression. Can. Geotech. J. 1967, 4, 68–86. [Google Scholar] [CrossRef]
- Leroueil, S.; Vaughan, P.R. The General and Congruent Effects of Structure in Natural Soils and Weak Rocks. Geotechnique 1990, 40, 467–488. [Google Scholar] [CrossRef]
- Maqbool, S.; Koseki, J. Large-Scale Triaxial Tests to Study Effects of Compaction Energy and Large Cyclic Loading History on Shear Behavior of Gravel. Soils Found. 2010, 50, 633–644. [Google Scholar] [CrossRef]
- Camacho, G.T.; Ortiz, M. Computational Modelling of Impact Damage in Brittle Materials. Int. J. Solids Struct. 1996, 33, 2899–2938. [Google Scholar] [CrossRef]
- Cheng, H.; Nakata, Y.; Bolton, M. Micro- and Macro-Mechanical Behavior of Dem Crushable Materials. Geotechnique 2008, 58, 471–480. [Google Scholar] [CrossRef]
- Cheng, Y.P.; Bolton, M.D.; Nakata, Y. Grain Crushing and Critical States Observed in Dem Simulations. In Powders Grains; A.A. Balkema: Rotterdam, The Netherlands, 2005; pp. 1393–1397. [Google Scholar]
- McDowell, G.R.; Lu, M. Discrete Element Modelling of Ballast Abrasion. Geotechnique 2006, 56, 651–655. [Google Scholar] [CrossRef]
- Shi, D.; Zheng, L.; Xue, J.; Sun, J. Dem Modeling of Particle Breakage in Silica Sands under One-Dimensional Compression. Acta Mech. Solida Sin. 2016, 29, 78–94. [Google Scholar] [CrossRef]
- Utili, S.; Nova, R. Dem Analysis of Bonded Granular Geomaterials. Int. J. Numer. Anal. Met. 2010, 32, 1997–2031. [Google Scholar] [CrossRef]
- Alshibli, K.; Cil, M. 3d Evolution of Sand Fracture under 1d Compression. Geotechnique 2014, 64, 351–364. [Google Scholar] [CrossRef]
- Coop, M.R.; Sorensen, K.K.; Freitas, T.B.; Georgoutsos, G. Particle Breakage During Shearing of a Carbonate Sand. Geotechnique 2004, 54, 157–163. [Google Scholar] [CrossRef]
- Delenne, J.Y.; Youssoufi, M.S.E.; Cherblanc, F.; Bénet, J.C. Mechanical Behaviour and Failure of Cohesive Granular Materials. Int. J. Numer. Anal. Met. 2004, 28, 1577–1594. [Google Scholar] [CrossRef]
- Fu, P.C.; Dafalias, Y.F. Fabric Evolution within Shear Bands of Granular Materials and Its Relation to Critical State Theory. Int. J. Numer. Anal. Met. 2011, 35, 1918–1948. [Google Scholar] [CrossRef]
- Li, Y. Test Granular Materials Failure Using Bi-Directional Simple Shear Apparatus: A Review. Appl. Sci. 2018, 8, 1140. [Google Scholar] [CrossRef]
- Lin, P.S.; Chang, C.W.; Chang, W.J. Characterization of Liquefaction Resistance in Gravelly Soil: Large Hammer Penetration Test and Shear Wave Velocity Approach. Soil Dyn. Earthq. Eng. 2004, 24, 675–687. [Google Scholar] [CrossRef]
- Tejchman, J.; Górski, J.; Einav, I. Effect of Grain Crushing on Shear Localization in Granular Bodies During Plane Strain Compression. Int. J. Numer. Anal. Met. 2012, 36, 1909–1931. [Google Scholar] [CrossRef]
- Wang, J.; Yan, H. On the Role of Particle Breakage in the Shear Failure Behavior of Granular Soils by Dem. Int. J. Numer. Anal. Met. 2013, 37, 832–854. [Google Scholar] [CrossRef]
- Anhdan, L.Q.; Tatsuoka, F.; Koseki, J. Viscous Effects on the Stress-Strain Behavior of Gravelly Soil in Drained Triaxial Compression. Geotech. Test. J. 2006, 29, 660–661. [Google Scholar] [CrossRef]
- Kongsukprasert, L.; Tatsuoka, F. Ageing and Viscous Effects on the Deformation and Strength Characteristics of Cement-Mixed Gravelly Soil in Triaxial Compression. Soils Found. 2005, 45, 55–74. [Google Scholar] [CrossRef]
- McDowell, G.R.; Li, H. Discrete Element Modelling of Scaled Railway Ballast under Triaxial Conditions. Granul. Matter 2016, 18, 66. [Google Scholar] [CrossRef]
- Marsal, R.J. Large Scale Testing of Rockfill Materials. J. Soil Mech. Found. Div. 1967, 93, 27–43. [Google Scholar] [CrossRef]
- Li, L.; Zhao, C.; Zhang, Y.W.; Ouyang, G.B.; Yu, S.C.; Zhou, J. Particle Breakage Characteristics of Coarse-Grained Soil under Point-Point Contact. In Proceedings of the IOP Conference Series: Earth and Environmental Science, China Rock 2020, Beijing, China, 23–26 October 2020; Volume 570, p. 032036. [Google Scholar] [CrossRef]
- Zhao, C.; Hou, R.; Zhou, J. Particle Contact Characteristics of Coarse-Grained Soils under Normal Contact. Eur. J. Environ.Civ. Eng. 2018, 22, s114–s129. [Google Scholar] [CrossRef]
- Zhou, J.; Niu, Y.R.; Zhou, Y.H.; Zhang, J.; Zhao, C. The Ball-Surface Normal Contact Experiment Research and Numerical Simulation of Coarse Grained Soil. In Proceedings of GeoShanghai 2018 International Conference: Fundamentals of Soil Behaviours; Springer: Singapore, 2018. [Google Scholar] [CrossRef]
- Zhou, J. Experimental Study on Contact of Gypsum Particles. Chin. J. Tongji Univ. 2016, 44, 67–72. [Google Scholar] [CrossRef]
- Wang, Z.H.; Wang, P.J.; Jing, X.K.; Zhou, J.; Xiao, Z.C. A Study on Inter-Particle Contact Behaviors and Micro Contact Models of Coarse-Grained Soil. Chin. J. Rock Mech. Eng. 2018, 37, 1980–1992. [Google Scholar] [CrossRef]
- Zhou, J.; Zhang, Y.W.; Zhou, Y.; Zhang, J. Experimental Study on Particle Breakage of Coarse-Grained Soil Considering Normal Contact Force. Chin. J. Geotech. Eng. 2018, 40, 7–14. [Google Scholar] [CrossRef]
- Zhou, J.; Ouyang, G.B.; Luo, C.; Wang, Z. Experimental Research on Tangential Contact Characteristics of Marble Spherical Particles. Chin. J. Undergr. Sp. Eng. 2017, 13, 71–78, 116. [Google Scholar]
- Yu, S.C.; Jia, M.; Zhou, J.; Zhao, C.; Li, L. Micro-Mechanism of Spherical Gypsum Particle Breakage under Ball–Plane Contact Condition. Appl. Sci. 2019, 9, 4795. [Google Scholar] [CrossRef]
- Arbiter, N.; Harris, C.C.; Stamboltzis, G.A. Single Fracture in Brittle Spheres. Trans. AIME 1969, 244, 118–133. [Google Scholar]
- Bergstrom, B.H.; Sollenberger, C.L.; Mitchell, W.J. Energy Aspects of Single Particle Crushing. Trans. AIME 1961, 223, 362–372. [Google Scholar]
- Chau, K.T.; Wei, X.X. Spherically Isotropic, Elastic Spheres Subject to Diametral Point Load Strength Test. Int. J. Solids Struct. 1999, 36, 4473–4496. [Google Scholar] [CrossRef]
- Dean, W.R.; Sneddon, I.M.; Parsons, H.W. Distribution of Stress in a Decelerating Elastic Sphere. In Selected Government Research Reports: Strength and Testing of Materials: Part II; HMSO: London, UK, 1952; pp. 212–234. [Google Scholar]
- Mindlin, R.D.; Deresiewicz, H. Elastic spheres in contact under varying oblique forces. J. Appl. Mech. 1953, 20, 327–344. [Google Scholar] [CrossRef]
- Hiramatsu, Y.; Oka, Y. Determination of the Tensile Strength of Rock by a Compression Test of an Irregular Test Piece. Int. J. Rock Mech. Min. 1966, 3, 89–90. [Google Scholar] [CrossRef]
- Wu, S.Z.; Chau, K.T.; Yu, T.X. Crushing and Fragmentation of Brittle Spheres under Double Impact Test. Powder Technol. 2004, 143–144, 41–55. [Google Scholar] [CrossRef]
- Chau, K.T.; Wei, X.X.; Wong, R.H.C.; Yu, T.X. Fragmentation of Brittle Spheres under Static and Dynamic Compressions: Experiments and Analyses. Mech. Mater. 2000, 32, 543–554. [Google Scholar] [CrossRef]
- Kschinka, B.A.; Perrella, S.; Nguyen, H.; Bradt, R.C. Strengths of Glass Spheres in Compression. J. Am. Ceram. Soc. 2010, 69, 467–472. [Google Scholar] [CrossRef]
- Russell, A.R.; Muir, W.D. Point Load Tests and Strength Measurements for Brittle Spheres. Int. J. Rock Mech. Min. 2009, 46, 272–280. [Google Scholar] [CrossRef]
- Niu, Y.R.; Zhao, C.; Li, L.; Zhou, J.; Zhang, Y.W.; Yu, S.C. Micromechanism of the Breakage of Two Spherical Gypsum Particles under Ball–Ball Normal Contact Conditions. Mater. Struct. 2021. under review. [Google Scholar]
- Wu, J. Elastic Mechanics; Higher Education Press: Beijing, China, 2001. [Google Scholar]
- Christensen, R.M. Yield Functions/Failure Criteria for Isotropic Materials. Proc. R. Soc. A Math. Phy. 1997, 453, 1473–1491. [Google Scholar] [CrossRef]
- Christensen, R.M. Yield Functions, Damage States, and Intrinsic Strength. Math. Mech. Solids 2000, 5, 285–300. [Google Scholar] [CrossRef]
Publisher’s Note: MDPI stays neutral with regard to jurisdictional claims in published maps and institutional affiliations. |
© 2021 by the authors. Licensee MDPI, Basel, Switzerland. This article is an open access article distributed under the terms and conditions of the Creative Commons Attribution (CC BY) license (https://creativecommons.org/licenses/by/4.0/).