Article

Shoreline Response to Wave Forcing and Sea Level Rise along a Geomorphological Complex Coastline (Western Sardinia, Mediterranean Sea)

1
Istituto per lo Studio degli Impatti Antropici e Sostenibilità in Ambiente Marino—Località Sa Mardini, 09072 Torregrande Oristano, Italy
2
Fondazione IMC—Centro Marino Internazionale—ONLUS—Località Sa Mardini, 09072 Torregrande Oristano, Italy
3
Dipartimento di Scienze Ambientali, Informatica e Statistica, Università Ca’ Foscari, 30172 Venice, Italy
*
Author to whom correspondence should be addressed.
Appl. Sci. 2021, 11(9), 4009; https://doi.org/10.3390/app11094009
Submission received: 30 March 2021 / Revised: 21 April 2021 / Accepted: 25 April 2021 / Published: 28 April 2021
(This article belongs to the Special Issue Mediterranean Beach Morphodynamics under Climate Change)

Abstract

:
Beaches responses to storms, as well as their potential adaptation to the foreseeable sea level rise (SLR), were investigated along three beaches in a coastal tract in western Sardinia (Western Mediterranean Sea). The grain size of the sediments, the beach profile variability and the wave climate were analyzed in order to relate morphological changes, geological inheritances and waves forcing. Multibeam, single-beam and lidar data were used to characterize the inner shelf morphologies and to reproduce the flooding due to the SLR. The studied beaches experienced major changes when consecutive storms, rather than singles ones, occurred along the coastline. The sediment availability, the grain size and the geomorphological structure of the beaches were the most important factors influencing the beach response. On the sediment-deprived coarse beaches the headlands favor the beach rotation, and the gravel barrier morphology can increase the resistance against storms. On the sediment-abundant beaches, the cross-shore sediment transport towards a submerged area leads to a lowering in the subaerial beach level and a contemporaneous shoreline retreat in response to storms. A very limited ingression of the sea is related to the SLR. This process may affect (i) the gravel barrier, promoting a roll over due to the increase in overwash; (ii) the embayed beach increasing its degree of embayment as headlands become more prominent, and (iii) the sediment-abundant beach with an erosion of the whole subaerial beach during storms, which can also involve the foredune area.

1. Introduction

The wave climate, the sediment grain size, the topographic features and tides are the main factors that controls the evolution of beaches and barriers in a short-term period [1,2]. Geological inheritance and headlands can also influence the beach morphology affecting shoaling processes, beach shape and sediment transport in both the submerged and emerged beach [3,4]. Moreover, sediment grain size and composition can affect the morphodynamics of beaches and the morphology of barrier systems [5,6,7,8,9,10].
Beaches and coastal barriers experienced drastic modifications in morphology and grain size during intense storms and extreme marine meteo events [1,11]. Storm events and storm surges can cause coastal erosion, coastal flooding, and damage to infrastructures [12]. During these events the run-up could cause overwash of beach berms or barrier crest, and the extreme flooding can involve inland areas [13,14,15]. The nature and the availability of sediments are important to modulate the beach and barriers storm response [16,17,18]. In general, the coarse-grained beaches, which commonly have a steep profile, are less eroded by storms in comparison to the fine-grained beaches [19]. The gravel barrier exhibits a high resistance against storms in respect to the sandy barrier [1,10].
The sediment supply is a key factor on the coastal barrier formation and preservation. The river sediment supply or reworked coastal sediment, including in situ carbonate production, can be the material that forms the coastal barrier [2,20,21]. Where sediment supply is low, the underlying geology sets the limits of morphological evolution and the volume of accommodation space for the sediments [17], and can influence the evolution of these systems. In fact, buried and emerged beachrocks or rocky outcrops in the proximity of the shoreline can influence the beach and barrier morphodynamics, limiting the beach profile variability and modulating the cross-shore sediment transport [1,22,23,24].
On the other hand, the SLR is one of the main factors that controls the long-term evolution of coastal sedimentary bodies, including beaches, dunes, and barrier systems [25,26,27]. It is well known that the rate of the SLR modulates the barrier development. A rapid increase in SLR can cause barrier drowning or barrier disappearance [28,29]. Sediment is not only necessary for the barrier formation, but the rate of sediment supply can modulate the barrier morphodynamics in relation to the sea level variation [2,30]. The interaction among the SLR rate, the sediment supply and the accommodation space, also influenced by the geological inheritance, controls the beach and barrier migration and preservation [28,29]. Rollover and overstepping models are considered the main processes for barrier migration along a transgressive shelf [31]. During the Holocene transgression along several kilometers of world coastline, the beaches and barrier systems were subjected to overstepping and continuous rollover [27].
Along the starved continental shelves, the biogenic carbonate sedimentation can be the main sediment supply for the coastal systems [21,32,33,34,35]. Along these shelves the inherited geology can exert primary control on barrier and beach evolution in respect to the SLR influencing the accommodation spaces and interfering with waves approaching the coast [17].
Since there is no evidence of future significant changes in wave regime [36,37], the effect of SLR on these systems may result in a retreat of the shorelines and a foredune erosion with a partial redistribution of the eroded sediment [21,38]. Hence, the effect of the SLR coupled with the assessment of the beach and barrier response to storms may be significant in the prediction of the adaptation of these coastal systems to the climate change forcing.
The main aim of this work is to estimate the adaptation of three beaches and barrier systems, developed along a coastline characterized by several geological constrains over a medium-term perspective, in respect to the foreseen SLR, by investigating the response and recovery of these systems to storms.

2. Study Area

The study area is located in the Sinis Peninsula, on the western coast of the island of Sardinia, western Mediterranean (Figure 1). It is included in the protected marine area (MPA) of the “Penisola del Sinis, Isola di Mal di Ventre”, established in 1997 by the Italian Minister for the Environment.
The geological setting of Sinis Peninsula includes a sequence of volcanic and sedimentary rocks (marls, sandstone and limestone), dating from the Neogene to the present [39]. In this geomorphic context, the beaches account for about 4.6 km of the total coastline length (about 8.5 km) and the rocky outcrops and spurs account for about 3.9 km. The sediments of the beaches are characterized by a coarse siliciclastic fraction and by a fine carbonate fraction [35]. The siliciclastic coarse grains, derived from the erosion of the granitic outcrops located in the Mal di Ventre Island, can be interpreted as relict sediments [34,35]. The finer biogenic carbonate sediment is produced inside the shallow coastal ecosystems and exported towards the beaches and dunes [21,35,40]. The sea floor of the Sinis Peninsula is colonized by extended meadows of the seagrass Posidonia oceanica. Prevailing winds are mainly from the northwest (Mistral about 48% of the total annual wind frequency), due to the high Mistral wind speed and large fetch (~500 km) the western coastline of Sardinia exhibits the largest maxima of significant wave height in the whole Mediterranean Sea [36], and the maximum wave height can be higher than 9 m with a peak period of about 12 s [41]. The morphological variability of beach profiles collected along the southern end of the Sinis Peninsula showed that the depth of closure for this area can be located at a depth of 9 m [42]. For the same area, De Falco et al., 2017 [21] fixed the coastal wedge limit at a depth of 15 m.
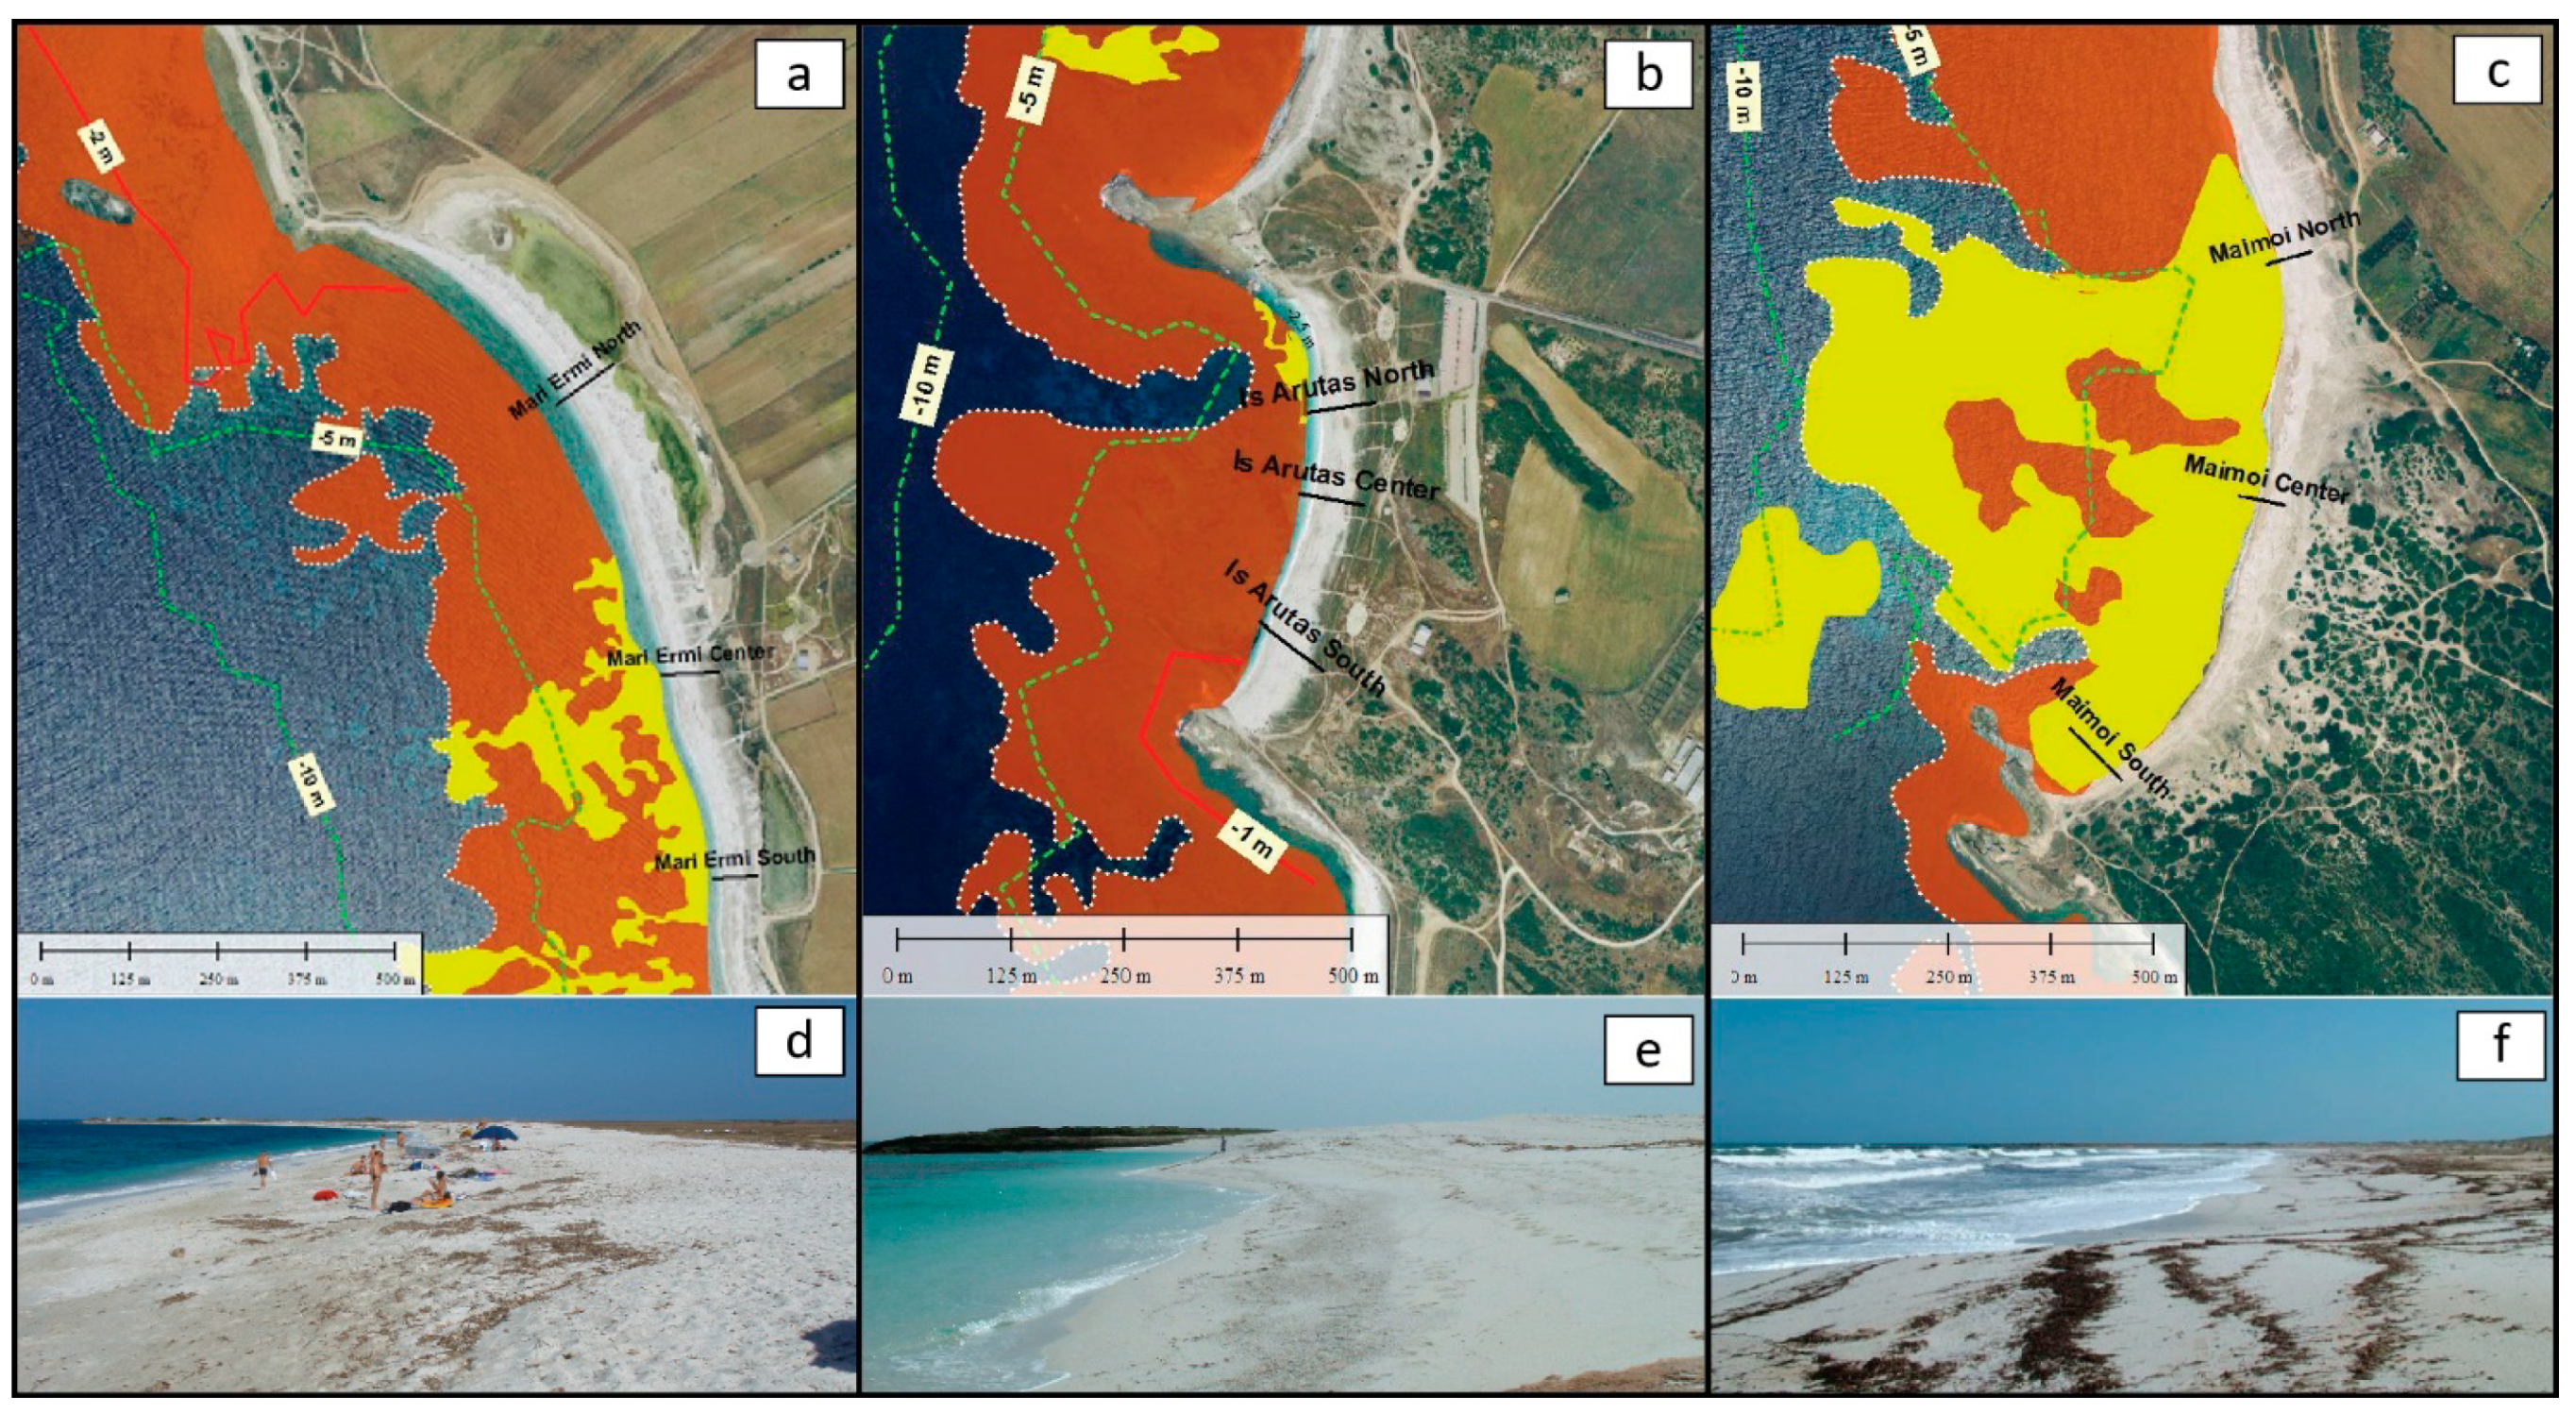
The studied beaches are located in the northern, central and southern sectors of the Sinis Peninsula (Figure 1b). The northern beach, named Mari Ermi (Figure 2a,d), is a beach ridge [43] about 1 km in length, the width of this system is about 60 m. The beach sediment is mainly composed of coarse siliciclastic sand and gravel, with a carbonate content of about 20% [35]. The orientation of the shoreline is influenced by the presence of a rocky cape which encloses the beach to the north. This cape interferes with waves coming from the northwest, this leads to a crenulated shape in the shoreline (Figure 2a). A limited submerged sandy beach was developed only in the southern sector and is characterized by the absence of morphological features such as bars. In the northern and central sectors, wide rocky outcrops occur in the submerged domain and sediments are sporadic or absent. A patchy Posidonia oceanica meadow colonizes the sea floor from a depth of about 5 m.
The central beach (Figure 2b,e), named Is Arutas, is an embayed beach with a length of about 500 m, and about 60 m of maximum cross-shore width. The sediment is wholly siliciclastic and composed mainly of very coarse sand and gravel [3,35,44]. Shallow rocky outcrops occurred close to the shoreline at a depth of 2 m, these outcrops prevent the development of the submerged sandy beach (Figure 2b). Simeone et al. [3] inferred a rotation process for this beach. A rocky sea floor characterizes the whole submerged domain of the beach. Patchy Posidonia oceanica meadows colonize the sea floor from a depth of about 5–10 m.
The southern beach (Figure 2c,f), named Maimoi, is about 1 km in length and 60 m in cross-shore beach width from the toe of the dune up to the shoreline. In the central and southern sectors of the beach, a wide transgressive dune field was developed. This dune field included an unvegetated foredune and parabolic vegetated dunes. The sediments of the beach are composed of the following two fractions: a siliciclastic coarser fraction, mainly located on the foreshore, and a finer biogenic carbonate fraction, mainly in the backshore, in the dune field and in the submerged beach [35,40]. In the latter, only a thin layer of sand is present. The southern end of Maimoi beach is a sandstone cape, oriented in a NW–SE direction, which has favored the trapping of the biogenic carbonate sediment [35].

3. Data and Methods

3.1. Sediments

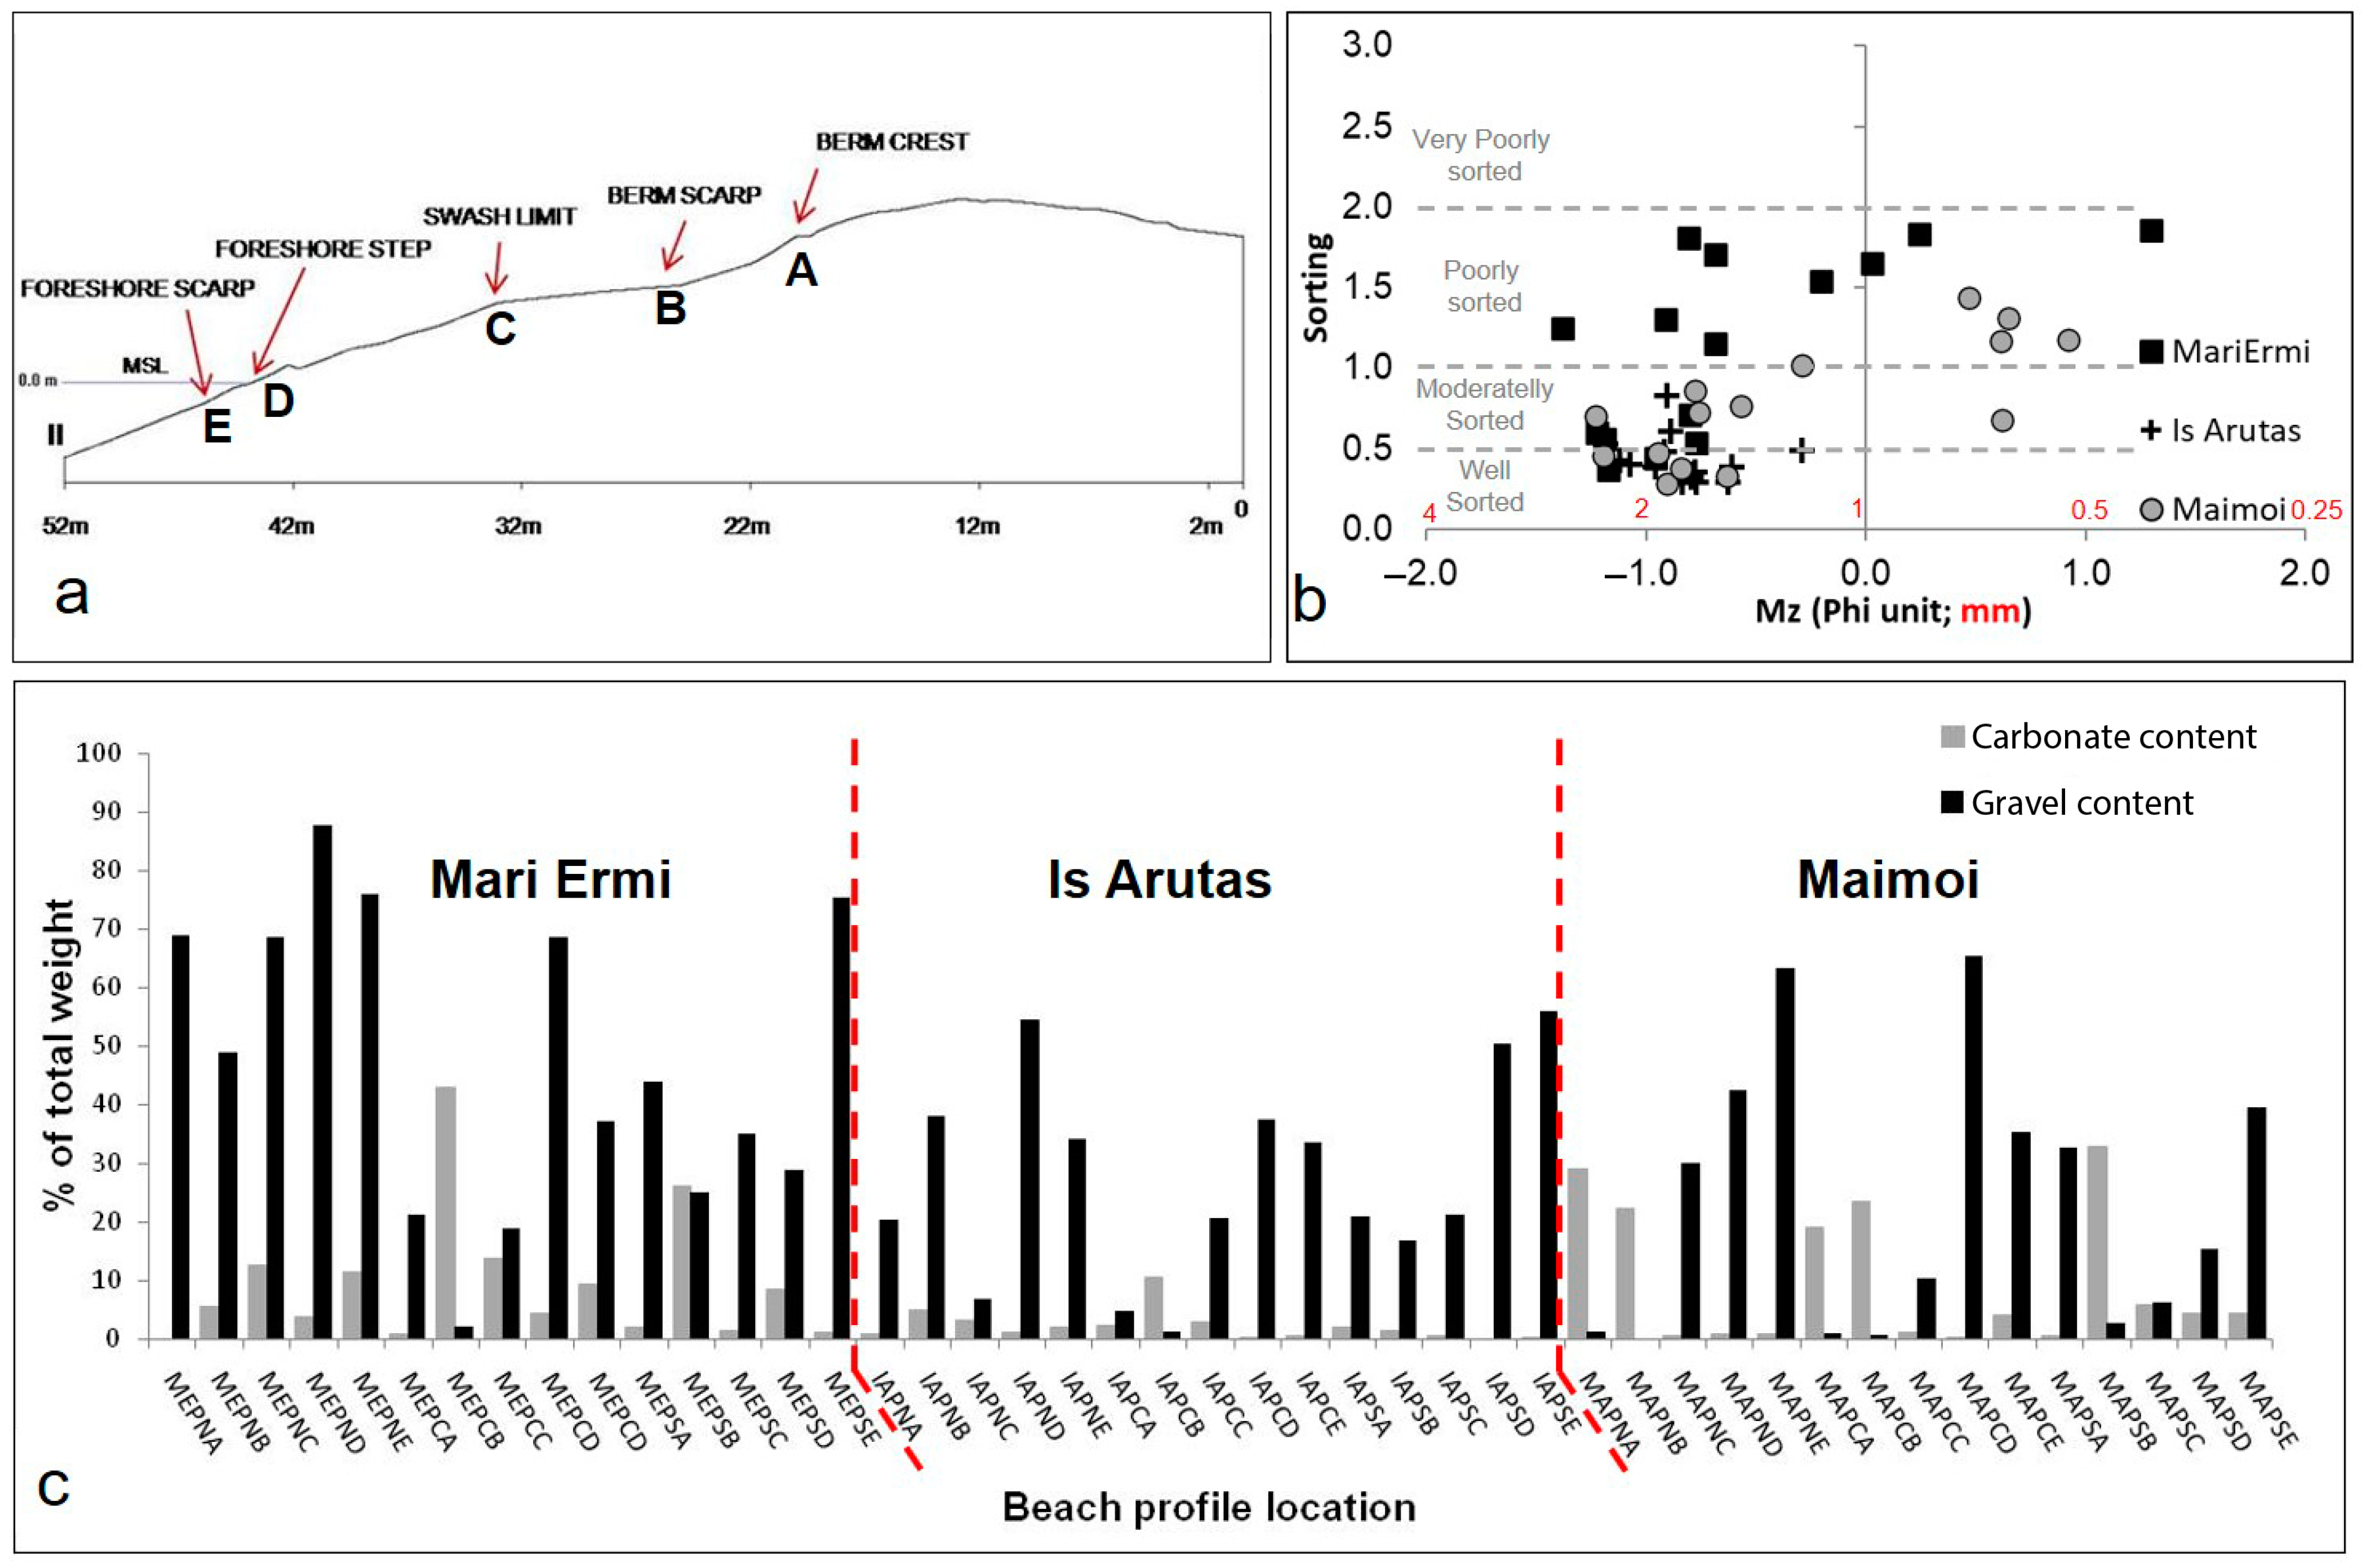
A sampling campaign was conducted in September 2010, in order to evaluate the grain size and the composition of the sediments. The samples were collected along three transects for each beach. Along each transect, a total of five samples were collected, as follows: berm crest, berm scarp, swash limit, foreshore step crest and foreshore step scarp (Figure 3a). Forty-five sediment samples were collected, 15 for each beach.
The sediments were analyzed for grain size distribution by dry sieving for the coarser fraction (>0.5 mm) and by a laser system (GalaiCis 1, liquid flow mode) for the finer fraction. The carbonate content (CaCO3 dry wt%) was determined by dissolution in hydrochloric acid (1 M HCl) for 4 h [35]. After being filtered through Whatman GF/C filters, the residue was dried and weighed. Statistical moments (Mz, So and Sk) were calculated using the GRADISTAT software [45]. Table 1 summarizes the average d50 (mm) of the samples collected on the foreshore of each profile (from the foreshore step scarp to the swash limit). The d50 was used to calculate the settling velocity (ws) by means of the Gibbs formula [46].

3.2. Beach Profiles

Positioning data along three cross-shore transects were acquired in the northern, central and southern areas of the subaerial domain of each beach (Figure 2a–c) from September 2010 to May 2011. The beach profiles were surveyed 9 times in the Mari Ermi and Is Arutas beaches and 10 times in Maimoi beach.
In Table 1, a summary of the beach profile survey operations were reported. Differential global positioning system (DGPS) technology was used to collect position data (X, Y, Z), with an accuracy of 7 cm on both the horizontal and vertical axes. The data were referred to the mean sea level of the IGM 95 Italian Geodetic National net (Rete Geodetica dell’Istituto Geografico Militare). The measured beach profiles started from the landward boundary of the beach, marked by the presence of vegetation or other features (man-made structures or physical limits), down to a depth of about 1 m below sea level. The position point (X, Y, Z) was collected every 2.5 m with the DGPS.
The vertical variation for each transect, was calculated as a standard deviation of the elevation for each point acquired along each repeated profile; the accretion/erosion volumes for each transect were also calculated considering all the profiles acquired along each transect. The variation along the beach profile section (expressed in m3 m−1) was calculated between two consecutive surveys along the north and central south transect, and reported in Table 2. These values were standardized and a cross-correlation analysis was performed for the external transects (northern and southern) for each embayment in order to highlight the beach rotation process [47,48,49]. The variation in volume from 22 October 2010 to 5 November 2010 was not considered in the analyses, because the survey of 5 November 2010 was not performed on every profile.

3.3. Wave Climate

The wave parameters, including the significant wave height Hs (m) and the peak period T (s), were measured by an offshore buoy located in the northwest of Sardinia (Alghero buoy) and are available online from the Rete Ondametrica Nazionale website (ISPRA-R.O.N., http://dati.isprambiente.it/dataset/ron-rete-ondametrica-nazionale/ accessed on 30 March 2021). These data have been used to define the wave climate on the western side of Sardinia.
The averaged Iribarren number (ξ0) was calculated for each mean beach profile and obtained as the averaged value considering the whole surveyed period (from 12 September 2010 to 13 May 2011), the obtained value was reported in Table 1. Furthermore, the dimensionless fall velocity Ω [50] (the mean values for the period between the topographic survey, as shown in [51]) was calculated for each beach.
Ω = Hb/wsT,
The breaking wave height Hb (m) used to compute Ω was derived from the Komar and Gaughan [52] formula, as follows:
Hb = 0.39g0.2(TH02)0.4,
where g is the acceleration due to gravity, T the peak period (s), H0 (m) is the significantly deeper wave height and ws (m s−1) is the average settling velocity (Table 1).
The ‘storm power index’, as defined by Karunarathna et al. [53], was calculated to define the strength of the storms that occurred during the monitored period, as follows:
Ps = Hs2maxD,
where Hs max (m) is the maximum significant storm wave height, D is the duration of the storms in hours, and Ps is expressed in (m2 h). The storms are defined as events occurring for more than 6 h consecutively, which account for wave heights higher than 2 m for all the considered intervals [54].

3.4. Multibeam and Single-Beam Acquisition

Multibeam echosounder (MBES) data were collected throughout the western inner shelf of Sardinia within the framework of the oceanographic cruise SONOS 07 (Figure 1b), data were collected to define the morphology of the seabed of the MPA “Penisola del Sinis Isola di Mal di Ventre” from a depth of about 40 m to a depth of about 10 m. Data were collected in 2007 using the R/V Thetis of the Italian National Research Council (CNR), equipped with a Seabat-Reson 8111 MBES device operating at 100 kHz. Specific indication on the instrument characteristics and processing can be found from De Falco et al. [31]. Finally, digital terrain models (DTMs) were produced at a 5 m resolution.
Single-beam echosounder (SBES) data were collected throughout the western inner shelf of Sardinia within the framework of the project “Stabilità Litorali Sinis” in 2005 (Figure 1b), the data were collected to define the morphology of the seabed of the MPA “Penisola del Sinis Isola di Mal di Ventre” from a depth of about 15 m to adepth of about 1.5 m. Data were collected using a small boat equipped with a Knudsen echosounder (vertical resolution of 10 cm) operating at 200 kHz, coupled with a differential global positioning system (accuracy of 7 cm in both vertical and horizontal positions). During the bathymetric survey, a series of transects, spaced about 50 m, were conducted perpendicular and parallel to the shoreline. A low-resolution DTM (resolution of 20 m) was obtained and used to define the main morphological features of the shallow inner shelf.

3.5. Digital Terrain Model Data

A digital terrain model of the whole region of Sardinia is available on the Regione Autonoma della Sardegna website (www.sardegnageoportale.it, accessed on 29 November 2019). The DTMs have been realized by the point clouds acquired using a laser scanner flight. The procedure of processing the point clouds is available on the Regione Autonoma della Sardegna website (http://webgis2.regione.sardegna.it/catalogodati/card.jsp?uuid=R_SARDEG:BFPNM accessed on 29 November 2019). The DTMs resulting from the processing of the laser scanner have a resolution of 1 m on the horizontal plan and 30 cm on the vertical accuracy.

4. Results

4.1. Sediments

The sediments collected on Mari Ermi are characterized by a high content of siliciclastic gravel and a carbonate content of about 10%. The highest gravel content was found in the northern sector of the beach (Figure 3c). The mean grain size ranged from 0.41 mm to 2.60 mm, and the sorting coefficient ranged from well sorted to poorly sorted (Figure 3b). The measured d50 value for the foreshore collected samples resulted ~1.90 mm (Table 1).
The sediments collected on Is Arutas were characterized by a siliciclastic gravel content ranging from about 1% to 54% and had a low content of carbonate sediments (Figure 3c). The mean grain size ranged from 1.22 mm to 2.33 mm, and the sorting coefficient ranged from very well sorted to moderately sorted (Figure 3b). The measured d50 value for the foreshore collected samples resulted ~−1.70 mm (Table 1).
The sediments collected on Maimoi were characterized by a siliciclastic gravel content ranging from 0% to 65% (Figure 3c). The mean grain size ranged from 0.52 mm to 2.35 mm, and the sorting coefficient ranged from very well sorted to poorly sorted (Figure 3b). The measured d50 value for the foreshore collected samples resulted ~1.60 mm (Table 1). All the sediments data are in agreement with previously published data [35].

4.2. Beach Profile Changes—Bulk Statistics

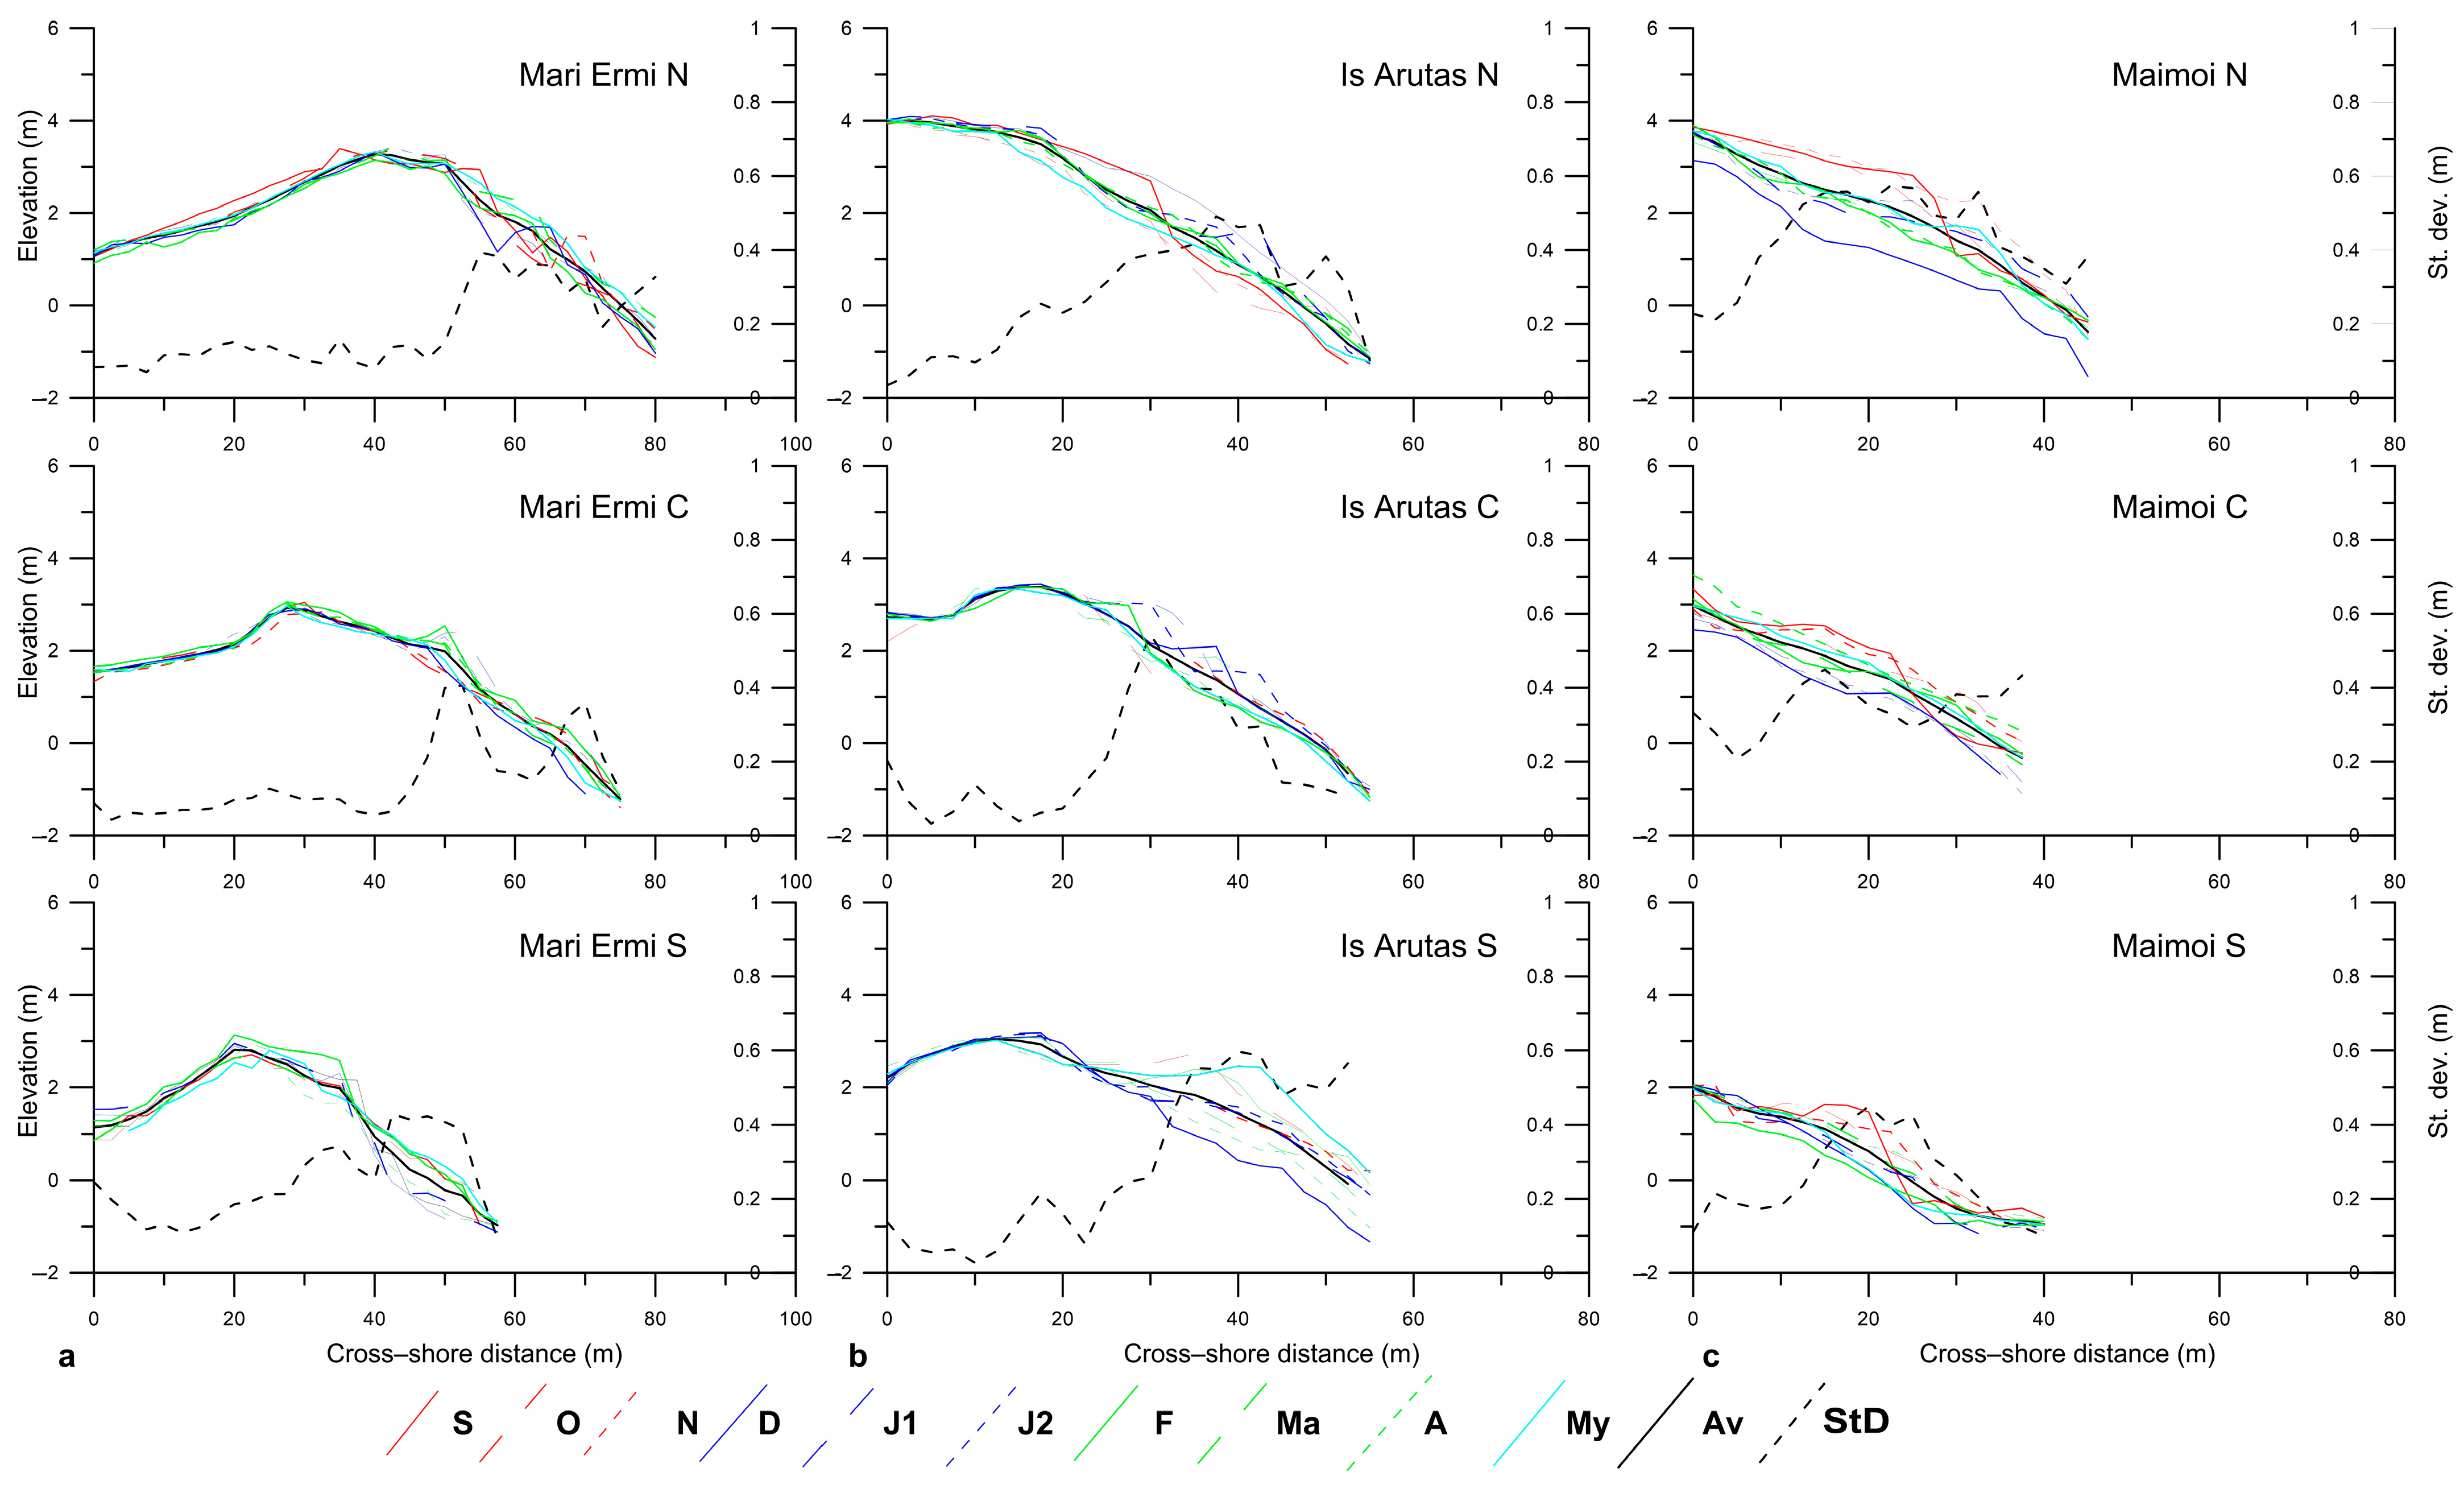
The surveyed elevation along profiles, standard deviation and mean elevation calculated along each beach profile are shown in Figure 4.
The mean beach profiles of Mari Ermi beach highlighted that the barrier is continuous from north to south. The northern sector of the barrier was more elevated than the central and southern sectors (about 3.3 m, 2.8 m and 2.8 m, respectively). Furthermore, the barrier was wider in the northern and central profiles in comparison to the southern one. The morphological variability was mainly located on the beachface area for northern and southern profiles, whereas along the central profile a peak of variability was found in the toe of the barrier (Figure 4a). Only for the southern profile, little morphological variability was found beyond the barrier (Figure 4a).
The mean beach profile of Is Arutas beach highlighted the presence of a storm berm in the most elevated area (Figure 4b). The width of the subaerial beach was almost unchanged for all profiles and accounted for about 60 m. The morphological variability was mainly located on the beachface of the northern and southern profile, while in the central profile the most variable area was located at the foot of the storm berm (Figure 4b).
The mean beach profiles on Maimoi beach showed that the width of the subaerial beach was about 40 m, and 30 m for the southern profile. The morphological variability involved the whole subaerial beach, from the toe of the dune up to the beachface where the highest variability was found (Figure 4c).
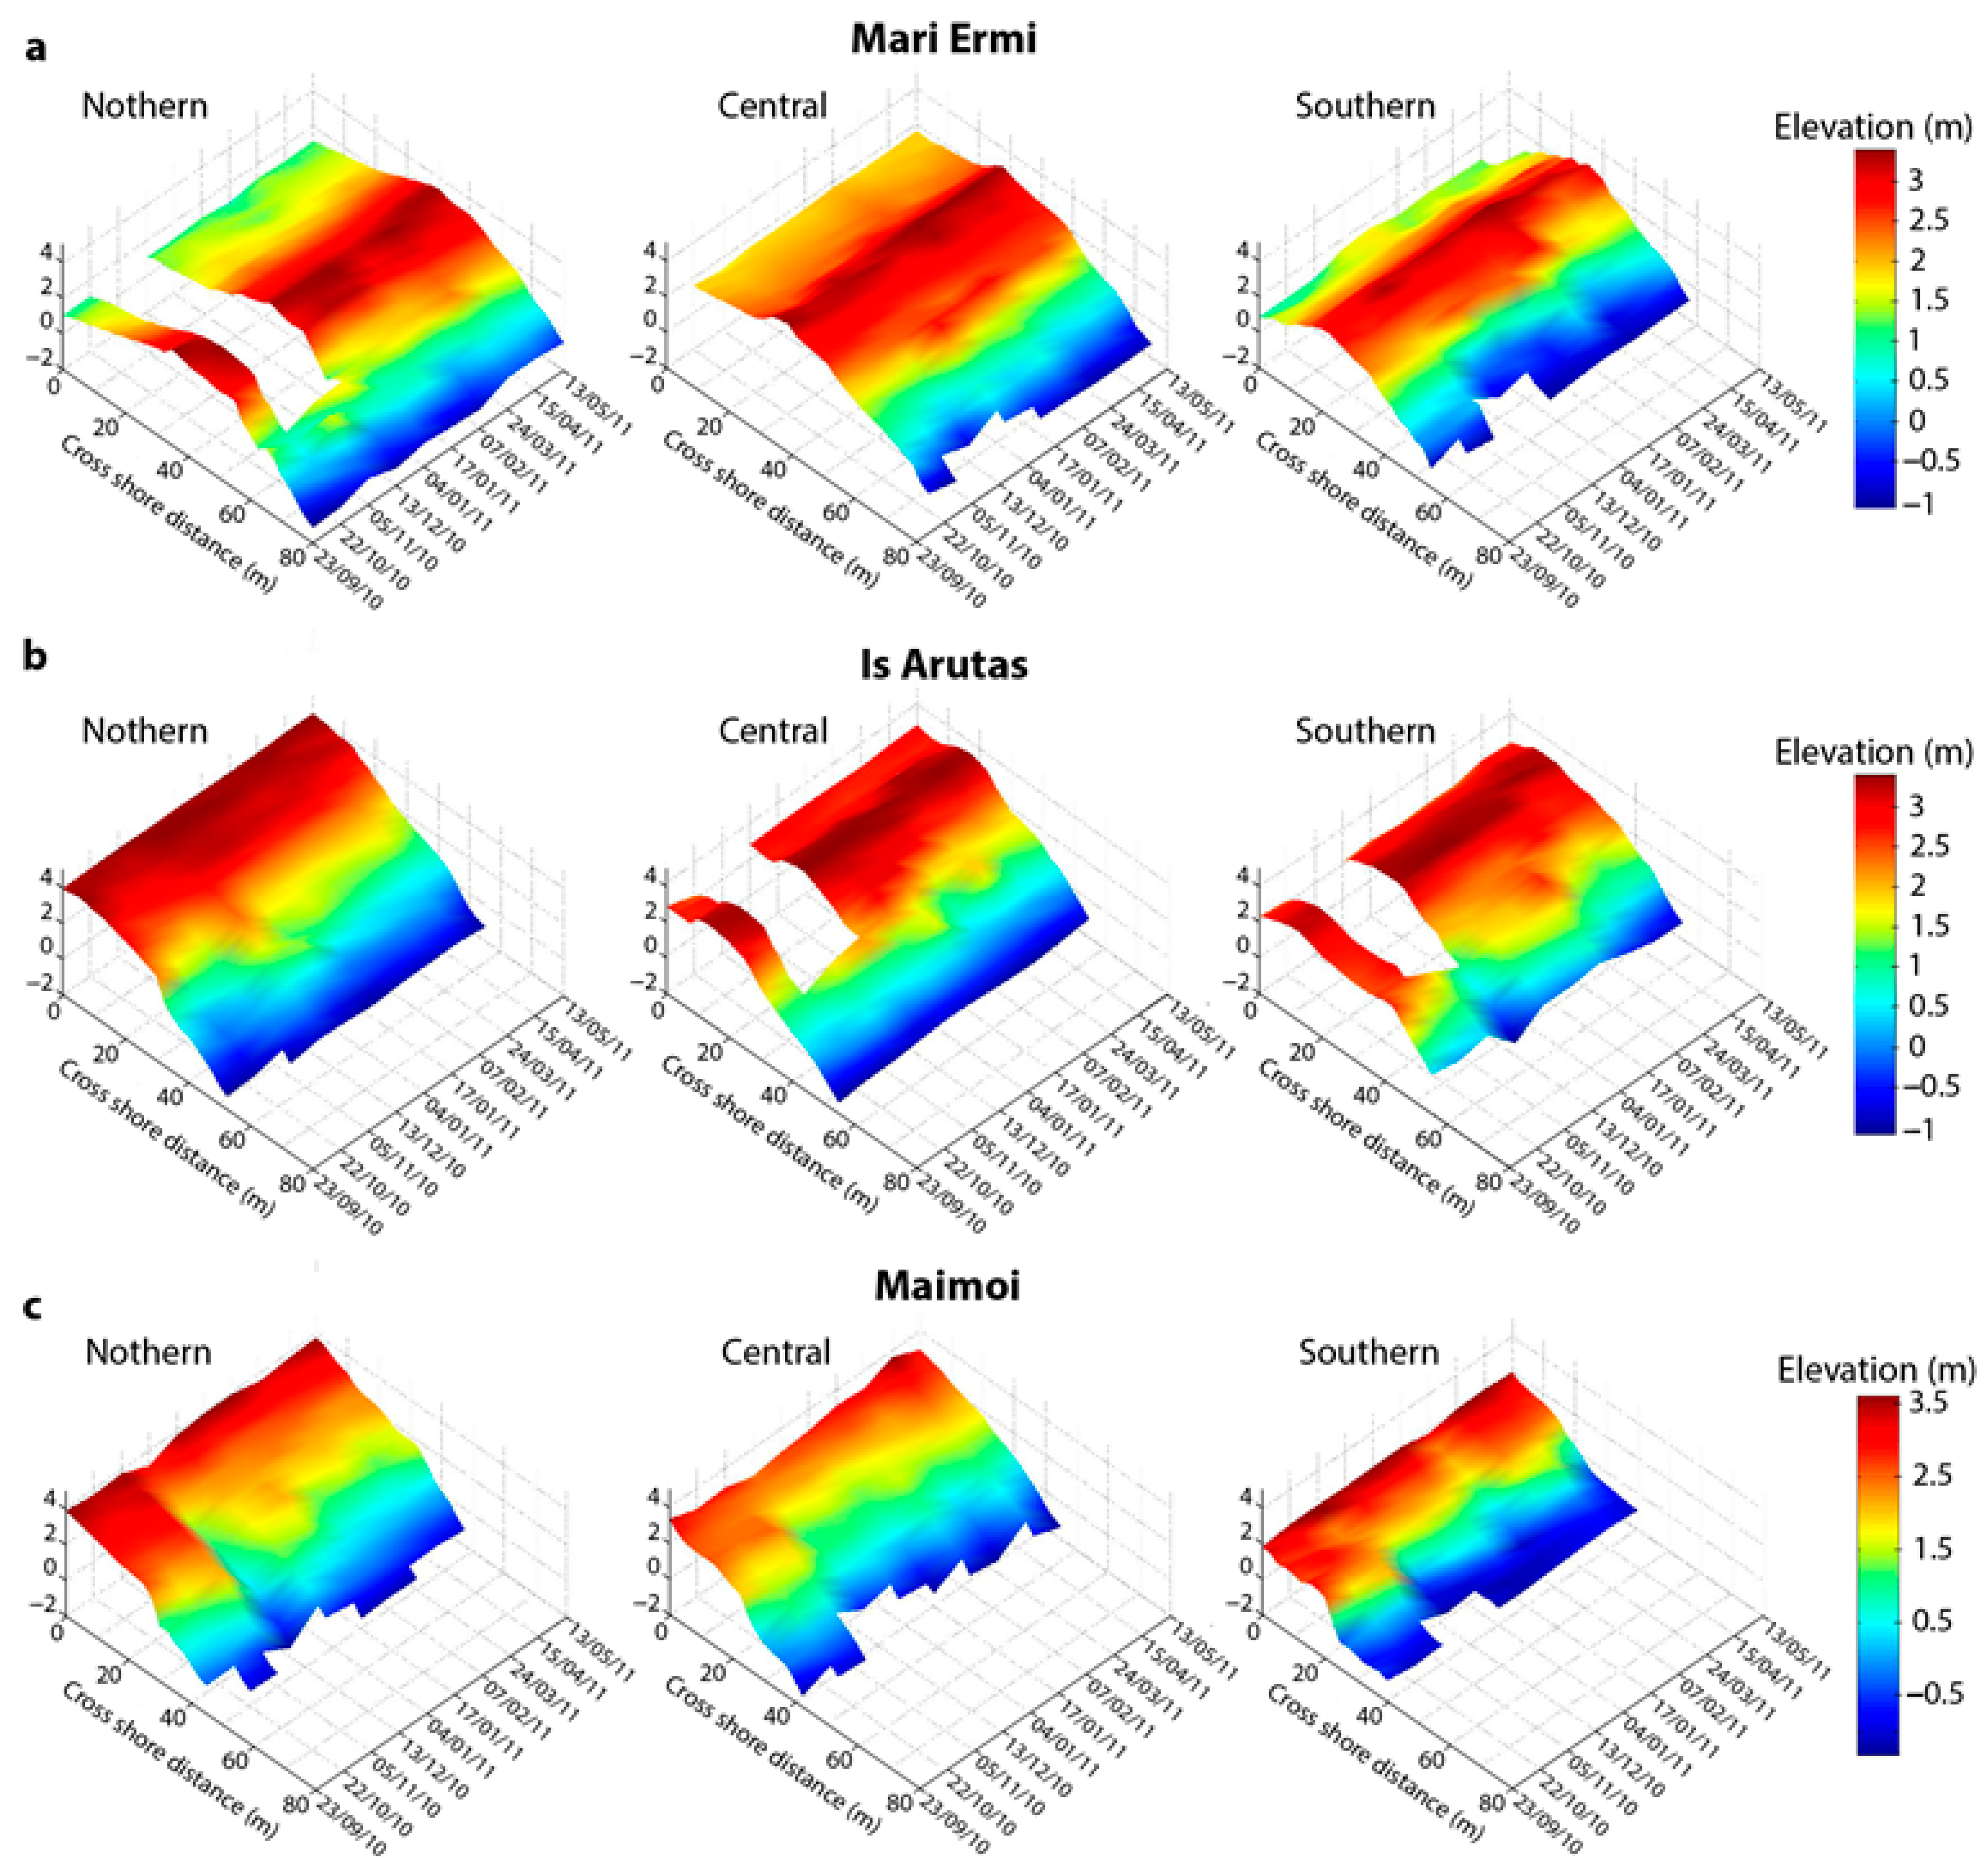
The evolution of the beach profiles is shown in Figure 5. On Mari Ermi beach, the top of the barrier did not show major variations along the northern and central transects. On the other hand, during the winter the berm destruction and construction occurred on the beachface. In the southern transect little variability was found in the back barrier area for the same period (Figure 5a).
On Is Arutas beach, the northern and southern profiles showed inverse behavior; when one advanced, the other retreated and vice versa (Figure 5b). This behavior was recorded during the winter, in the same period the berm developed in the central profile (Figure 5b).
The evolution of the beach profiles on Maimoi beach is presented in Figure 5c. Along Maimoi beach the profiles showed the same behaviors with a generalized erosion along each profile and a lowering in the beach level by about 1 m during winter (Figure 5c). Subsequently, the subaerial beach increased in width and the topographic elevation of the beach profiles increased in height (Figure 5c).

4.3. Wave Climate and Volumetric Changes

The dimensionless fall velocity values showed little variability among the beaches and remained close to one (reflective state) for each beach and for the whole surveyed period. The values of Ω calculated for each beach are shown in Figure 6. Also, the values of the averaged Iribarren number (ξ0), calculated along each beach profile, were about one for the overall profiles (Table 1). These values show that the breaking waves type on the studied beach can be considered as the plunging type (0.5 < ξ0 < 3.3).
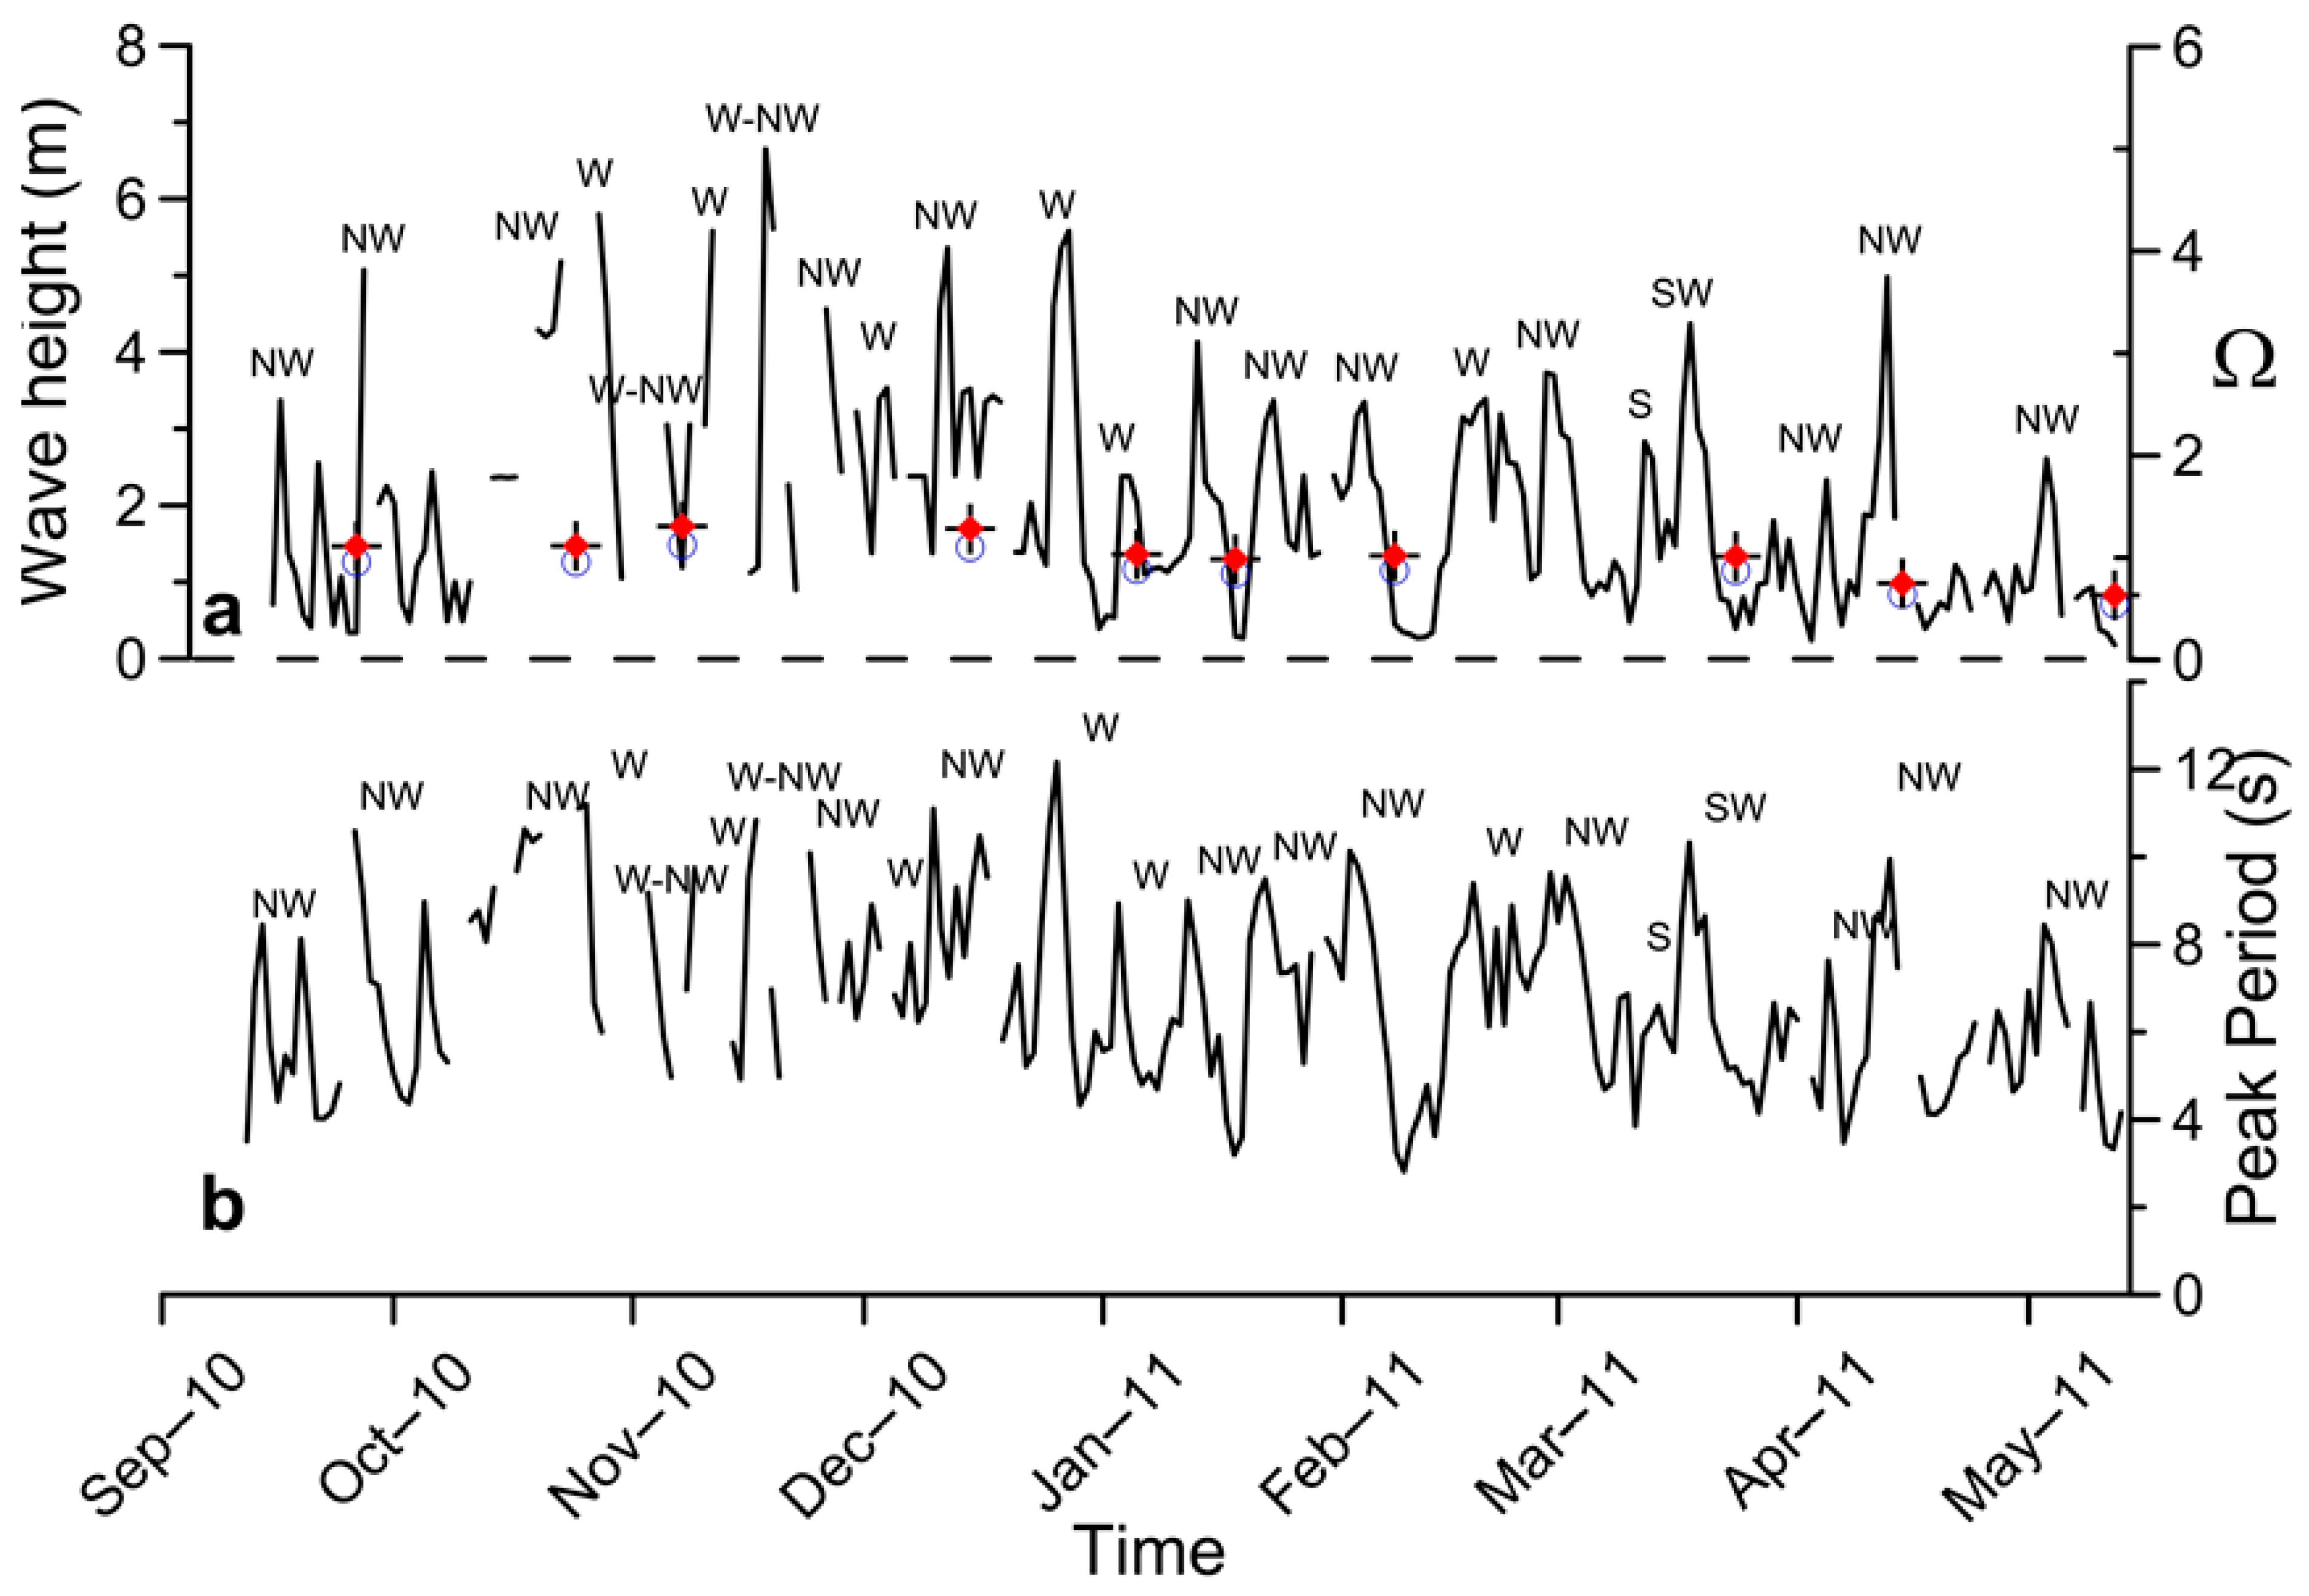
The significant wave heights and the peak wave periods are shown in Figure 6. Higher significant wave heights occurred from October 2010 to late January 2011, these events accounted for peak periods higher than 9 s. The highest wave height was recorded on 16 November 2010 (6.65 m), and the highest peak period was recorded on 26 December 2010 (12.1 s). During the whole surveyed period, the majority of the recorded events came from NW (Mistral); however, W–NW events were also recorded during the winter, and only two events came from S (Figure 6).
The storm power index (Ps) of the single storms, the cumulative value of the Ps, the number of storms occurred among each topographic survey, together with the volumetric changes (m3 m−1) along each transect, are reported in Figure 7.
The single storm accounting for the highest value of Ps occurred in October (Hs max ~5 m Tp ~11 s and D ~80 h from 17 October to 20 October, Figure 6 and Figure 7). Nine storms occurred from 23 September 2010 to 5 November 2010. From 5 November to 14 December eleven storms occurred. From 14 December to 17 January 2011 seven storms occurred, and from 17 January 2011 to 4 March 2011 a total of thirteen storms occurred. After the 4 March very few storms were recorded (Figure 7).
The storms frequency and their intensity were described also by the cumulative Ps. The slope of this curve is steeper in the following two periods: the first from late October to mid-January, and the second between early February and early March. This is due to the highest energetic storms occurring during these periods.
Major changes occurred on the Is Arutas and Maimoi beaches. On Mari Ermi beach the cumulative volume changes were lower in comparison to the other two studied beaches.
The main changes along the beach profiles occurred from early November to early March, which is the period with the highest wave height. During the surveyed period, beach profile changes on Mari Ermi beach did not exceed 25 m3 m−1. The highest volumetric changes were observed from late January to early March, mainly on the northern and southern profiles (Figure 7a). These profiles changed in opposite ways to each other. At the end of the monitored period, the total volumetric changes in respect to the first topographic survey was very low and close to 0 m3 m−1 (Figure 7a). On Is Arutas beach the maximum volumetric changes accounted for a value of about 41 m3 m−1 on the northern profile, simultaneously the southern profile showed an opposite volumetric change (erosion) of 36 m3 m−1. These main changes occurred from late October to mid-January (Figure 7b). However, at the end of the monitored period, the southern profile showed little erosion (Figure 7b). Maimoi beach showed the highest cumulative volumetric changes, occurring between early November and early to mid-January (Figure 7c), accounting for about 60 m3 m−1 on the northern profile. After these events, which led to a generalized erosion along each profile (Figure 5c and Figure 7c), the beach started to recover, even if the northern profile did not achieve the original position observed at the beginning of the monitored period (Figure 7c).
Cross correlation analysis was performed on each beach, considering the volumetric changes that occurred on the northern vs. southern profiles (Table 2). A significant opposite correlation (R = −0.78, p < 0.05) was found only on Is Arutas beach (Figure 8b). This result can be related to the opposite behavior that occurred simultaneously along the profiles of this beach (accretion/erosion vs. erosion/accretion for the northern and the southern profile, respectively). This can be interpreted as a rotation of the beach, with sediments transferred from the northern side towards the southern side and vice versa in relation to the waves direction. No significant correlations were found for volumetric changes considering the profiles of Mari Ermi and Maimoi (Figure 8a,c).

4.4. Inner Shelf Morphology

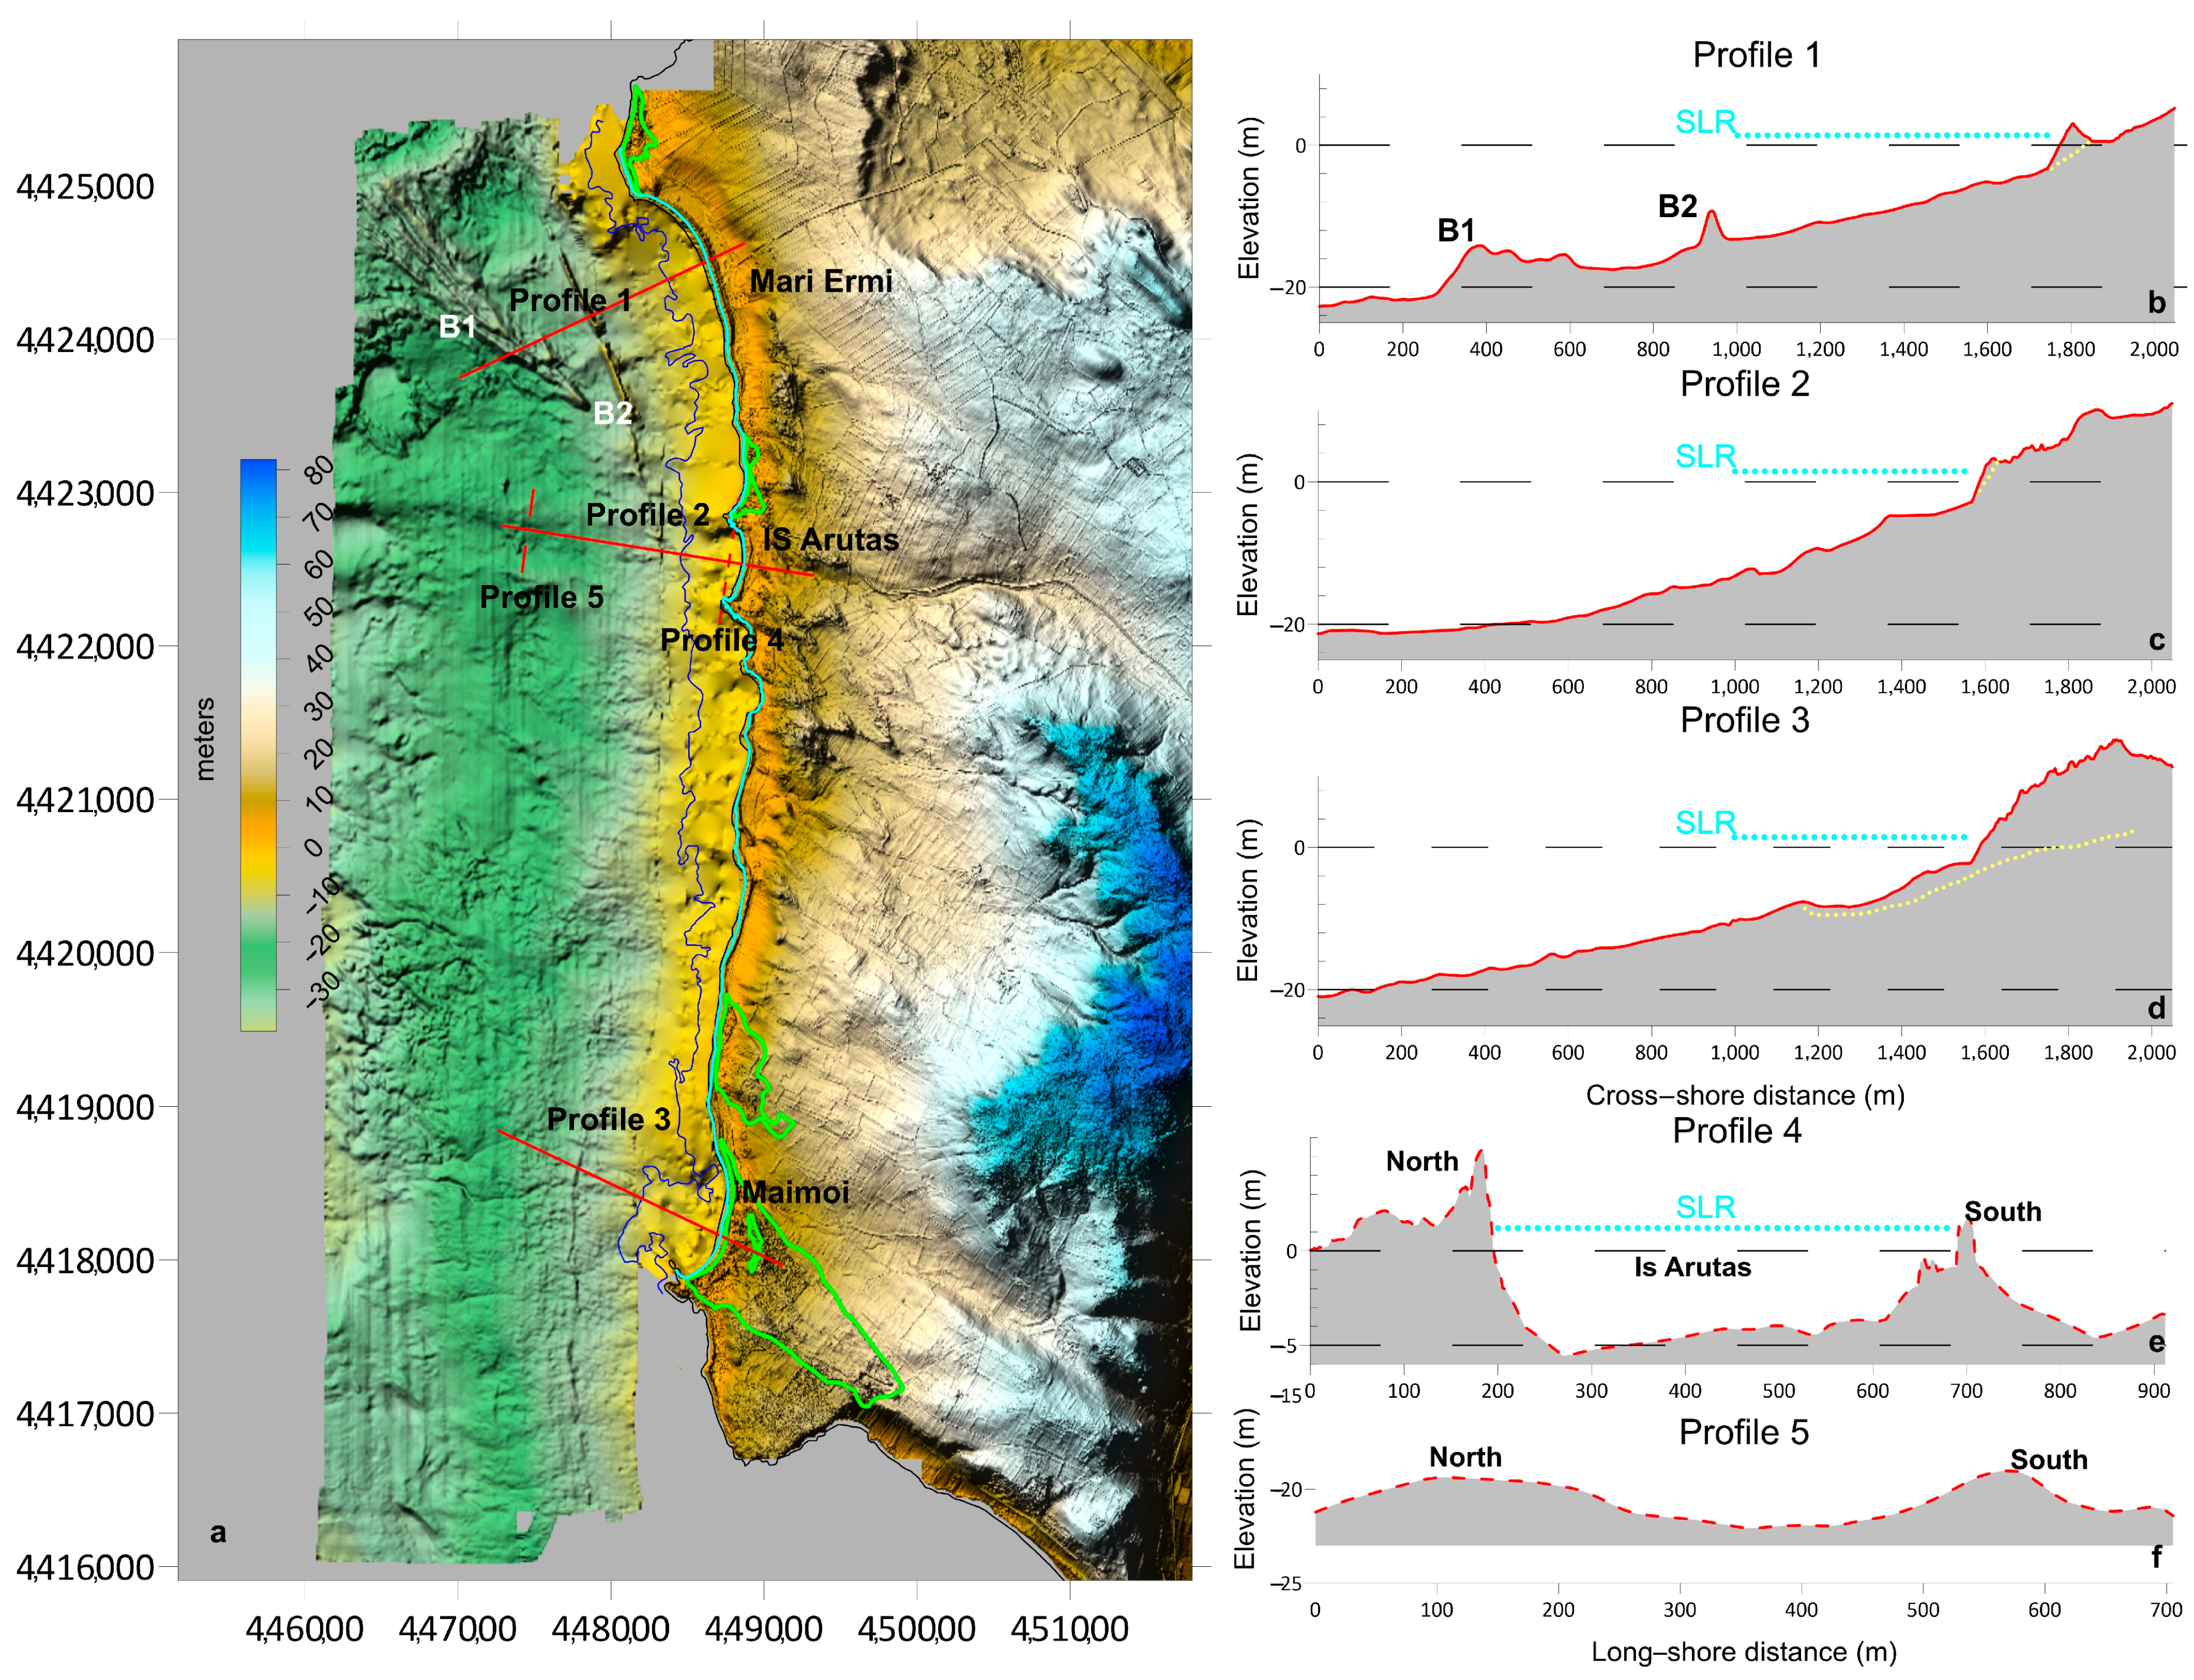
The digital terrain model of the inner shelf and of the inland area of the Sinis Peninsula was obtained by merging the MBES data, the SBES data and the lidar data (http://webgis2.regione.sardegna.it/catalogodati/card.jsp?uuid=R_SARDEG:BFPNM, accessed on 29 November 2019) (Figure 9a). The MBES data allow a more detailed description of the morphology of the sea floor, whereas the SBES were used to highlight the main morphological features of the shoreface of the studied system.
Figure 9 showed that the northern sector of Sinis Peninsula is characterized by a series of barriers, longshore oriented and located between the depths of 21 m and 9 m.
The DTM analysis revealed a first series of submerged barriers located between 20 m and 16 m (B1 Figure 9a,b). The foot of deeper barrier is located at a depth of 21 m, and the crest of the shallow barrier is located at 13.8 m (Figure 9a,b). The orientation of this barrier is NW–SE and the length is about 2 km.
A more shallow barrier (B2 in Figure 9a,b) runs parallel to the shoreline for about 3 km from the north of Mari Ermi down to the north of Is Arutas. The foot of the barrier is located at a depth of 13.5 m, whereas the crest is at a depth of 9 m in the sector fronting Mari Ermi, and is located at 12.5m in depth in the sector fronting the north of Is Arutas.
The DTM analysis highlighted that Is Arutas beach lies between two headlands that limit its longshore accommodation space (Figure 9a,e). This morphology is also present in the deeper area (about 25 m depth, Figure 9f) and is also evident in the backbeach where an incised valley characterizes the inland area beyond the Is Arutas beach (Figure 9a).
The inner shelf area of Maimoi beach is characterized by a profile that becomes steeper in the more inland area due to a wide transgressive dune field which lies on rocky bedrock. The inner shelf of Maimoi beach, beyond the depth of 10 m, is more flat compared to the inner shelf fronting the Is Arutas and Mari Ermi beaches (Figure 9a,d).
The inland area, which may be flooded in consequence of the SLR, was evaluated by using the scenario provided by Antonioli et al. (2017) [55]. The authors provide several maps of inundation for the Italian coastal plains. In particular, this study highlighted the maximum level of inundation following the Rahmstoff [56] and the IPCC 2013 scenarios [57]. Along the studied area the SLR was estimated as about 1.34 m for 2100 as the worst scenario [55]. This level was used to depict the line of the maximum ingression of the sea along Sinis Peninsula (cyan line in Figure 9). Figure 9 shows that a very limited inundation will occur along the Sinis coastline. However, the barrier crest and berm crest on the Mari Ermi and Is Arutas beaches, respectively, will not be inundated by SLR (Figure 9b,c), whereas along Mamoni a limited shoreline retreat may occur.

5. Discussion

Although the Mari Ermi, Is Arutas and Maimoi beaches are located along a short and straight coastal area of about 8.5 km from north to south (Figure 1) and maintain an Ω close to one with a reflective state, the morphological response to wave forcing differed among them, in terms of the dynamic response and the amount of mobilized sediment. Mari Ermi and Is Arutas are both characterized by very coarse sand and gravel siliciclastic sediment, whereas Maimoi is characterized also by a large fraction of biogenic carbonate sediments. Beach profile analysis revealed a major volumetric change on the Is Arutas and Maimoi beaches compared to Mari Ermi beach. The morphological changes were quite dissimilar among the studied beaches. In Mari Ermi, the changes occurred mainly along the beachface, whereas the crest of the barrier remained stable (Figure 5a and Figure 7a). On Is Arutas beach, the rotation process seemed to be responsible for the beach morphological variability (Figure 5b and Figure 7b), whereas in Maimoi the variability is characterized by an erosion of the beach which tends to return to the initial condition at the end of the monitoring period (Figure 5c and Figure 7c).
In this study we characterized the wave forcing, in terms of PS [53], as shown in Figure 7a–c. This allows us to represent the single storm strength and the cumulative power of storms that affected the beaches (Figure 7a–c). The cumulative curve of Ps highlighted that from early September to late October the power index of the single storm and the total power approaching the Sinis coastline was low. From late October to early March the singles storm power increased, and consequently the cumulative PS increased in slope (Figure 8a–c). From early March to May the singles storms power decreased, and consequently the cumulative storm power curve resulted in a gentler slope.
Along our study area erosion and accretion of the beaches is related to the storms occurrences, in fact, major changes along the beach profiles were detected between early November and early March (Figure 7a–c). During this period, a total of 31 storms occurred. After early March 2011 the storms became less frequent and accounted for the general low value of Ps, and the profiles tended to recover the initial volumes registered on each beach (Figure 7). However, the profiles showed some morphological differences (Figure 5a–c). Wave forcing can be considered the main factor that promotes changes in beach morphology. Storms can cause severe erosion on beaches [51] and the natural recovery towards the initial situation depends on the following: (i) the wave climate, (ii) the beach characteristics [53], and (iii) the storms frequency, which can also influence the beach response [51,53]. The beaches response to storms, single or in groups, and their recovery, are dependent on the beach characteristics and may be considered as site -specific [53]. In this context the geological constrains can be relevant on the storm beach response.
The nature of the sediment, headlands, and rocky outcrops are the main factors that control the storm beach response along Sinis Peninsula.
In the proximity of Sinis Peninsula, no siliciclastic sediment sources are present and this sediment can be considered relict [34]. Limited amounts of biogenic carbonate sediment are present mainly on Maimoi beach. This fraction is produced by the ecosystems that colonize the shallow inner shelf [35].
The northern beaches, Mari Ermi and Is Arutas, can be considered as deprived sediment beaches, in fact, for both the amount of siliciclastic relict sediment, mainly slight gravel and very coarse sand, prevail on the carbonate fraction (Figure 3c). The morphological variability and beach response to storms along these systems may be related to the grain size. In fact, the coarse grain size of Mari Ermi and Is Arutas beaches promote the sediment transport along the swash zone, which during severe storms can involve the whole subaerial beach [3]. Indeed, as observed on other gravel sandy beaches, most of the sediment transport may occur along the swash zone [7,58]; hence, the related morphological changes on these two systems happened mainly along the beachface (Figure 4a,b).
Maimoi beach is a sediment-abundant beach (sensu [18]), siliciclastic relict sediments were found only in the foreshore scarp, foreshore step and swash limit, while finer biogenic samples were found on the upper beach (the dune area) (Figure 3c) and the submerged beach [40]. The presence of a large dune field, composed of fine and medium sand [40], highlighted that exchanges of sediments can occur between the submerged and emerged beach. As shown in Figure 4c and Figure 5c, the morphological response to storms of Maimoi beach involves the whole profile (Figure 4c and Figure 5c), leading to a transfer of sediment from the subaerial part of the beach towards the submerged beach during the period with the highest Ps (from November 2010 to March 2010). This process may suggest a certain reversibility of cross-shore processes with exchange of sediment between the submerged and emerged beach.
Furthermore, the presence of headlands and outcrops can limit the longshore and cross-shore sediment transport and can promote beach rotation [2,4,16,18,59]. On Mari Ermi beach a rocky cape limits the beach in the north part (Figure 2a,d) and inhibits the sediment transfer towards the north. The barrier did not show relevant changes, only along the southern profile minor variability was found, this could be related to overwash. This sector was narrow and lower in height compared to the northern and central areas, and overwash may affect the barrier crest (Figure 4c and Figure 5c). The gravel and coarse sandy beach barrier system has a good resistance to wave forcing and storms [10,60]. Along Mari Ermi beach the presence of rocky outcrops a few meters seaward to the shoreline can inhibit the cross-shore sediment transport (Figure 2a). This could constrain the variability of the beach profile only on the subaerial beach. However, the cross correlation analysis of volumetric changes performed on the side profiles did no show statistical evidence of a beach rotation process (Figure 8a; R = 0.63; p > 0.05).
On Is Arutas beach the headlands constrained the sediment to move within the embayment from the northern to the southern side of the beach and vice versa in relation to wave direction [3]. The volumetric changes (Figure 7b) and the evolution of the elevation of the beach profile (Figure 5b) highlighted that an erosion of the northern profile corresponds to an accretion of the southern profile, and vice versa. The beach rotation on Is Arutas is confirmed by the cross correlation analysis of the volumetric changes of the side profiles (Figure 8b) (R = −0.78; p < 0.05).
This morphodynamic response is common on sandy and coarse-grained embayed beaches in several contexts around the world [4,61,62]. The occurrences of rocky outcrops a few meters seaward to the shoreline can inhibit the beach profile variability in the submerged area (Figure 4b).
Maimoi beach is limited towards the south by a rocky headland that does not allow sediment transport towards the south. The effects of the headlands on this beach seem to be less evident than those in the northern beaches. Morphological changes occurred during the storm period, which involved the whole subaerial beach. These changes caused retreat of the shoreline and a generalized lowering in the beach level (Figure 5c and Figure 7c). This process may be related to the cross-shore exchange of sediment, which can be responsible for the erosion (during autumn and winter) and accretion (during spring and summer) of the beach, rather than the longshore sediment transport occurring along the swash zone in the northern beaches. The sediments eroded during storms from each of the beach profiles may be deposed towards the submerged sector. During the fair conditions sediments can migrate onshore and rebuild the beach morphologies, leading also to shoreline accretion (Figure 5c).
In this context the flooding effect, linked to the SLR, may have a secondary effect on beach morphology and dynamics. In fact, the SLR will determine an adaptation in the coastal systems that could result in a redistribution of sediment with a shoreline retreat [38]. This effect along Sinis Peninsula could be less observable. Antonioli et al. [55] showed different scenarios of flooding for western Sardinia. The mentioned authors estimated an increase in the sea level of 1.34 m at 2100 in respect to the present level for the worst scenario. The effect of SLR can be modulated by several factors, most of them of local origin, in fact, sandy beach responses to SLR are highly site-specific and temporally variable [63]. The beach and barrier can migrate inland in response to SLR with the roll over process when a sufficient accommodation space and a gentle slope beyond the beach and barrier characterize the area of migration [2,31]. As recorded by MBES data, a series of cemented barriers are found in the inner shelf fronting the Mari Ermi beach between the depths of 21 m and 9 m (Figure 9a,b). De Falco et al. [31] identified analogous barriers in the Gulf of Oristano between the depths of 35 m and 15 m. For those barriers cementation is the primary process that allows their preservation and overstepping rather than a roll over. No cementation is found in the present barrier along Mari Ermi, consequently an increase in SLR can reduce the height of the top of the barrier, mainly in the southern sector (Figure 9b). The reduction in height above the mean sea level (MSL), in the worst scenario predicted by Antonioli et al. [55], is about 1.34 m (Figure 9b). This could increase the overwash processes, which may cause an inward transfer of sediment. This process may promote a roll over process of the barrier as a consequence of the storms, as the level of the sea will increase.
Is Arutas beach is enclosed by two headlands (Figure 1e and Figure 9a,e,f), along this beach a rise in the sea level may increase the degree of embayment. In fact, the increase in MSL, as predicted by Antonioli et al. [55], will not submerge the headland. Hence, SLR can result in a more pronounced beach rotation process in relation to the storms occurrences and direction. Accommodation space in the backbeach can allow migration inland of the berms crest and of the body of the beach (Figure 2a and Figure 9a,c). However, human activities can be an impediment on the migration of the system towards the inland area. For the Mari Ermi and Is Arutas beaches, the effect of SLR on sediment redistribution may result in a shifting landward due to the roll over process.
Maimoi beach can face the foreseeable SLR, in fact, this beach can be considered as a sediment-abundant beach (sensu [18]) due to the biogenic carbonate sediment provided by the coastal ecosystem to the Sinis Peninsula [35,64]. In this context the SLR, as predicted by Antonoli et al. [55], can cause migration landward of the shoreline and redistribution of sediment of the foredune with a retreat of the shoreline. The retreat could cause a more evident redistribution of sediment during storms, which may produce a lowering in beach level. Besides, the longshore movement of sediment will remain limited by the southern rocky headland, which does not allow a massive transfer of sediment towards the south. In this beach, the effect of SLR on sediment redistribution may result in a transfer of sediment from the dune towards the beach and the submerged area. This may partially reshape the beach profile with a potential shoreline retreat.
This study confirms the importance of local factors, such as inherited geology, nature and availability of sediments. They can be relevant in the investigation of beaches responses to storms, and to develop a conceptual model on the adaptation of the beach and barrier system to the SLR.

6. Conclusions

The morphological response of beaches to storms along a geologically controlled coastal area was analyzed. The study area was characterized by rocky headland enclosed beaches, composed of a mix of coarse relict siliciclastic grains and finer carbonate biogenic sediments.
The studied beaches experienced major changes when consecutive storms, rather than singles ones, occurred along the coastline. The effect of these storms resulted in variability in subaerial beach morphology and in a related variability along beach profiles. However, the response to storms on the studied beaches was not unique and depended on the geological controls acting on each beach.
The sediment availability, the grain size and the geomorphological structure of beaches were the most important factors that influenced the beach response. In sediment-deprived coarse beaches the presence of headlands can favor beach rotation, and the presence of morphological inherited structures, such as the coarse sand and gravel barrier, can increase the resistance against storms. The coarse grain size (gravel and very coarse sand) that characterize these systems inhibits the cross-shore transport preventing the development of a submerged beach. A further limitation to cross-shore sediment transport could be the rocky outcrops that occur a few meters seaward, the shoreline can act as a vertical boundary. On the sediment-abundant beach the presence of fine sediments may allow cross-shore sediment transport towards the submerged area, which leads to a lowering in the level of the subaerial beach and a contemporaneous shoreline retreat in response to storms. The sediment transported on the submerged beach tends to migrate onshore during the fair season.
The geological inheritances can also modulate the adaptation of the beaches to the SLR. This can occur mainly along the sediment-starved beaches. The SLR can promote a more frequent overwash process along the gravel barrier system, resulting in a roll over of the system along the accommodation space. On coarse sand and gravel embayed beaches the SLR may increase the degree of embayment as the headland that limits the beach will become more prominent.
Along the sediment-abundant beach, the SLR can cause a redistribution of sediment eroded during storms, which may interest the foredune area. Anyway, the sediments transferred from the subaerial beach to the submerged sector will be unable to migrate towards the south and will be always available to rebuild the beach towards the initial status.

Author Contributions

Conceptualization, S.S. and G.D.F.; methodology, S.S.; writing—original draft preparation, S.S.; writing—review and editing, S.S., G.D.F., E.M., W.B., A.C.; investigation, S.S., L.P. All authors have read and agreed to the published version of the manuscript.

Funding

This research was funded by the BEACH Project by Regione Autonoma della Sardegna, CRP-18716 and Luca Palombo had a grant from the Regione Autonoma della Sardegna (Master and Back program).

Institutional Review Board Statement

Not applicable.

Informed Consent Statement

Not applicable.

Data Availability Statement

Data are available by http://sk.oristano.iamc.cnr.it/, accessed on 9 April 2021.

Acknowledgments

The authors are very grateful to Andrea Satta for the help on fieldwork.

Conflicts of Interest

The authors declare no conflict of interest.

References

  1. Morton, R.A.; Sallenger, A.H., Jr. Morphological impacts of extreme storms on sandy beaches and barriers. J. Coast. Res. 2003, 19, 560–573. [Google Scholar]
  2. Short, A.D. Handbook of Beach and Shoreface Morphodynamics; west Sussex PO191UD; Wiley& Sons Ltd.: Chichester, UK, 1999; ISBN 978-0-471-96570-1. [Google Scholar]
  3. Simeone, S.; Palombo, L.; De Falco, G. Morphodynamics of a Nontidal Embayed Beach: The Case Study of Is Arutas (Western Mediterranean). J. Coast. Res. 2013, 291, 63–71. [Google Scholar] [CrossRef]
  4. Short, A.D. Role of geological inheritance in Australian beach morphodynamics. Coast. Eng. 2010, 57, 92–97. [Google Scholar] [CrossRef]
  5. Nolan, T.; Kirk, R.; Shulmeister, J. Beach cusp morphology on sand and mixed sand and gravel beaches, South Island, New Zealand. Mar. Geol. 1999, 157, 185–198. [Google Scholar] [CrossRef]
  6. Mason, T.; Coates, T.T. Sediment transport processes on mixed beaches: A review for shoreline management. J. Coast. Res. 2001, 17, 645–657. [Google Scholar]
  7. Ivamy, M.C.; Kench, P.S. Hydrodynamics and morphological adjustment of a mixed sand and gravel beach, Torere, Bay of Plenty, New Zealand. Mar. Geol. 2006, 228, 137–152. [Google Scholar] [CrossRef]
  8. Horn, D.P.; Walton, S.M. Spatial and temporal variations of sediment size on a mixed sand and gravel beach. Sediment. Geol. 2007, 202, 509–528. [Google Scholar] [CrossRef]
  9. Karunarathna, H.; Horrillo-Caraballo, J.M.; Ranasinghe, R.; Short, A.D.; Reeve, D.E. An analysis of the cross-shore beach morphodynamics of a sandy and a composite gravel beach. Mar. Geol. 2012, 299-302, 33–42. [Google Scholar] [CrossRef]
  10. Orford, J.D.; Anthony, E.J. Extreme events and the morphodynamics of gravel-dominated coastal barriers: Strengthening uncertain ground. Mar. Geol. 2011, 290, 41–45. [Google Scholar] [CrossRef]
  11. Basterretxea, G.; Orfila, A.; Jordi, A.; Casas, B.; Lynett, P.; Liu, P.L.F.; Duarte, C.M.; Tintoré, J. Seasonal Dynamics of a Microtidal Pocket Beach with Posidonia oceanica Seabeds (Mallorca, Spain). J. Coast. Res. 2004, 204, 1155–1164. [Google Scholar] [CrossRef] [Green Version]
  12. Del Río, L.; Plomaritis, T.A.; Benavente, J.; Valladares, M.; Ribera, P. Establishing storm thresholds for the Spanish Gulf of Cádiz coast. Geomorphology 2012, 143–144, 13–23. [Google Scholar] [CrossRef]
  13. Sallenger, A.H. Storm impact scale for barrier island. J. Coast. Res. 2000, 16, 890–895. [Google Scholar]
  14. Stockdon, H.F.; Sallenger, A.H.; Holman, R.A.; Howd, P.A. A simple model for the spatially-variable coastal response to hurricanes. Mar. Geol. 2007, 238, 1–20. [Google Scholar] [CrossRef]
  15. De Muro, S.; Ibba, A.; Simeone, S.; Buosi, C.; Brambilla, W. An integrated sea-land approach for mapping geomorphological and sedimentological features in an urban microtidal wave-dominated beach: A case study from S Sardinia, western Mediterranean. J. Maps 2017, 13, 822–835. [Google Scholar] [CrossRef] [Green Version]
  16. Jackson, D.; Cooper, J.; Del Rio, L. Geological control of beach morphodynamic state. Mar. Geol. 2005, 216, 297–314. [Google Scholar] [CrossRef]
  17. Jackson, D.W.T.; Cooper, J.A.G. Geological control on beach form: Accomodation space and contemporary dynam-ics. J. Coast. Res. 2009, 56, 69–72. [Google Scholar]
  18. Loureiro, C.; Ferreira, Ó.; Cooper, J.A.G. Geologically constrained morphological variability and boundary effects on embayed beaches. Mar. Geol. 2012, 329–331, 1–15. [Google Scholar] [CrossRef]
  19. Bosom, E.; Jiménez, J.A. Storm-induced coastal hazard assessment at regional scale: Application to Catalonia (NW Mediterranean). Adv. Geosci. 2010, 26, 83–87. [Google Scholar] [CrossRef] [Green Version]
  20. Fitzgerald, D.M.; Pendleton, E. Inlet Formation and Evolution of the Sediment Bypassing System: New Inlet, Cape Cod, Massachusetts. J. Coast. Res. 2002, 36, 290–299. [Google Scholar] [CrossRef] [Green Version]
  21. De Falco, G.; Molinaroli, E.; Conforti, A.; Simeone, S.; Tonielli, R. Biogenic sediments from coastal ecosystems to beach–dune systems: Implications for the adaptation of mixed and carbonate beaches to future sea level rise. Biogeosciences 2017, 14, 3191–3205. [Google Scholar] [CrossRef] [Green Version]
  22. Larson, M.; Kraus, N.C. Representation of nonerodible (hard) bottoms in beach profile change modeling. J. Coast. Res. 2000, 16, 1–14. [Google Scholar]
  23. Vousdoukas, M.; Velegrakis, A.; Plomaritis, T. Beachrock occurrence, characteristics, formation mechanisms and impacts. Earth-Sci. Rev. 2007, 85, 23–46. [Google Scholar] [CrossRef]
  24. Vousdoukas, M.; Velegrakis, A.; Karambas, T. Morphology and sedimentology of a microtidal beach with beachrocks: Vatera, Lesbos, NE Mediterranean. Cont. Shelf Res. 2009, 29, 1937–1947. [Google Scholar] [CrossRef]
  25. Swift, D.J.P. Barrier-island genesis: Evidence from the central Atlantic shelf, eastern USA. Sediment. Geol. 1975, 14, 1–43. [Google Scholar] [CrossRef]
  26. Zhang, K.; Douglas, B.C.; Leatherman, S.P. Global Warming and Coastal Erosion. Clim. Chang. 2004, 64, 41–58. [Google Scholar] [CrossRef]
  27. Fitzgerald, D.M.; Fenster, M.S.; Argow, B.A.; Buynevich, I.V. Coastal Impacts Due to Sea-Level Rise. Annu. Rev. Earth Planet. Sci. 2008, 36, 601–647. [Google Scholar] [CrossRef] [Green Version]
  28. Storms, J.E.A.; Swift, D.J.P. Shallow-marine sequences as the building blocks of stratigraphy: Insights from numerical modelling. Basin Res. 2003, 15, 287–303. [Google Scholar] [CrossRef]
  29. Lorenzo-Trueba, J.; Ashton, A.D. Rollover, drowning, and discontinuous retreat: Distinct modes of barrier response to sea-level rise arising from a simple morphodynamic model. J. Geophys. Res. Earth Surf. 2014, 119, 779–801. [Google Scholar] [CrossRef] [Green Version]
  30. Dillenburg, S.R.; Hesp, P.A. Coastal Barriers—An Introduction. In Engineering Geology for Infrastructure Planning in Europe; Springer Science and Business Media LLC: Berlin, Germany, 2008; pp. 1–15. [Google Scholar]
  31. De Falco, G.; Antonioli, F.; Fontolan, G.; Presti, V.L.; Simeone, S.; Tonielli, R. Early cementation and accommodation space dictate the evolution of an overstepping barrier system during the Holocene. Mar. Geol. 2015, 369, 52–66. [Google Scholar] [CrossRef]
  32. Tecchiato, S.; Buosi, C.; Ibba, A.; Del Deo, C.; Parnum, I.; O’Leary, M.; De Muro, S. Geomorphological and sedimentological surrogates for the understanding of seagrass distribution within a temperate nearshore setting (Esperance Western Australia). Geo-Mar. Lett. 2019, 39, 249–264. [Google Scholar] [CrossRef]
  33. Tecchiato, S.; Collins, L.; Parnum, I.; Stevens, A. The influence of geomorphology and sedimentary processes on benthic habitat distribution and littoral sediment dynamics: Geraldton, Western Australia. Mar. Geol. 2015, 359, 148–162. [Google Scholar] [CrossRef]
  34. Bird, E. Coastal Geomorphology an Introduction; Wiley and Sons, Ltd.: Chichester, UK, 2008; ISBN 978-0-470-51729-1. [Google Scholar]
  35. De Falco, G.; Molinaroli, E.; Baroli, M.; Bellaciccob, S. Grain size and compositional trends of sediments from Posidonia oceanica meadows to beach shore, Sardinia, western Mediterranean. Estuar. Coast. Shelf Sci. 2003, 58, 299–309. [Google Scholar] [CrossRef]
  36. Lionello, P.; Cogo, S.; Galati, M.; Sanna, A. The Mediterranean surface wave climate inferred from future scenario simulations. Glob. Planet. Chang. 2008, 63, 152–162. [Google Scholar] [CrossRef]
  37. Lionello, P. The Climate of the Mediterranena Region: From the Past to the Future, 1st ed.; Elsevier: London, UK, 2012; ISBN 9780124160422. [Google Scholar]
  38. Le Cozannet, G.; Garcin, M.; Yates, M.; Idier, D.; Meyssignac, B. Approaches to evaluate the recent impacts of sea-level rise on shoreline changes. Earth-Sci. Rev. 2014, 138, 47–60. [Google Scholar] [CrossRef] [Green Version]
  39. Marini, A.; Murru, M. Rilevamento geologico della penisola del Sinis (Sardegna centro meridionale). Rend. Semin. Fac. Sci. Univ. Cagliari 1977, 24, 95–108. [Google Scholar]
  40. Pinna, P. Evoluzione Naturale ed Impatto Antropico sui Sistemi Costieri Della Penisola del SINIS (Sardegna Centrooccidentale). Ph.D. Thesis, Università Degli Studi di Cagliari, Cagliari, Italy, 2015. [Google Scholar]
  41. Corsini, S.; Franco, L.; Inghilesi, R.; Piscopia, R. Atlante Delle Onde Nei Mari Italiani—Italian Waves Atlas; Agenzia per la Protezione dell’Ambiente e per i Servizi Tecnici: Roma, Italy, 2006; 152p.
  42. Balzano, A.; De Falco, G.; Simeone, S.; Sulis, A.; Antognarelli, F.; Massaro, G.; Satta, A.; Cugusi, G.; Piras, M.; Ventroni, M. Linea B-Morfodinamica della spiaggia di San Giovanni. In La Rete di Monitoraggio Per le Spiagge; Luigi, C., Ed.; Nuova Grafica Fiorentina: Firenze, Italy, 2013. [Google Scholar]
  43. Otvos, E.G. Beach ridges—Definitions and significance. Geomorphology 2000, 32, 83–108. [Google Scholar] [CrossRef]
  44. Simeone, S.; Palombo, A.G.L.; Guala, I. Impact of frequentation on a Mediterranean embayed beach: Implication on carrying capacity. Ocean Coast. Manag. 2012, 62, 9–14. [Google Scholar] [CrossRef]
  45. Blott, S.J.; Pye, K. GRADISTAT: A grain size distribution and statistics package for the analysis of unconsolidated sediments. Earth Surf. Process. Landf. 2001, 26, 1237–1248. [Google Scholar] [CrossRef]
  46. Gibbs, M.D.M.R.J. The Relationship between Sphere Size and Settling Velocity. J. Sediment. Res. 1971, 41, 7–18. [Google Scholar] [CrossRef]
  47. Thomas, T.; Phillips, M.; Williams, A. Mesoscale evolution of a headland bay: Beach rotation processes. Geomorphology 2010, 123, 129–141. [Google Scholar] [CrossRef]
  48. Thomas, T.; Phillips, M.R.; Williams, A.T. A Centurial Record of Beach Rotation. J. Coast. Res. 2013, 65, 594–599. [Google Scholar] [CrossRef]
  49. Thomas, T.; Phillips, M.R.; Williams, A.T.; Jenkins, R.E. Links between wave forcing, offshore islands and a macro-tidal headland-bound bay beach. Earth Surf. Process. Landf. 2014, 39, 143–155. [Google Scholar] [CrossRef]
  50. Dean, R.G. Heuristic models of sand transport in the surf zone. Engineering dynamics in the surf zone. In Proceedings of the First Australian Conference on Coastal Engineering, Engineering Dynamics of the Coastal Zone, Sydney, Australia, 14–17 May 1973. [Google Scholar]
  51. Vousdoukas, M.I.; Almeida, L.P.M.; Ferreira, Ó. Beach erosion and recovery during consecutive storms at a steep-sloping, meso-tidal beach. Earth Surf. Process. Landf. 2011, 37, 583–593. [Google Scholar] [CrossRef]
  52. Komar, P.D.; Gaughan, M.K. Airy wave theory and breaker height prediction. In Proceedings of the Coastal Engineering, Vancouver, BC, Canada, 10–14 July 1972. [Google Scholar]
  53. Karunarathna, H.; Pender, D.; Ranasinghe, R.; Short, A.D.; Reeve, D.E. The effects of storm clustering on beach profile variability. Mar. Geol. 2014, 348, 103–112. [Google Scholar] [CrossRef] [Green Version]
  54. Jiménez, J.A.; Gracia, V.; Valdemoro, H.I.; Mendoza, E.T.; Sánchez-Arcilla, A. Managing erosion-induced problems in NW Mediterranean urban beaches. Ocean Coast. Manag. 2011, 54, 907–918. [Google Scholar] [CrossRef]
  55. Antonioli, F.; Anzidei, M.; Amorosi, A.; Presti, V.L.; Mastronuzzi, G.; Deiana, G.; De Falco, G.; Fontana, A.; Fontolan, G.; Lisco, S.; et al. Sea-level rise and potential drowning of the Italian coastal plains: Flooding risk scenarios for 2100. Quat. Sci. Rev. 2017, 158, 29–43. [Google Scholar] [CrossRef] [Green Version]
  56. Rahmstorf, S. A Semi-Empirical Approach to Projecting Future Sea-Level Rise. Science 2007, 315, 368–370. [Google Scholar] [CrossRef] [Green Version]
  57. Church, J.A.; Clark, P.U.; Cazenave, A.; Gregory, J.M.; Jeverejva, S.; Levermann, A.; Merrifield, M.A.; Milne, G.A.; Nerem, R.S.; Nunn, P.D.; et al. Sea Level Change, in Climate Change 2013: The Physical Science Basis. In Contribution of Working Group I to the Fifth Assessment Report of the Intergovernmental Panel of Climate Change; Cambridge University Press: Cambridge, UK; New York, NY, USA, 2013. [Google Scholar]
  58. Jennings, R.; Shulmeister, J. A field based classification scheme for gravel beaches. Mar. Geol. 2002, 186, 211–228. [Google Scholar] [CrossRef]
  59. Loureiro, C.; Ferreira, Ó.; Cooper, J.A.G. Extreme erosion on high-energy embayed beaches: Influence of megarips and storm grouping. Geomorphology 2012, 139–140, 155–171. [Google Scholar] [CrossRef]
  60. Orford, J.D.; Carter, R.W.G.; Jennings, S.C. Control domains and morphological phases in gravel-dominated coastal barriers. J. Coast. Res. 1996, 12, 589–605. [Google Scholar]
  61. Klein, A.H.F.; Filho, L.B.; Shumacher, D.H. Short-term beach rotation processes in distinct headland bay beach system. J. Coast. Res. 2002, 18, 442–458. [Google Scholar]
  62. De Alegria-Arzaburu, A.R.; Masselink, G. Storm response and beach rotation on a gravel beach, Slapton Sands, U.K. Mar. Geol. 2010, 278, 77–99. [Google Scholar] [CrossRef]
  63. Cooper, J.A.G.; Masselink, G.; Coco, G.; Short, A.D.; Castelle, B.; Rogers, K.; Anthony, E.; Green, A.N.; Kelley, J.T.; Pilkey, O.H.; et al. Sandy beaches can survive sea-level rise. Nat. Clim. Chang. 2020, 10, 993–995. [Google Scholar] [CrossRef]
  64. Simeone, S.; Molinaroli, E.; Conforti, A.; De Falco, G. Impact of ocean acidification on the carbonate sediment budget of a temperate mixed beach. Clim. Chang. 2018, 150, 227–242. [Google Scholar] [CrossRef]
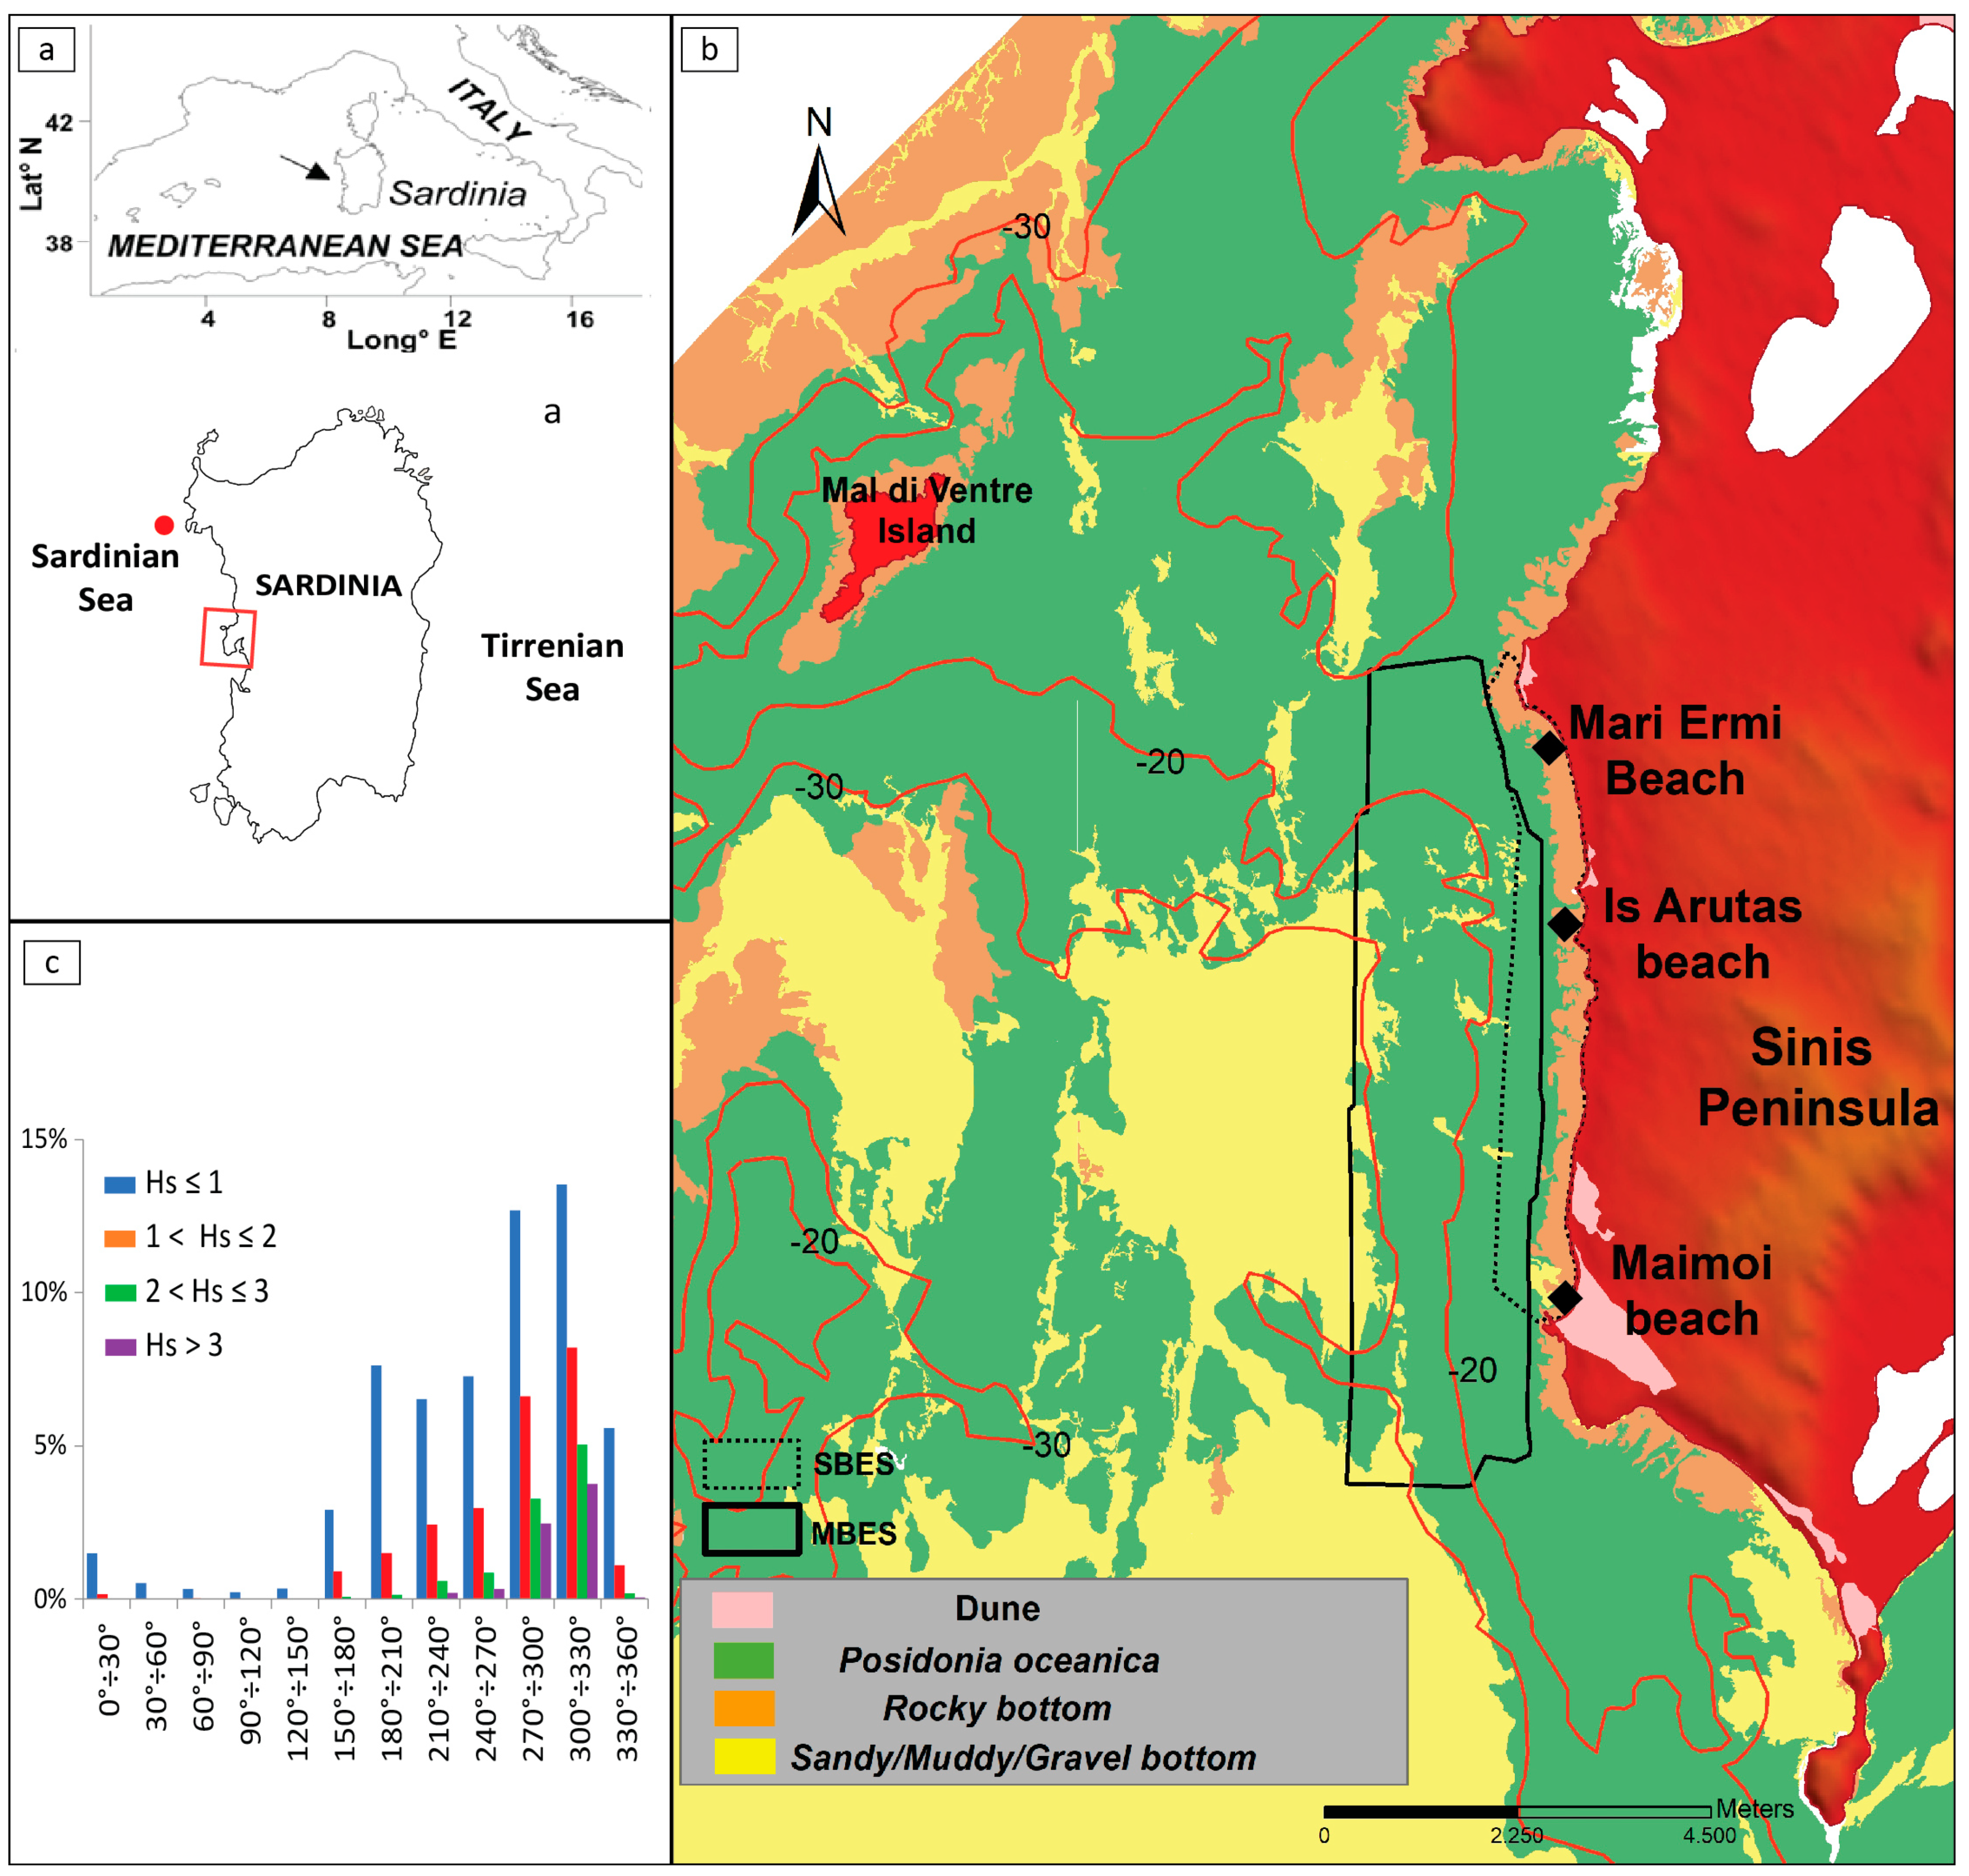
Figure 1. The study area as follows: (a) Sardinia Island and the position of the wave buoy (red dot); (b) Sinis Peninsula, the continuous black rectangle indicates the multibeam acquisition area, the dashed black rectangle indicates the single-beam acquisition area; and (c) yearly statistics of the wave height recorded by the wave buoy available at http://dati.isprambiente.it/dataset/ron-rete-ondametrica-nazionale/, accessed on 30 April 2021.
Applsci 11 04009 g001
Figure 2. (a) The main features of Mari Ermi beach and the location of the profile; (b) the main features of Is Arutas beach and the location of the profile; (c) the main features of Maimoi beach and the location of the profile; (d) an overview of Mari Ermi; (e) an overview of Is Arutas; and (f) an overview of Maimoi.
Applsci 11 04009 g002
Figure 3. (a) The scheme of the sampling design along a beach profile; (b) a scatterplot of the mean grain size vs sorting of the collected sediment; (c) the content of siliciclastic gravel and carbonate in the sediment collected on each beach. The labeling of each sample is characterized by the name of the beach (two letters MEMari Ermi, IA—Is Arutas, MA—Maimoi); the location of profile (N—northern, C—central, S—southern).
Applsci 11 04009 g003
Figure 4. A plot of profiles acquired along the following investigated beaches: (a) Mari Ermi; (b) Is Arutas; and (c) Maimoi. S = 23 September 2010, O = 22 October 2010, N = 5 November 2010, D = 14 December 2010, J1 = 4 January 2011, J2 = 17 January 2011, F = 7 Februay 2011, Ma = 4 March 2011, A = 14 April 2011, My = 13 May 2011. The continuous black line is the mean beach profile, the dashed black line is the value of standard deviation; N = north profile, C = center profile, S = south profile.
Applsci 11 04009 g004
Figure 5. The evolution of the morphology along the beach profiles, as follows: (a) Mari Ermi; (b) Is Arutas; and (c) Maimoi. Where DGPS data were not accurate, the profiles were not represented. X, Y and Z axes represent the date of survey, the cross-shore distance and the elevation recorded during the beach profile acquisition. The elevation data for each survey are side-by-side and no interpolation was performed among them.
Applsci 11 04009 g005
Figure 6. (a) The significant wave height and Ω value (mean values for the period between the topographic survey) on the following beaches: Is Arutas (red dot), Mari Ermi (blue circle) and Maimoi (black cross). (b) The wave peak period.
Applsci 11 04009 g006
Figure 7. The cumulative volumetric changes (m3 m−1) on the following beach profiles: Mari Ermi (a); Is Arutas (b); and Maimoi (c). The red lines indicate the cumulative volumetric variation (m3 m−1) on northern profiles, the green lines on central profiles, and the blue lines on southern profiles. The dots represent the singles ‘storm power index’ (values on y axis on the left); the dotted lines represent the cumulative ‘storm power index’ (values on y axis on the right). The dashed vertical lines represent the date of the topographic survey.
Applsci 11 04009 g007
Figure 8. (a) The cross correlation of volumetric changes (m3 m−1) for the side profiles (northern and southern) on Mari Ermi beach; (b) Is Arutas beach; and (c) Maimoi beach.
Applsci 11 04009 g008
Figure 9. (a) The digital terrain model obtained by the merging of the MBES data, SBES data and lidar Data. Lidar data are available from (http://webgis2.regione.sardegna.it/catalogodati/card.jsp?uuid=R_SARDEG:BFPNM, accessed on 29 November 2019), in green, the boundaries of the dune field along the studied area; in cyan, the foresee of the maximum level of the sea, as reported by Antonioli et al., 2017 [55]. In red, the location of the profile realized by using Surfer Golden Software; (b) the cross-shore profile along Mari Ermi, (c) the cross-shore profile along Is Arutas; (d) the cross-shore profile along Maimoi; the dashed yellow line represents the lower beach level; (e) the longshore profile along Is Arutas; and (f) the longshore profile along the inner shelf fronting Is Arutas beach.
Applsci 11 04009 g009
Table 1. A summary of the relevant characteristics of the studied beaches. The letters indicate the date of the topographic survey, as follows: S = 23 September 2010, O = 22 October 2010, N = 5 November 2010, D = 14 December 2010, J1 = 4 January 2011, J2 = 17 January 2011, F = 7 February 2011, Ma = 4 March 2011, A = 14 April 2011, My = 13 May 2011.
Mari Ermi Is Artas Maimoi
Beach length (m) 1200 500 1000
Profiles spacing (m) 450 150 300
Profile location Profile location Profile location
NorthCenterSouthNorthCenterSouthNorthCenterSouth
Repetition999999101010
Profile Length (m)807560555250453740
Min depth(m)−1−1−1−1−1−1−1−1−1
d50 (mm)2.741.921.961.821.781.941.981.851.68
ws (m/s)0.330.250.260.240.230.250.260.240.23
Averaged ws (m/s) 0.28 0.24 0.24
Averaged ξ01.030.940.9410.970.880.960.920.78
Survey monthsS, O, D, J1, J2, F, Ma, A, MyO, N, D, J1, J2, F, Ma, A, MyS, O, N, D, J1, J2, F, Ma, A, MyS, O, D, J1, J2, F, Ma, A, MyS, O, D, J1, J2, F, Ma, A, MyS, O, D, J1, J2, F, Ma, A, MyS, O, N, D, J1, J2, F, Ma, A, MyS, O, N, D, J1, J2, F, Ma, A, MyS, O, N, D, J1, J2, F, Ma, A, My
Table 2. The volumetric changes along the beach profiles during the date of the topographic survey. For cross correlation analyses, the second rows were not considered. The letters indicated the date of the topographic survey (see Table 1 caption).
Mari Ermi Profiles Variations (m3 m−1)Is Arutas Profiles Variations (m3 m−1)Maimoi Profiles Variations (m3 m−1)
Survey NumberNorthernCentralSouthernNortherCentralSouthernNorthernCentralSouthern
O–S−6.8 −0.7−19.8−3.7−6.3−6.95.01.9
N–O −8.73.2 14.51.1−1.3
D–N−6.5−0.9−10.841.314.1−36.3−65.3−32.0−15.6
J1–D6.416.04.9−12.17.522.238.66.34.4
J2–J11.3−3.50.5−5.4−0.72.01.0−4.31.9
F–J2−10.78.015.8−3.0−14.99.4−9.217.8−11.8
Ma–F18.9−13.7−24.71.23.7−15.6−0.1−6.517.6
A–Ma−1.72.65.4−1.4−2.7−9.1−1.524.64.0
My–A3.1−7.27.4−12.10.56.010.7−15.0−13.1
Publisher’s Note: MDPI stays neutral with regard to jurisdictional claims in published maps and institutional affiliations.