Long-Term Analysis of Wave Climate and Shoreline Change along the Gulf of California

 ,
,  , , ,
, , ,  ,
,  and
and 
Abstract
1. Introduction
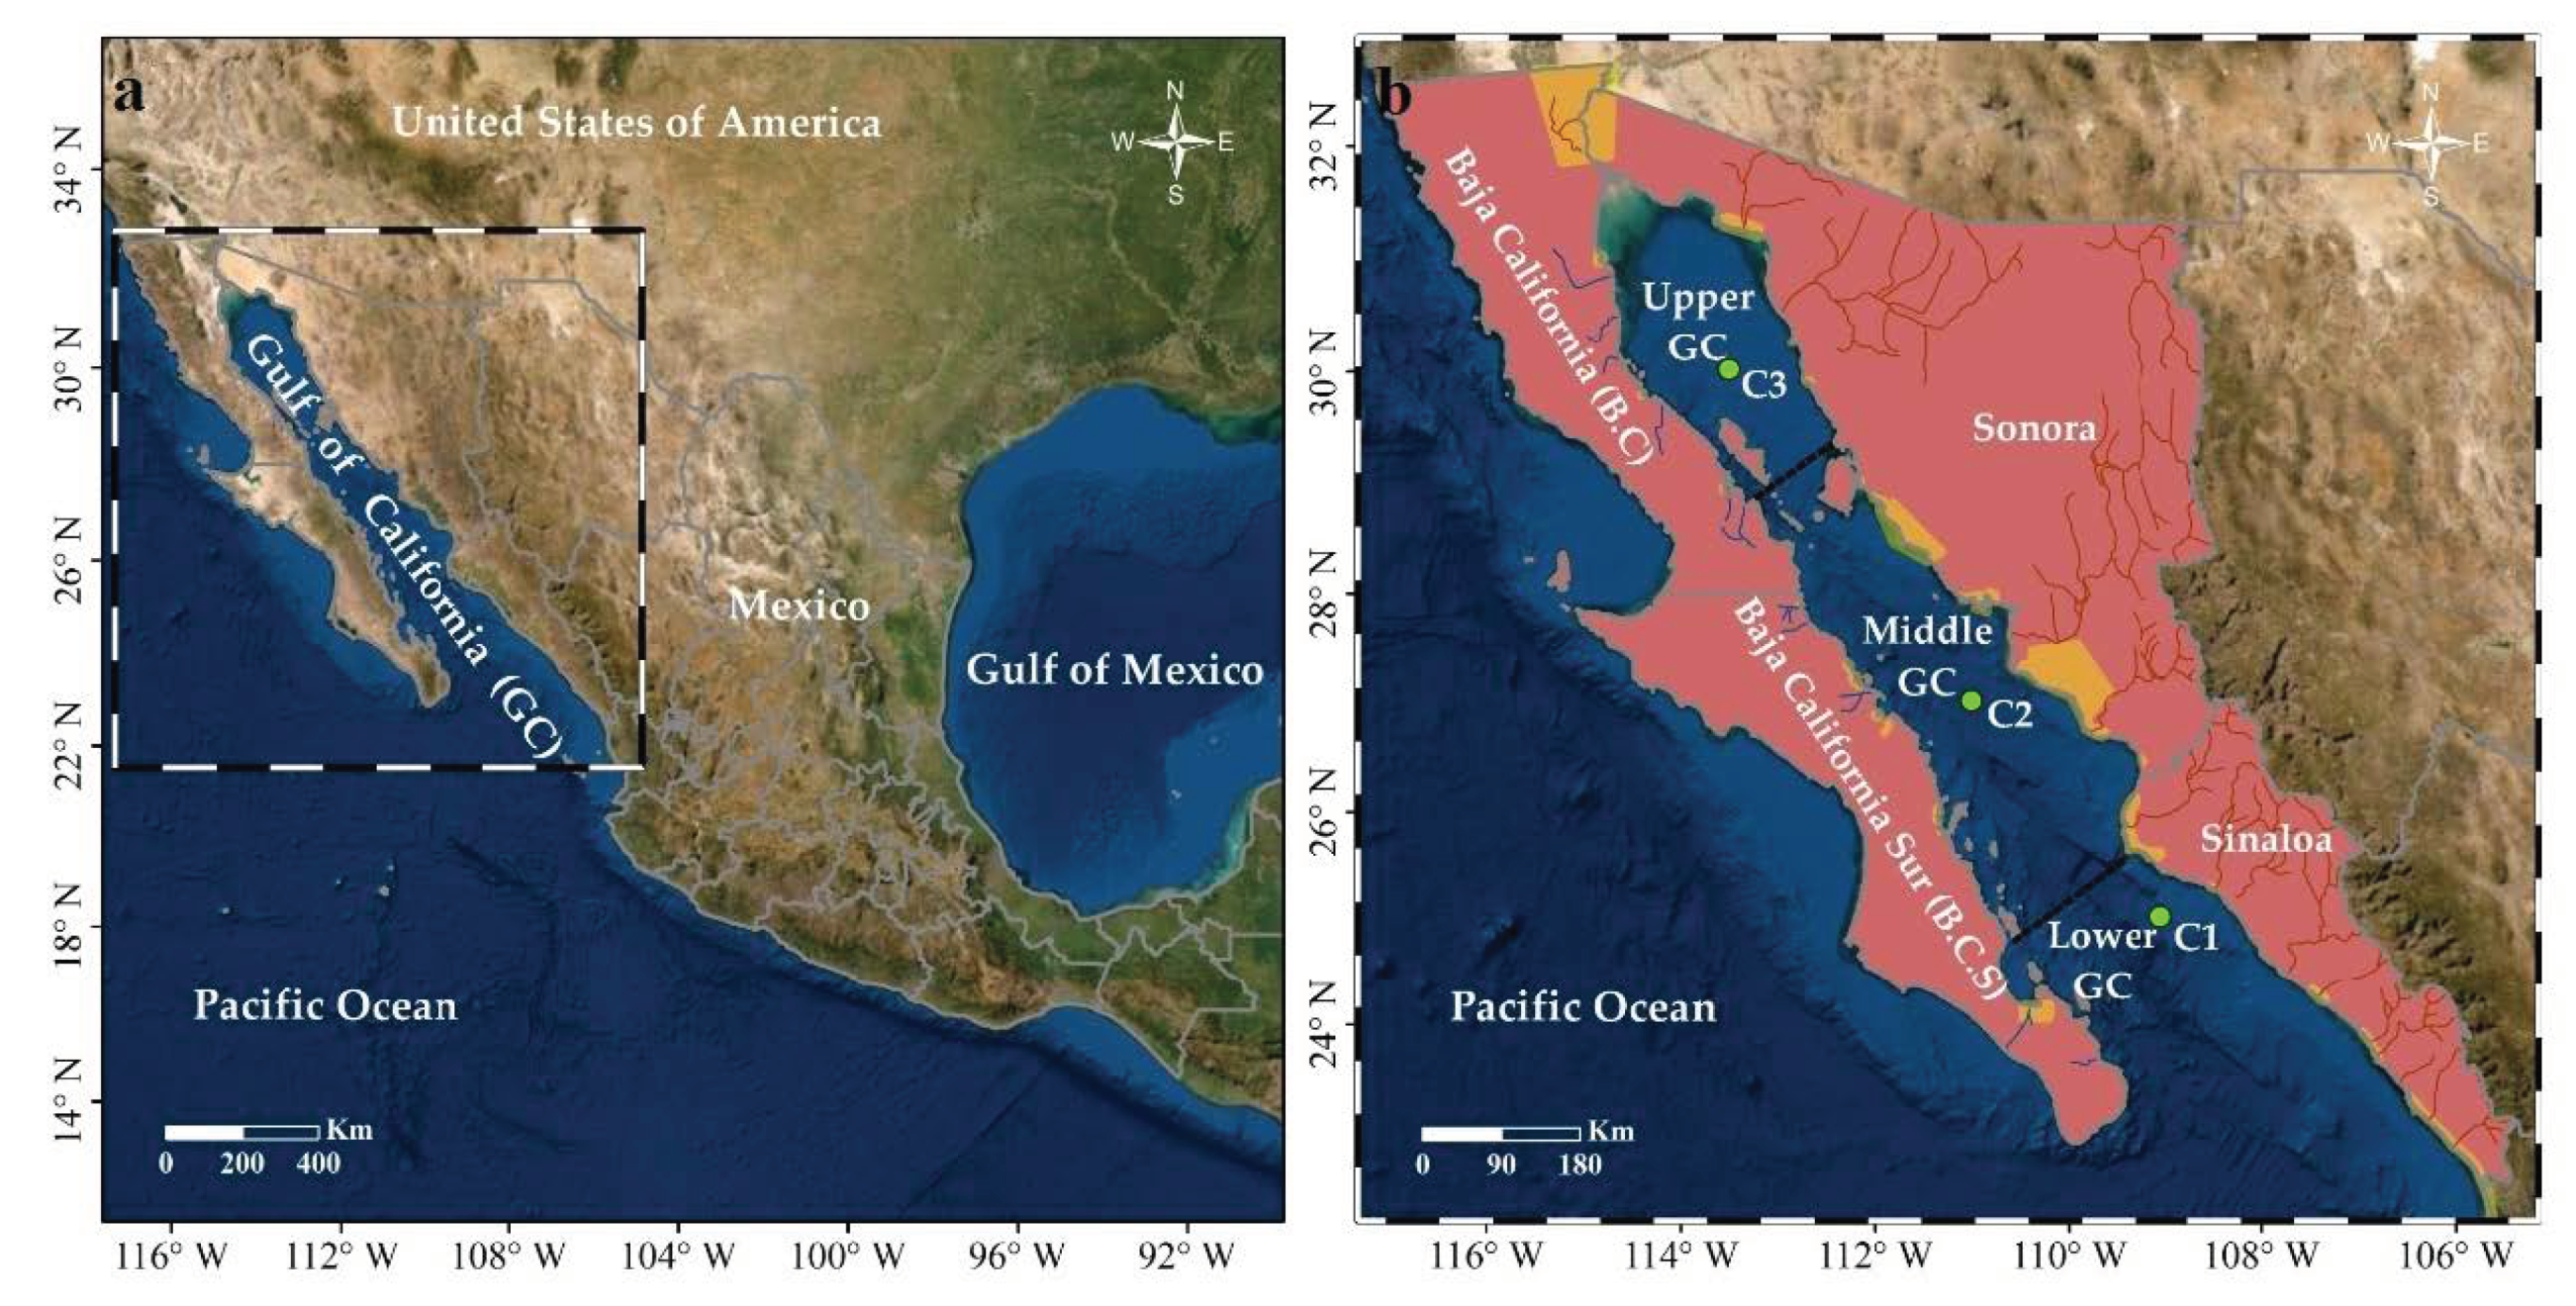
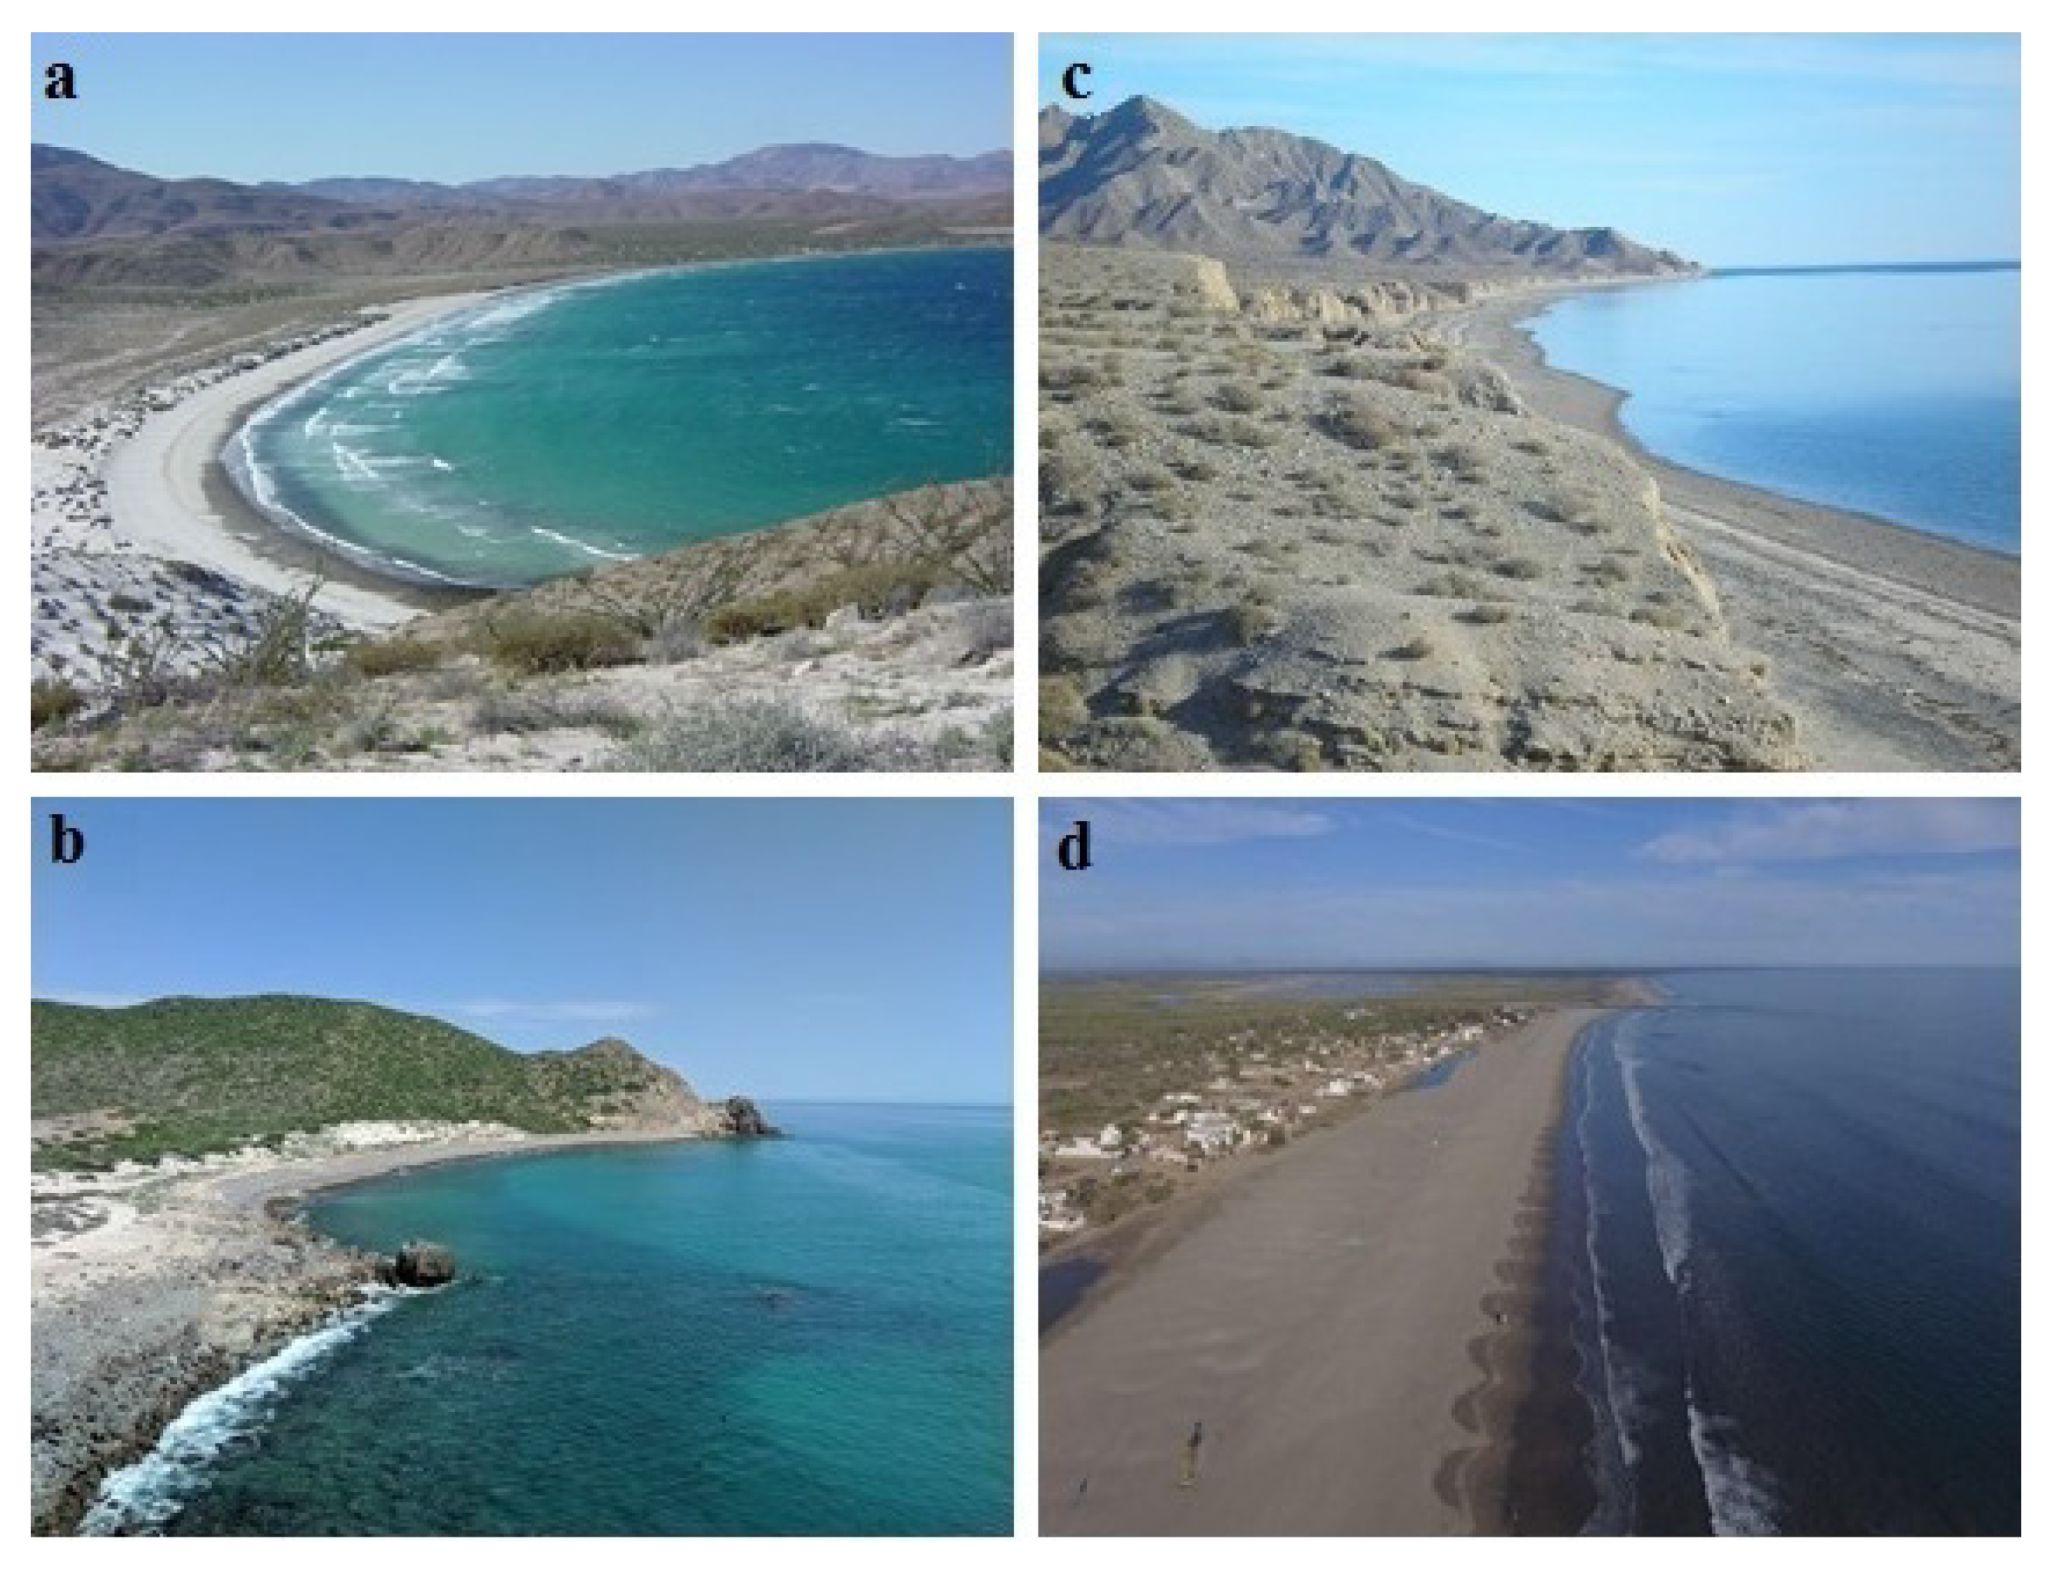
2. Study Area
3. Materials and Methods
3.1. Shoreline Data
3.2. Image Processing
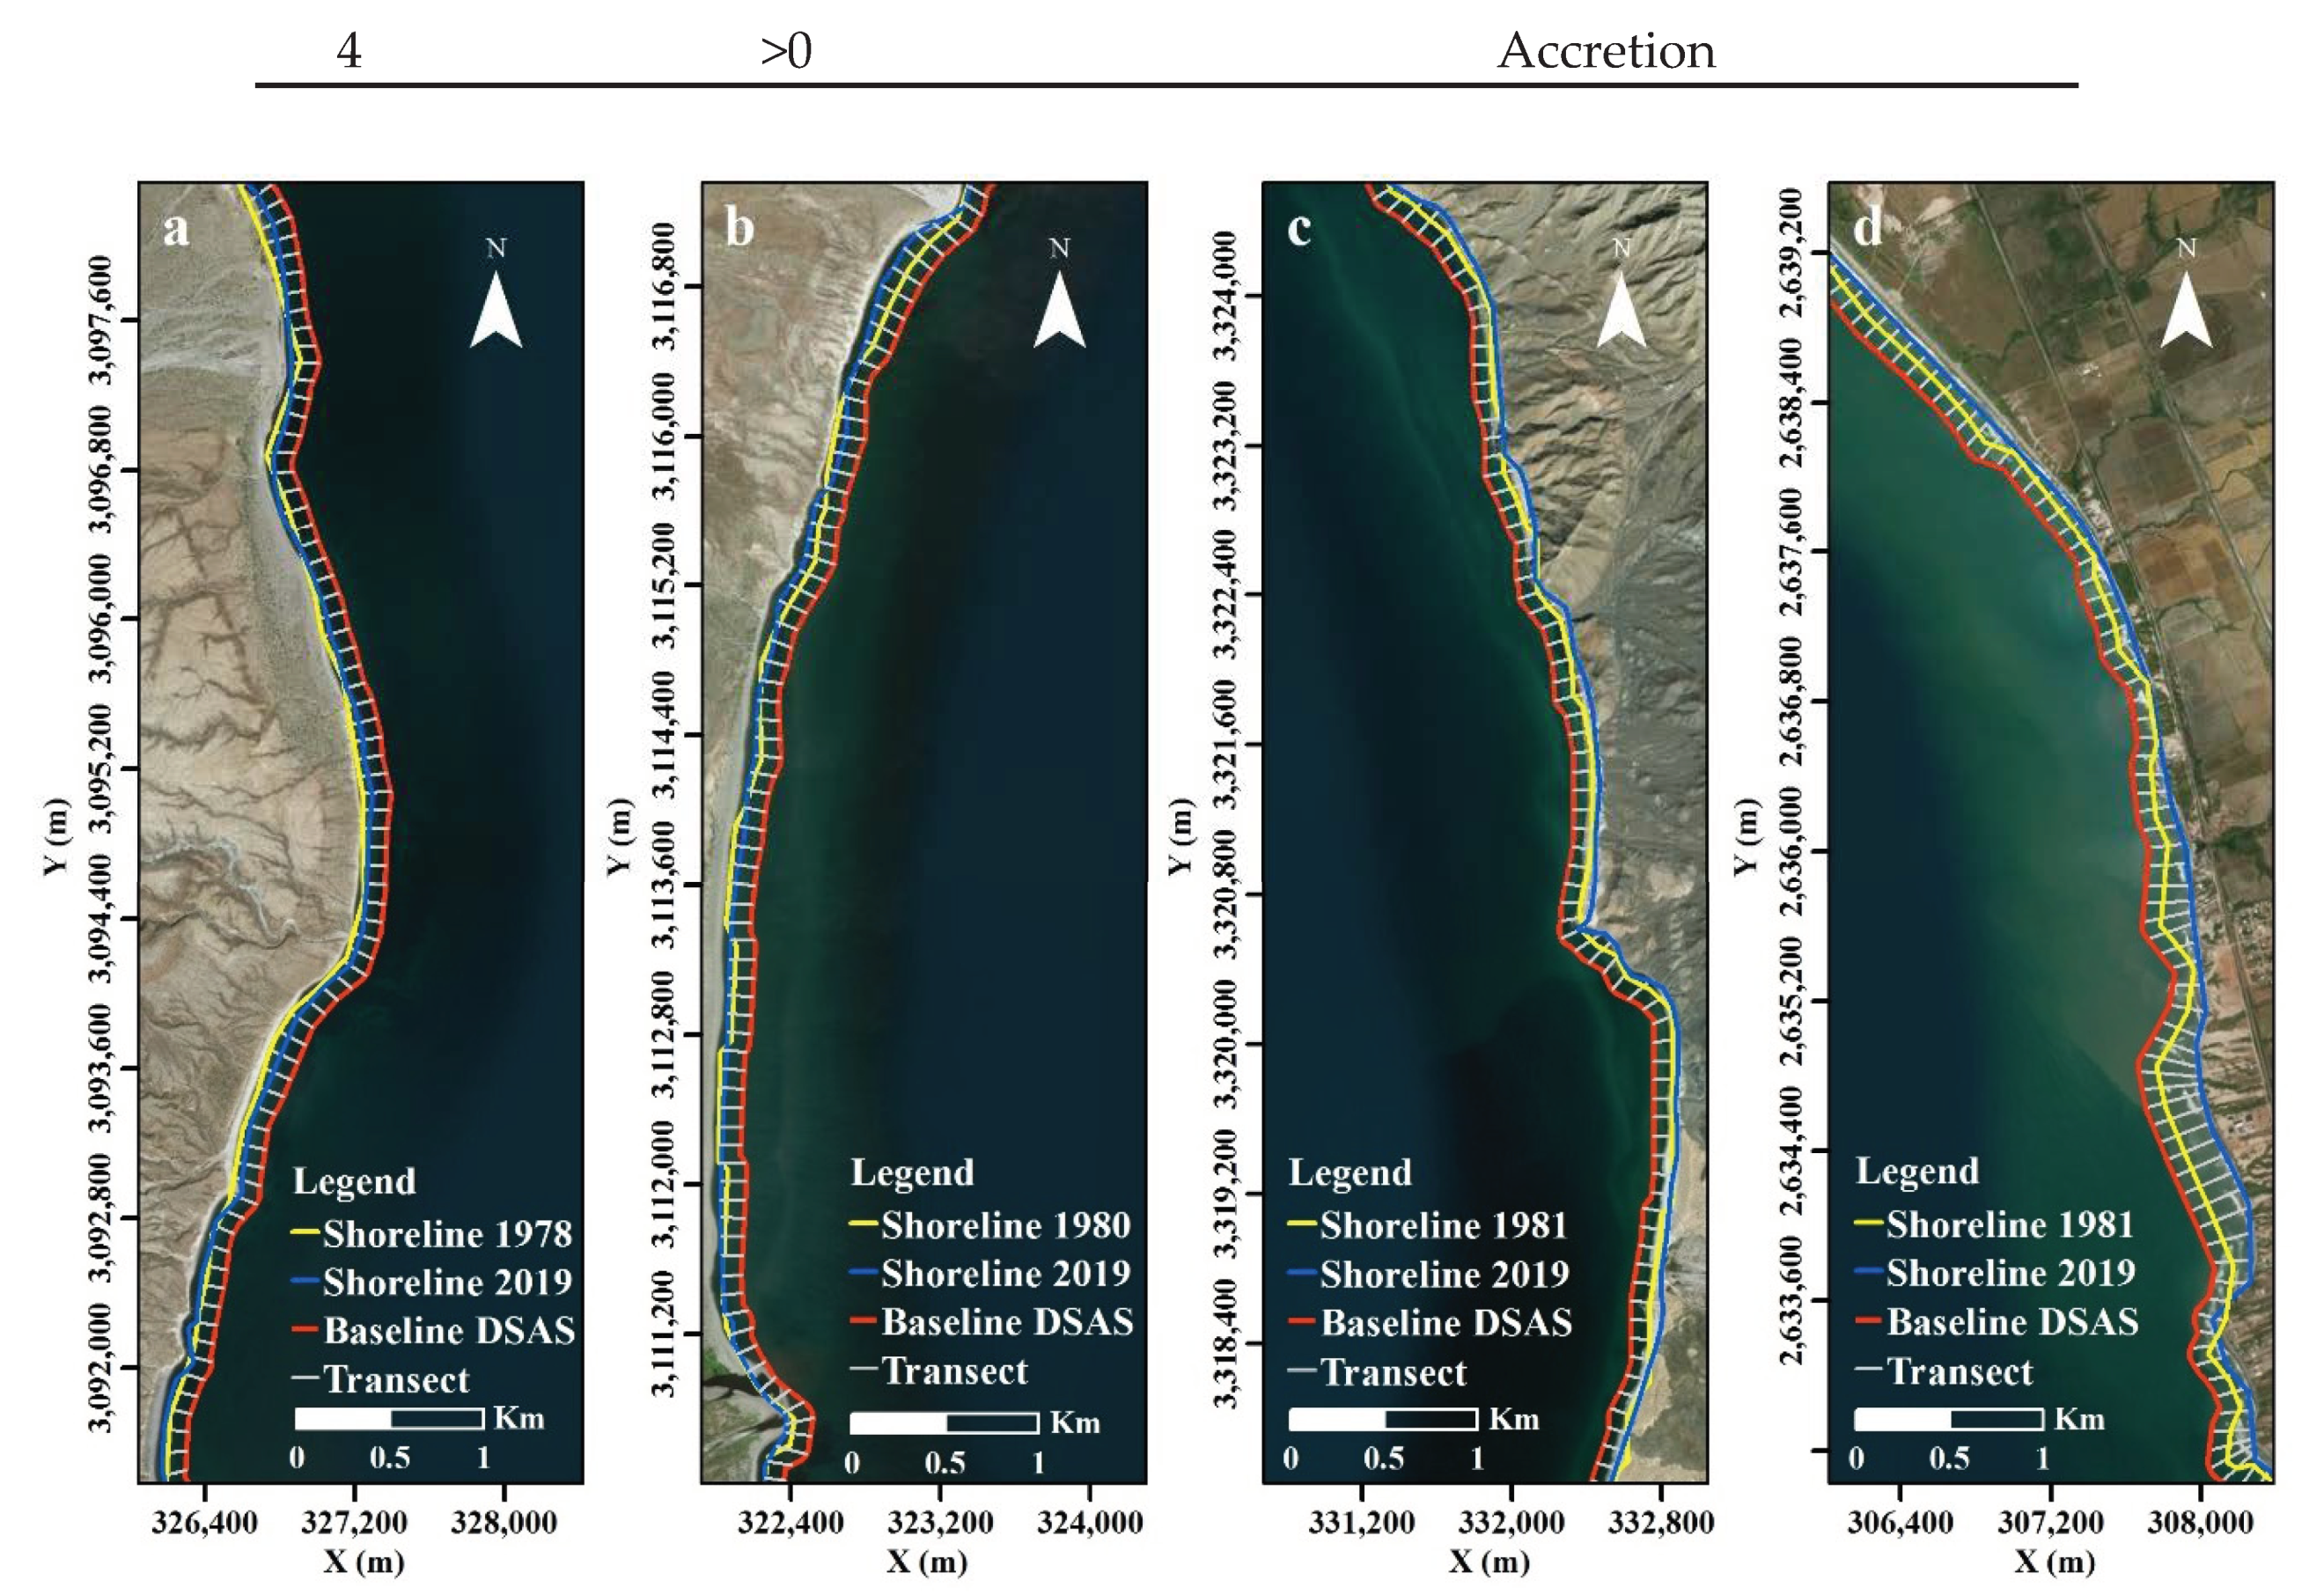
3.3. Extraction and Shoreline Analysis
3.4. Offshore Wave Data
3.5. Wave Climate Analysis
4. Results
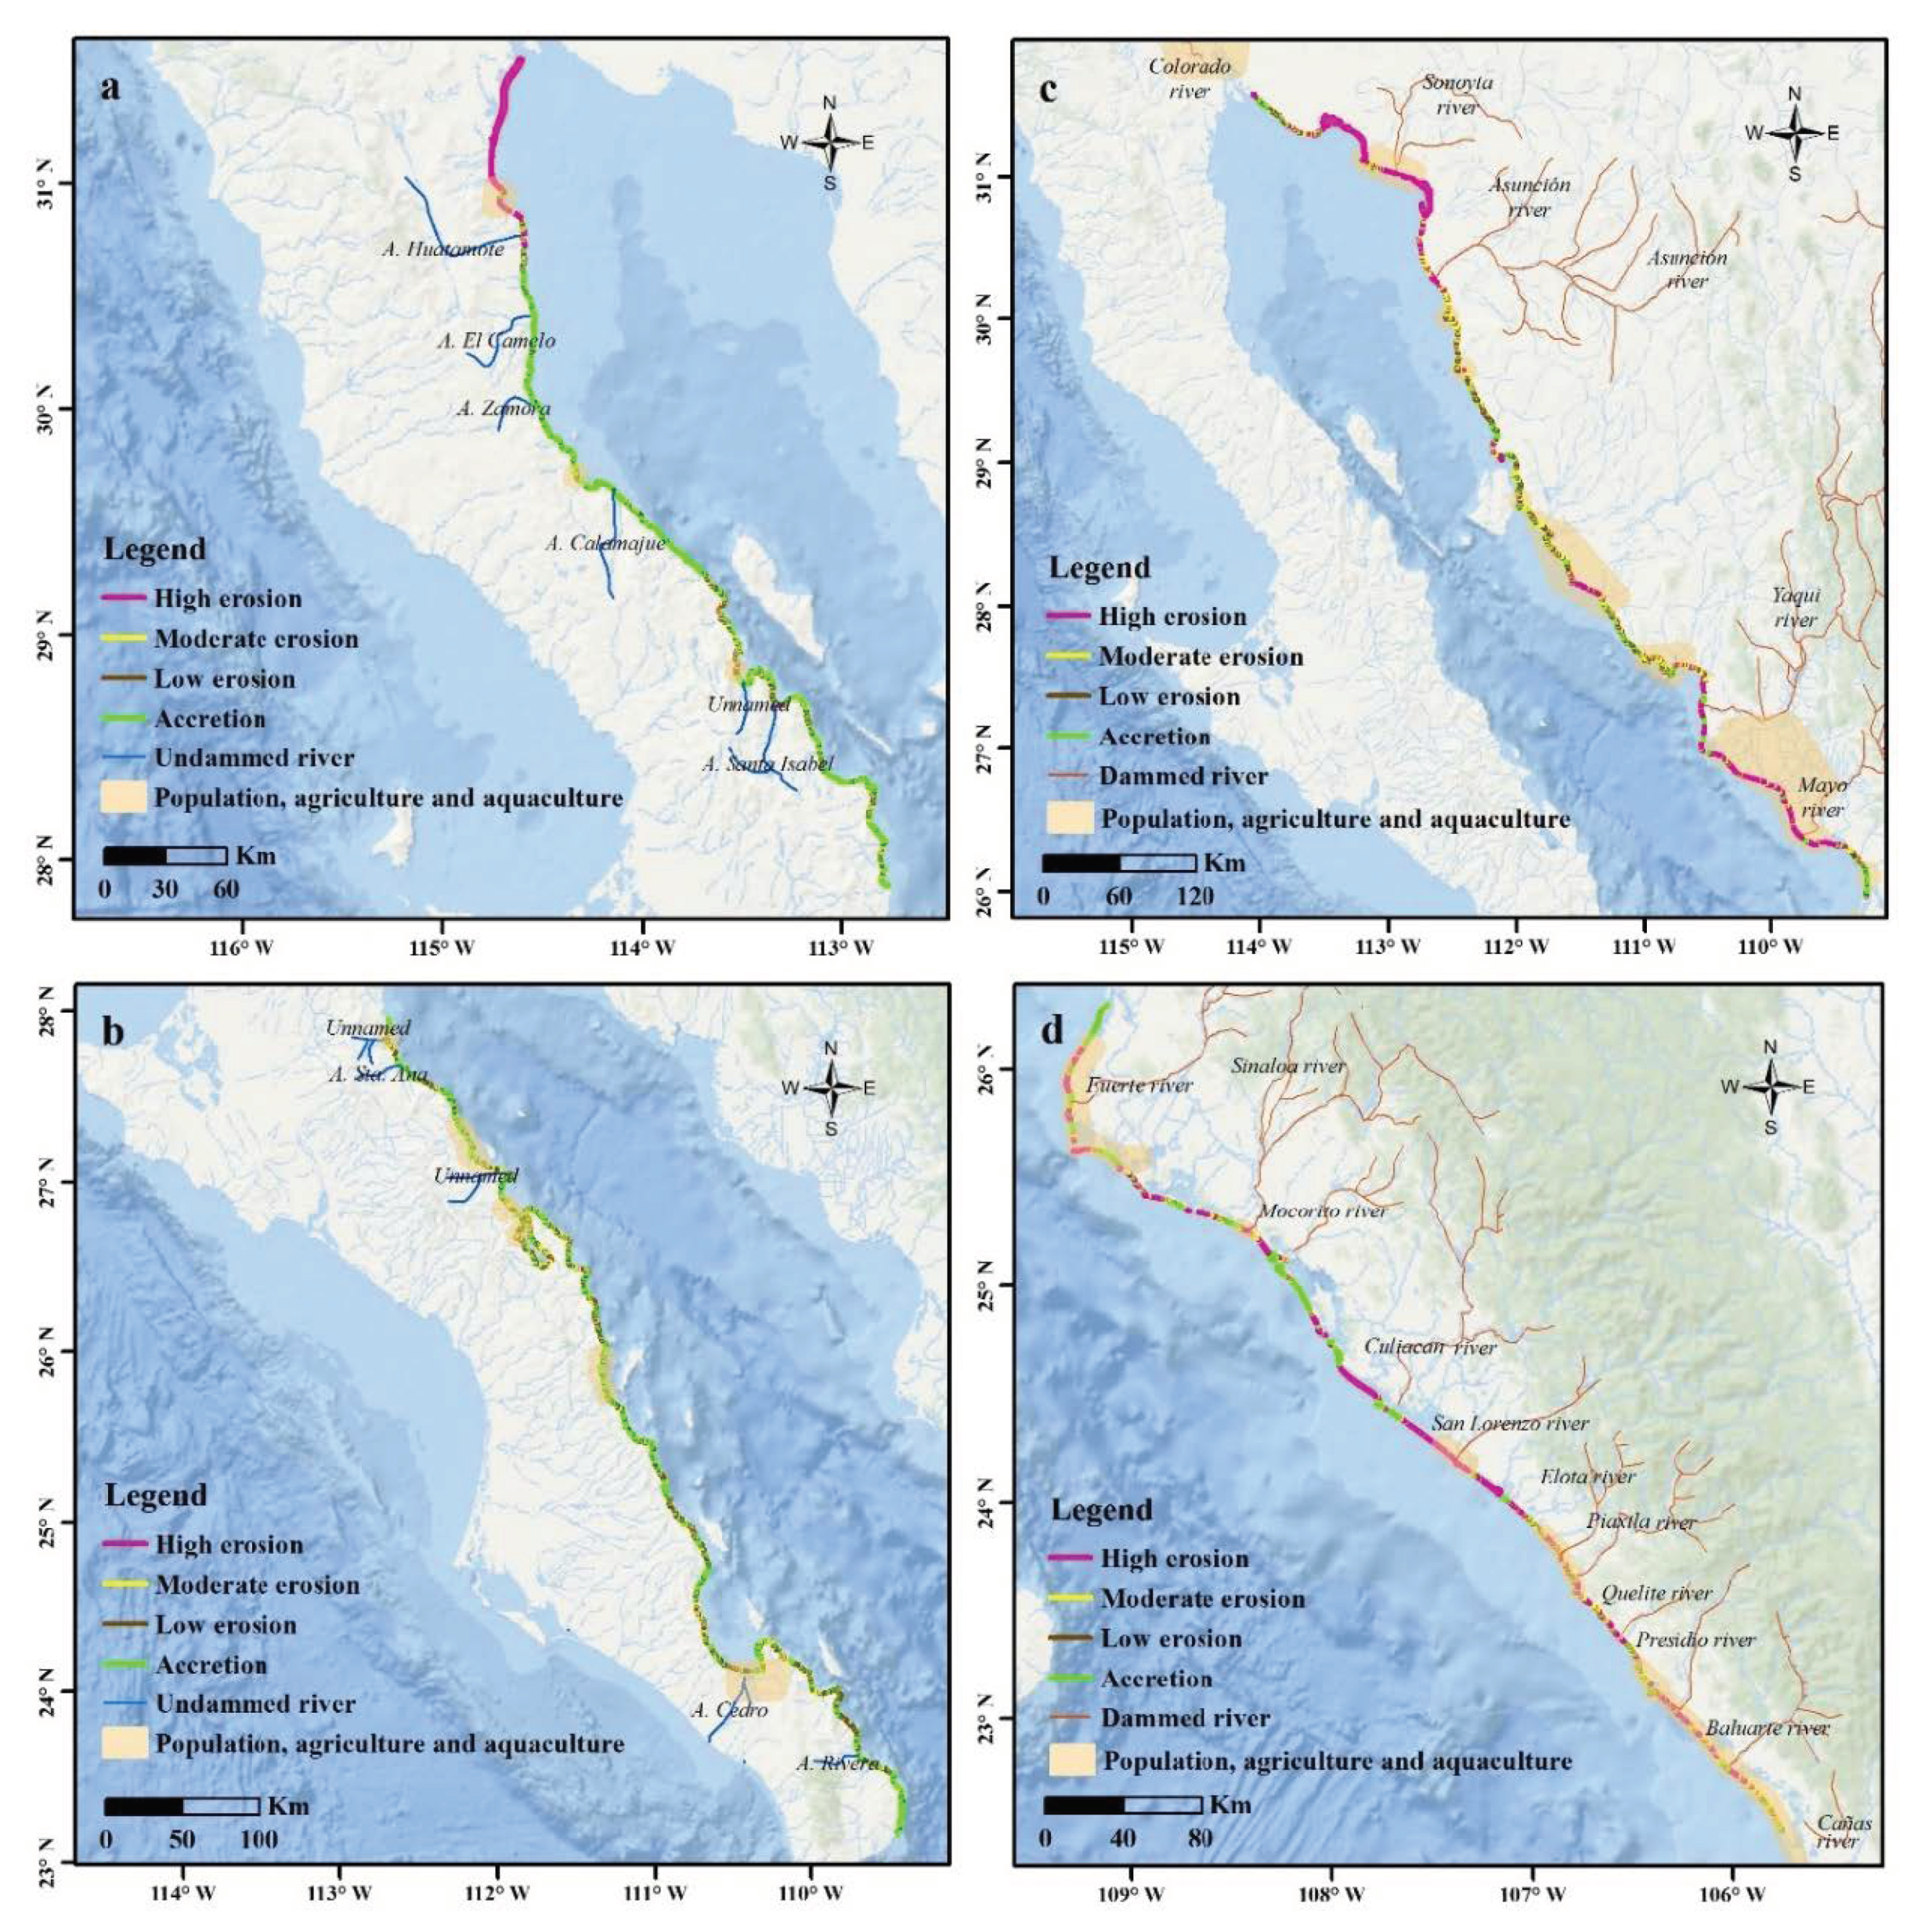
4.1. Long-Term Shoreline Change
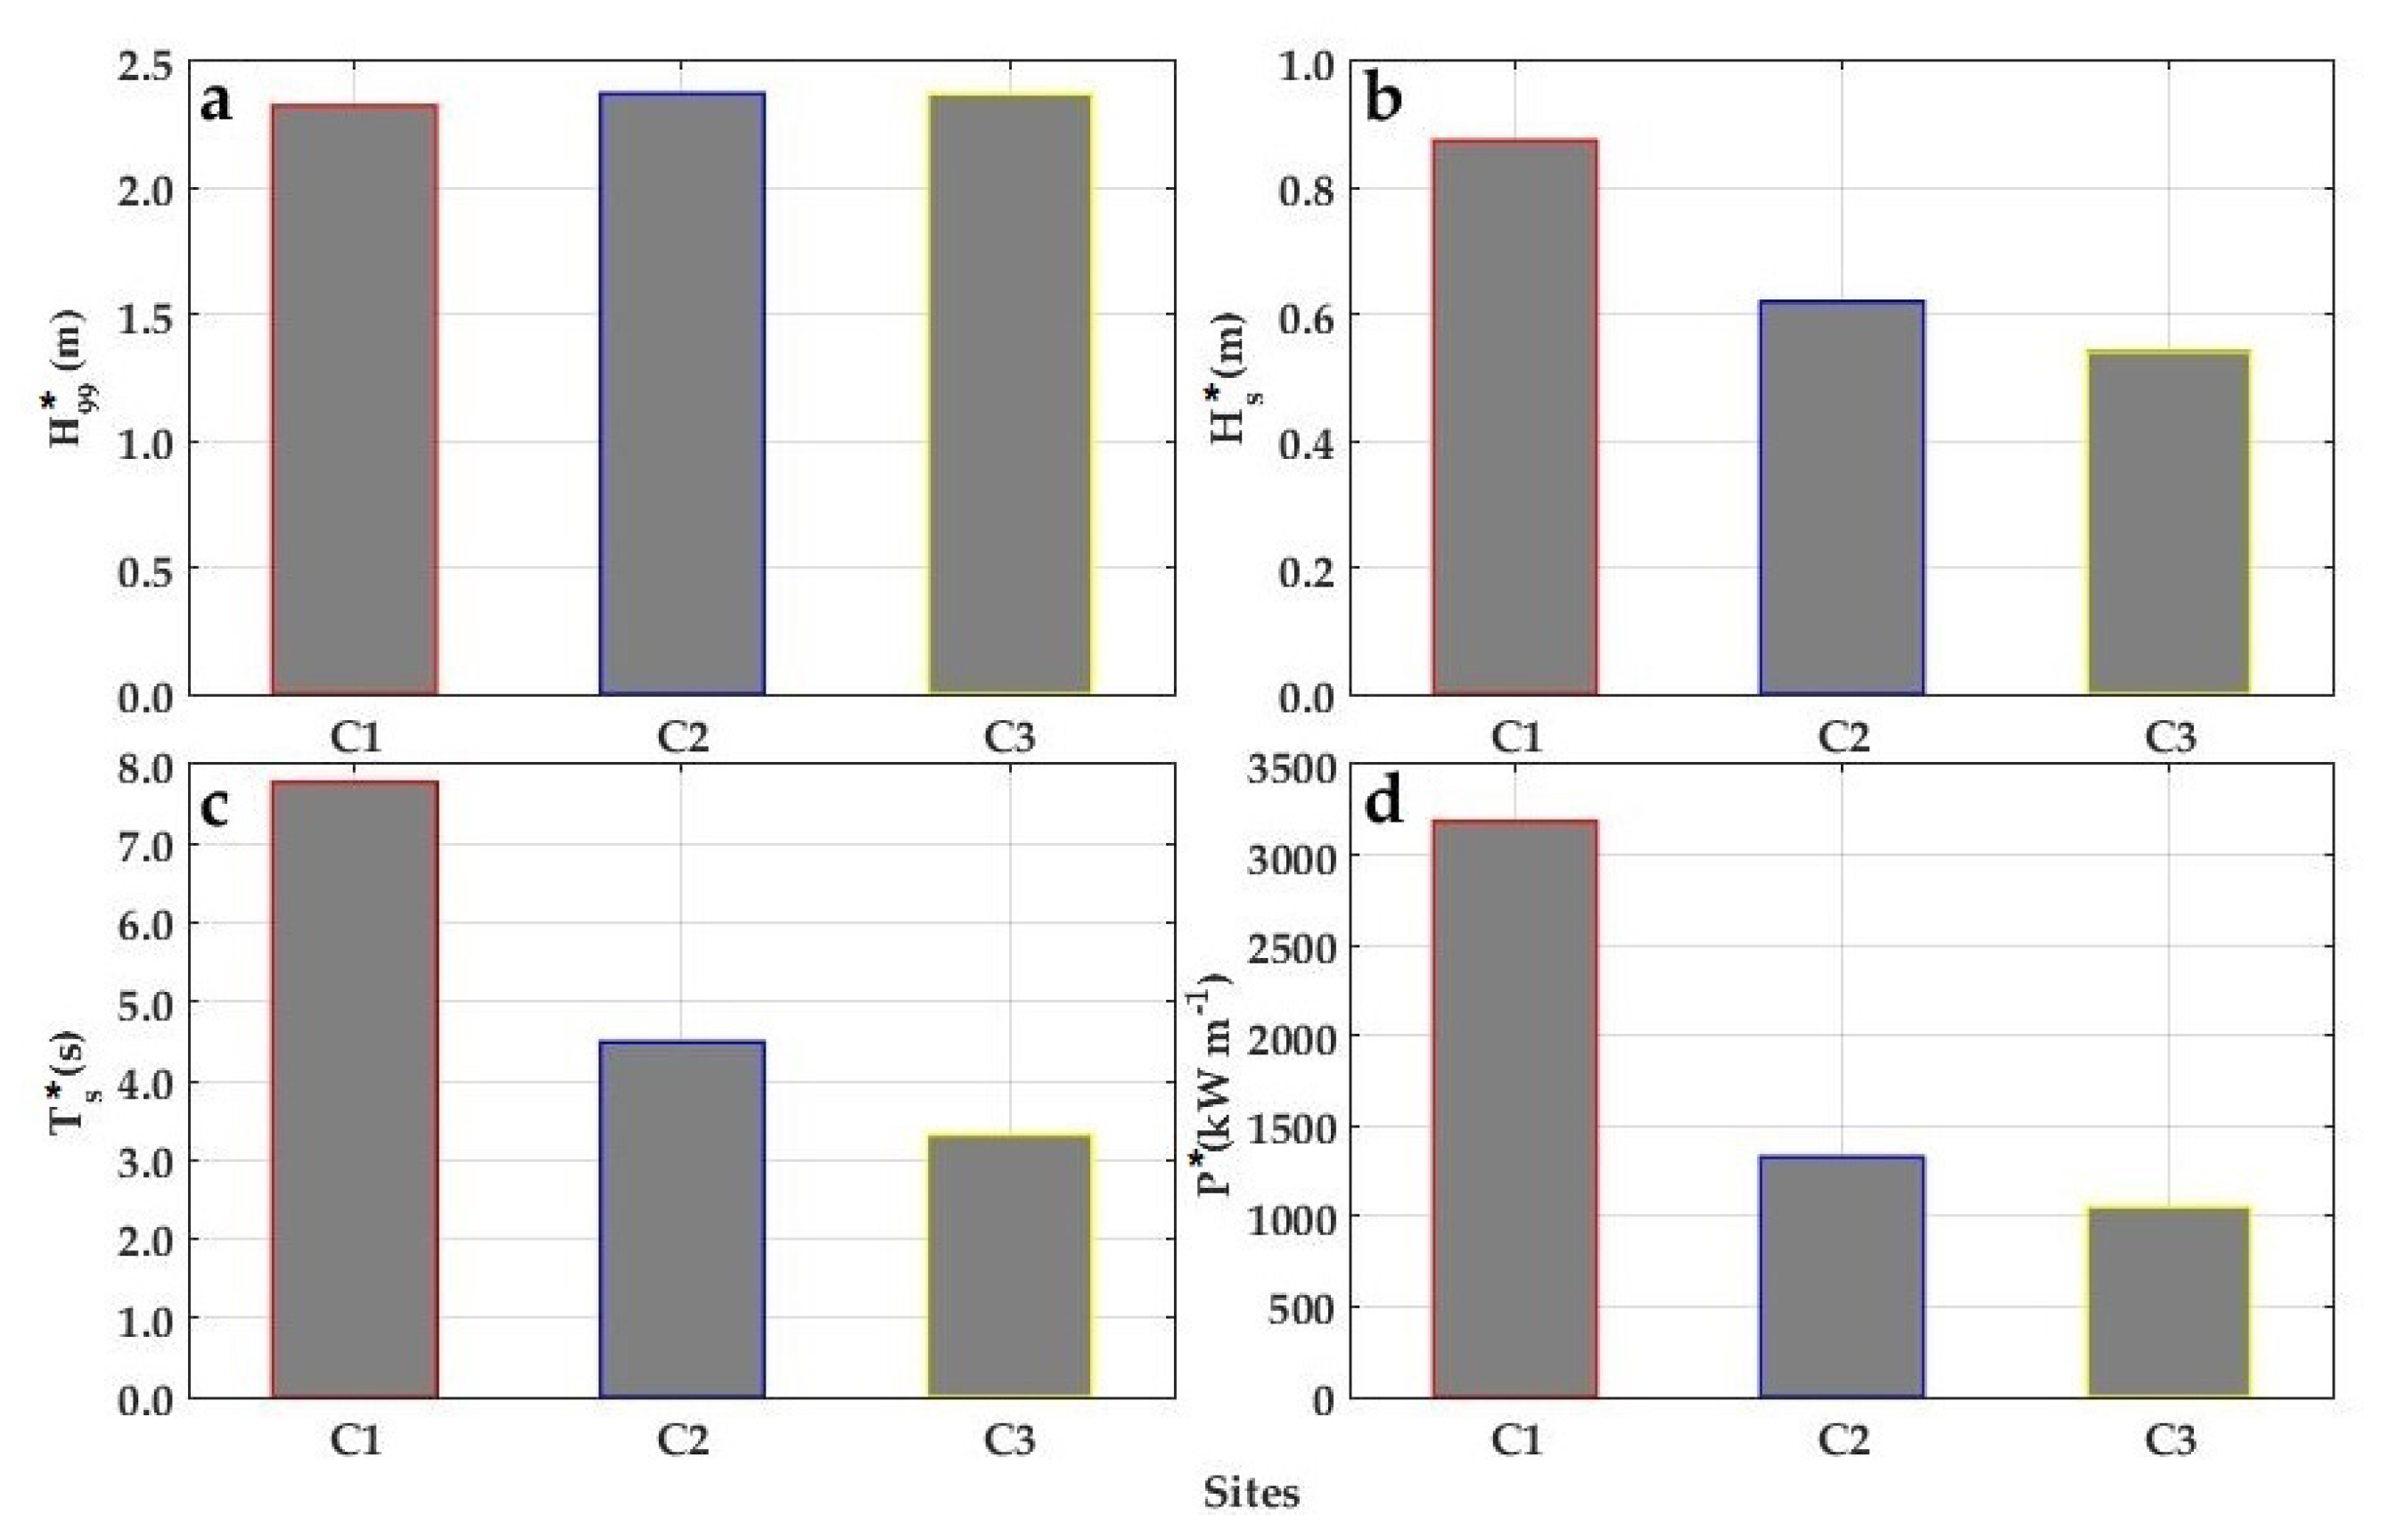
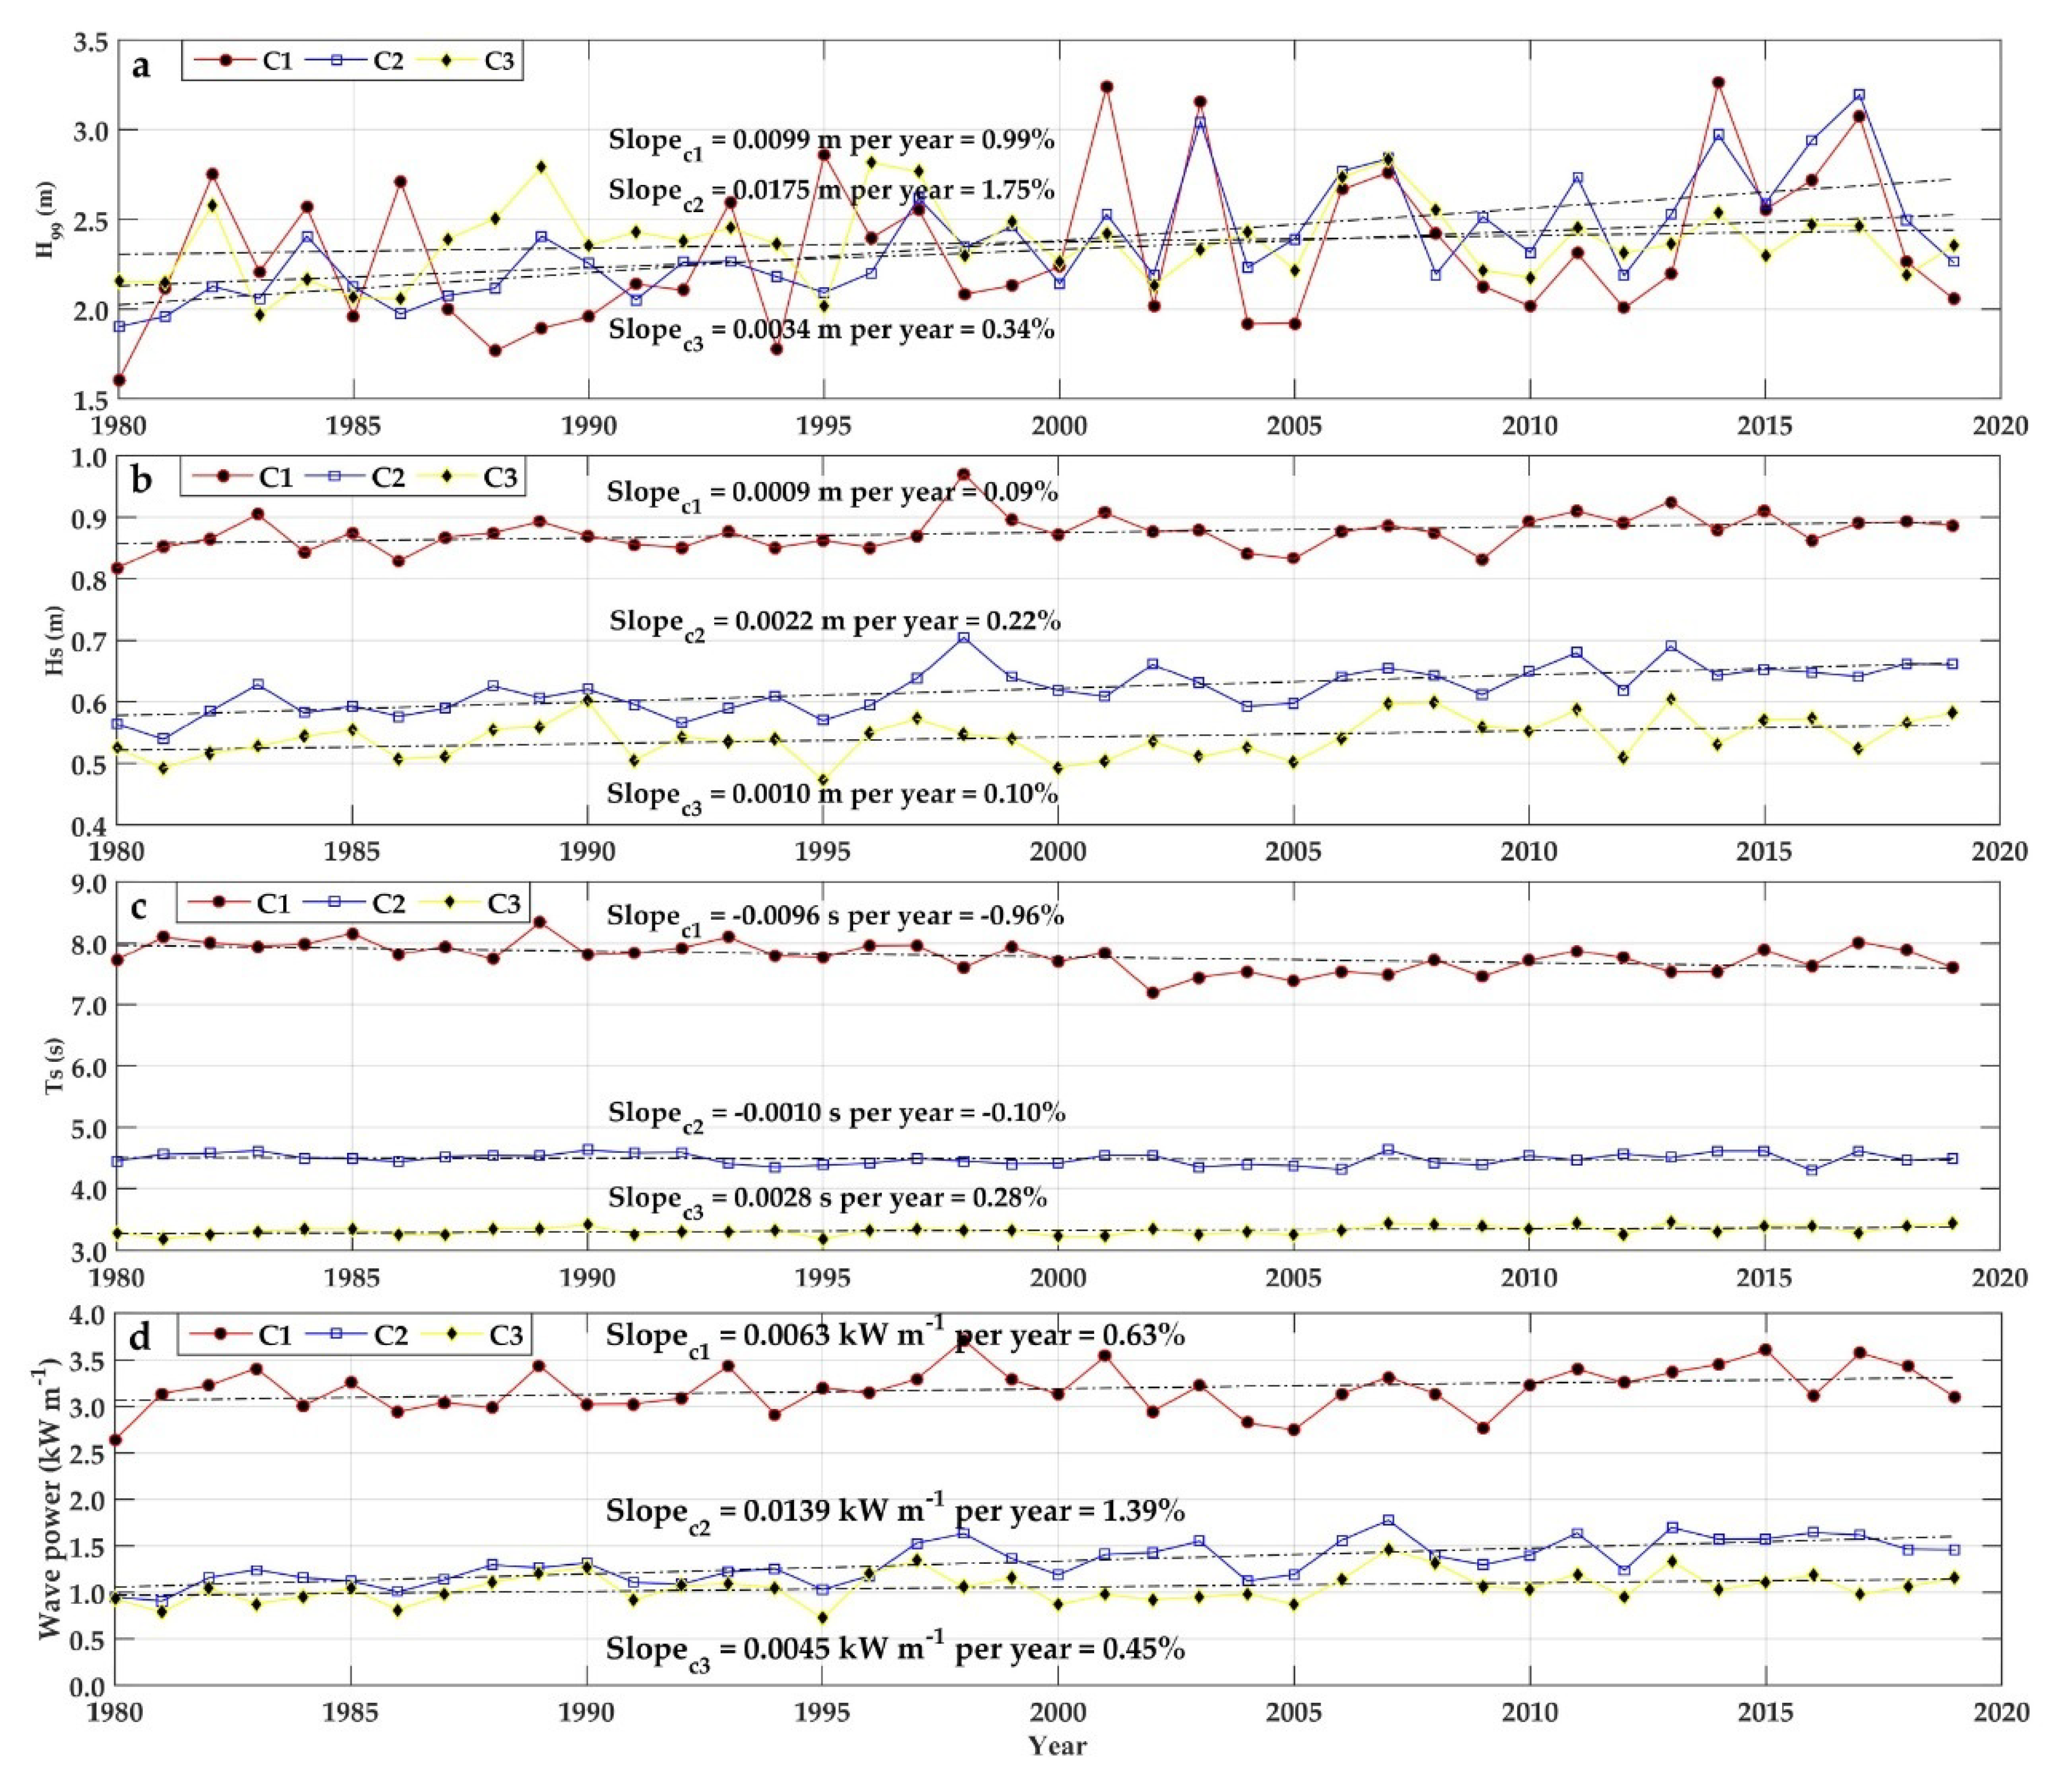
4.2. Trend and Multi-Year Mean of Wave Climate
5. Discussion
6. Conclusions
Author Contributions
Funding
Acknowledgments
Conflicts of Interest
References
- Reguero, B.G.; Losada, I.J.; Méndez, F.J. A recent increase in global wave power as a consequence of oceanic warming. Nat. Commun. 2019, 10, 1–14. [Google Scholar] [CrossRef] [PubMed]
- Ranasinghe, R. Assessing climate change impacts on open sandy coasts: A review. Earth-Sci. Rev. 2016, 160, 320–332. [Google Scholar] [CrossRef]
- Piazza Forgiarini, A.P.; Amaral de Figueiredo, S.; Calliari, L.J.; Goulart, E.S.; Marques, W.; Trombetta, T.B.; Oleinik, P.H.; Guimarães, R.C.; Arigony-Neto, J.; Cabral Salame, C. Quantifying the geomorphologic and urbanization influence on coastal retreat under sea level rise. Estuar. Coast. Shelf Sci. 2019, 230, 106437. [Google Scholar] [CrossRef]
- Nicholls, R.J.; Cazenave, A. Sea-level rise and its impact on coastal zones. Science 2010, 328, 1517–1520. [Google Scholar] [CrossRef] [PubMed]
- Fotsi, Y.F.; Pouvreau, N.; Brenon, I.; Onguene, R.; Etame, J. Temporal (1948–2012) and dynamic evolution of the Wouri estuary coastline within the gulf of Guinea. J. Mar. Sci. Eng. 2019, 7, 343. [Google Scholar] [CrossRef]
- Luijendijk, A.; Hagenaars, G.; Ranasinghe, R.; Baart, F.; Donchyts, G.; Aarninkhof, S. The State of the World’s Beaches. Sci. Rep. 2018, 8, 1–11. [Google Scholar] [CrossRef]
- Bird, E.C.F. Coastline Changes: A Global Review; John Wiley: Chischester, UK, 1985. [Google Scholar]
- Páez-Osuna, F.; Sanchez-Cabeza, J.A.; Ruiz-Fernández, A.C.; Alonso-Rodríguez, R.; Piñón-Gimate, A.; Cardoso-Mohedano, J.G.; Flores-Verdugo, F.J.; Carballo, J.L.; Cisneros-Mata, M.A.; Álvarez-Borrego, S. Environmental status of the Gulf of California: A review of responses to climate change and climate variability. Earth-Sci. Rev. 2016, 162, 253–268. [Google Scholar] [CrossRef]
- Ruiz-Fernández, A.C.; Sanchez-Cabeza, J.A.; Serrato de la Peña, J.L.; Perez-Bernal, L.H.; Cearreta, A.; Flores-Verdugo, F.; Machain-Castillo, M.L.; Chamizo, E.; García-Tenorio, R.; Queralt, I.; et al. Accretion rates in coastal wetlands of the southeastern Gulf of California and their relationship with sea-level rise. Holocene 2016, 26, 1126–1137. [Google Scholar] [CrossRef]
- Mendoza, E.; Silva, R.; Zanuttigh, B.; Angelelli, E.; Lykke Andersen, T.; Martinelli, L.; Nørgaard, J.Q.H.; Ruol, P. Beach response to wave energy converter farms acting as coastal defence. Coast. Eng. 2014, 87, 97–111. [Google Scholar] [CrossRef]
- Franco-Ochoa, C.; García-Paéz, F.; Plata-Rocha, W.; Montoya-Rodríguez, J.M.; Vergara-Sánchez, M.Á. Observation and Analysis of Hydro-morphologic Parameters in Las Glorias beach, México. Tecnol. Cienc. Agua 2019, 10, 153–170. [Google Scholar] [CrossRef]
- Odériz, I.; Silva, R.; Mortlock, T.R.; Mendoza, E. Climate drivers of directional wave power on the Mexican coast. Ocean. Dyn. 2020, 70, 1253–1265. [Google Scholar] [CrossRef]
- Young, I.R.; Zieger, S.; Babanin, A.V. Global trends in wind speed and wave height. Science 2011, 332, 451–455. [Google Scholar] [CrossRef] [PubMed]
- Dee, D.P.; Uppala, S.M.; Simmons, A.J.; Berrisford, P.; Poli, P.; Kobayashi, S.; Andrae, U.; Balmaseda, M.A.; Balsamo, G.; Bauer, P.; et al. The ERA-Interim reanalysis: Configuration and performance of the data assimilation system. Q. J. R. Meteorol. Soc. 2011, 137, 553–597. [Google Scholar] [CrossRef]
- Toimil, A.; Losada, I.J.; Camus, P.; Díaz-Simal, P. Managing coastal erosion under climate change at the regional scale. Coast. Eng. 2017, 128, 106–122. [Google Scholar] [CrossRef]
- Boak, E.H.; Turner, I.L. Shoreline Definition and Detection: A Review. J. Coast. Res. 2005, 214, 688–703. [Google Scholar] [CrossRef]
- Silva, R.; Martínez, M.L.; Hesp, P.A.; Catalan, P.; Osorio, A.F.; Martell, R.; Fossati, M.; Da Silva, G.M.; Mariño-Tapia, I.; Pereira, P.; et al. Present and future challenges of coastal erosion in Latin America. J. Coast. Res. 2014, 1–16. [Google Scholar] [CrossRef]
- Jana, A.; Biswas, A.; Maiti, S.; Bhattacharya, A.K. Shoreline changes in response to sea level rise along Digha Coast, Eastern India: An analytical approach of remote sensing, GIS and statistical techniques. J. Coast. Conserv. 2014, 18, 145–155. [Google Scholar] [CrossRef]
- Himmelstoss, E.A.; Henderson, R.E.; Kratzmann, M.G.; Farris, A. Digital Shoreline Analysis System (DSAS) version 5.0; US Geological Survey: Preston, VA, USA, 2018.
- The Nature Conservancy. Gulf of California. 2020. Available online: https://www.tncmx.org/sobre-tnc-mx/zonas-estrategicas/golfo-de-california/ (accessed on 10 November 2020).
- Enríquez-Andrade, R.; Anaya-Reyna, G.; Barrera-Guevara, J.C.; De Los Ángeles Carvajal-Moreno, M.; Martínez-Delgado, M.E.; Vaca-Rodríguez, J.; Valdés-Casillas, C. An analysis of critical areas for biodiversity conservation in the Gulf of California Region. Ocean. Coast. Manag. 2005, 48, 31–50. [Google Scholar] [CrossRef]
- Lluch-Cota, S.E.; Tripp-Valdez, M.; Lluch-Cota, D.B.; Lluch-Belda, D.; Verbesselt, J.; Herrera-Cervantes, H.; Bautista-Romero, J.J. Recent trends in sea surface temperature off Mexico. Atmosfera 2013, 26, 537–546. [Google Scholar] [CrossRef]
- Reyes, S. The monsoon in southwest North America (TRAVASON/SWAMP). Atmosfera 1993, 117–137. [Google Scholar]
- Anderson, B.T.; Roads, J.O.; Chen, S.C.; Juang, H.M.H. Regional simulation of the low-level monsoon winds over the Gulf of California and southwestern United States. J. Geophys. Res. Atmos. 2000, 105, 17955–17969. [Google Scholar] [CrossRef]
- Pascale, S.; Kapnick, S.B.; Bordoni, S.; Delworth, T.L. The influence of CO2 forcing on North American monsoon moisture surges. J. Clim. 2018, 31, 7949–7968. [Google Scholar] [CrossRef]
- Adams, D.K.; Comrie, A.C. The North American Monsoon. Bull. Am. Meteorol. Soc. 1997, 78, 2197–2214. [Google Scholar] [CrossRef]
- Mart, B.S. Morphology and Sediments of the Beaches of the Coastal Cell of San Jose del Cabo BCS Mexico; Autonomous University of Baja California Sur: La Paz, Mexico, 2018. [Google Scholar]
- Ponce Bastidas, J.S. Coastal Dynamics in El Cardonal and Cabo Pulmo Beaches; National Polytechnic Institute: Ciudad de México, Mexico, 2015. [Google Scholar]
- Kasper-Zubillaga, J.J.; Carranza-Edwards, A.; Morales De la Garza, E. Textural characterization of beach sands from the Gulf of California, Mexico: Implications for coastal processes and relief. Ciencias Mar. 2007, 33, 83–94. [Google Scholar] [CrossRef]
- Lluch-Cota, S.E.; Aragón-Noriega, E.A.; Arreguín-Sánchez, F.; Aurioles-Gamboa, D.; Jesús Bautista-Romero, J.; Brusca, R.C.; Cervantes-Duarte, R.; Cortés-Altamirano, R.; Del-Monte-Luna, P.; Esquivel-Herrera, A.; et al. The Gulf of California: Review of ecosystem status and sustainability challenges. Prog. Oceanogr. 2007, 73, 1–26. [Google Scholar] [CrossRef]
- Morales-Perez, R.; Gutierrez De Velasco, G. Tides in the Gulf of California. Geofis. Int. 1989, 28, 25–45. [Google Scholar]
- National Tidal Service. The Tides of Mexico. 2020. Available online: http://www.mareografico.unam.mx/portal/index.php?page=tiposMarea (accessed on 10 November 2020).
- Exelis Visual Information Solutions. Introduction to ENVI Analytics; Exelis Visual Information Solutions: Boulder, Colorado, 2015. [Google Scholar]
- Jalaludin, M.; Setiawan, C.; Zid, M.; Utomo, R.T. Analysis of Shoreline Changes before and after the Tsunami at Tanjung Lesung Beach, Banten Province of Indonesia. IOP Conf. Ser. Earth Environ. Sci. 2020, 412, 012004. [Google Scholar] [CrossRef]
- McFeeters, S.K. The use of the Normalized Difference Water Index (NDWI) in the delineation of open water features. Int. J. Remote Sens. 1996, 17, 1425–1432. [Google Scholar] [CrossRef]
- Mondejar, J.P.; Tongco, A.F. Near infrared band of landsat 8 as water index: A case study around Cordova and Lapu-Lapu City, Cebu, Philippines. Sustain. Environ. Res. 2019, 1, 1–15. [Google Scholar] [CrossRef]
- Ashtekar, A.S.; Mohammed-Aslam, M.A.; Moosvi, A.R. Utility of Normalized Difference Water Index and GIS for Mapping Surface Water Dynamics in Sub-Upper Krishna Basin. J. Indian Soc. Remote Sens. 2019, 47, 1431–1442. [Google Scholar] [CrossRef]
- Oyedotun, T.D.T. Shoreline Evolution and Metocean Data Behaviour in Southwest England: Is There Any Historical Link? Environ. Process. 2016, 3, 939–960. [Google Scholar] [CrossRef]
- Jonah, F.E.; Boateng, I.; Osman, A.; Shimba, M.J.; Mensah, E.A.; Adu-Boahen, K.; Chuku, E.O.; Effah, E. Shoreline change analysis using end point rate and net shoreline movement statistics: An application to Elmina, Cape Coast and Moree section of Ghana’s coast. Reg. Stud. Mar. Sci. 2016, 7, 19–31. [Google Scholar] [CrossRef]
- Kermani, S.; Boutiba, M.; Guendouz, M.; Guettouche, M.S.; Khelfani, D. Detection and analysis of shoreline changes using geospatial tools and automatic computation: Case of jijelian sandy coast (East Algeria). Ocean. Coast. Manag. 2016, 132, 46–58. [Google Scholar] [CrossRef]
- Barbaro, G.; Bombino, G.; Foti, G.; Borrello, M.M.; Puntorieri, P. Shoreline evolution near river mouth: Case study of Petrace River (Calabria, Italy). Reg. Stud. Mar. Sci. 2019, 29, 100619. [Google Scholar] [CrossRef]
- Oyedotun, T.D.T. Shoreline Geometry: DSAS as a Tool for Historical Trend Analysis. Geomorphol. Tech. 2014, 3, 1–12. [Google Scholar]
- Ding, Y.; Yu, J.; Cheng, H. Long-term wave climate characteristics and potential impacts on embayed beaches along the west Guangdong coastline. Reg. Stud. Mar. Sci. 2019, 30, 100741. [Google Scholar] [CrossRef]
- Mann, H.B. Non-Parametric Test Against Trend. Econometrica 1945, 13, 245–259. [Google Scholar] [CrossRef]
- Kendall, M.G. Rank Correlation Methods; Griffin: Oxford, UK, 1975. [Google Scholar]
- Vieira, F.; Cavalcante, G.; Campos, E. Analysis of wave climate and trends in a semi-enclosed basin (Persian Gulf) using a validated SWAN model. Ocean. Eng. 2020, 196, 106821. [Google Scholar] [CrossRef]
- Jiménez, A.; Marinone, S.G.; Parés-Sierra, A. Effect of the spatial and temporal variability of winds on the circulation in the Gulf of California. Cienc. Mar. 2005, 31, 357–368. [Google Scholar] [CrossRef][Green Version]
- Wang, X.L.; Feng, Y.; Swail, V.R. Changes in global ocean wave heights as projected using multimodel CMIP5 simulations. Geophys. Res. Lett. 2014, 41, 1026–1034. [Google Scholar] [CrossRef]
- Shanas, P.R.; Aboobacker, V.M.; Albarakati, A.M.M.A.; Zubier, K.M.M. Climate driven variability of wind-waves in the Red Sea. Ocean. Model. 2017, 119, 105–117. [Google Scholar] [CrossRef]
- Aydoğan, B.; Ayat, B. Spatial variability of long-term trends of significant wave heights in the Black Sea. Appl. Ocean. Res. 2018, 79, 20–35. [Google Scholar] [CrossRef]
- Farfán, L.M.; D’Sa, E.J.; Liu, K.B.; Rivera-Monroy, V.H. Tropical Cyclone Impacts on Coastal Regions: The Case of the Yucatán and the Baja California Peninsulas, Mexico. Estuaries Coasts 2014, 37, 1388–1402. [Google Scholar] [CrossRef]
- Ramírez, M.G.; Espinosa, I.N.R. Monitoring of nortes on the Gulf of Mexico coast in the 1999-2000 season. Rev. Geográfica 2002, 131, 5–19. [Google Scholar]
- Dingler, J.R.; Reiss, T.E. Cold-front driven storm erosion and overwash in the central part of the Isles Dernieres, a Louisiana barrier-island arc. Mar. Geol. 1990, 91, 195–206. [Google Scholar] [CrossRef]
- Mendoza, E.T.; Jiménez, J.A. Storm-Induced Erosion Potential on the Catalonian Coast. J. Coast. Res. 2006, 81–88. [Google Scholar]
- Ezcurra, E.; Barrios, E.; Ezcurra, P.; Ezcurra, A.; Vanderplank, S.; Vidal, O.; Villanueva-Almanza, L.; Aburto-Oropeza, O. A natural experiment reveals the impact of hydroelectric dams on the estuaries of tropical rivers. Sci. Adv. 2019, 5, eaau9875. [Google Scholar] [CrossRef] [PubMed]
- Oyedotun, T.D.T.; Ruiz-Luna, A.; Navarro-Hernández, A.G. Contemporary shoreline changes and consequences at a tropical coastal domain. Geol. Ecol. Landsc. 2018, 2, 104–114. [Google Scholar] [CrossRef]
- Jiménez-Illescas, Á.R.; Zayas-Esquer, M.M.; Espinosa-Carreón, T.L. Integral Management of the Coastal Zone to Solve the Problems of Erosion in Las Glorias Beach, Guasave, Sinaloa, Mexico. In Coastal Management; Elsevier: Amsterdam, The Netherlands, 2019; pp. 141–163. ISBN 9780128104736. [Google Scholar]
- Martínez, M.L.; Landgrave, R.; Silva, R.; Hesp, P. Shoreline Dynamics and Coastal Dune Stabilization in Response to Changes in Infrastructure and Climate. J. Coast. Res. 2019, 92, 6. [Google Scholar] [CrossRef]
- Escudero, M.; Silva, R.; Mendoza, E. Beach Erosion Driven by Natural and Human Activity at Isla del Carmen Barrier Island, Mexico. J. Coast. Res. 2014, 71, 62–74. [Google Scholar] [CrossRef]
- Stembridge, J.E. Dams, effects of. In Beaches and Coastal Geology. In Beaches and Coastal Geology; Springer US: Boston, MA, USA, 1982; pp. 356–357. ISBN 978-0-387-30843-2. [Google Scholar]
- Ruberti, D.; Vigliotti, M.; Di Mauro, A.; Chieffi, R.; Di Natale, M. Human influence over 150 years of coastal evolution in the Volturno delta system (southern Italy). J. Coast. Conserv. 2018, 22, 897–917. [Google Scholar] [CrossRef]
- Le Cozannet, G.; Garcin, M.; Yates, M.; Idier, D.; Meyssignac, B. Approaches to evaluate the recent impacts of sea-level rise on shoreline changes. Earth-Sci. Rev. 2014, 138, 47–60. [Google Scholar] [CrossRef]
- Gómez-Pazo, A.; Pérez-Alberti, A.; Pérez, X.L.O. Recent evolution (1956–2017) of rodas beach on the Cíes Islands, Galicia, NW Spain. J. Mar. Sci. Eng. 2019, 7, 125. [Google Scholar] [CrossRef]
- Bera, R.; Maiti, R. Quantitative analysis of erosion and accretion (1975–2017) using DSAS—A study on Indian Sundarbans. Reg. Stud. Mar. Sci. 2019, 28, 100583. [Google Scholar] [CrossRef]


| Spacecraft ID/Sensor | Acquired Date | Path/Row | Pixel Resolution |
|---|---|---|---|
| Landsat 2-3/Multispectral Scanner System (MSS) | 1978-11-05 | 036/043 | 60 m |
| 1978-11-05 | 036/044 | 60 m | |
| 1978-10-01 | 037/042 | 60 m | |
| 1978-10-01 | 037/043 | 60 m | |
| 1978-10-02 | 038/041 | 60 m | |
| 1978-10-02 | 038/042 | 60 m | |
| 1978-11-08 | 039/040 | 60 m | |
| 1978-11-08 | 039/041 | 60 m | |
| 1980-10-19 | 039/040 | 60 m | |
| 1980-10-02 | 040/039 | 60 m | |
| 1981-10-26 | 033/044 | 60 m | |
| 1981-10-27 | 034/043 | 60 m | |
| 1981-11-15 | 035/043 | 60 m | |
| 1981-11-15 | 035/042 | 60 m | |
| 1981-11-16 | 036/042 | 60 m | |
| 1981-09-23 | 036/041 | 60 m | |
| 1981-09-23 | 036/042 | 60 m | |
| 1981-11-17 | 037/041 | 60 m | |
| 1981-10-14 | 039/039 | 60 m | |
| 1981-09-27 | 040/038 | 60 m | |
| Landsat 8/Operational Land Imager (OLI) | 2019-10-31 | 031/044 | 30 m |
| 2019-10-22 | 032/043 | 30 m | |
| 2019-10-22 | 032/044 | 30 m | |
| 2019-10-29 | 033/042 | 30 m | |
| 2019-10-29 | 033/043 | 30 m | |
| 2019-10-04 | 034/042 | 30 m | |
| 2019-10-20 | 034/044 | 30 m | |
| 2019-10-11 | 035/041 | 30 m | |
| 2019-10-11 | 035/042 | 30 m | |
| 2019-11-14 | 033/044 | 30 m | |
| 2019-10-20 | 034/041 | 30 m | |
| 2019-10-16 | 038/039 | 30 m | |
| 2019-10-04 | 034/043 | 30 m | |
| 2019-10-16 | 038/038 | 30 m | |
| 2019-10-25 | 037/040 | 30 m | |
| 2019-10-25 | 037/039 | 30 m | |
| 2019-10-25 | 037/038 | 30 m | |
| 2019-10-18 | 036/041 | 30 m | |
| 2019-10-18 | 036/040 | 30 m |
| N° | EPR (m Per Year) | Shoreline Classification |
|---|---|---|
| 1 | <−2 | High erosion |
| 2 | >−2 to <−1 | Moderate erosion |
| 3 | >−1 to <0 | Low erosion |
| 4 | >0 | Accretion |
| Statistics | B.C.S. | B.C. | Sonora | Sinaloa | Regional (Total) |
|---|---|---|---|---|---|
| Mean shoreline change (m/year) | −0.1 | −2.7 | −4.6 | −1.2 | −2.2 |
| Minimum shoreline change (m/year) | −4.8 | −43.4 | −78.1 | −50.7 | −78.1 |
| Maximum shoreline change (m/year) | 9.1 | 18.1 | 14.1 | 81.3 | 81.3 |
| Mean accretion rate (m/year) | 0.7 | 1.0 | 1.7 | 7.5 | 1.9 |
| Mean erosion rate (m/year) | −0.8 | −7.5 | −5.5 | −3.8 | −4.2 |
| Standard deviation (m/year) | 1.0 | 9.2 | 10.6 | 9.8 | 8.6 |
| Shoreline length that records erosion (km) | 558.2 | 275.0 | 958.7 | 491.7 | 2283.6 |
| Shoreline length that records accretion (km) | 451.7 | 354.9 | 134.4 | 146.4 | 1087.4 |
| Shoreline part subjected to erosion with respect to the total study area (%) | 16.6 | 8.2 | 28.4 | 14.6 | 67.8 |
| Shoreline part subjected to accretion with respect to the total study area (%) | 13.4 | 10.5 | 4.0 | 4.3 | 32.2 |
| Landfall Location | Type of Tropical Cyclone | |||||||
|---|---|---|---|---|---|---|---|---|
| td | ts | h1 | h2 | h3 | h4 | h5 | Total | |
| B.C. | 2 | 1 | --- | --- | --- | --- | --- | 3 |
| B.C.S. | 4 | 7 | 5 | 3 | 2 | --- | --- | 21 |
| Sonora | 3 | 2 | 2 | --- | --- | --- | --- | 7 |
| Sinaloa | 5 | 6 | 5 | 5 | 3 | --- | --- | 24 |
| total | 14 | 16 | 12 | 8 | 5 | --- | --- | 55 |
| N° | Month | Cold Fronts |
|---|---|---|
| 1 | September | 3 |
| 2 | October | 5 |
| 3 | November | 6 |
| 4 | December | 6 |
| 5 | January | 7 |
| 6 | February | 8 |
| 7 | March | 6 |
| 8 | April | 5 |
| 9 | May | 4 |
| Total | 50 |
Publisher’s Note: MDPI stays neutral with regard to jurisdictional claims in published maps and institutional affiliations. |
© 2020 by the authors. Licensee MDPI, Basel, Switzerland. This article is an open access article distributed under the terms and conditions of the Creative Commons Attribution (CC BY) license (http://creativecommons.org/licenses/by/4.0/).
Share and Cite
Franco-Ochoa, C.; Zambrano-Medina, Y.; Plata-Rocha, W.; Monjardín-Armenta, S.; Rodríguez-Cueto, Y.; Escudero, M.; Mendoza, E. Long-Term Analysis of Wave Climate and Shoreline Change along the Gulf of California. Appl. Sci. 2020, 10, 8719. https://doi.org/10.3390/app10238719
Franco-Ochoa C, Zambrano-Medina Y, Plata-Rocha W, Monjardín-Armenta S, Rodríguez-Cueto Y, Escudero M, Mendoza E. Long-Term Analysis of Wave Climate and Shoreline Change along the Gulf of California. Applied Sciences. 2020; 10(23):8719. https://doi.org/10.3390/app10238719
Chicago/Turabian StyleFranco-Ochoa, Cuauhtémoc, Yedid Zambrano-Medina, Wenseslao Plata-Rocha, Sergio Monjardín-Armenta, Yandy Rodríguez-Cueto, Mireille Escudero, and Edgar Mendoza. 2020. "Long-Term Analysis of Wave Climate and Shoreline Change along the Gulf of California" Applied Sciences 10, no. 23: 8719. https://doi.org/10.3390/app10238719
APA StyleFranco-Ochoa, C., Zambrano-Medina, Y., Plata-Rocha, W., Monjardín-Armenta, S., Rodríguez-Cueto, Y., Escudero, M., & Mendoza, E. (2020). Long-Term Analysis of Wave Climate and Shoreline Change along the Gulf of California. Applied Sciences, 10(23), 8719. https://doi.org/10.3390/app10238719