Article

Life Cycle Assessment of CO2 Emissions of Online Music and Videos Streaming in Japan

Graduate School of Human Development and Environment, Kobe University, 3-11 Tsurukabuto, Nada-ku, Kobe 657-8501, Japan
*
Author to whom correspondence should be addressed.
Appl. Sci. 2021, 11(9), 3992; https://doi.org/10.3390/app11093992
Submission received: 1 April 2021 / Revised: 21 April 2021 / Accepted: 27 April 2021 / Published: 28 April 2021
(This article belongs to the Section Environmental Sciences)

Abstract

:
In this study, we analyzed the CO2 emissions of online music and video streaming services, as one of the digital contents, in Japan using life cycle assessment. As a system boundary of online music and video streaming, processes such as data center construction and server manufacturing, usage of communication networks and internet communication technology devices (personal computers (PCs) and smartphones), and disposal of data centers and servers were considered. Data were collected using statistical and online surveys, and CO2 emissions per 1 MB of communication volume were calculated. One of the results revealed that the lifecycle CO2 emissions of listening to online music using PCs and smartphones were 5.88 × 10⁻⁴ and 1.43 × 10⁻⁴ kg-CO2/MB, respectively. The overall CO2 emissions for domestic music and video streaming services in 2019 was 921 thousand t-CO2. Online video streaming accounted for 87.7% of the total emissions, which corresponded to approximately 0.23% of domestic CO2 emissions derived from electric power generation.

1. Introduction

According to the Paris Agreement, adopted at COP21 (21st Conference of the Parties) in 2015, all countries should limit the increase in the global average temperature to well below 2 °C above the pre-industrial levels and to 1.5 °C higher [1]. Based on this agreement, Japan set a goal for “carbon neutrality” to reduce greenhouse gas (GHG) emissions to neutrally zero by 2050 [2]. To achieve, the Japanese government has been promoting research and development to change the industrial structure and economic society of Japan. This includes innovation in information technology, represented by “Society 5.0”, which was advocated by the national government in 2016 [3]. Society 5.0 was defined as a “human-centered society that achieves both economic development and resolution of social issues through a system that highly integrates cyber space and physical space” [3]. This initiative is expected to reduce GHG emissions by utilizing information and communication technology (ICT). The usage of ICT equipment and infrastructure, represented by personal computers (PCs) and smartphones, is expected to reduce CO2 emissions by streamlining energy use and production and consumption of goods. Examples of CO2 emissions reduction using ICT are adaptation in the household electricity sector [4] and the spread of mobile phones in developing countries [5].
Although ICT offers convenience, the increase in power consumption due to progress made in ICT cannot be ignored. According to the estimates made by the Center for Low Carbon Society Strategy, Japanese Science and Technology Agency [6], the domestic power consumption of ICT equipment in 2006 was approximately 43 billion kWh, and was estimated to increase to approximately 55 billion kWh. This power consumption was also projected to increase to approximately 1480 billion kWh by 2030 [6]. The forecast for 2025 was equivalent to approximately 20% of the total domestic power generation. This report also indicated that the power consumption by domestic data centers accounted for 1% of the annual domestic power consumption in 2015 [6]. Thus, ICT-related energy conservation has become an urgent issue to address.
ICT provides various services, and this study focused on online music and video streaming. In recent years, a lifestyle of listening and/or watching music and video streamed from the internet worldwide on PCs and smartphones has been established. According to the Japanese Ministry of Economy, Trade, and Industry [7], the total domestic digital content market in 2018 was USD 97,410 million, of which, online music and videos accounted for 8% and 33%, respectively. By 2023, the digital content market is projected to reach USD 103,678 million [7].
Lifestyle changes accompanied by convenience may be appealing; however, an increase in environmental impact due to such lifestyle changes may not be desirable for a sustainable society. To avoid this, the environmental impact of ICT should be understood such that its promotion can suppress the environmental impact. In this study, we aimed to examine CO2 emissions associated with online music and video streaming using life cycle assessment (LCA).
There are a wide range of fields related to ICT, and many studies have examined the environmental impact of ICT from an environmental aspect; smart cities [8,9,10], smart homes and buildings [11,12,13,14], transportation [15,16,17,18], teleworking [19,20,21], and ICT equipment [22,23,24]. In the field regarding consumer experiments, Matsuno et al. [25] compared CO2 emissions from listening to music through Compact Disc (CDs) and online streaming. Buonocore [26] compared the environmental impacts of packaged and digital versions of video games in the United States of America. Shehabi et al. [27] and Hochschorner et al. [28] analyzed the GHG emissions of online video streaming in the United States of America and Sweden, respectively. Pohl et al. [29] reviewed the implementation of LCA for various ICT-related services. This study focused on online music and video streaming in Japan and examined CO2 emissions through the entire life cycle, including the construction of data centers, usage of communication networks, listening and/or watching by the users, and disposal of the date center. In particular, CO2 emissions were estimated based on the type of streaming and ICT equipment used by the users for listening and/or watching through online streaming. In this study, the impact of CO2 emissions from online music and video streaming at the national level was examined.

2. Materials and Methods

2.1. Domestic Market of Music and Videos Streaming

The purchase of CDs and online music streaming is a popular way of listening to music in Japan. CDs, introduced in 1982, have been a mainstream form of music listening for a long time. However, online music streaming, which began in 1999, has shifted the mainstream music market globally to online streaming. The sales from online music streaming in 2019 reached 11.14 billion USD, accounting for 56.1% of global music sales [30]. The United States of America leads the global music market, followed by Japan. In the United States of America, sales from online music streaming have been higher than physical sales. However, in Japan, CDs have been the bestsellers because of the custom of preferring the possession of goods, especially by the elderly, with the Japanese business practice prioritizing the sales of CDs. In 2019, the Japanese music market was approximately JPY 300 million (USD 2.87 million as per the exchange rate on 11 February 2021, 1 JPY = 0.0096 USD), of which approximately 75% were from physical sales [31]. However, physical sales have been annually declining in Japan because of the emerging online music streaming. The proportions of physical sales and online music streaming in the domestic music market were 84.4% and 15.6% in 2015, which changed to 76.5% and 23.5% in 2019, respectively [31]. This shows that the proportion of online music streaming may continue to increase in the future as well.
According to a survey conducted by ICT Research and Consulting Inc. of Tokyo, Japan [32], 21.6 million users streamed music by the end of 2019, with 11.4 million subscribers and 10.2 million free users. By the end of 2023, the number of users was expected to increase to 29.3 million [32]. Another survey indicated that the top two pieces of ICT equipment for listening to subscribed music streaming in 2020 were smartphones (87.8% of respondents) and PCs (55.2% of respondents). PCs included desktops and laptops [32].
Similar to the music market, video home systems (VHSs) and digital versatile discs (DVDs) once formed the mainstream video market. According to the Japanese Video Software Association [33], the domestic subscription-based video market equaled JPY 59.7 billion (USD 0.57 billion) in 2013, which expanded to JPY 240.4 billion (USD 2.30 billion) in 2019, equivalent to 42% of the total video software market in 2019. The number of video streaming users also increased. According to a survey conducted by ICT Research and Consulting Inc. [32], the number of online video streaming users was 8.9 million by the end of 2016, which increased to up to 17.1 million by the end of 2019. Nielsen Global Media of Tokyo, Japan [34] reported the number of users that accessed the top five domestic free video streaming services (YouTube, GYAO!, Abema TV, Nico Bouncier Video, and Tver) via smartphones and found that the number of users reached 39.75 and 48.86 million by the end of 2017 and 2019, respectively. Similar to online music streaming, the top two pieces of ICT equipment utilized for subscription based video streaming in 2019 were smartphones (64.0% respondents) and PCs (61.0% respondents), where the latter included desktops and laptops [35].

2.2. LCA of Music and Videos Streaming

LCA is implemented in compliance with ISO14040:2006. Goal of this study is to clarify life cycle CO2 emissions of online music and videos streaming. In this study, CO2 emissions per 1 MB of communication volume associated with listening and/or watching domestic online music and videos were estimated for 2019. Figure 1 shows the system boundary as the scope of this study. This study focused on three processes, construction and manufacturing, usage, and disposal. In this study, a life cycle inventory study was conducted based on this goal. The inventory data required for each process to calculate CO2 emissions were collected in the next section.
As data centers are present in Japan as well as overseas, understanding the construction and usage status of overseas data centers was necessary. However, information such as country-wise listing of data centers that store music and/or videos for online listening and/or watching is confidential, including the information about the per-company storage capacity of music and/or videos. Therefore, online music and/or video streaming services used in Japan were assumed to be distributed from a data center in Japan. Additionally, the ICT equipment items used by the users for listening and/or watching video streaming were assumed to be PCs and smartphones in this study, because of their frequent use for the aforementioned online music and/or video streaming in Japan.

2.3. Inventory Analysis

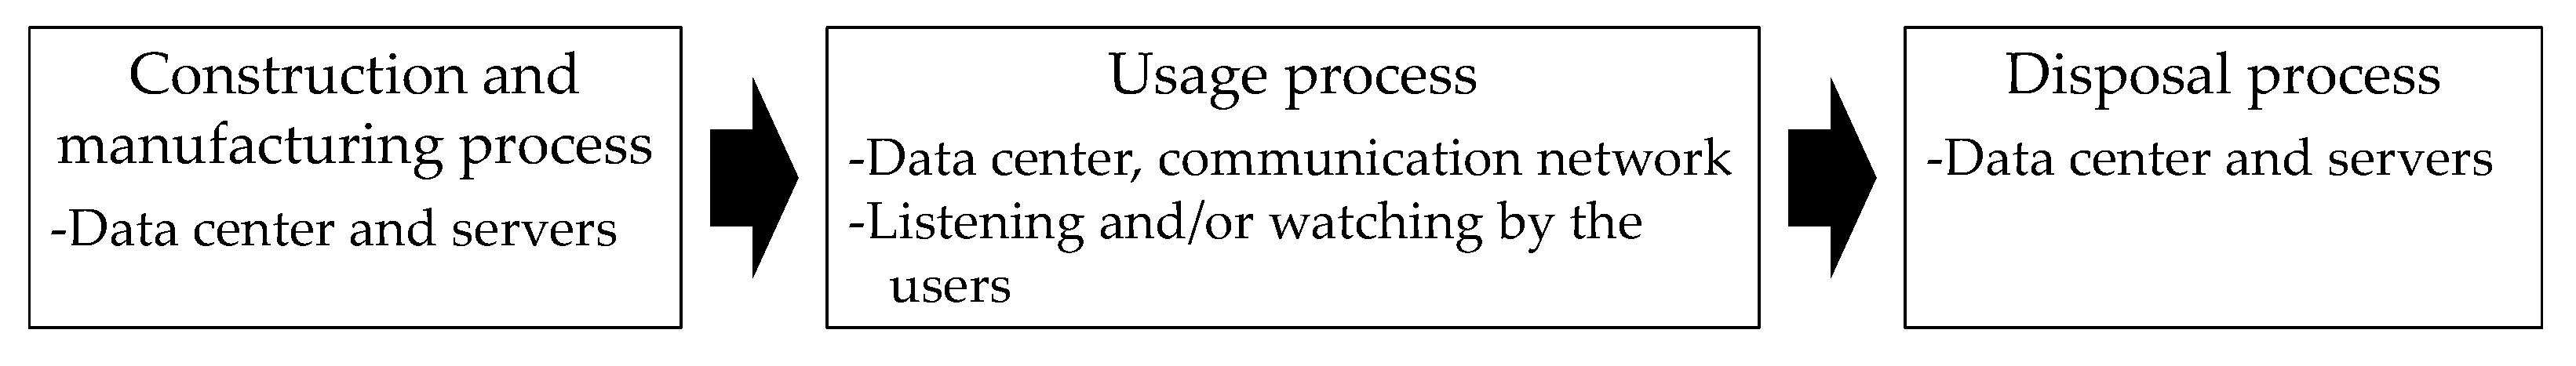
2.3.1. Construction and Manufacturing Process

Table 1 shows the data utilized during the construction and manufacturing processes. CO2 emissions derived from the construction of the data centers were calculated by multiplying the construction cost by CO2 emission intensity, which was subsequently divided by the legally decided service lifetime to obtain CO2 emissions per year. CO2 emissions derived from server manufacturing were calculated by multiplying the weight of the server rack by CO2 emission intensity, which was subsequently divided by the legally decided service lifetime to obtain CO2 emissions per year. Results obtained from these calculations were divided by the average number of racks present in the data center and storage capacity to estimate CO2 emission per 1 MB of communication volume associated with the construction of the data center and manufacturing of the server.
To perform these calculations, necessary data were collected through literature and online surveys, shown in the tables. In this study, server racks were assumed to consist of 12 server units, with one server unit having 36 TB of storage based on the information of server manufactures and suppliers (Server Rack Sizes: Understanding the Differences. Available online: https://www.racksolutions.com/news/blog/server-rack-sizes/ (accessed on 18 April 2021)). Then, U size stands for rack unit, and 1 U equals 1.75 inches (44.45 mm). In this study, U size was set as 30 U, which represents 30 server units that are classified.

2.3.2. Usage Process

This process consisted of the usage of data center, communication networks, and listening and/or watching by the users.
(1)
Usage of data center
Table 2 shows the data utilized during data center usage. CO2 emissions derived from the usage of the data center were calculated by multiplying the average total floor area of the data center with CO2 emission intensity. Afterwards, this estimation was divided by the average number of racks and storage capacity, as shown in Table 1, to obtain CO2 emissions per 1 MB of communication volume associated with the usage of the data center.
(2)
Usage of communication networks
For CO2 emissions derived from the usage of communication networks, the estimate (2.48 × 10⁻³ kg-CO2/MB) made by the Japanese Environmental Management Association for Industry [41] was used. However, this was calculated based on the data of 2003. However, CO2 emissions derived from the usage of the communication networks might be smaller due to the energy savings by the network equipment and expansion of data streaming volume. Therefore, using this result might overestimate the life cycle CO2 emissions. Thus, a regression analysis, with CO2 emissions and year as the explained and explanatory variables, respectively, was conducted based on the published results for CO2 emissions from 2000 to 2003. The created equation is as follows:
l n C O 2 = 1738.7 l n Y + 13212
where CO2: CO2 emissions derived from the usage of communication networks (kg-CO2/MB) and Y: year.
The correlation coefficient of the regression equation was 0.99. Therefore, this equation showed that the fit was good. CO2 emission intensity in 2019 was estimated using this equation.
(3)
Listening and/or watching through online streaming by the users
Table 3 shows the data utilized by the users for listening and/or watching through online streaming. CO2 emissions derived from this were calculated by multiplying the power consumption of the PCs or smartphones, annual usage time of video and/or music streaming, and CO2 emission intensity. The power consumption of the PCs was collected from kakaku.com [42], which listed the best-selling home appliances and power consumption of 30 popular desktops and laptops as of January 2021. Afterward, a median of 25% power consumption was integrated. The power consumption of the combination of desktops and laptops was calculated using the ratio of domestic shipments of desktops and laptops in 2020 [43]. In contrast to PCs, very little information is available on the power consumption by smartphones. Therefore, the data published by Smil [44] was adopted. CO2 emission per 1 MB of communication volume was calculated by multiplying CO2 emissions with the annual average usage time and communication volume per hour. The annual usage time and amount of communication volume related to listening and/or watching were calculated based on the report of ICT Research and Consulting Inc. [32] and streaming services, such as Apple Music and LINE Music.
The load on PCs and smartphones and power consumption changes depended on the task being performed, such as listening to music, watching videos, and/or multitasking. However, in this study, such changes in power consumption were not considered, because measuring power consumption for these is difficult.

2.3.3. Disposal Process

Table 4 shows the data utilized during the disposal process. CO2 emissions derived from the disposal of the data center and server were calculated by multiplying the construction cost of the data center and server weight, shown in Table 1, with CO2 emission intensity and legally decided service lifetime. CO2 emissions per 1 MB of communication volume were calculated using the average number of server racks in the data center and storage capacity.

2.3.4. Estimation of Life Cycle CO2 Emissions

The life cycle CO2 emissions per 1 MB of communication volume were calculated by adding CO2 emissions obtained for each process. This obtained value was multiplied by the number of subscribed and free users of music and video streaming to provide domestic CO2 emissions derived from online music and video streaming in 2019 ([32,34]). The future projection of CO2 emissions by 2025 was also estimated using the future projection of users obtained by conducting regression analysis on the past and present numbers of the users ([34,35]).

3. Results and Discussion

3.1. Life Cycle CO2 Emission per Communication Volume

Table 5 shows the results of CO2 emissions for each process. The results for listening and/or watching music and video streaming were displayed by classifying ICT equipment and type of streaming. The result revealed that when listening and/or watching music streaming from PCs had the biggest CO2 emission out of all the processes. In contrast, video streaming from smartphones had the least CO2 emission out of all the processes.
Table 6 shows the results of life cycle CO2 emissions. Each life cycle, CO2 emissions were calculated by adding the CO2 emissions of each piece of ICT equipment and type of streaming and other CO2 emission results. Comparison between ICT equipment showed that CO2 emissions from listening to music through online streaming from PCs was approximately 4.1 times higher than that from smartphones. Although CO2 emissions from PCs were also high for video streaming, the difference was only 1.1 to 1.2 times. This was because of the significantly large communication volume (see Table 3) of videos compared to music. Thus, CO2 emissions derived from watching videos through online streaming was relatively small compared to 1 MB of communication volume.
In this study, the median power consumption of PCs was considered. When the power consumptions of 25 and 74 percentiles were considered, CO2 emissions for music streaming varied from 23% to 66%. For video streaming, the variation was from 3% to 9% and 6% to 16% for subscribed and free users, respectively.

3.2. CO2 Emissions Derived from Japanese Music and Videos Streaming in 2019

Based on the above-mentioned results, another estimation revealed that CO2 emissions from online music and video streaming in 2019 was approximately 922 thousand t-CO2. The ratio of the CO2 emissions of videos and music accounted for 87.7% and 12.3%, respectively.
The validity of this result was confirmed in this study. CO2 emissions from domestic commercial power generation in 2019 were 432 million t-CO2, with the above result corresponding to 0.23% of this estimate [46]. According to the Center for Low Carbon Social Strategy of the Japanese Science and Technology Agency [6], the domestic power consumption for the data centers is equivalent to 1% of the annual domestic power consumption. Furthermore, business and consumer usages accounted for 18% and 82%, respectively, of global traffic in 2017 [47]. Online music and video streaming accounted for 32.1% of the domestic digital content market in 2018 [48]. Based on this information, 82% of communication volume used in the domestic data centers was assumed to be consumer usage. The data traffic for consumer usage was also assumed to be mainly from digital content. Based on these assumptions, the domestic power consumption derived from online music and video streaming in the data centers was estimated to be 0.26%. Therefore, 0.23%, as the ratio of CO2 emissions, might be reasonable if approximately 93% of domestic CO2 emissions are derived from energy generation [46].

3.3. Future Projection of CO2 Emissions Derived from Japanese Music and Videos Streaming

Figure 2 shows the future of domestic CO2 emissions derived from online music and video streaming from 2019 to 2025. If the current trend continues until 2025, the number of users for online music streaming will increase from 21.60 million in 2019 to 32.54 million in 2025. Similarly, online video streaming users will increase from 65.96 million in 2019 to 106.62 million in 2025. As a result, CO2 emissions might reach up to 1545 thousand t-CO2 in 2025.
CO2 emissions associated with online music and video streaming may become non-negligible in future. Therefore, it is necessary to take measures to address CO2 emissions from online music and video streaming. OECD [49] defines Green ICT in the narrow sense as referring to ICTs with low environmental burdens, and using ICT as an enabler reduces environmental impacts across the economy outside of the ICT sector. The Green ICT activities include not only smart buildings and smart grids, but also teleworking, video conferencing, and e-commerce [50]. Higón et al. [5] indicate that the CO2 emissions and ICT index that consists of ICT development, ICT readiness, and ICT use and intensity leads to a U-shaped relationship. Based on such a claim, technology innovation and promoting Green ICTs in online music and videos streaming services requires the improvement of the energy efficiencies of ICT equipment. At the same time, education is necessary to the general public to give them the understanding necessary to make changes [51].

4. Conclusions

In this study, the CO2 emissions of Japanese online music and video streaming in 2019 were estimated using the LCA. The system boundary consisted of processes related to data center construction and server manufacturing, listening to and/or watching by the users, and data center and server disposal. Life cycle CO2 emission per 1 MB of communication volume was calculated in this study. In particular, it was found that ICT equipment, such as PCs and smartphones, was used for listening and/or watching music and/or videos, and different streaming types were used, such as subscription-based or free. Based on these scenarios, the life cycle CO2 emissions based on ICT equipment and type of streaming were estimated. It was found that listening and/or watching by the users resulted in the highest CO2 emissions among all the processes. Life cycle CO2 emissions from online music streaming through PCs and smartphones were 5.88 × 10⁻⁴ and 1.43 × 10⁻⁴ kg-CO2/MB, respectively. For online music streaming, CO2 emissions from PCs were approximately 4.1 times higher than those for smartphones. The overall CO2 emissions from Japanese online music and video streaming in 2019 were approximately 922 thousand t-CO2. The ratio of the CO2 emissions of music and videos accounted for 12.3% and 87.7%, respectively. The ratio of CO2 emissions from online music and video streaming to those from domestic energy generation was 0.21%. With an increase in users, CO2 emissions may increase to up to 1545 thousand t-CO2 in 2025.
Japan should actively engage in technological innovation, as it is an important aspect, and was included in Japan’s science and technology policy “Society 5.0”. Although its importance from an environmental perspective has been discussed, the results obtained in this study revealed that CO2 emissions should not be ignored. When promoting ICT, it is necessary to not only pursue convenience, but also simultaneously evaluate the environmental impacts. Røpke and Christensen [52] indicated that ICTs have great potential for reducing energy consumption, but this realization depends upon wider economic and political conditions. The national government should assess the ways to reduce environmental impact by promoting ICT. In addition, consumers should also be aware of not only the convenience associated with online music and video streaming, but also the associated environmental perspective. In future, efforts to reduce the environmental impacts derived from the ICTs should be examined using LCA.

Author Contributions

Conceptualization: T.T.; methodology: T.T. and T.Y.W.; validation: T.T.; formal analysis: T.T. and T.Y.W.; investigation: T.T.; resources: T.Y.W.; writing—original draft preparation: T.T.; writing—review and editing: T.T.; visualization: T.Y.W.; supervision: T.T.; project administration: T.T. All authors have read and agreed to the published version of the manuscript.

Funding

This research received no external funding.

Institutional Review Board Statement

Not applicable.

Informed Consent Statement

Not applicable.

Data Availability Statement

The data are obtained from [6,32,33,34,35,36,37,38,39,40,41,42,43,44,45].

Acknowledgments

This research did not receive any specific grant from funding agencies in the public, commercial, or not-for-profit sectors.

Conflicts of Interest

The authors declare no conflict of interest.

References

  1. The Paris Agreement. Available online: https://unfccc.int/process-and-meetings/the-paris-agreement/the-paris-agreement (accessed on 9 February 2021).
  2. SDGs Action Plan 2021. Available online: http://www.kantei.go.jp/jp/singi/sdgs/dai9/actionplan2021.pdf (accessed on 9 February 2021).
  3. Society 5.0. Available online: https://www8.cao.go.jp/cstp/english/society5_0/ (accessed on 9 February 2021).
  4. Bastida, L.; Cohen, J.J.; Kollmann, A.; Moya, A.; Reichl, J. Exploring the role of ICT on household behavioural energy efficiency to mitigate global warming. Renew. Sustain. Energy Rev. 2019, 103, 455–462. [Google Scholar] [CrossRef] [Green Version]
  5. Higón, D.A.; Gholami, R.; Shirazi, F. ICT and environmental sustainability: A global perspective. Telemat. Inform. 2017, 34, 85–95. [Google Scholar] [CrossRef]
  6. Impact of Progress of Information Society on Energy Consumption (Vol.1): Current Status and Future Prospects for Power Consumption of IT Equipment. Available online: https://www.jst.go.jp/lcs/pdf/fy2018-pp-15.pdf (accessed on 9 February 2021).
  7. World’s and Japanese Markets of Digital Contents. Available online: https://www.meti.go.jp/policy/mono_info_service/contents/downloadfiles/202002_contentsmarket.pdf (accessed on 9 February 2021).
  8. Kramers, K.; Höjer, M.; Lövehagen, N.; Wangel, J. Smart sustainable cities—Exploring ICT solutions for reduced energy use in cities. Environ. Model. Softw. 2014, 56, 52–62. [Google Scholar] [CrossRef]
  9. Strzelecka, A.; Ulanicki, B.; Koopb, S.; Koetsier, L.; van Leeuwen, K.; Elelman, R. Integrating Water, Waste, Energy, Transport and ICT Aspects into the Smart City Concept. Procedia Eng. 2017, 186, 609–616. [Google Scholar] [CrossRef]
  10. Oregi, X.; Roth, E.; Alsema, E.; van Ginkel, M.; Struik, D. Use of ICT Tools for Integration of Energy in Urban Planning Projects. Energy Procedia 2015, 83, 157–166. [Google Scholar] [CrossRef] [Green Version]
  11. Walzberg, J.; Dandres, T.; Merveille, N.; Cheriet, M.; Samson, R. Assessing behavioural change with agent-based life cycle assessment: Application to smart homes. Renew. Sustain. Energy Rev. 2019, 111, 365–376. [Google Scholar] [CrossRef]
  12. Walzberg, J.; Dandres, T.; Merveille, N.; Cheriet, M.; Samson, R. Accounting for fluctuating demand in the life cycle assessments of residential electricity consumption and demand-side management strategies. J. Clean. Prod. 2019, 240, 118251. [Google Scholar] [CrossRef]
  13. Pothitou, M.; Hanna, R.F.; Chalvatzis, K.J. ICT entertainment appliances’ impact on domestic electricity consumption. Renew. Sustain. Energy Rev. 2017, 69, 843–853. [Google Scholar] [CrossRef] [Green Version]
  14. Morán, A.J.; Profaizer, P.; Zapater, M.H.; Valdavida, M.A.; Bribián, I.Z. Information and Communications Technologies (ICTs) for energy efficiency in buildings: Review and analysis of results from EU pilot projects. Energy Build. 2016, 127, 128–137. [Google Scholar] [CrossRef] [Green Version]
  15. Baptista, P.C.; Azevedo, I.L.; Farias, T.L. ICT Solutions in Transportation Systems: Estimating the Benefits and Environmental Impacts in the Lisbon. Procedia Soc. Behav. Sci. 2012, 54, 716–725. [Google Scholar] [CrossRef] [Green Version]
  16. Shah, P.; Varghese, V.; Jana, A.; Mathew, T. Analysing the ride sharing behaviour in ICT based cab services: A case of Mumbai, India. Trans. Res. Procedia 2020, 48, 233–246. [Google Scholar] [CrossRef]
  17. Mouratidis, K.; Peters, S.; van Wee, B. Transportation technologies, sharing economy, and teleactivities: Implications for built environment and travel. Transport. Res. D Transp. Environ. 2021, 92, 102716. [Google Scholar] [CrossRef]
  18. Kiisler, A.; Solakivi, T.; Hilmola, O.-P. Supply Chain and ICT Issues of Estonia: Survey Findings. Procedia Comput. Sci. 2020, 176, 828–837. [Google Scholar] [CrossRef] [PubMed]
  19. O’Brien, W.; Aliabadi, F.Y. Does telecommuting save energy? A critical review of quantitative studies and their research methods. Energy Build. 2020, 225, 110298. [Google Scholar] [CrossRef]
  20. Guerin, T.F. Policies to minimise environmental and rebound effects from telework: A study for Australia. Environ. Innov. Soc. Transit. 2021, 39, 18–33. [Google Scholar] [CrossRef]
  21. Giovanis, E. The relationship between teleworking, traffic and air pollution. Atmos. Pollut. Res. 2018, 9, 1–14. [Google Scholar] [CrossRef] [Green Version]
  22. Louis-Philippe, P.V.C.; Jacquemotte, Q.E.; Hilty, L.M. Sources of variation in life cycle assessments of smartphones and tablet computers. Environ. Impact Assess. Rev. 2020, 84, 106416. [Google Scholar]
  23. Subramanian, K.; Yung, W.K.C. Life cycle assessment study of an integrated desktop device—Comparison of two information and communication technologies: Desktop computers versus all-in-ones. J. Clean. Prod. 2017, 156, 828–837. [Google Scholar] [CrossRef]
  24. Arushanyan, Y.; Ekener-Petersen, E.; Finnveden, G. Lessons learned—Review of LCAs for ICT products and services. Comput. Ind. 2014, 65, 211–234. [Google Scholar] [CrossRef]
  25. Matsuno, Y.; Genchi, Y.; Yagita, H.; Inaba, A.; Satake, K.; Mori, H.; Tomita, H. Reduction of Electricity Consumption and CO2 Emission by Introduction of Information Technology (IT). J. Jpn. Inst. Energy 2003, 82, 57–63. [Google Scholar] [CrossRef] [Green Version]
  26. Buonocore, C.E. Comparative Life Cycle Impact Assessment of Digital and Physical Streaming of Video Games in the United States. Master’s Thesis, Harvard Extension School, Cambridge, MA, USA, 2016; p. 116. [Google Scholar]
  27. Shehabi, A.; Walker, B.; Masanet, E. The energy and greenhouse-gas implications of internet video streaming in the United States. Environ. Res. Lett. 2014, 9, 054007. [Google Scholar] [CrossRef]
  28. Hochschorner, E.; Dán, G.; Moberg, Å. Carbon footprint of movie streaming via the internet: A Swedish case study. J. Clean. Prod. 2015, 87, 197–207. [Google Scholar] [CrossRef]
  29. Pohl, J.; Hilty, L.M.; Finkbeiner, M. How LCA contributes to the environmental assessment of higher order effects of ICT application: A review of different approaches. J. Clean. Prod. 2019, 219, 698–712. [Google Scholar] [CrossRef]
  30. Global Music Report: The Industry in 2019. Available online: https://gmr.ifpi.org/ (accessed on 9 February 2021).
  31. Music Streaming Sales Results in Japan. Available online: https://www.riaj.or.jp/f/data/annual/msdg_all.html (accessed on 9 February 2021).
  32. Survey on Sales Trend for Subscription Music Streaming in 2020. Available online: https://ictr.co.jp/report/20201113.html (accessed on 9 February 2021).
  33. Survey on Sales Trend for Subscription and Free Videos Streaming in 2019. Available online: http://jva-net.or.jp/report/annual_2020_5-27.pdf (accessed on 9 February 2021).
  34. Survey on Users’ Trend for Subscription and Free Videos Streaming Users in 2019. Available online: https://www.netratings.co.jp/news_release/2020/01/Newsrelease20200131.html (accessed on 9 February 2021).
  35. Survey on Users’ Trend for Subscription Videos Streaming Users in 2019. Available online: https://ictr.co.jp/report/20190222.html (accessed on 9 February 2021).
  36. Fuji Chimera Research Institute Inc. Data Center Business Market Research Overview 2019; Fuji Chimera Research Institute Inc.: Tokyo, Japan, 2019; Volume 1, 212p. [Google Scholar]
  37. List for Legally Decided Service Lifetime. Available online: https://www.tax.metro.tokyo.lg.jp/shisan/info/taiyo_nensu.html (accessed on 9 February 2021).
  38. Embodied Energy and Emission Intensity Data for Japan Using Input-Output Tables (3EID). Available online: http://www.cger.nies.go.jp/publications/report/d031/index.html (accessed on 9 February 2021).
  39. LCI Database “IDEA Version 2.3”. Available online: http://idea-lca.com/features/?lang=en (accessed on 9 February 2021).
  40. Tokyo Energy Saving Carte in FY2017. Available online: https://www.kankyo.metro.tokyo.lg.jp/climate/large_scale/data/karte.html (accessed on 9 February 2021).
  41. Report on Collection of Environmental Efficiency Cases and Calculation Standards for Information and Communication Technology (ICT) Services. Available online: https://lca-forum.org/environment/forum/past/pdf/21.pdf (accessed on 9 February 2021).
  42. kakaku.com. Available online: https://kakaku.com (accessed on 9 February 2021).
  43. Survey on Sales Trend for PCs. Available online: https://www.jeita.or.jp/japanese/stat/pc/ (accessed on 9 February 2021).
  44. Smil, V. Embodied energy: Mobile devices and cars. IEEE Spectrum 2016, 53, 26. [Google Scholar]
  45. CO2 Emission Intensity for Electric Power in Japan. Available online: https://ghg-santeikohyo.env.go.jp/calc (accessed on 9 February 2021).
  46. About GHG Inventories. Available online: https://www.nies.go.jp/gio/en/aboutghg/index.html (accessed on 9 February 2021).
  47. 2018 Information and Communication White Paper. Available online: https://www.soumu.go.jp/johotsusintokei/whitepaper/ja/r01/pdf/index.html (accessed on 9 February 2021).
  48. 2020 Information and Communication White Paper. Available online: https://www.soumu.go.jp/johotsusintokei/whitepaper/index.html (accessed on 9 February 2021).
  49. Towards Green ICT Strategies: Assessing Policies and Programmes on ICT and the Environment. Available online: https://www.oecd.org/digital/ieconomy/42825130.pdf (accessed on 18 April 2021).
  50. APT Report on Introduction to Green ICT Activities. Available online: https://www.apt.int/sites/default/files/Upload-files/ASTAP/Rept-1-Introduction%20to%20Green%20ICT%20Activities.pdf (accessed on 18 April 2021).
  51. Pattioson, C. ICT and Green Sustainability Research and Teaching. IFAC PapersOnLine 2017, 50, 12938–12943. [Google Scholar] [CrossRef]
  52. Røpke, I.; Christensen, T.H. Energy impacts of ICT—Insights from an everyday life perspective. Telemat. Inform. 2012, 29, 348–361. [Google Scholar] [CrossRef]
Figure 1. System boundary.
Applsci 11 03992 g001
Figure 2. Future projection of CO2 emission derived from music and videos streaming in Japan.
Applsci 11 03992 g002
Table 1. Utilized data for construction and manufacture process.
Item UnitSource
Data centerConstruction cost15.80 × 109JPY/facility[36]
Legally decided service lifetime50Years[37]
CO2 emission intensity for constructing data center0.30 × 10−3kg-CO2/JPY/facility[38]
Average quantity of server rack per data center1300units/facility[36]
ServersWeight of 30 U server rack121kg/unitsAdopted basing on information of servers manufactures and suppliers
Legally decided service lifetime4Years[37]
CO2 emission intensity for manufacturing servers143kg-CO2/kg/units[39]
Storage capacity per 1U36 × 106MB/UAdopted basing on information of servers manufactures and suppliers
U size per server rack30U/units
Storage capacity1080 × 106MB/units
Table 2. Utilized data for usage process: usage of data center.
Item UnitSource
Average total floor area of data center11,800m2/facility[36]
CO2 emission intensity of data center652kg-CO2/m2/facility[40]
Table 3. Utilized data for usage process: listening and/or watching streaming by users.
Item UnitSource
Power consumption of PCs (median)6.87 × 10²kWhAdopted based on information of PCs manufactures and suppliers
Power consumption of PCs (25% percentile)4.79 × 10²kWh
Power consumption of PCs (75% percentile)1.28 × 101kWh
Power consumption of smartphones4.57 × 104kWh[44]
CO2 emission intensity of electricity in 20194.70 × 101kg-CO2/kWh[45]
Annual average usage time: music streaming/subscription730hCalculated based on information of [32] and music and video streaming suppliers
Annual average usage time: music streaming/free100h
Annual average usage time: videos streaming/subscription124h
Annual average usage time: videos streaming/free100h
Communication volume: music streaming/subscription72MB/h
Communication volume: music streaming/free72MB/h
Communication volume: videos streaming/subscription1900MB/h
Communication volume: videos streaming free1000MB/h
Table 4. Utilized data for dispose process.
Item UnitSource
Data centerCO2 emission intensity for disposal341t-CO2/million JPY/facility[38]
ServersCO2 emission intensity for disposal1.03 × 10−7kg-CO2/kg/unit[39]
Table 5. CO2 emission of each process.
ProcessSub ProcessCO2 Emission
Construction and manufactureConstruction of data center and manufacture of servers4.09 × 106
UsageData center5.48 × 106
Communication network5.35 × 105
Listening and/or watching streaming by users
-PCs: music screaming/subscription and free4.49 × 104
-PCs: video streaming/subscription1.70 × 105
-PCs: video streaming/free3.23 × 105
-Smartphones: music screaming/subscription and free2.98 × 106
-Smartphones: video streaming/subscription1.13 × 107
-Smartphones: video streaming/free2.15 × 107
DisposeDispose of data center and servers7.68 × 105
Unit: kg-CO2/MB.
Table 6. Life cycle CO2 emission.
PCs: music screaming/subscription and free5.88 × 104
PCs: video streaming/subscription1.57 × 104
PCs: video streaming/free1.72 × 104
Smartphones: music screaming/subscription and free1.43 × 104
Smartphones: video streaming/subscription1.40 × 104
Smartphones: video streaming/free1.40 × 104
Unit: kg-CO2/MB.
Publisher’s Note: MDPI stays neutral with regard to jurisdictional claims in published maps and institutional affiliations.

