Article

Study of Atomic Hydrogen Concentration in Grain Boundaries of Polycrystalline Diamond Thin Films

by
Elida I. de Obaldía
1,2,3,*,
Jesus J. Alcantar-Peña
2,4,5,
Frederick P. Wittel
6,
Jean François Veyan
2,
Salvador Gallardo-Hernadez
7,
Yury Koudriavtsev
8,
Dainet Berman-Mendoza
4 and
Orlando Auciello
2,9,*
1
Facultad de Ciencias y Tecnología, Universidad Tecnológica de Panamá, Panama City 0819, Panama
2
Material Science and Engineering, University of Texas at Dallas, Richardson, TX 75080, USA
3
Centro de Estudios Multidisciplinarios en Ciencias, Ingeniería y Tecnología-AIP (CEMCIT-AIP), Panama City 0819, Panama
4
Departamento de Investigación en Física, Universidad de Sonora, Rosales y Luis Encinas, Hermosillo 83000, Mexico
5
Gerencia de Microtecnologías, Centro de Ingeniería y Desarrollo Industrial (CIDESI), Av. Playa Pie de la Cuesta No. 702, Desarrollo San Pablo, Santiago de Querétaro 76125, Mexico
6
School of Engineering, Mathematics, Science and Technology, Dallas College, Dallas, TX 75243, USA
7
Departamento de Física, CINVESTAV-IPN, Mexico City 07360, Mexico
8
Electrical Engineering, CINVESTAV-IPN, Mexico City 07360, Mexico
9
Bioengineering, University of Texas at Dallas, Richardson, TX 75080, USA
*
Authors to whom correspondence should be addressed.
Appl. Sci. 2021, 11(9), 3990; https://doi.org/10.3390/app11093990
Submission received: 16 March 2021 / Revised: 10 April 2021 / Accepted: 20 April 2021 / Published: 28 April 2021

Abstract

:
This paper describes research focused on investigating the effect of hydrogen (H) atom insertion into the grain boundaries of polycrystalline diamond (PCD) films. This is required in order to understand the key morphological, chemical, physical, and electronic properties of the films. The PCD films were grown using the hot filament chemical vapor deposition (HFCVD) process, with flowing Ar gas mixed with CH4 and H2 gases to control film growth into microcrystalline diamond (MCD, 0.5–3 µm grain sizes), nanocrystalline diamond (NCD, 10–500 nm grain sizes), and ultrananocrystalline diamond (UNCD, 2–5 nm grain sizes) films depending on the Ar/CH4/H2 flow ratios. This study focused on measuring the H atom concentration of the PCD films to determine the effect on the properties indicated above. A simple model is presented, including a hypothesis that the two dangling bonds per unit cell of C atoms serve as the site of hydrogen incorporation. This correlates well with the observed concentration of H atoms in the films. Dangling bonds which are not passivated by hydrogen are postulated to form surface structures which include C double bonds. The Raman peak from these surface structures are the same as observed for transpolyacetyline (TPA). The data reveal that the concentration of H atoms at the grain boundaries is around 1.5 × 10¹⁵ atoms/cm2 regardless of grain size. Electrical current measurements, using a conductive atomic force microscopy (CAFM) technique, were performed using an MCD film, showing that the current is concentrated at the grain boundaries. Ultraviolet photo electron spectroscopy (UPS) confirmed that all the PCD films exhibited a metallic behavior. This is to be expected if the nature of grain boundaries is the same regardless of grain size.

Graphical Abstract

1. Introduction

Understanding the mechanical, tribological, and electrical properties of polycrystalline diamond (PCD) films requires an understanding of the material’s grain boundaries. In this study we used a variety of analytical techniques to investigate the hypothesis that the nature of the grain boundaries is the same and that the variation between polycrystalline films stem from the difference in the amount of grain boundary present.
PCD films, ranging from ultrananocrystalline diamond (UNCD) films (2–5 nm grain sizes) to microcrystalline diamond (MCD) films (0.5 to >1 μm grain size), have been shown to have important technological applications [1,2]. Systematic studies involving varying ratios of Ar and H2 gas flow in standard cubic centimeters per minute (sccm) during the growth of PCD films were performed for both hot filament chemical vapor deposition (HFCVD) as well as microwave plasma chemical vapor deposition (MPCVD) (for example, see references [3,4,5] and [1,6,7,8,9], respectively). These studies were performed to understand the role of gas composition during PCD film growth in the insertion of H atoms into the PCD films and their effect on electrical properties [10] and mechanical properties [6,11].
The relationship between the H2 gas concentration during PCD film growth and the actual concentration of H atoms incorporated in the films has been characterized using Raman spectroscopy and Fourier-transform infrared spectroscopy (FTIR) as tools to extract qualitative information about H atom concentration on the formation of C–H chemical bonds [8,12]. To provide more quantitative data, additional analysis techniques have been used, namely, secondary ion mass spectrometry (SIMS) [13], elastic recoil detection analysis (ERDA) [14], and nuclear reaction analysis (NRA) [15,16].
These investigations have determined that H is incorporated into the grain boundaries and there is an indirect relationship between the grain size and the H concentration. There is also a wide acceptance that the H is responsible for the Raman spectra associated with C–H bonding.
The aim of this work was to extend these findings over a large range of crystal sizes and to test the ability of a simple geometrical model to explain the observed hydrogen incorporation and Raman spectra.

2. Materials and Methods

Table 1 shows the different parameters used to grow PCD films on silicon (Si) substrates using the HFCVD process described in the literature [5,17]. All substrate surfaces were seeded with 5–10 nm diamond particles from Blueseeds (Adams Nano, Raleigh, NC< USA 27617) using the standard ultrasonication process described in several publications [1,2,5,6,9]. For the first 4 films, the film growth time was kept constant at 2 h, the filament–substrate surface distance was kept at 20 mm, the filament temperature was retained at 2300 °C, and the total pressure during film growth was 10 Torr. The remaining 3 PCD films were grown using the same gas mixture but varying the growth time. The temperature of the substrate surface during film growth was determined using a calibration curve based on thermocouple measurements between a thermocouple in the substrate holder and thermocouples pasted on the surface of a Si substrate.
To be able to vary the grain size, two procedures were used: (1) PCD films grown with constant total flow of 102 sccm, varying the H2:Ar flow rate from 10:90 to 75:25, and (2). PCD films grown with the same H2:CH4 flow (no Ar flow) but with increased film growth time. The CH4 gas flow was kept constant at 2 sccm, while changing the H2:Ar flow ratios (10:90, 25:75, 50:50, and 75:25 sccm, respectively). The PCD films grown under the conditions described above are marked in this paper as A, B, C, and D, respectively. In addition, 3 other films were grown using a high H2:CH4:Ar flow ratio (200 H2/3 CH4/0 Ar sccm), varying the film growth times to 2, 4, and 8 h. These samples are marked as E, F, and G, respectively. The parameters described in Table 1 were used in order to increase the grain size from UNCD (2–5 nm) to MCD (≥1 µm) based on prior research [18,19]. The films were cooled in a hydrogen atmosphere via flowing H2 gas into the chamber. No other surface treatment was performed on these samples.
The type of carbon chemical bonding in the films was analyzed via visible Raman spectroscopy using a Thermo DXR Raman spectrometer (Thermo Fisher Scientific, Waltham, MA, USA 02451) with a 532 nm wavelength laser beam. The deconvolution of the peaks was done using the program Fityk (https://fityk.nieto.pl/ (accessed on 14 March 2021)). The morphology, grain size, and thickness of the PCD films were characterized using scanning electron microscopy (SEM, ZEISS SUPRA-40, Zeiss Corporation, Oberkochen, Germany). The grain size was determined using Digital Micrograph software from the Gatan Microscopy Suite (GMS-3, Pleasanton, CA, USA 94588). After uploading the high-resolution SEM image and adjusting the contrast to determine the grain boundaries, the software processed the image to determine the mean size and standard deviation of the grain in the specified area. XRD patterns were obtained with a Rigaku Ultima III X-ray diffractometer (Rigaku, Tokyo, Japan) using the CuKα radiation (λ = 1.5406 Å) and an angular region of 2θ = 10–100° with step-scanning of 0.05°. The grain sizes for samples A and B were calculated from the XRD analysis using the Scherrer equation. The hydrogen concentration distribution in the films was studied using the secondary ion mass spectrometry (SIMS) TOF-SIMS-5 secondary ion mass spectrometer from ION-TOF GmbH (ionTOF Corp., Heisenbergstrade, Germany).
The electrical conductivity through the grain boundaries and film surface potential were characterized using an atomic force microscope operated in conductive (CAFM) and Kelvin probe modes (KPFM). The average surface potential was measured using a Kelvin probe system (KP Technology system, Beavercreek, OH, USA 45431).
UPS analysis was performed using a Versa Probe II (VPII) XPS apparatus from Physical Electronics, Chanhassen, MN, USA 55317, at a base pressure of 4 × 10⁻⁸ Pa, equipped with an He(I) source of 20.2 eV. The takeoff angle was set to 90°. The data were recorded with a pass energy of 1.175 eV, and the pressure in the chamber during UPS operation was kept at 6 × 10⁻² mbar. The samples were vertically aligned using the XPS mode. Surface cleaning was performed prior to the measurements in an area of 1 µm2 using Ar+ at 3 KeV. There was no charge accumulation on the surface of the samples.

3. Results and Discussion

This section is divided in two parts regarding (1) the chemical and structural characterization of the films, and (2) their electrical characteristics.

3.1. Characterization of Morphology and Chemical States of Polycrystalline Diamond Films
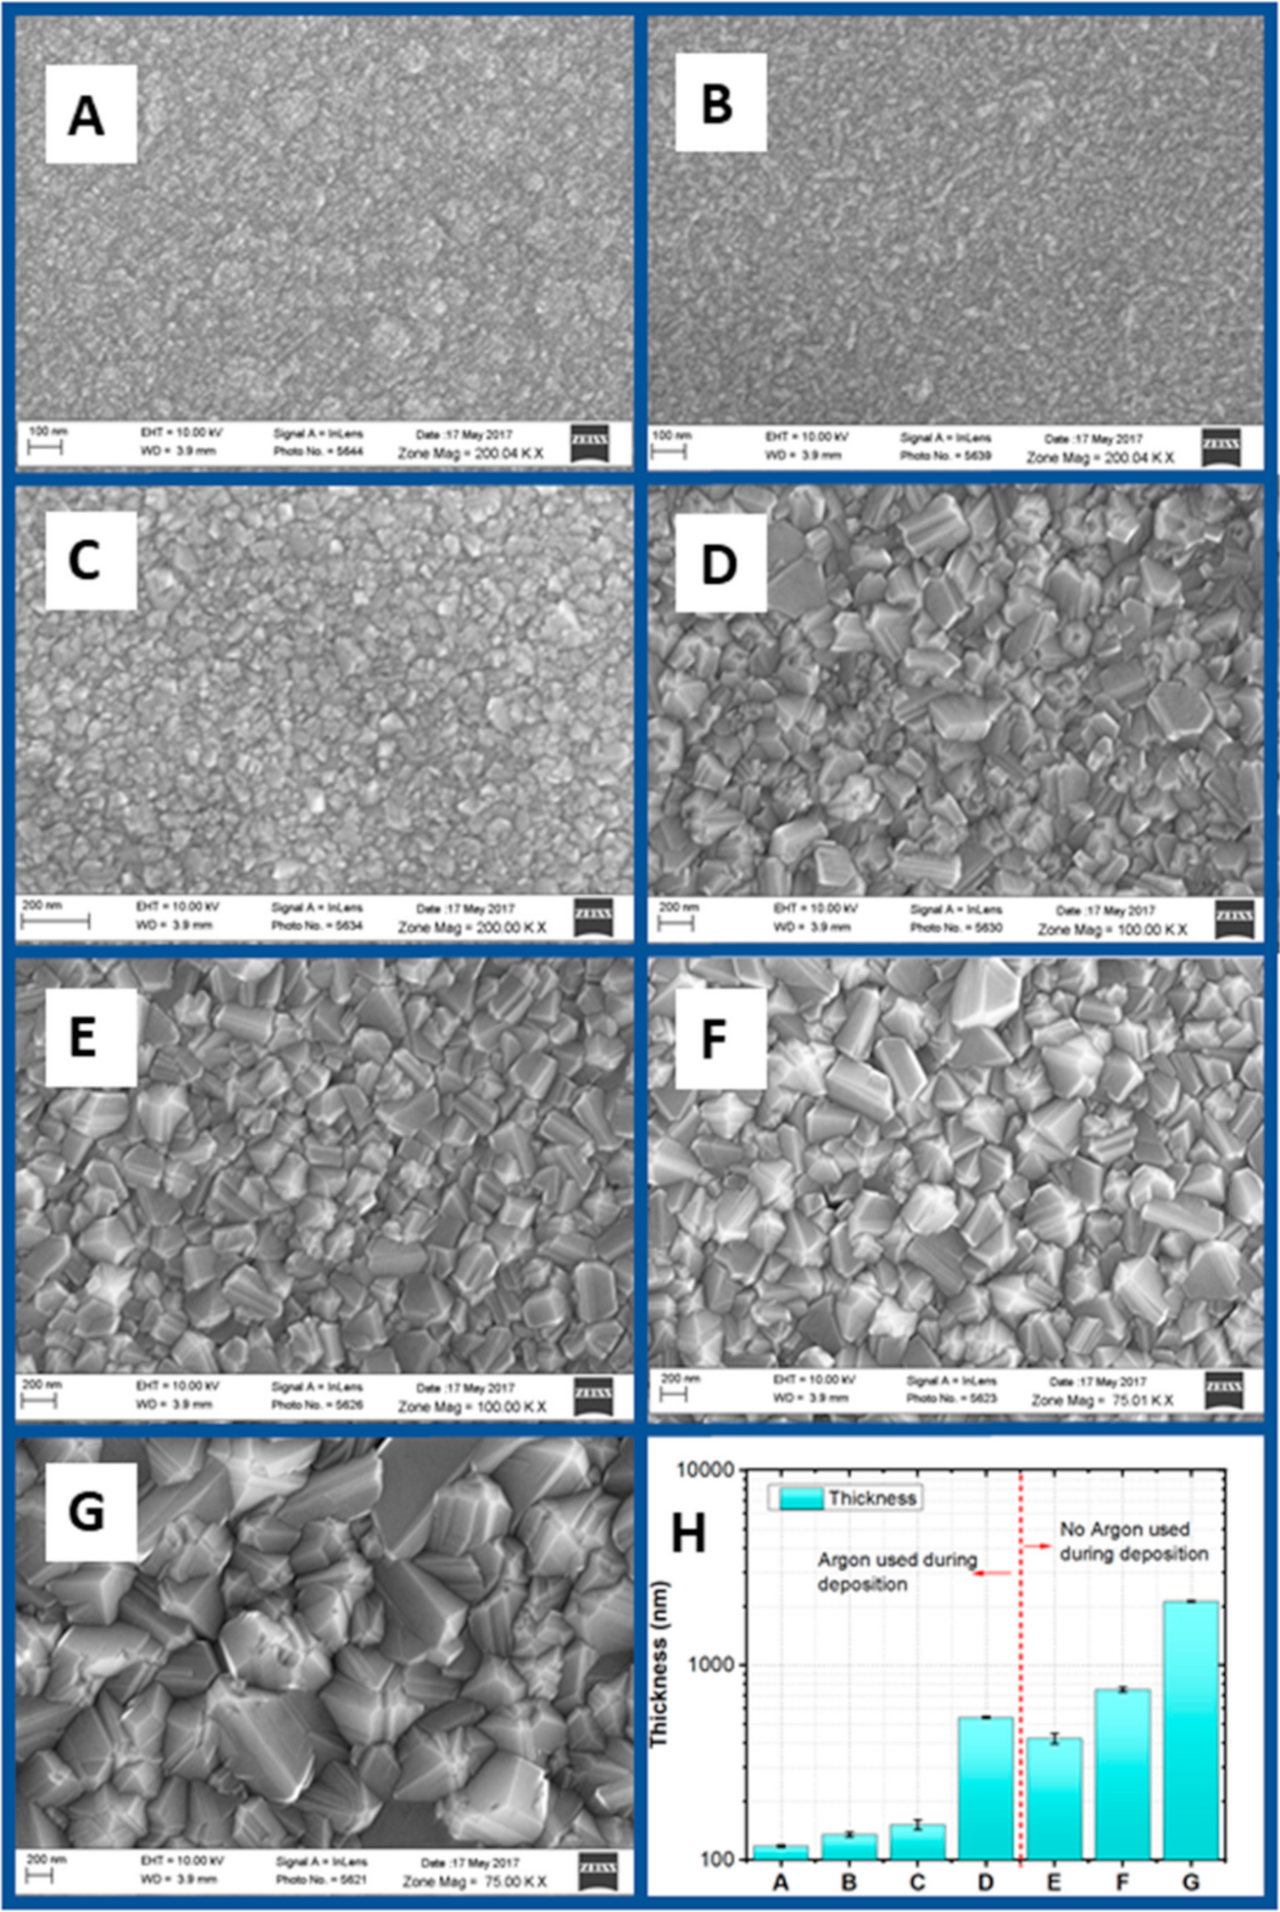
3.1.1. SEM Analysis

The different gas mixtures and deposition times described in Table 1 achieved the desired results of producing PCD films with different grain sizes, as shown in Figure 1A–G. These results demonstrate, as described in previous references, the sensitivity of the partial pressure of the gases and the time of deposition on the morphology of the PDC films. The SEM images were used to directly measure the grain size for samples C–G (greater than 20 nm).
SEM images in Figure 1A,B show the surface texture typical of UNCD, which tends to grow in crystal clusters. Figure 1C shows a typical NCD (Nano Crystalline Diamond) film where the grains are sufficiently large to be distinguishable with the SEM. Figure 1D–G are considered MCD films, and their structure and grain size can easily be studied with this technique.
The thickness of the PCD films was obtained using the direct measurement of the cross-section SEM of the PCD films. The data are plotted in Figure 1H. PCD films grown for the same length of time but with lower concentrations of argon resulted in thicker films and larger grains. PCD films grown with no argon and longer times also resulted in thicker films and larger grains, but in this case the thickness was directly proportional to the growth time. The relationship between the grain size and the thickness of the films was discussed in a prior article [5].

3.1.2. X-ray Diffraction (XRD) Analysis

XRD analysis was used to determine the presence of the diamond crystals in the PCD films as well as to determine the grain size (less than 20 nm) for samples A and B. Figure 2 shows results from X-ray diffraction (XRD) analysis of PCD films A to D (a) and E to G (b).
The XRD results from Figure 2 show a typical diffraction pattern [19] for PCD films with polycrystalline diamond growth. The broad peak around 2θ~55° is related to the substrate and growing conditions.
Table 2 shows the measured 2θ XRD diffraction angle for each of the allowed reflections for a faced centered cubic structure. The values for an unbounded single crystal diamond (SCD) are also shown in the table. The interplanar d-spacing for each Miller index was calculated using Braggs law (Equation (1)).
d   =   n   λ 2   s i n   θ
where λ = 1.5406 Å (Cu Kα radiation) is the X-ray wavelength, n = 1, and θ is the scattering angle.
It can be inferred from the table that the diamond crystal in the PCD is not strained due to the packing of the grains in the PCD films or due to the presence of defects. The difference in unit cell sizes does not exceed 0.3% of the expected value from an SCD.
The grain size was obtained for samples A and B from the peak (111), which is the only peak with sufficient resolution to calculate the FWHM. The FWHM was calculated using OriginPro 9.0 software and by applying the Scherrer equation (Equation (2)):
T = K   λ β   C o s   θ  
where K is a shape factor that varies from 0.89 to 0.94. Usually, the shape factor is set to 0.9 for particles of unknown size, λ is the X-ray wavelength, and β is the line broadening at half the maximum intensity (FWHM). The Scherrer equation is used to determine crystallite size (T) from XRD spectra for small particles where the FWHM is greater than the instrument limitations. After subtracting the instrumental line broadening in radians (also sometimes denoted as Δ(2θ)), we obtained a grain size of 5 nm for sample A and 7 nm for sample B. These values are within the range of previously measured grain sizes using high resolution transmission electron microscopy (HRTEM) for similar growth conditions. The variation in size for a particular sample is about 30%. The combined measurements for grain size are shown in Figure 3.

3.1.3. Secondary Ion Mass Spectrometry (SIMS) Analysis

Figure 4 shows two examples of the secondary ion mass spectrometry (SIMS) spectra from analyses of PCD films A and E, which have over an order of magnitude difference in grain size.
The SIMS measurements show that the C atom concentration, as a function of depth from the surface, is constant for all films around 1023 atoms/cm3 (Figure 4 red line), while the H atom concentration decreases as the grain size of the PCD films increases (see Figure 5, black lines). An increased H2 flow did not result in an increase in H incorporation in the sample. The availability of H during crystal growth was not a limiting factor, as evidenced by the insensitivity of H2 flow on H atom incorporation. The H atom concentration vs. grain size is plotted in Figure 5 (see left y-axis).
A simple order-of-magnitude calculation was performed assuming two dangling bonds per diamond unit cell (one per each C atom) on either side of the grain boundary, and a homogeneous grain size for each of the samples. The density of C atoms dangling bonds in the sample (D) was calculated using Formula (3) below:
D = s   N   b V = 6   l 2 V l 3 2 a 2 V = 12 l   a 2
where s is the surface area of a diamond single crystal, N is the number of crystals in a unit volume, b is the number of C atom dangling bonds per area, V is the volume of the sample (for example 1 cm3), l is the grain size, and a is the diamond lattice constant.
This simple function is plotted on the secondary axis of Figure 5 (solid line). The good alignment between the calculated density of the dangling bonds and the H atom concentration supports the hypothesis that H atoms are incorporated primarily into the grain boundaries rather than into the bulk of the diamond crystalline grains. The higher concentration of H atoms in UNCD vs. MCD films can be explained by the increased availability of C atom dangling bonds in the grain boundaries of UNCD films. The data and calculations presented in Figure 5 indicate that the available sites for H atom insertion in grain boundaries are dominated by geometrical features. C atom dangling bonds are passivated by the introduction of H atoms, suggesting that the surface of the crystalline diamond grains is the primary location of incorporation of H atoms.
The slope of the density of dangling bonds (sites/cm3) per grain size (Figure 5 solid line) is the surface concentration of dangling bonds, and it is calculated to be 1.56 × 10¹⁵ sites/cm2. Assuming that the nature of all grain boundaries, regardless of grain size, is similar, the concentration of H atoms per unit area should be the same. Calculations of the surface concentration of H atoms per unit area show that the values for all the PCD films in this study are between 1 × 10¹⁵ and 3 × 10¹⁵ atoms/cm2. Sample D (Figure 1D), which is the furthest from the line (Figure 5), has a very heterogeneous distribution of grain size, and the overestimation of grain size could account for higher-than-expected H concentration.

3.1.4. Raman Analysis

Figure 6 shows the Raman spectra for PCD films (samples A–D (a) and E–G (b)). The broad signal from 1100 to 1700 cm−1 is typical of PCD films excited with a visible laser light.
A graphical interpretation of the Raman spectra shows that the diamond film structure changes from a typical UNCD Raman shape (black and red curves in Figure 6a) [2,5,17,20,21] for the PCD film grown with 10 sccm of H2 flow, to the characteristic NCD (film D, blue curve in Figure 6a), and finally to MCD film (sample G in Table 1—purple curve in Figure 6b). This dependence of grain size on H2 flow has been well established by several different groups [12,13,14,16,22], but seldom done in a single experiment in a sequential approach. Figure 6b shows the Raman spectra for MCD films grown for 2, 4, and 8 h using the H2 (200 sccm):CH4 (3 sccm) gas mixture flow. Figure 6b shows the characteristic sharp diamond peak at 1332 cm−1 and the square-type peak (920–980 cm−1) representing the SiC [23] interface layer between the Si substrates and the MCD film. The SiC peak intensity decreases as the film thickness increases from 2 h to 8 h of growth.
The spectra can be deconvoluted into four contributions: G and D* bands associated with sp2 C atoms bonds located at 1380 and 1580 cm−1 and representing disordered and graphic carbon, respectively, and 2 trans-polyacetylene (TPA) vibrational bands (v1 and v2) which are typical of PCD material at 1140 and 1480 cm−1 [8,24]. All four of these bands are associated with the grain boundaries [25] The results of the deconvolution using a Lorentzian distribution are presented in Table 3.
The column (v1 + v2) is the area under peaks for v1 and v2 divided by the total area under all peaks. Similarly, the last column is the area under peaks D* and G divided by the total area. The information on the H atom contents in the grain boundaries is mainly related to the contribution of peaks v1 and v2 [20].
Figure 7 represents a drawing of the evolution of the Raman peaks as the grain size increases.
In the studied PCD films, the initial layers are composed of smaller diamond grains. The TPA bond excitations (v1 and v2) and sp2 bond excitations (D* and G) increase with the size of the grain boundary network, whereas the signal from sp3 diamond-bond excitations (D) increases with the amount of crystalline material. The data show that the thicker the PCD films are, the larger the diamond grains are, correlating with a stronger sp3 C-bonds signal characteristic of diamond. This effect is represented in Figure 7 with blue arrows and the red arrows. The absorption of the 532 nm incident laser light by sp2 C atom bonds and TPA-type bonds means that PCD films with smaller grains are less transparent due to the high concentration of grain boundaries that trap the light more efficiently. On the other hand, PCD films with large grains, smaller grain boundary networks, and a higher degree of sp3 diamond C-atoms bonds are more transparent.
It is expected that the contribution of v1 and v2 decreases with large grain sizes (Figure 7c purple arrow) since the H atom concentration decreases. The reduction in the TPA signal from NCD to UNCD (Figure 7 purple arrows from (b) to (a)) and the fact that H2 flow is lower during the growth of UNCD may suggest that there are not enough H atoms to saturate all the dangling bonds in the diamond crystals. This will make the C=C more common at the surface of the diamond grain and with the adjacent diamond grain. The initial UNCD growth forms hemispherical structures which then merge into a continuous film. The large presence of D* and G for UNCD could be due to filling between the cluster of crystals (up to ~1 µm) that is typical in UNCD film growth [12,26].
Interestingly, the signal from the silicon carbide nucleation layer on the Si substrate (white arrows) was higher for PCD films with intermediate thickness (Figure 7b) than for either much thinner PCD (Figure 7a) or thicker PCD films (Figure 7c). The hypothesis is that for the UNCD film-type samples the high degree of absorption prevented penetration into the SiC nucleation layer. For the thick PCD films, correlating with MCD, the signal corresponding to SiC was reduced simply due to the depth of the SiC layer from the surface of the PCD film.
Using the diagram as a representation of the grain growth, all samples started with smaller grains at the nucleation site. The SIMS data (Figure 4b) show a decrease in H atom concentration going from the substrate to the surface. The smaller crystals, especially near the substrate, have a greater grain boundary surface area and thus a higher H atom concentration. This effect is consistent with the proposed model, which attributes the H incorporation primarily to the passivation of dangling C bonds at the grain boundaries.

3.2. Atomic Force Microscopy-Based Characterization of Surface Structure and Associated Electrical Performance of PCD Films

3.2.1. Conductive Atomic Force Microscopy (CAFM) Measurements of Electrical Conduction through PCD Films

Figure 8 shows AFM measurements of electrical conduction through the PCD films using the CAFM mode to measure electrical conduction through an MCD film (sample F in Table 1).
This sample was used for this analysis because the gold-coated silicon AFM tip radius (~50 nm) is much smaller than the grain size (400 nm) of the MCD film grown for 4 h, thus enabling the differentiation of the electrical conduction between grains and grain boundaries. Figure 8A shows the topography mapping from an area of 1 × 1 µm2, in which enough grains were detected to observe the peaks and valleys. Figure 8B shows the electrical current mapping from the same area mapped in Figure 8A. The white areas observed in Figure 8B represent the maximum current flow (1 × 10⁻⁸ A), while the dark areas represent the minimum current flow (1 × 10⁻¹² A) while applying a potential from −2 V to +2 V. A comparison of Figure 8A,B indicates that areas where the maximum current flow was measured correspond to those areas where the grain boundaries are. Figure 8C shows curves I-V obtained from the spots indicated in Figure 8A. For the spots numbered 4, 5, and 8, for which the AFM tip was located over the grain boundaries, an ohmic response was observed as compared to measurements on spots 1, 2, 3, 6, and 7, on top of grains, for which a minimum current flow was detected.
These measurements indicate that the current flows mainly through grain boundaries. In order to confirm the hypothesis on electrical conduction through grain boundaries in the MCD films studied here, different voltages were applied on top of a diamond grain until an electronic current was observed. Figure 8D shows curves I-V for the different voltages applied on spot 3 (−1.5 to +1.5 and −3 to +3 V) for which the current was very small. On the other hand, when applying a voltage of around 5 to 5.5 V on spot 3, a small electronic current signal was detected, which increased rapidly at about +8 V, indicating that the electric field extending across the surface of the grains was reaching the grain boundaries to extract electrons much more efficiently.
AFM-KPFM current measurements showed that the interior of the grains does not conduct electronic charges, but the grain boundaries do. The electrical current of the grain boundary has a value of 1 × 10⁻⁸ A, which is about four orders of magnitude smaller than the current which would be expected if all the electrons in the dangling bond were free electrons.

3.2.2. UPS Analysis of PCD Films

As was shown in the previous section, there is conduction in the grain boundary even though the current flow is small. Since all the grains are interconnected, there should be some form of metallic behavior. UPS measurements can show the density of states (DoS) at the Fermi level if the material is metallic. The work function (Φ) can be inferred from the measurements if a sufficient DC offset is placed at the stage to differentiate the cutoff energy at which electrons are accelerated to the vacuum or extracted from the material.
Figure 9a shows the band structure of the PCD films as obtained from UPS measurements. The reference value of 21.2 eV is the energy of the He(I) photon incident on the samples. Since the reference UV energy is close to the cutoff of the instrument, 9.25 V were applied between the holder and ground to offset the measurement and better determine the cutoff energy of the PCD films. The work function was then calculated by subtracting the cutoff energy from the incident UV energy. For He(I), the cutoff is fairly broad, which resulted in an approximate value of the Φ.
Figure 9b is a closeup of the DoS around the EF. All the samples show the presence of electrons from the valance band to the Fermi level, which characterizes the metallic behavior. The binding energy (BE) can be calculated by extending the signal of the valance band to the intercept and subtracting the EF (0 V). See insert in Figure 9b.
All the Φ measurements are between 4.5 and 5.5 eV, which are in the range of reported MCD values [27] and in the range of the metal Φ measurements [28]. The Φ is not a localized measurement but rather an average measurement of a larger area, and the UPS technique using He(I) does not yield a precise measurement of Φ. However, the point here is to show that all the samples, regardless of grain size, have characteristic metallic behavior. This point further emphasizes the suggestion that the nature of the grain boundary is the same where the diamond surface bonds are either passivated with H atoms or form a C=C bond from the same crystal or the adjacent crystal. The calculation of the binding energy BE, as shown in Figure 9b, is a guide to determine whether there is difference in the depth of the valance band for PCD films with higher grain boundary concentrations. There seems to be a trend, as BE decreases with smaller grain size (Table 4). Sample D does not follow the trend, probably because of the grain size overestimation, as previously discussed. This trend supports the argument that the higher concentration of grain boundaries contributes to the availability of conduction electrons. More careful measurements need to be taken.

4. Conclusions

The research described in this paper shows that the hydrogenation of the grain boundaries of PCD films is directly related to the density of dangling bonds per unit volume. The H atom concentration measured by SIMS was in accordance with the calculated dangling bonds available in the grain boundaries. The simplifying assumptions are that there are two dangling bonds per unit cell at the grain boundary, and the PCD films are homogenous (same grain size throughout the film), providing a first approximation regarding the makeup of the grain boundaries. The surface concentration of the dangling bonds was calculated to be 1.56 × 10¹⁵ sites/cm2. The hypothesis to explain the results is that the surface of the diamond crystalline grains forms either a C–H bond or C=C bond The C=C bond is formed between two non passivated C atoms within the same crystalline grain at the boundary or between two adjacent crystallites at the boundary. The combination of the C–H and C=C bonded atoms at the grain boundaries, randomly located, could produce the characteristic Raman spectrum. (There is no room for strands of TPA molecules to be present in the interface). From the model presented, it is expected that the UNCD films would have a larger concentration of v1 and v2 signals. However, UNCD growth complexity allows for the formation of disordered and graphitic carbon between the cluster growths, represented as D* and G peaks in the Raman spectrum. This effect will have to be further investigated with HRTEM. The grain boundary nature (or make up), regardless of grain size is similar for all PCD films in the studies. Electrical measurements in an MCD film showed that the grain boundaries are conductive. Conductive atomic force microscopy (CAFM) measurements showed that electrical conduction through PCD films is mainly controlled by the grain boundaries, most probably due to electron insertion into the gran boundaries via H atom bonding to dangling bonds of C atoms, resulting in the release of electrons. UPS measurements showed that the work function for the electrons in the PCD films is independent of grain size, reinforcing the idea that the makeup of the grain boundaries is the same for all PCD films.

Author Contributions

Conceptualization, E.I.d.O. and J.J.A.-P.; methodology, E.I.d.O., J.J.A.-P., F.P.W., J.F.V., S.G.-H. and Y.K.; formal analysis, E.I.d.O., J.J.A.-P., F.P.W. and O.A.; investigation, E.I.d.O., J.J.A.-P. and S.G.-H.; data curation, E.I.d.O., J.J.A.-P. and J.F.V.; writing—original draft preparation, E.I.d.O., J.J.A.-P. and F.P.W.; writing—review and editing, S.G.-H., D.B.-M. and O.A.; supervision, Y.K., D.B.-M. and O.A.; funding acquisition, E.I.d.O., J.J.A.-P., D.B.-M. and O.A. All authors have read and agreed to the published version of the manuscript.

Funding

This research was funded by the Consejo Nacional de Ciencia y Tecnología-México (CONACYT) and the Secretaría Nacional de Ciencia y Tecnología-Panamá (SENACYT).

Institutional Review Board Statement

Not applicable.

Informed Consent Statement

Not applicable.

Data Availability Statement

Not applicable.

Acknowledgments

O.A. acknowledges support from the University of Texas at Dallas through his Distinguished Endowed Chair Professor position. This research was made possible in part thanks to the support of the Sistema Nacional de Investigación (SNI) of SENACYT, Panama, awarded to Elida de Obaldia, and the Vicerrectoria de Investigación Postgrado y Extensión de la Universidad Tecnológica de Panamá. Jesus Alcantar acknowledges the support of CONACYT-FORDECyT through the project FORDECYT-297497.

Conflicts of Interest

The authors declare no conflict of interest.

References

  1. Auciello, O.; Sumant, A.V. Status review of the science and technology of ultrananocrystalline diamond (UNCDTM) films and application to multifunctional devices. Diam. Relat. Mater. 2010, 19, 699–718. [Google Scholar] [CrossRef]
  2. Williams, O.A. Nanocrystalline diamond. Diam. Relat. Mater. 2011, 20, 621–640. [Google Scholar] [CrossRef]
  3. Banaszak-Piechowska, A.; Malinowski, P. Raman studies of amorphous carbon phase in diamond films grown by hot-filament CVD. Solid State Phenom. 2015, 237, 263–267. [Google Scholar] [CrossRef]
  4. Kulisch, W.; Petkov, C.; Petkov, E.; Popov, C.; Gibson, P.N.; Veres, M.; Merz, R.; Merz, B.; Reithmaier, J.P. Low temperature growth of nanocrystalline and ultrananocrystalline diamond films: A comparison. Phys. Status Solidi Appl. Mater. Sci. 2012, 209, 1664–1674. [Google Scholar] [CrossRef]
  5. Fuentes-Fernandez, E.M.; Alcantar-Peña, J.J.; Lee, G.; Boulom, A.; Phan, H.; Smith, B.; Nguyen, T.; Sahoo, S.; Ruiz-Zepeda, F.; Arellano-Jimenez, M.J.; et al. Synthesis and characterization of microcrystalline diamond to ultrananocrystalline diamond fi lms via hot filament chemical vapor deposition for scaling to large area applications. Thin Solid Films 2016, 603, 62–68. [Google Scholar] [CrossRef] [Green Version]
  6. Liu, J.; Hei, L.F.; Chen, G.C.; Li, C.M.; Song, J.H.; Lu, F.X. Mechanical properties of ultrananocrystalline diamond films modified by hydrogen concentration in deposition atmosphere. Surf. Coat. Technol. 2013, 236, 8–12. [Google Scholar] [CrossRef]
  7. Sankaran, K.J.; Joseph, P.T.; Chen, H.C.; Tai, N.H.; Lin, I.N. Investigation in the role of hydrogen on the properties of diamond films grown using Ar/H2/CH4 microwave plasma. Diam. Relat. Mater. 2011, 20, 232–237. [Google Scholar] [CrossRef]
  8. Lin, I.N.; Chen, H.C.; Wang, C.S.; Lee, Y.R.; Lee, C.Y. Nanocrystalline diamond microstructures from Ar/H2/CH4-plasma chemical vapour deposition. CrystEngComm 2011, 13, 6082–6089. [Google Scholar] [CrossRef]
  9. Zhou, D.; Gruen, D.M.; Qin, L.C.; McCauley, T.G.; Krauss, A.R. Control of diamond film microstructure by Ar additions to CH4/H2 microwave plasmas. J. Appl. Phys. 1998, 84, 1981–1989. [Google Scholar] [CrossRef] [Green Version]
  10. Gan, L.; Baskin, E.; Saguy, C.; Kalish, R. Quantization of 2D hole gas in conductive hydrogenated diamond surfaces observed by electron field emission. Phys. Rev. Lett. 2006, 96, 2–5. [Google Scholar] [CrossRef]
  11. Auciello, O.; Aslam, D.M. Review on advances in microcrystalline, nanocrystalline and ultrananocrystalline diamond films-based micro/nano-electromechanical systems technologies. J. Mater. Sci. 2020. [Google Scholar] [CrossRef]
  12. Kulisch, W.; Popov, C.; Sasaki, T.; Sirghi, L.; Rauscher, H.; Rossi, F.; Reithmaier, J.P. On the development of the morphology of ultrananocrystalline diamond films. Phys. Stat. Solidi Appl. Mater. Sci. 2011, 208, 70–80. [Google Scholar] [CrossRef]
  13. Michaelson, S.; Lifshitz, Y.; Ternyak, O.; Akhvlediani, R.; Hoffman, A. Hydrogen incorporation in diamond films. Diam. Relat. Mater. 2007, 16, 845–850. [Google Scholar] [CrossRef]
  14. Dawedeit, C.; Kucheyev, S.O.; Shin, S.J.; Willey, T.M.; Bagge-Hansen, M.; Braun, T.; Wang, Y.M.; El-Dasher, B.S.; Teslich, N.E.; Biener, M.M.; et al. Grain size dependent physical and chemical properties of thick CVD diamond films for high energy density physics experiments. Diam. Relat. Mater. 2013, 40, 75–81. [Google Scholar] [CrossRef]
  15. Kulisch, W.; Sasaki, T.; Rossi, F.; Popov, C.; Sippel, C.; Grambole, D. Hydrogen incorporation in ultrananocrystalline diamond/amorphous carbon films. Phys. Stat. Solidi Rapid Res. Lett. 2008, 2, 77–79. [Google Scholar] [CrossRef]
  16. Rakha, S.A.; Guojun, Y.; Jianqing, C. Correlation between diamond grain size and hydrogen incorporation in nanocrystalline diamond thin films. J. Exp. Nanosci. 2012, 7, 378–389. [Google Scholar] [CrossRef]
  17. Alcantar-Peña, J.J.; de Obaldia, E.; Montes-Gutierrez, J.; Kang, K.; Arellano-Jimenez, M.J.; Aguilar, J.E.; Suchy, G.P.; Berman-Mendoza, D.; Garcia, R.; Yacaman, M.J.; et al. Fundamentals towards large area synthesis of multifunctional Ultrananocrystalline Diamond fi LMS via large area hot fi lament chemical vapor deposition bias enhanced nucleation/bias enhanced growth for fabrication of broad range of multifunctional devices. Diam. Relat. Mater. 2017, 78, 1–11. [Google Scholar] [CrossRef]
  18. Alcantar-Peña, J.J.; Montes, J.; Arellano-Jimenez, M.J.; Aguilar, J.O.; Berman-Mendoza, D.; García, R.; Yacaman, M.J.; Auciello, O. Low temperature hot filament chemical vapor deposition of Ultrananocrystalline Diamond films with tunable sheet resistance for electronic power devices. Diam. Relat. Mater. 2016, 69, 207–213. [Google Scholar] [CrossRef] [Green Version]
  19. Alcantar-Peña, J.J.; de Obaldia, E.; Tirado, P.; Arellano-Jimenez, M.J.; Aguilar, J.E.; Veyan, J.F.; Yacaman, M.J.; Koudriavtsez, Y.; Auciello, O. Polycrystalline diamond films with tailored micro/nanostructure/doping for new large area film-based diamond electronics. Diam. Relat. Mater. 2019, 91, 261–271. [Google Scholar] [CrossRef]
  20. Pfeiffer, R.; Kuzmany, H.; Salk, N.; Günther, B. Evidence for trans-polyacetylene in nanocrystalline diamond films from H-D isotropic substitution experiments. Appl. Phys. Lett. 2003, 82, 4149–4150. [Google Scholar] [CrossRef]
  21. Montaño-Figueroa, A.G.; Alcantar-Peña, J.J.; Tirado, P.; Abraham, A.; de Obaldia, E.; Auciello, O. Tailoring of polycrystalline diamond surfaces from hydrophilic to superhydrophobic via synergistic chemical plus micro-structuring processes. Carbon N. Y. 2018, 139, 361–368. [Google Scholar] [CrossRef]
  22. Michaelson, S.; Ternyak, O.; Akhvlediani, R.; Williams, O.A.; Gruen, D.; Hoffman, A. Hydrogen concentration and bonding in nano-diamond films of varying grain sizes grown by different chemical vapor deposition methods. Phys. Status Solidi Appl. Mater. Sci. 2007, 204, 2860–2867. [Google Scholar] [CrossRef]
  23. Sasinková, V.; Huran, J.; Kleinová, A.; Boháček, P.; Arbet, J.; Sekáčova, M. Raman spectroscopy study of SiC thin films prepared by PECVD for solar cell working in hard environment. Reliab. Photovolt. Cells Modul. Compon. Syst. VIII 2015, 9563, 95630V. [Google Scholar] [CrossRef]
  24. Ferrari, A.C.; Robertson, J. Origin of the 1150 cm−1 Raman mode in nanocrystalline diamond. Phys. Rev. B Condens. Matter Mater. Phys. 2001, 63, 2–5. [Google Scholar] [CrossRef]
  25. Kulisch, W.; Popov, C.; Rauscher, H.; Rinke, M.; Veres, M. Investigation of the initial growth of ultrananocrystalline diamond films by multiwavelength Raman spectroscopy. Diam. Relat. Mater. 2011, 20, 1076–1080. [Google Scholar] [CrossRef]
  26. Villarreal, D.; Wittel, F.P.; Rajan, A.; Wittel, P.; Alcantar-Peña, J.; Auciello, O.; de Obaldia, E. Effect of nitrogen flow on the growth of nitrogen ultrananocrystalline diamond (N-UNCD) films on Si/SiO2/HfO2 substrate. In Proceedings of the 7th International Engineering Sciences and Technology Conference IESTEC 2019, Panama City, Panama, 9–11 October 2019; pp. 78–84. [Google Scholar] [CrossRef]
  27. Mackie, W.A.; Bell, A.E. Work function measurements of diamond film surfaces. In Proceedings of the IEEE International Vacuum Microelectronics Conference IVMC, Newport, RI, USA, 7–11 July 2003; pp. 350–354. [Google Scholar] [CrossRef]
  28. Michaelson, H.B. The work function of the elements and its periodicity. J. Appl. Phys. 1977, 48, 4729–4733. [Google Scholar] [CrossRef] [Green Version]
Figure 1. The morphology of the PCD films (AG in Table 1). (H) shows a plot of the grain size and the thickness of the films for samples A–G.
Applsci 11 03990 g001
Figure 2. X-ray diffraction (XRD) spectra from PCD films grown with different grain sizes. (a) Samples A–D grown for 2 h with different Ar:H gas mixtures. (b) Samples E–G grown with H (no Ar) gas flow for different deposition time (Table 1).
Applsci 11 03990 g002
Figure 3. Grain size for PCD films (samples A–G from Table 1). The grain sizes of PCD films A and B were determined using the XRD peaks, while for PCD films C to G the grain sizes were determine using SEM analysis.
Applsci 11 03990 g003
Figure 4. Spectra from SIMS analysis for PCD films with different grain sizes (A and E) show the C and H element distribution and content through the depth of the PCD films. The O and Si atoms from the SiO2 layer on the Si substrate are present at the substrate–film interface. (a) Sample A, UNCD, (b) Sample E, MCD.
Applsci 11 03990 g004
Figure 5. C and H atom concentration [H] vs. PCD film grain size, and number of dangling bonds per site. [H] data are extracted from Sims measurements. The solid line indicates the calculated density of dangling bonds assuming 2 C atom dangling bonds per unit cell per bulk sample volume.
Applsci 11 03990 g005
Figure 6. (a) Raman spectra from PCD films grown with H2:Ar:CH4 ratios of 10:90:2, 25:75:2, 50:50:2, and 75:25:2 sccm flow during film growth. (b) MCD films grown with H2 (200 sccm):CH4 (3 sccm) gas mixture flow for different growth times (the 2, 4, and 8 h samples correspond to E, F, G in Table 1). (The peaks are indicated by the excitation modes, where D* is the broad peak from disordered carbon and D is from crystal diamond).
Applsci 11 03990 g006
Figure 7. Schematic showing 532 nm wavelength laser beam interaction with (a) UNCD, (b) NCD, and (c) MCD films grown on Si substrates. For UNCD films the laser light is mostly absorbed by C atoms, with sp2 bonds making this signal the highest contribution. As the grain size increases and the film becomes more transparent to the visible laser, the H atoms settle in the grain boundary, increasing the v1 and v2 signals. For large grain sizes, there are fewer available sites for the H to settle, and v1, v2, and sp2 decrease, making the sp3 the dominant contribution.
Applsci 11 03990 g007
Figure 8. Conductive atomic force microscopy (CAFM) from MCD film grown for 4 h with 200 sccm H2 sccm CH4 gas flow (see Table 1). (A) AFM topography mapping from a 1 × 1 µm area. (B) Electrical current mapping. (C) Curves I-V from the spots indicated in (A). (D) Curves I-V for voltages in the range −10 V to +10 V, applied to spot 3 as shown in (A).
Applsci 11 03990 g008
Figure 9. UPS survey spectra using (a) a He(I) source for all samples A–G; and (b) high-resolution spectra around the Fermi level for sample G. The insert is a representation of the conduction and valance band relative to the Fermi level for a metal. BE is the binding energy.
Applsci 11 03990 g009
Table 1. Process parameters used for the growth of different PDC films on silicon (Si) substrates. Column 1 shows the cross-referenced name use for each condition.
Sample NameH2-CH4-Ar (sccm)Deposition Time (h)Filament-Substrate Distance (mm)Temperature (°C)
A10-2-90220550
B25-2-75220575
C50-2-50220600
D75-2-25220675
E200-3-0210725
F200-3-0410725
G200-3-0810725
Table 2. Calculation of d-spacing for (hkl) planes for samples A–G compared with a single crystal diamond (SCD).
Miller Indices (hkl) ABCDEFGSCD
(111)2 θ43.7543.943.9443.9543.9443.9543.9543.93
d (Å)2.072.062.062.062.062.062.062.06
(220)2 θ75.575.3375.3775.3275.3375.3175.3475.3
d (Å)1.261.261.261.261.261.261.261.26
(311)2 θ90.7591.4191.7191.5191.4891.591.4991.5
d (Å)1.081.081.081.081.081.081.081.08
Table 3. Deconvoluted parameters of the Raman spectra using a Lorentzian distribution function.
SamplesFit Parametersv1
1150 cm−1
Diamond
1332 cm−1
D*
1350 cm−1
v2
1480 cm−1
G
1580 cm−1
(v1 + v2)
%
(D* + G)
%
ACenter1161 13451487157214%86%
FWHM80 160100110
BCenter1147 13431474155940%60%
FWHM90 110120120
CCenter1136133313581473153738%60%
FWHM5010130100114
DCenter1134133413581466155356%36%
FWHM40128012080
ECenter1263133413741467156640%48%
FWHM441569120100
FCenter1270133213761460156231%61%
FWHM54880120160
GCenter1285133213671460155530%62%
FWHM120880120160
Table 4. Fermi energy, low energy cutoff, and work function calculations from Figure 9 for all the PCD films.
SampleBE (eV)E cut-off (eV)Φ (eV)
A3.316.64.6
B4.316.74.5
C4.916.64.6
D4.615.85.5
E5.016.15.2
F5.216.44.8
G5.115.95.3
Publisher’s Note: MDPI stays neutral with regard to jurisdictional claims in published maps and institutional affiliations.

