Abstract
Condition monitoring of rotating machinery plays an important role in reducing catastrophic failures and production losses in the 4.0 Industry. Vibration analysis has proven to be effective in diagnosing rotating machine failures. However, identifying bearing defects based on vibration analysis remains a difficult task, especially in non-stationary operation conditions. This work aims to automate the process of identifying bearing defects under variable operating speeds. Based on an order analysis technique, three frequency domain features: Spectrum peak Ratio Outer (SPRO), Spectrum peak Ratio Inner (SPRI), and Spectrum peak Ratio Rolling element (SPRR) are updated to perform with non-stationary signals. The updated features are extracted from vibration data of a real ball bearing system. They are retained to build a predictive multi-kernel support vector machine (MSVM) classification model. Therefore, the effectiveness of the proposed features is evaluated based on the performance of the constructed classifier. The updated features deployed have proven their effectiveness in identifying bearing: outer race, inner race, ball, and combined defects under variable speed conditions.
1. Introduction
Machines in the 4.0 industry are becoming progressively complex, making their vibration signals analysis a challenging task, even for vibration diagnostic experts [1].
Bearings are recognized as critical components in industrial machinery. Thus, mastering their vibration behavior can significantly enhance the diagnostic process. The vibration signal of a defective bearing operating under stationary conditions can be considered as an amplitude modulated waveform [2]. This makes the envelope analysis (EA) one of the most effective methods for bearings health monitoring in stationary conditions [3]. At a constant operating speed, the impulses of bearing defects occur periodically with a known frequency, namely the bearing defect characteristic frequencies. Here, the diagnostic expert relies on the frequency spectrum of the signal being diagnosed to check the existence of the defect frequencies. Three EA-based features: SPRO, SPRI, and SPRR associated with the three common bearing defects (outer race, inner race, and ball defect) have been applied successfully in the literature and proven their effectiveness in the characterization of localized bearing defects in stationary conditions [4,5].
In a real application, the operating speed of rotating machines is usually variable. The vibration impulses resulting from a localized bearing defect are therefore no longer periodic. EA as well as any other method based on the assumption of a constant rotational speed are therefore non-applicable. Order tracking methods are considered to be among the most powerful algorithms used to eliminate the effect of speed fluctuation [6]. The latter converts the non-stationary signals in the time domain into stationary ones in the angular domain [5], making Fourier transform-based analysis techniques applicable again. Order tracking methods are divided into two main types: with or without speed measuring devices, such as encoders and tachometers. It is important to note that in the case of available speed measurement, order tracking is usually performed with fairly high accuracy [2].
Despite their effectiveness in characterizing bearing defects in non-stationary operations, the use of order tracking methods is still reserved for diagnostic experts. A specialist can easily track the differences between the envelope order spectra corresponding to different bearing defects, which can be a difficult task for inexperienced operators. Machine learning algorithms (MLA) are increasingly being used as an effective solution for processing vibration signals [7]. Hotait et al. updated the unsupervised classifier Optics (Ordering Points to Identify the clustering structure) to provide real-time detection of bearing defects based on vibration monitoring. Farhat et al. [8] used two supervised machine learning classifiers: Multi kernel support vector machines (MSVM) and K-nearest neighbors (KNN), to determine the severity of a bearing outer race defect in a shaft bearing system. In many other studies [9,10,11], several kinds of MLAs are also applied to automate the detection and/or the characterization of the severity of bearing defects. However, there is no literature that deals with the automatic identification of bearing defects at variable speeds.
This work aims to automate the identification of bearing defects under variable speed conditions. Vibration data collected from real bearings with different health states operating under variable speed are considered to validate the proposed approach. Based on an order analysis technique, the three features associated with bearing defects: SPRO, SPRI, and SPRR are updated to perform with non-stationary signals. These are extracted from the considered vibration signals and used to build a predictive classification model for the MLA-classifier: MSVM [8]. The constructed classification model has proven to be effective in the identification of bearing defects under variable speed conditions, confirming the performance of the proposed features.
2. Update of SPRO SPRI and SPRR Features
Under stationary operating conditions, the impulses characterizing a bearing defect occur with a constant frequency. The characteristic frequency of an outer race defect (, an inner race defect (, and a ball defect ( are given respectively by:
where is the rotation frequency of the shaft and, present respectively the number of balls, the ball diameter, and the pitch diameter of the bearing. is the contact angle of the bearing, ( for the bearing considered in this work).
The frequency spectrum of an outer race defect is dominated by and its harmonics. Similarly, an inner race defect (resp. ball defect) spectrum includes (resp.), its harmonics, but also sidebands corresponding to the rotation frequency of the inner race (resp. the cage) distributed around the defect frequency. SPRO, SPRI, and SPRR identify defects in the outer race, the inner race, and the ball, respectively. They are obtained by dividing the sum of peaks corresponding to the defect (fundamental and harmonics) by the sum of all peaks in the frequency spectrum. The returned value will therefore reflect the probability of the presence of defects. They are given by:
is the frequency spectrum with is the number of lines in the frequency spectrum.,, and are, the peak values of the harmonics of ,, and , respectively, with is the number of harmonics corresponding to the defect.
SPRO, SPRI, and SPRR are derived from the frequency-domain feature SPR (Spectrum Peak Ratio) proposed by Shiroishi et al. [3], which has proven its effectiveness in the characterization of bearing localized defects under stationary operating conditions [3]. Referring to [12], under variable speed, bearing defect frequencies are time-varying. The conventional EA is therefore no longer suitable for the identification of bearing defects (problem of frequency smearing). Envelope order tracking is used in this work as an alternative to the conventional EA method. Based on a constant angular increment re-sampling, the non-stationary signal in the frequency domain transforms into a stationary signal in the order domain. Each defect is therefore now characterized by a constant order value whatever the rotation speed. The order is defined as the frequency normalized by the shaft speed [13], given by:
where l is the order, represents the frequency of the shaft, and n () denotes the shaft rotating speed.
The order values associated with the three considered bearing defects are respectively: the outer race ball pass order (, the inner race ball pass order , and the ball spin order (). They are expressed by:
To deal with speed variation, the expressions of: , , and are updated as given in Equations (11)–(13). The updated features: , , and are now extracted from the order domain instead of the frequency domain. They are obtained by dividing the sum of the defect peaks (fundamental and harmonics) by the sum of all peaks in the order spectrum. Considering the stationarity of the orders of bearing defects under variable speed, the updated features can reflect the probability of the presence of the defects regardless of the operating speed conditions.
is the order spectrum with is the number of lines in the spectrum.,, and are, the peak values of the harmonic of ,, and respectively, with is the number of the order harmonics corresponding to the defect.
3. Validation of the Proposed Features
This part is devoted to studying the effectiveness of the proposed (updated) features in identifying bearing defects under variable speed conditions. A predictive (MSVM) classification model is built based on the updated features ( and ). The latter is trained and tested based on vibration signals of real bearings operating under variable speed conditions.
3.1. Experimental Setup
Referring to [14], the experiments are carried out on the bearing fault simulator test bench (MFS-PK5M) presented in Figure 1.
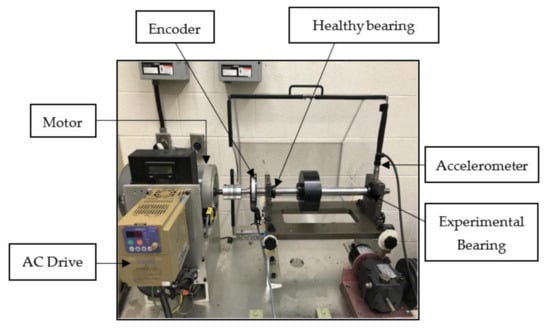
Figure 1.
The experimental setup. Reproduced with permission from [14], Elsevier, 2021.
It consists of a rotating shaft driven by an AC drive-controlled motor and supported by two ball bearings type ER16K. The motor-side bearing is considered to be healthy. The right-side bearing is considered to be the experimental one, replaced by bearings of different health states. Vibrations are acquired using an ICP accelerometer, model 623C01 placed in the housing of the experimental bearing radially in the vertical direction as shown in Figure 1. The shaft rotation speed is acquired using an EPC 775 incremental encoder. The data considered correspond to an experimental bearing with: (i) healthy state, (ii) localized inner race defect, (iii) localized outer race defect, (iv) localized ball defect, and (v) combined defects on the inner race, the outer race and the ball, operating under (i) speed increase, (ii) speed decrease, (iii) speed increase and then decrease, and (iv) speed decrease then increase conditions.
In total, 60 vibration signals sampled at 200,000 Hz with a duration of 10 s each are considered in this study, i.e., 12 data sets for each health condition (4 signals are available for each operating speed condition). Signals can be found in [14]. A detailed description of the acquired signals is available in [14].
Table 1 summarizes the characteristics of the bearings used in the experiments and gives the characteristic frequencies , and as a function of the shaft rotation frequency .

Table 1.
Parameters of the bearing.
3.2. Methodology
Figure 2 outlines the approach taken to evaluate the ability of the proposed features to classify bearing defects in non-stationary conditions.
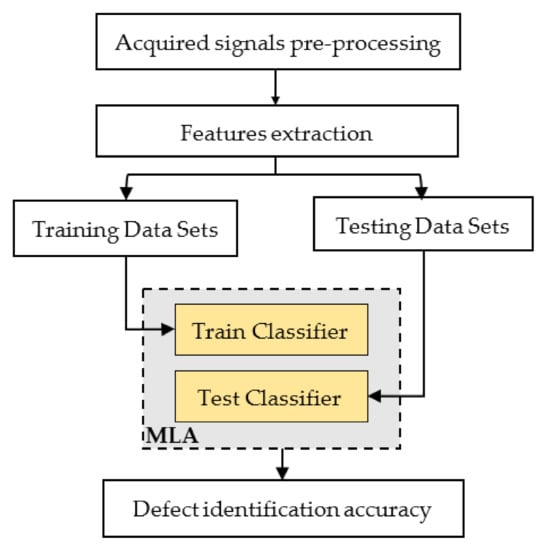
Figure 2.
Methodology of bearing defects identification.
To verify their effectiveness, the proposed features will be considered as inputs to the supervised MLA classifier MSVM. The effectiveness of these features in identifying bearing defects in the non-stationary condition is therefore evaluated through the classification results. Before engaging the feature extraction, the acquired data are submitted to a pre-processing step to provide more useful information (reduction of background noise and measurement errors). Referring to [12], spectral kurtosis is used in this work as a powerful tool to determine the optimal band for the passband filter, allowing to further reveal the defect impulses in the vibration signals. Once all samples are pre-processed, the extraction of , and is performed. 50% of the data is used to build a predictive MSVM classification model. Then, the classification efficiency is tested on the remaining 50%.
3.3. Results and Discussion
As mentioned in Section 3.1, the datasets considered in this work consist of vibration signals of each corresponding to bearings with different health states operating under variable operating speed conditions.
Preprocessing and feature extraction processes are further clarified in this section using the vibration signal shown in Figure 3. The latter corresponds to the vibration data collected from a faulty bearing with an outer race defect operating under a rotational speed decreasing from 25.4 Hz to 10.3 Hz.
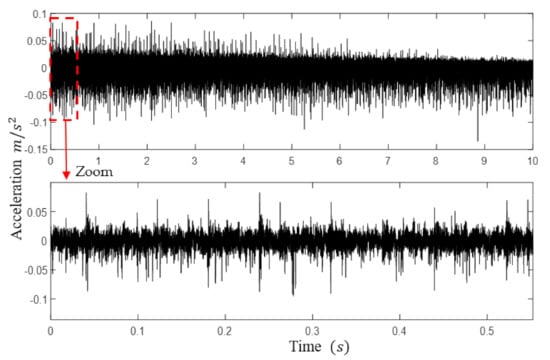
Figure 3.
Raw vibration signal of a faulty bearing with an outer race defect, (Rotation speed decreasing from 25.4 Hz to 10.3 Hz).
3.3.1. Pre-Processing
The raw vibration signal presented in Figure 3 shows the presence of the defect impulses, however, these are mostly masked by the noise. As mentioned in Section 3.2, spectral kurtosis is used to determine the frequency band dominated by the defect excitations. This information is needed to define the optimal frequency range to the passband filter. The Kurtogram of the considered vibration signal is given in Figure 4.
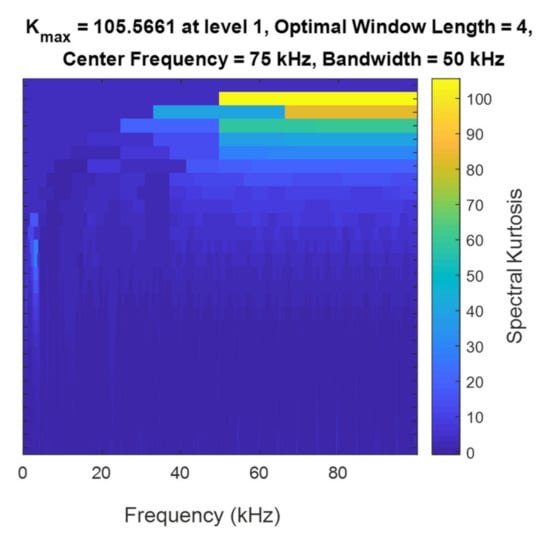
Figure 4.
Kurtogram of the faulty bearing vibration signal.
Figure 5 shows the filtered signal obtained by applying a bandpass filter at the optimal frequency band determined by SK. The defect impulses are now clearer and less masked by noise, making the signal more suitable for feature extraction.
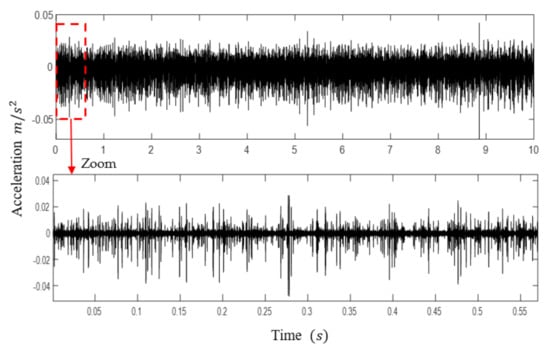
Figure 5.
Filtered vibration signal of the faulty bearing.
3.3.2. Features Extraction
The proposed features expressed in Equations (11)–(13) are extracted directly from the order domain. A transformation of the signal from time to order domain is therefore required. The order tracking method used in this work is based on the availability of an encoder speed measurement. The signals acquired with a uniform are resampled in the angular domain based on a digital adaptive resampling algorithm. The uniform data are therefore transformed into uniformly angle spaced data. To carry out the transformation from the time domain to the angular domain, a reference signal is required to define the uniform angular intervals. Generally, this reference signal is taken as the tachometer signal measured on the bearing drive shaft. The signal resampling process carried out in this work can be summarized as follows: (i) a tachometer signal is derived from an available encoder signal and used as a phase increment reference to obtain the even-angle sampling time marks. (ii) An interpolation scheme is used to achieve an even-angle sampling of the considered time series according to the tachometer time marks. (iii) Order spectrum analysis is used to extract features from the even-angle data.
Figure 6a,b show respectively the tacho-pulses and the speed profile corresponding to the vibration signal of the defective bearing with the outer race defect studied in the previous section. These latter are derived directly from the acquired encoder signal.
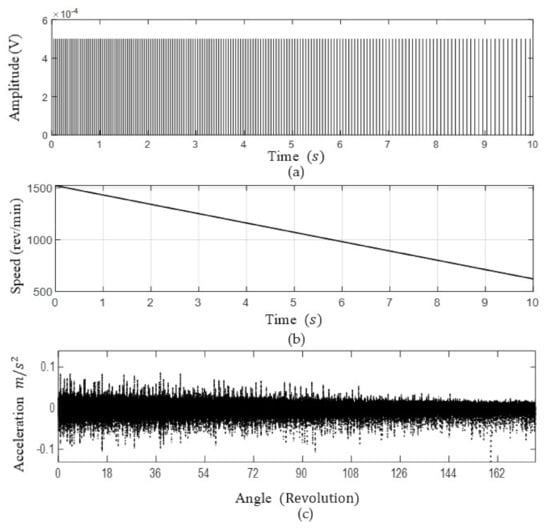
Figure 6.
Resampling of the bearing vibration signal; (a) Tacho pulses; (b) Speed profile; (c) Resampled signal.
As explained before, an even-angle sampling of the considered bearing vibration signal is carried out according to the tachometer time marks. The resampled signal is shown in Figure 6c, indicating equidistant defect impulses (in contrast to those in Figure 3). This confirms the stationarity of the re-sampled signal in the angular domain. It should be pointed out that the abscissa of the resampled signal is no longer the time, but the rotation angle of the shaft in revolutions.
An ordinary envelop spectrogram of the raw time signal in focus is calculated referring to [12] and displayed in Figure 7a. The latter indicates the presence of outer race defect frequency and its harmonics. This frequency varies according to the shaft rotational speed. Figure 7b, on the other hand, shows the envelope order spectrogram obtained based on the resampled envelope of the time signal in the angular domain. It is clear that the defect order values ( and its harmonics) are constant regardless of the operation speed, confirming the robustness of the expressions of the updated features under variable speed conditions. As explained in Section 2, , , and are directly extracted from the envelope order spectrum of the signal. The envelope order spectrum of the signal in focus is given in Figure 8. It is dominated by the order of the outer race defect and its harmonics, confirming the efficiency of the proposed features.
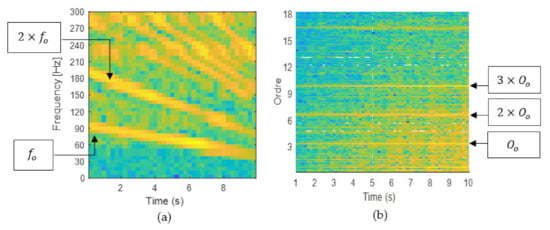
Figure 7.
Envelop spectrogram of the faulty bearing signal, (a) frequency domain, (b) order domain.

Figure 8.
Envelop order spectrum of the faulty bearing signal.
3.3.3. Classification
To perform the classification process, the acquired vibration signal described in Section 3.1 are regrouped according to their corresponding health state, regardless of the operation speed condition. 12 signals of 10 s are thus considered for each health state. To increase the number of samples, the 10 s signals are divided into 5 samples of 2 s each. Thus, a total of 60 samples are considered for each condition:
- ▪
- Healthy bearing (H)
- ▪
- Faulty bearing with an outer race defect (ORD)
- ▪
- Faulty bearing with an inner race defect (IRD)
- ▪
- Faulty bearing with a ball defect (BD)
- ▪
- Faulty bearing with combined outer race, inner race, and ball defects (CD)
Figure 9a,b shows the 3D space representation of the acquired pre-processed data as a function of the conventional features (, , and ) and the updated features (, , and ) respectively. All features are normalized using the standard MATLAB function “range”. This function normalizes the computed features to an interval [0,1] to ensure a clear graphical representation of the data.
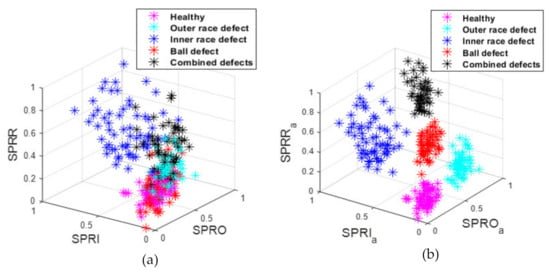
Figure 9.
Space representation of the acquired pre-processed data: (a) as a function of the conventional features; (b) as a function of the updated features.
It can be noted that in the case of the conventional features used, there is an overlap between the data representing each health state. On the other hand, with the updated features the separation between the data corresponding to different health states is obvious. This confirms the ability of the proposed features to separate between bearing defects.
An MSVM-based classification is investigated to confirm the relevance of the proposed features in the identification of bearing defects under variable speed conditions. All samples considered have been pre-processed as explained in the previous section and used in the extraction of the updated features. 50% of the extracted features corresponding to each health state have been used to build (train) the predictive MSVM classification model. Then, the constructed model is tested against the remaining 50% of the data. The classification result is given in Figure 10. To highlight the necessity of the pre-processing step, another MSVM classification model is trained and tested based on the raw signals (50% for training and 50% for testing). The result of the raw data classification is given in Figure 11.
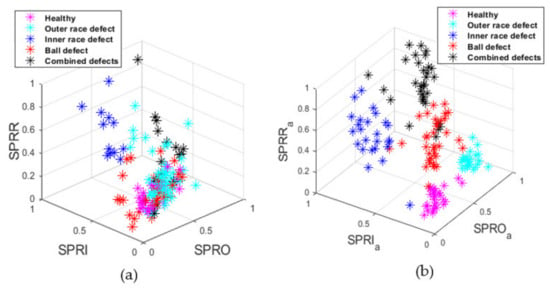
Figure 10.
Space representation of the tested 50% of pre-processed data as predicted by the (MSVM) classifier: (a) using the non-updated features; (b) using the updated ones.
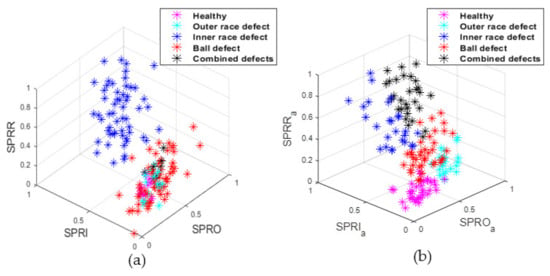
Figure 11.
Space representation of the tested 50% of raw data as predicted by the (MSVM) classifier: (a) using the non-updated features; (b) using the updated ones.
Confusion matrices, Table 2 and Table 3, are adopted to evaluate the performance of the MSVM classifier in the case of conventional and updated features extracted from raw and pre-processed signals respectively. The present study is performed in the balanced class case which makes the accuracy of classification sufficient criterion to evaluate the classifier performance. The classification accuracy is achieved as shown in Equation (14), by counting the data labeled as true positives TP, true negatives TN, false positives FP, and false negatives FN.

Table 2.
Confusion matrices for the case of raw data: (a) using conventional features; (b) using updated features.

Table 3.
Confusion matrices for the case of pre-processed data: (a) using conventional features; (b) using updated features.
The updated features based MSVM classifier built has successfully identified the correct type of the bearing defects for over 87% of the tested pre-processed data and over 79% for the raw data, whereas with the non-updated features, the accuracy of the classification only reached 37% for the pre-processed data and 32% for the raw data. Confirming the performance of the updated features in identifying bearing defects in variable speed and the necessity of the pre-processing step.
4. Conclusions
In this work, an original approach is investigated to identify bearing defects under variable speed conditions. The expressions of three features associated with bearing: outer race, inner race, and ball defects are updated based on an order tracking technique. These are extracted from the vibration signals of bearings with different states of health operating under variable speed conditions. The extracted features are used to build a predictive classification model for the supervised classifier MSVM. The latter has proven to be effective in the identification of bearing defects in variable speed conditions, confirming the performance of the proposed features.
In the following works, the proposed features will be used to perform a digital twin-based identification of bearing defects in a non-stationary regime. Simulated data will be used instead of the experimental ones in the phase of the training of the classifier. Furthermore, the performance of the proposed approach will be tested in the case of combined gear-bearings systems.
Author Contributions
All authors contributed to the main idea of this paper. Conceptualization, M.H.F. and X.C.; methodology, M.H.F.; writing—original draft preparation, M.H.F.; writing—review and editing M.H.F., F.C. and X.C.; supervision, X.C., F.C., F.B., and M.H. All authors have read and agreed to the published version of the manuscript.
Funding
This research received no external funding.
Institutional Review Board Statement
Not applicable.
Informed Consent Statement
Not applicable.
Data Availability Statement
The data are obtained from [14]. They are available at https://data.mendeley.com/datasets/v43hmbwxpm/2 (accessed on 26 April 2021).
Conflicts of Interest
The authors declare no conflict of interest.
References
- Liu, R.; Yang, B.; Zio, E.; Chen, X. Artificial intelligence for fault diagnosis of rotating machinery: A review. Mech. Syst. Signal Process. 2018, 108, 33–47. [Google Scholar] [CrossRef]
- Wang, T.; Liang, M.; Li, J.; Cheng, W. Rolling element bearing fault diagnosis via fault characteristic order (FCO) analysis. Mech. Syst. Signal Process. 2014, 45, 139–153. [Google Scholar] [CrossRef]
- Lv, Y.; Zhu, Q.; Yuan, R. Fault Diagnosis of Rolling Bearing Based on Fast Nonlocal Means and Envelop Spectrum. Sensors 2015, 15, 1182–1198. [Google Scholar] [CrossRef] [PubMed]
- Shiroishi, J.; Li, Y.; Liang, S.; Kurfess, T.; Danyluk, S. Bearing Condition Diagnostics via Vibration and Acoustic Emission Measurments. Mech. Syst. Signal Process. 1997, 11, 693–705. [Google Scholar] [CrossRef]
- Lei, Y.; He, Z.; Zi, Y.; Chen, X. New clustering algorithm-based fault diagnosis using compensation distance evaluation technique. Mech. Syst. Signal Process. 2008, 22, 419–435. [Google Scholar] [CrossRef]
- Wang, J.; Peng, Y.; Qiao, W. Current-Aided Order Tracking of Vibration Signals for Bearing Fault Diagnosis of Direct-Drive Wind Turbines. IEEE Trans. Ind. Electron. 2016, 63, 6336–6346. [Google Scholar] [CrossRef]
- Lei, Y.; Yang, B.; Jiang, X.; Jia, F.; Li, N.; Nandi, A.K. Applications of machine learning to machine fault diagnosis: A review and roadmap. Mech. Syst. Signal Process. 2020, 138, 106587. [Google Scholar] [CrossRef]
- Farhat, M.H.; Chiementin, X.; Chaari, F.; Bolaers, F.; Haddar, M. Digital twin-driven machine learning: Ball bearings fault severity classification. Meas. Sci. Technol. 2020, 32, 044006. [Google Scholar] [CrossRef]
- Carvalho, T.P.; Soares, F.A.; Vita, R.; Francisco, R.D.P.; Basto, J.P.; Alcalá, S.G. A systematic literature review of machine learning methods applied to predictive maintenance. Comput. Ind. Eng. 2019, 137, 106024. [Google Scholar] [CrossRef]
- Stetco, A.; Dinmohammadi, F.; Zhao, X.; Robu, V.; Flynn, D.; Barnes, M.; Keane, J.; Nenadic, G. Machine learning methods for wind turbine condition monitoring: A review. Renew. Energy 2019, 133, 620–635. [Google Scholar] [CrossRef]
- Zhang, W.; Jia, M.P.; Zhu, L.; Yan, X.A. Comprehensive Overview on Computational Intelligence Techniques for Machinery Condition Monitoring and Fault Diagnosis. Chin. J. Mech. Eng. 2017, 30, 782–795. [Google Scholar] [CrossRef]
- Farhat, M.H.; Hentati, T.; Chiementin, X.; Bolaers, F.; Chaari, F.; Haddar, M. Numerical model of a single stage gearbox under variable regime. Mech. Based Des. Struct. Mach. 2020, 1–28. [Google Scholar] [CrossRef]
- Guo, Y.; Liu, T.W.; Na, J.; Fung, R.F. Envelope order tracking for fault detection in rolling element bearings. J. Sound Vib. 2012, 331, 5644–5654. [Google Scholar] [CrossRef]
- Huang, H.; Baddour, N. Bearing vibration data collected under time-varying rotational speed conditions. Data Br. 2018, 21, 1745–1749. [Google Scholar] [CrossRef] [PubMed]
Publisher’s Note: MDPI stays neutral with regard to jurisdictional claims in published maps and institutional affiliations. |
© 2021 by the authors. Licensee MDPI, Basel, Switzerland. This article is an open access article distributed under the terms and conditions of the Creative Commons Attribution (CC BY) license (https://creativecommons.org/licenses/by/4.0/).