Article

Novel Data Augmentation Employing Multivariate Gaussian Distribution for Neural Network-Based Blood Pressure Estimation

Department of Electronic Engineering, Hanyang University, Seoul 04763, Korea
*
Author to whom correspondence should be addressed.
Appl. Sci. 2021, 11(9), 3923; https://doi.org/10.3390/app11093923
Submission received: 19 March 2021 / Revised: 21 April 2021 / Accepted: 22 April 2021 / Published: 26 April 2021

Abstract

:
In this paper, we propose a novel data augmentation technique employing multivariate Gaussian distribution (DA-MGD) for neural network (NN)-based blood pressure (BP) estimation, which incorporates the relationship between the features in a multi-dimensional feature vector to describe the correlated real-valued random variables successfully. To verify the proposed algorithm against the conventional algorithm, we compare the results in terms of mean error (ME) with standard deviation and Pearson correlation using 110 subjects contributed to the database (DB) which includes the systolic BP (SBP), diastolic BP (DBP), photoplethysmography (PPG) signal, and electrocardiography (ECG) signal. For each subject, 3 times (or 6 times) measurements are accomplished in which the PPG and ECG signals are recorded for 20 s. And, to compare with the performance of the BP estimation (BPE) using the data augmentation algorithms, we train the BPE model using the two-stage system, called the stacked NN. Since the proposed algorithm can express properly the correlation between the features than the conventional algorithm, the errors turn out lower compared to the conventional algorithm, which shows the superiority of our approach.

1. Introduction

A blood pressure (BP) is an essential factor to diagnose a health condition, and it is important to periodically monitor the BP for our healthcare. For this, previously reported algorithms for the BP measurement have been extensively studied using polynomial regression, support vector machine, and artificial neural network (NN) [1,2]. Also, recently, in order to improve the estimation performance, the research using deep learning [3] has been attempted and resulted in superior accuracy.
However, a collection of the biological data such as the BP is mostly limited because the cost is very high for large database (DB) which includes data and its label, verified by expert. For this reason, since an advantage of the deep neural network (DNN) which works well with the large DB is limited with the small DB, the DNN model which is trained by small training DB yields a fatal weakness [4,5,6,7,8,9,10]. To address the fatal weakness, previous researches have been extensively conducted by the deep learning techniques which train a model with the limited label data, such as the siamese network and few-shot learning technique [11,12,13,14,15,16,17]. However, since the deep learning techniques employ the image-based feature, the technique is not proper in our task which uses the signal-based feature. Therefore, to address this problem, an augmentation algorithm is demanded to create a pseudo data for the training DB. For this, previous studies for the BP estimation (BPE) have used a bootstrap algorithm which augments the training DB [3,18,19].
However, the bootstrap algorithm does not work well in the DB of non-diversity and the pseudo data which is created by the bootstrap algorithm does not properly express the characteristics and the correlations between the multi-dimensional features. For this reason, although the training DB is sufficiently augmented, there is significant limitation in performance improvement because the pseudo data has a partially negative impact on DNN training [3]. In addition, previous studies do not consider properly the characteristic of the DB which is collected several times for each subject.
Thus, in this paper, we review the conventional data augmentation algorithm used to improve the limited performance obtained from the NN model trained with a small DB. And then, in order to overcome the weakness of the conventional algorithm, we propose the novel data augmentation algorithm based on multivariate Gaussian distribution (DA-MGD) for the BPE using the NN. The pseudo data derived from a multivariate Gaussian distribution is much more similar to the characteristics of the real data than when they were generated by the conventional data augmentation method. Specifically, since the relationship between the features of the pseudo data and reference BP is represented by multivariate Gaussian distribution, the pseudo data is constructed more effectively than the conventional data augmentation method. For this reason, since the proposed algorithm boosts the training DB effectively than the previous augmentation algorithm, the NN-based model can estimate the BP better than the original method.
This paper is composed of as follows. The NN-based BPE employing bootstrap algorithm is described in detail in Section 2. The proposed algorithm is described in detail in Section 3. Next, Section 4 shows the results, and discussion is provided in Section 5. Finally, Section 6 concludes the paper.

2. NN-Based BPE

We describe the NN-based BPE employing the bootstrap algorithm, proposed in [3]. For estimating the BP including systolic BP (SBP) and diastolic BP (DBP), the photoplethysmography (PPG) and electrocardiography (ECG) signals are collected using the smart wristwatch embedded with the sensors. However, since raw data of the PPG and ECG signal are contaminated by noise, the peak point which is important to extract the features cannot be precisely detected.
To mitigate this problem, the pre-processing is designed to remove noise using the Butterworth second-order filter [20]. Also, the PPG and ECG signals pass through the Butterworth second-order band-pass filter (0.5 Hz and 11 Hz) [21,22] and Butterworth second-order low-pass filter (cut-off: 30 Hz) [23], respectively.

2.1. Feature Extraction

To estimate the SBP and DBP, the features are extracted using the PPG and ECG signals after pre-processing. For this, the peak point (PP) P PPG and valley point (VP) V PPG of the PPG signal, and R-peak point (RPP) P ECG of the ECG signal are first detected and authors in [3] then extract the features which is related with the SBP and DBP as in Table 1 [1,24,25,26].
Also, S PPG ( n ) is a point at which the slope in the positive direction of the PPG signal becomes the maximum. And, n indicates the index of the points and d denotes the distance between the fingertip and heart, respectively. However, since measuring the distance demands further inconvenient, authors in [3] alternatively substitute the distance with the half value of the subject’s height. Also, we use the body information such as gender, age, height, and weight related to the BP as the feature [27,28]. Finally, the extracted feature vectors pass through the Nth order median filter.

2.2. NN Training and BPE

Once the feature vector is extracted, the NN model is trained to estimate the SBP and DBP for which there are two major stages including a parameter initialization stage and fine-tuning stage. For this, the feature vector is first normalized using their means and standard deviations (SD) [29]. For this, the exponential linear unit (ELU) f ( t ) [30] is used for the activation function of the hidden layers as given by:
f ( t ) = t t 0 α ( e t 1 ) t < 0
where t is an argument of the ELU function. Also, α denotes the parameter of the ELU function and then the parameter is set to 1.
Then, we update the parameters such as the weights and biases of each layer in accordance with the minimum mean square error (MMSE) [31] between the estimated BP and reference BP. In addition, the MMSE plays the role of the error function E of the NN using mini-batches as follows:
E = 1 K k = 1 K [ Y ^ k ( w ( l ) , b ( l ) ) Y k ] 2
where k denotes an index of the mini-batch with K representing the mini-batch size, and Y ^ k ( w ( l ) , b ( l ) ) and Y k are denote the estimated BP and target BP, respectively. Also, w ( l ) and b ( l ) are, respectively, the weight and bias of the lth layer. Finally, the parameters of each hidden layers are updated repeatedly using the learning rate λ as follows [31]:
( w ( l ) , b ( l ) ) = ( w ( l ) , b ( l ) ) λ E ( w ( l ) , b ( l ) ) , 1 l L + 1
Thus, we set the values of the SBP and DBP as the target vectors, and obtain the NN models to estimate the SBP and DBP. To estimate the SBP and DBP using the NN models, we employ the weight and bias to estimate the BP such that
SBP = f ( f ( D · w SBP , 1 + b SBP , 1 ) w SBP , 2 + b SBP , 2 ) w SBP , out + b SBP , out
DBP = f ( f ( D · w DBP , 1 + b DBP , 1 ) w DBP , 2 + b DBP , 2 ) w DBP , out + b DBP , out
where w 1 , w 2 , and w out are the weight of each layer, and b 1 , b 2 and b out are the bias of each layer. Also, D denotes the feature vector. Finally, the output of the NN model is de-normalized for representing the SBP and DBP unit (mmHg) using the pre-computed mean and SD [24].
Also, to improve the performance of the proposed algorithm, we employ the two-stage system based on the stacked NN [32]. The two-stage system exhibits the structure of the cascade type using the stacked NN which is connected with the first NN model as shown in Figure 1. For this, input features of the stacked NN model consist of the extracted feature and estimated BP of the first NN. The feature added for the stacked NN model acts as the major feature which helps to train the stacked model which estimates more elaborately the BP than the first NN. In addition, the stacked NN model is trained equally with a procedure of the first NN training as in Equations (1)–(5).
To estimate the BP using the two-stage system based on the stacked NN, the first NN model equipped with the extracted features estimates the BP and then the estimated BP is used as the input feature of the stacked NN. Hence, the estimated BP of the first NN model is concatenated with the extracted features to construct the stacked NN input. Finally, after the stacked NN model estimates the BP as in Equations (4) and (5) using the constructed input, the estimated value is calculated through the de-normalization using the mean and SD.

2.3. Conventional Data Augmentation Algorithm

Since the NN works well with a sufficient training DB, the data augmentation algorithm plays a great role in the ultimate performance. Specifically, previous works propose a bootstrap algorithm [3,18,19] which creates the pseudo data to augment the training DB dramatically. For this, as shown in Figure 2, the actual data for training DB is divided into multiple groups randomly. And, in order to obtain the pseudo data, the statistic information such as the mean and SD of features for each group are calculated. The pseudo data are generated randomly according to normal distribution using the mean and SD. In addition, the features of the pseudo data are created independently for each feature and the reference BP of the pseudo feature vector is determined by the BP of the group (Interested readers are referred to [3] for further information).

3. Method

Under the insufficient DB environment, in order to improve the performance of the NN, we propose a novel data augmentation algorithm using the pseudo data generator based on multivariate Gaussian distribution as displayed in Figure 2. Since the multivariate Gaussian distribution is a generalization of the univariate normal distribution to two or more variables, it can represent the distribution for random vector of correlated variables where each vector element has a univariate Gaussian distribution. Indeed, multivariate Gaussian distribution (MGD) f MGD is formulated as follows [33]:
f MGD ( X , μ , Σ ) = 1 ( 2 π ) k | Σ | exp 1 2 ( X μ ) T Σ 1 ( X μ )
μ = E [ X ] = [ E [ X 1 ] , E [ X 2 ] , . . . , E [ X k ] ] T
Σ = E [ ( X μ ) ( X μ ) T ] = Cov [ X i , X j ] , 0 < i , j < k + 1
where X denotes the multi-dimensional features, μ and Σ are the mean vector and covariance matrix, respectively. And, k denotes the feature dimension and i, j are indices of the feature dimension, respectively. Thus, the pseudo data is generated through sampling to follow the MGD with the mean & covariance obtained from the actual data.
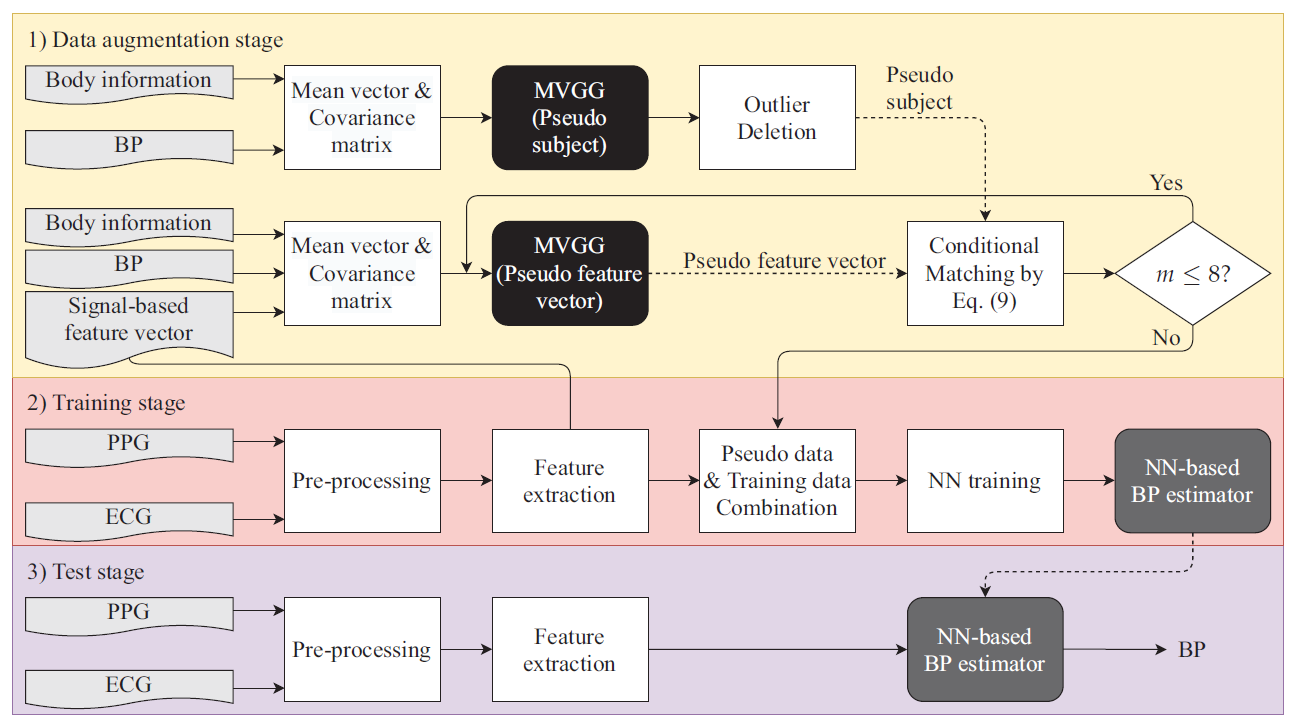
To make the pseudo data similar to the actual data, which were collected 3–6 times for each subject, we create the pseudo data of 8 times for each pseudo subject after generating the pseudo subjects which consist of the BP and body information (height, weight, age, and gender). First, a normal pseudo subject is created from only BP and body information. After that, we create a pseudo feature vector that considers all the features used in the proposed algorithm, including BP and body information. By comparing the pseudo feature vector with the normal pseudo subject’s body information and BP, more refined high-quality pseudo data can be obtained. After creating a pseudo subject step by step in this way, it takes the effect of purifying the created pseudo feature vector. The reason for the occurrence of 8 times is due to the fact that it is slightly more than 6, which is the number of times actually measured. As shown in Figure 3, the pseudo subjects are generated by the MGD after extracting the mean and covariance of the BP and body information in training DB. However, since the generated pseudo subjects may contain outlier data such as abnormal body information, the outlier data is further removed. When the height was less than 149 cm or more than 195 cm, the weight was less than 30 kg and more than 150 kg, and the age was less than 20 years, it was removed.
And, to develop the feature vector for the pseudo subject, we generate the pseudo feature vector after extracting the mean vector and covariance matrix of the BP, feature vector, and body information in training DB using Equation (6). The pseudo feature vector includes the body information to match the pseudo subject. At this time, in order to determine the reference BP of the pseudo data, the pseudo subject and pseudo feature vector include the reference BP. Finally, to match the pseudo feature vector for the pseudo subject, we perform the Algorithm 1 as follows:
Algorithm 1 Matching the pseudo subject with the pseudo feature
  •  while j J do
  •    S j MGD ( { H s , W s , A s , G s , B s } ) # S j is pseudo subject
  •   while m 8 do
  •     F MGD ( { H f , W f , A f , G f , B f , P f } ) # F is 100 × ( 5 + P ) matrix ( F { F 1 , F 2 , . . . , F 100 } )
  •    while i 100 do
  •     if F i { H f , W f , A f , G f , B f } is not matched to condition 1, 2, 3 with S j then
  •      Delete F i
  •     end if
  •      i i + 1
  •    end while
  •    if # of candidate vectors > 0 then
  •      F j , m min ( S j F )
  •    else
  •     Continue
  •    end if
  •     m m + 1
  •   end while
  •    j j + 1
  • end while
Condition 1 | H s H f | < T H , | W s W f | < T W , | A s A f | < T A Condition 2 G s = G f Condition 3 | B s B f | < T B
where S j denotes a vector for the pseudo subject, which consist of the BP and body information, and F is the matrix for the candidate pseudo feature, related with specific conditions in Equation (9). And, H, W, A, G, and B are respectively height, weight, age, gender, and BP. Also, j and J denote the index of the pseudo subject and entire pseudo subject, respectively. In addition, m denotes the index of the pseudo data F j , m for the pseudo subject, and then only body information from F j , m is replaced by the body information from S j . P is dimension of signal-based features. Finally, T H , T W , T A , and T B denote thresholds of height (cm), weight (kg), age, and BP (mmHg), respectively. When training the NN model, the pseudo data is combined with the real data.
Finally, as shown in Figure 3, after the training DB is augmented by our proposed algorithm, we train the NN model for estimating the SBP and DBP using the method described in the Section 2. In addition, after the feature extraction is performed on the smart wristwatches, the extracted feature vector is transmitted to the smartphone connected via Bluetooth to estimate the SBP and DBP based on the NN parameters at the smartphone.
In order to verify the DA-MGD algorithm compared with the bootstrap algorithm, we trained the BPE model based on the NN with the augmented training DB. For this, the training DB was augmented as 5 times and 20 times using the bootstrap algorithm, and we then trained the NN model. And, to augment the training DB using the proposed algorithm, the pseudo subjects were created additionally with 50 and 100 subjects. And, T H , T W , T A , and T B were set to 5, 5, 5, and 10, respectively. Since the loop in a code of the algorithm runs infinitely if the thresholds that are too small was used, we empirically set it to 5 to make the algorithm work smoothly. In addition, the threshold of the BP was set to 10 because the difference of 10 mmHg between the trials of the actual BP could occur.
We compared the NN models using the data augmentation algorithms with the baseline NN model without the data augmentation. To train the NN models, the number of hidden layers was set to three and the number of hidden units on each layer was set to 128, 256, and 128, respectively. We used the same learning parameters for all experiments to evaluate the performance of the data augmentation algorithms. Also, the number of hidden layers and units was determined empirically through experiments with the best performance. To alleviate the overfitting problem, we employed the drop-out (0.2) and L1 regularization.

4. Results

4.1. Statistics

To compare the DA-MGD algorithm with the bootstrap algorithm, we compared the NN-based BPE results, which are respectively obtained by the two algorithms for the reference BP. In order to evaluate the performance of the results, we adopted the mean error (ME) with the SD and Pearson correlation coefficient r-value between the estimated BP and reference BP. All statistical analyses were performed using MATLAB R2019b and IBM SPSS ver 21.0 [34] (IBM Corp., Armonk, New York, NY, USA).

4.2. Data Collection Protocol and Data Sets

This research was confirmed by a local research ethics committee, and then every participant signed informed consent before measurement. For this experiment, we used the smart wristwatch (InBody smart wristwatch, InBody Corp., Seoul, Korea) embedded with the ECG sensor (Device: AD8233, Sampling rate: 500 Hz) and PPG sensor (Device: ADPD174GGI, Sampling rate: 500 Hz, Two green light emitting diodes), and DB and labels were collected using the wristwatch and mercury sphygmomanometer (Desk type 0320, Baumanometer, New York, NY, USA). Also, the error limitation of the mercury sphygmomanometer was ± 3 mmHg. In order to obtain the reference BP, the noninvasive BP monitoring was performed while the subject wears a smart wristwatch to obtain SBP and DBP through the mercury sphygmomanometer under guidance by a nurse.
However, since it is practically impossible to measure the PPG signal using the wristwatch while the subject wears a cuff of the mercury sphygmomanometer, we cannot simultaneously measure the reference BP (SBP and DBP) and the signals because the PPG signal cannot be obtained while the sphygmomanometer cuff is in place. Thus, we recorded the PPG and ECG signals (20 s) during the rest time between measurements while the BP is measured 4 times (or 7 times) and then the BP of the PPG and ECG signals is determined by averaging these values of the front and rear. Therefore, the DB contained the two signals of 20 s and the average SBP and DBP for it.
We collected the DB from 110 subjects (mean ± SD, height: 166.3 ± 9.0 cm, weight: 65.3 ± 13.3 kg, age: 36.7 ± 10.5, SBP: 106.8 ± 12.6 mmHg, DBP: 67.1 ± 10.2 mmHg, and gender (male/female, %): 35/65). Specifically, the data for 61 subjects were collected three times per subject on the left arm, and the rest of the data were collected three times per subject for the left and right arms. Also, the PPG and ECG signal were collected simultaneously during 20 s. To evaluate the proposed algorithm, the 110 subjects are divided by four groups and we then used two of the four groups as the training DB. And, the remaining two groups were used as the test DB that is not included in learning. Also, since the number of subjects was not the multiple of four, the four groups was divided randomly respectively 27, 27, 28, 28 subjects.
At first, after calculating the average SBP of each subject, the average SBP of the subjects was arrayed in ascending order. Finally, each subject was assigned one of four groups in order. However, since the hypertension (SBP > 130 mmHg) and hypotension (SBP < 85 mmHg) data were not almost included in our DB, the hypertension and hypotension data were included in training DB for reasonable learning.

4.3. Data Augmentation

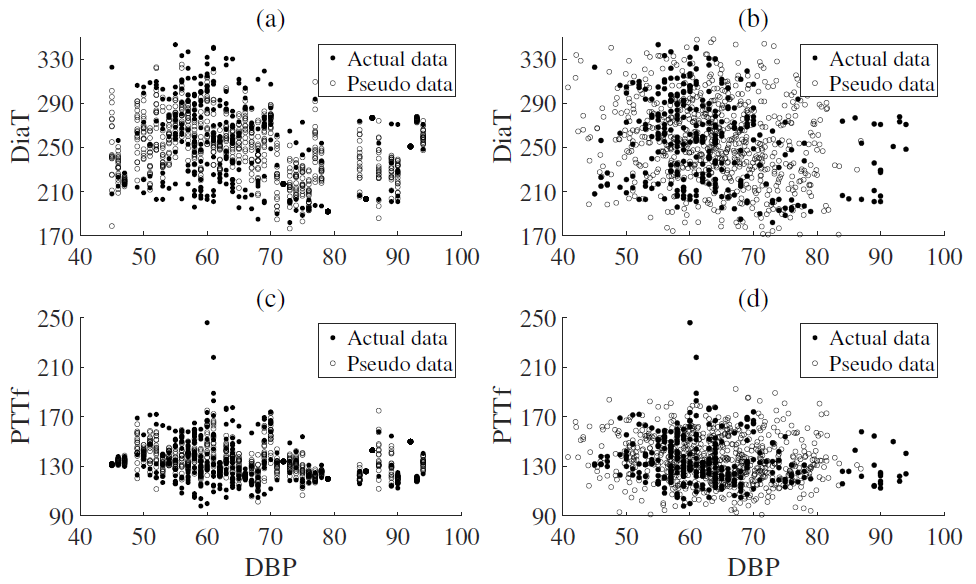
In reality, since the bootstrap algorithm created independently the pseudo features. Finally, as shown in Figure 4, Figure 5 and Figure 6, while each feature vector which is created by the proposed algorithm represented properly the reference BP, the results of the conventional algorithm did not represent correlation between the feature vector and reference BP well. Finally, our experimental results were summarized in Table 2 and Table 3. The proposed algorithm showed better performance than the bootstrap algorithms in terms of the value of ME ± SD and r-value. While the average performance in terms of SDE was respectively improved by 23% and 11% for SBP and DBP when using the proposed algorithm, the average performance of the conventional algorithm was respectively decreased by 5% and 13% for SBP and DBP. It can be considered that the r-value has decreased because the data generated from the conventional algorithm had an adverse effect as a result. In addition, while the average r-value of the proposed algorithm was respectively increased by 18% and 16% for SBP and DBP, the average r-value of the conventional algorithm was respectively decreased by 2% and 11% for SBP and DBP.

5. Discussion

Since a medical data such as BP is mostly limited quantitatively, it is difficult to take advantage of the NN, which shows promising performance when large data is used. In reality, since measurements are obtained with expensive machinery and labels are the fruit of a time-consuming analysis, drawn from the conclusions of human experts, it is difficult to collect the sufficient labeled data for BP measurement which includes data and its label, verified by the expert.
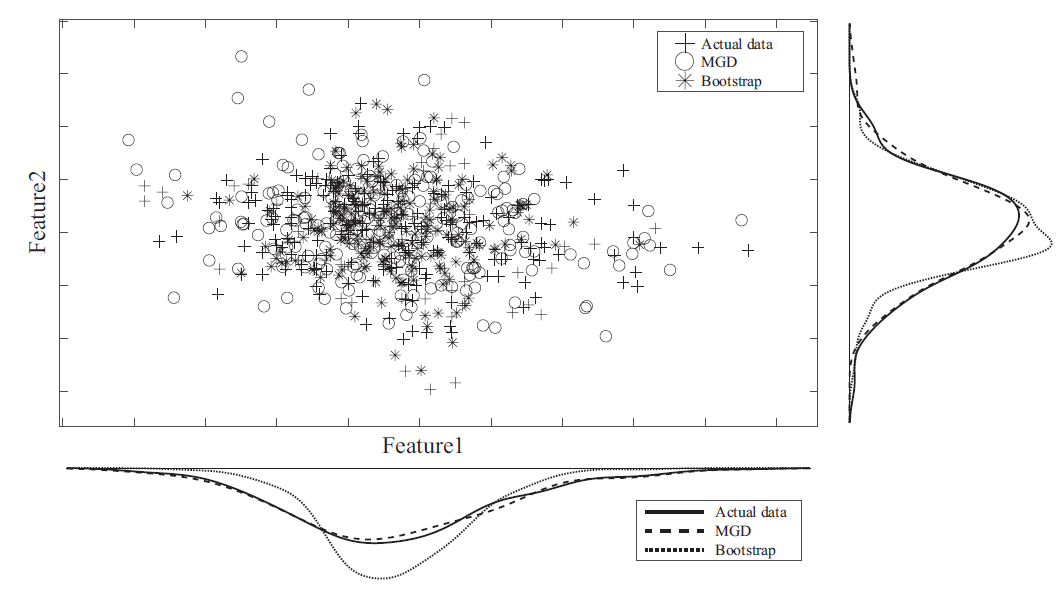
To address this problem, the data augmentation techniques were utilized for boosting quantitatively the training DB in which one of the representative techniques is the bootstrap algorithm. However, while the previous method such as the bootstrap algorithm does not properly represent the correlations between multi-dimensional features in estimating the BP, the proposed algorithm can express efficiently the correlation between the features. For this reason, the proposed algorithm showed better performance than the conventional algorithm. It is wise to explain the merit of the generator using the MGD, as depicted in Figure 7. As shown in the figure, the generator based on the MGD creates the pseudo data that resembles most closely the actual data. Specifically, when we employ the MGD, the distribution of the pseudo data is similar to the distribution of the original one, while the data distribution of bootstrap is quite different. In addition, since the MGD-based generator creates the pseudo data for sections with a little distribution of actual data, the pseudo data is generated more diversely while maintaining correlation between features than bootstrap. In addition, when we compared the results of 50 pseudo subjects with the results of 100 pseudo subjects, the average performance of each experiment was similar. Thus, it turns out that the 50 pseudo subjects were sufficient to improve the performance of the NN-based BPE. In the case of 100 pseudo subjects, a very small amount of unnecessary data may have been added. Finally, since our DB contains a small amount of hypertension data, we need to collect additional DB for evaluating performance for hypertension in future works.

6. Conclusions

In this paper, we proposed the novel data augmentation algorithm for estimating the BP based on the NN when using a smart wristwatch. The proposed data augmentation algorithm based on the MGD created the pseudo data properly while maintaining the relationship between the features. However, the conventional algorithm cannot properly express the relationship between the features.
For this reason, the performance of the proposed data augmentation algorithm was better than that of the bootstrap algorithm. Therefore, the results of the proposed algorithm show that the performance limitation of the NN model with small training DB alleviates effectively.

Author Contributions

Conceptualization, T.-J.P., K.S. and J.-H.C.; methodology, T.-J.P., K.S. and J.-H.C; software, T.-J.P. and K.S.; validation, T.-J.P. and K.S.; writing—original draft preparation, T.-J.P. and K.S.; writing—review and editing, J.-H.C.; supervision, J.-H.C.; funding acquisition, J.-H.C. All authors have read and agreed to the published version of the manuscript.

Funding

This research received no external funding.

Institutional Review Board Statement

Not applicable.

Informed Consent Statement

Not applicable.

Data Availability Statement

Not applicable.

Acknowledgments

This work was supported by Institute of Information & communications Technology Planning & Evaluation (IITP) grant funded by the Korea government(MSIT) (No.2020-0-01373, Artificial Intelligence Graduate School Program (Hanyang University)).

Conflicts of Interest

The authors declare no conflict of interest.

References

  1. Kachuee, M.; Kiani, M.M.; Mohammadzade, H.; Shabany, M. Cuffless blood pressure estimation algorithm for continuous health-care monitoring. IEEE Trans. Biomed. Eng. 2017, 64, 859–869. [Google Scholar] [CrossRef] [PubMed]
  2. Wang, L.; Zhou, W.; Xing, Y.; Zhou, X. A novel neural network model for blood pressure estimation using photoplethesmography without electrocardiogram. J. Healthc. Eng. 2018, 2018, 1006–1009. [Google Scholar] [CrossRef] [PubMed]
  3. Lee, S.; Chang, J.-H. Oscillometric blood pressure estimation based on deep learning. IEEE Trans. Ind. Inform. 2017, 13, 461–472. [Google Scholar] [CrossRef]
  4. Salamon, J.; Bello, J.P. Deep convolutional neural networks and data augmentation for environmental sound classification. IEEE Signal Process. Lett. 2017, 24, 279–283. [Google Scholar] [CrossRef]
  5. Shen, D.; Wu, G.; Suk, H.-I. Deep learning in medical image analysis. Annu. Rev. Biomed. Eng. 2017, 19, 221–248. [Google Scholar] [CrossRef] [Green Version]
  6. Ker, J.; Wang, L.; Rao, J.; Lim, T. Deep learning applications in medical image analysis. IEEE Access. 2017, 6, 9375–9389. [Google Scholar] [CrossRef]
  7. Tran, T.; Pham, T.; Carneiro, G.; Palmer, L.; Reid, I. A Bayesian Data Augmentation Approach for Learning Deep Models. In Proceedings of the Conference on Neural Information Processing Systems, Long Beach, CA, USA, 4–9 December 2017; pp. 2794–2803. [Google Scholar]
  8. Zhang, K.; Liu, N.; Yuan, X.; Guo, X.; Gao, C.; Zhao, Z.; Ma, Z. Fine-grained age estimation in the wild with attention LSTM networks. IEEE Trans. Circuits Syst. Video Technol. 2019, 30, 3140–3152. [Google Scholar] [CrossRef] [Green Version]
  9. Chang, D.; Ding, Y.; Xie, J.; Bhunia, A.K.; Li, X.; Ma, Z.; Wu, M.; Guo, J.; Song, Y.-Z. The devil is in the channels: Mutual-channel loss for fine-grained image classification. IEEE Trans. Image Process. 2020, 29, 4683–4695. [Google Scholar] [CrossRef] [Green Version]
  10. Zhang, K.; Sun, M.; Han, T.X.; Yuan, X.; Guo, L.; Liu, T. Residual networks of residual networks: Multilevel residual networks. IEEE Trans. Circuits Syst. Video Technol. 2017, 28, 1303–1314. [Google Scholar] [CrossRef] [Green Version]
  11. Koch, G.; Zemel, R.; Salakhutdinov, R. Siamese Neural Networks for One-Shot Image Recognition. In Proceedings of the International Conference on Machine Learning (ICML), Lille, France, 6–11 July 2015. [Google Scholar]
  12. Ravi, S.; Larochelle, H. Optimization as A Model for Few-Shot Learning. In Proceedings of the International Conference on Learning Representations (ICLR), Toulon, France, 24–26 April 2017. [Google Scholar]
  13. Ren, M.; Triantafillou, E.; Ravi, S.; Snell, J.; Swersky, K.; Tenenbaum, J.B.; Larochelle, H.; Zemel, R.S. Meta-Learning for Semi-Supervised Few-Shot Classification. In Proceedings of the International Conference on Learning Representations (ICLR), Vancouver, BC, Canada, 30 April–3 May 2018. [Google Scholar]
  14. He, A.; Luo, C.; Tian, X.; Zeng, W. A Twofold Siamese Network for Real-Time Object Tracking. In Proceedings of the IEEE/CVF Conference on Computer Vision and Pattern Recognition (CVPR), Salt Lake City, UT, USA, 19–21 June 2018; pp. 4834–4843. [Google Scholar]
  15. Ji, Y.; Yang, Y.; Xu, X.; Shen, H.T. One-shot learning based pattern transition map for action early recognition. Signal Process. 2018, 143, 364–370. [Google Scholar] [CrossRef]
  16. Burrello, A.; Schindler, K.; Benini, L.; Rahimi, A. One-Shot Learning for IEEG Seizure Detection Using End-to-End Binary Operations: Local Binary Patterns with Hyperdimensional Computing. In Proceedings of the IEEE Biomedical Circuits and Systems Conference (BioCAS), Cleveland, OH, USA, 17–19 October 2018; pp. 1–4. [Google Scholar]
  17. Zhao, A.; Balakrishnan, G.; Durand, F.; Guttag, J.V.; Dalca, A.V. Data Augmentation Using Learned Transformations for One-Shot Medical Image Segmentation. In Proceedings of the IEEE/CVF Conference on Computer Vision and Pattern Recognition (CVPR), Long Beach, CA, USA, 16–20 June 2019; pp. 8543–8553. [Google Scholar]
  18. Lee, S.; Chang, J.-H. Deep belief networks ensemble for blood pressure estimation. IEEE Access 2017, 5, 9962–9972. [Google Scholar] [CrossRef]
  19. Lee, S.; Chang, J.-H. Dempster-Shafer fusion based on a deep Boltzmann machine for blood pressure estimation. Appl. Sci. 2019, 9, 1–13. [Google Scholar] [CrossRef] [Green Version]
  20. Akar, S.A.; Kara, S.; Latifoglu, F.; Bilgic, V. Spectral analysis of photoplethysmographic signals: The importance of preprocessing. Biomed. Signal Process. Control 2013, 8, 16–22. [Google Scholar] [CrossRef]
  21. Madhav, K.V.; Ram, M.R.; Krishna, E.H.; Komalla, N.R.; Reddy, K.A. Estimation of Respiration Rate from ECG, BP and PPG Signals Using Empirical Mode Decomposition. In Proceedings of the Instrumentation and Measurement Technology Conference, Binjiang, China, 10–12 May 2011; pp. 1–4. [Google Scholar]
  22. Lazaro, J.; Gil, E.; Bailon, R.; Minchole, A.; Laguna, P. Deriving respiration from photoplethysmographic pulse width. Med. Biol. Eng. Comput. 2013, 51, 233–242. [Google Scholar] [CrossRef]
  23. Nemati, E.; Deen, M.J.; Mondal, T. A wireless wearable ECG sensor for long-term applications. IEEE Commun. Mag. 2012, 50, 36–43. [Google Scholar] [CrossRef]
  24. Thomas, S.S.; Nathan, V.; Soundarapandian, K.; Shi, X.; Jafari, R. BioWatch: A noninvasive wrist-based blood pressure monitor that incorporates training techniques for posture and subject variability. IEEE J. Biomed. Health Inf. 2016, 20, 1291–1300. [Google Scholar] [CrossRef]
  25. McDuff, D.; Gontarek, S.; Picard, R.W. Remote detection of photoplethysmographic systolic and diastolic peaks using a digital camera. IEEE Trans. Biomed. Eng. 2014, 61, 2948–2954. [Google Scholar] [CrossRef]
  26. Gesche, H.; Grosskurth, D.; Kuchler, G.; Patzak, A. Continuous blood pressure measurement by using the pulse transit time: Comparison to a cuff-based method. Eur. J. Appl. Physiol. 2012, 112, 309–315. [Google Scholar] [CrossRef]
  27. Yoon, Y.; Cho, J.H.; Yoon, G. Non-constrained blood pressure monitoring using ECG and PPG for personal healthcare. Med. Syst. 2009, 33, 261–266. [Google Scholar] [CrossRef]
  28. Kumar, S.; Ayub, S. Estimation of Blood Pressure by Using Electrocardiogram (ECG) and Photoplethysmogram (PPG). In Proceedings of the International Conference on Communication Systems and Network Technologies, Dallas-Fort Worth, TX, USA, 13–15 July 2015; pp. 521–524. [Google Scholar]
  29. Deng, L.; Li, J.; Huang, J.-T.; Yao, K.; Yu, D.; Seide, F.; Seltzer, M.; Zweig, G.; He, X.; Williams, J.; et al. Recent Advances in Deep Learning for Speech Research at Microsoft. In Proceedings of the IEEE International Conference on Acoustics, Speech and Signal Processing (ICASSP), Vancouver, BC, Canada, 26–31 May 2013; pp. 8604–8608. [Google Scholar]
  30. Choi, K.; Fazekas, G.; Sandler, M. Convolutional Recurrent Neural Networks for Music classification. In Proceedings of the IEEE International Conference on Acoustics, Speech and Signal Processing (ICASSP), New Orleans, LA, USA, 5–9 March 2017; pp. 2392–2396. [Google Scholar]
  31. Lee, B.-K.; Chang, J.-H. Packet loss concealment based on deep neural networks for digital speech transmission. IEEE/ACM Trans. Audio Speech Lang. Process. 2016, 24, 378–387. [Google Scholar] [CrossRef]
  32. Song, K.; Chang, J.-H. Cuff-less deep learning-based blood pressure estimation for smart wristwatches. IEEE Trans. Inst. Meas. 2020, 69, 4292–4302. [Google Scholar] [CrossRef]
  33. Ahrendt, P. The Multivariate Gaussian Probability Distribution; Technical University of Denmark: Kongens Lyngby, Denmark, 2005. [Google Scholar]
  34. IBM SPSS Statistics for Windows Version 21.0. 2012. Available online: https://www.ibm.com/ (accessed on 25 April 2021).
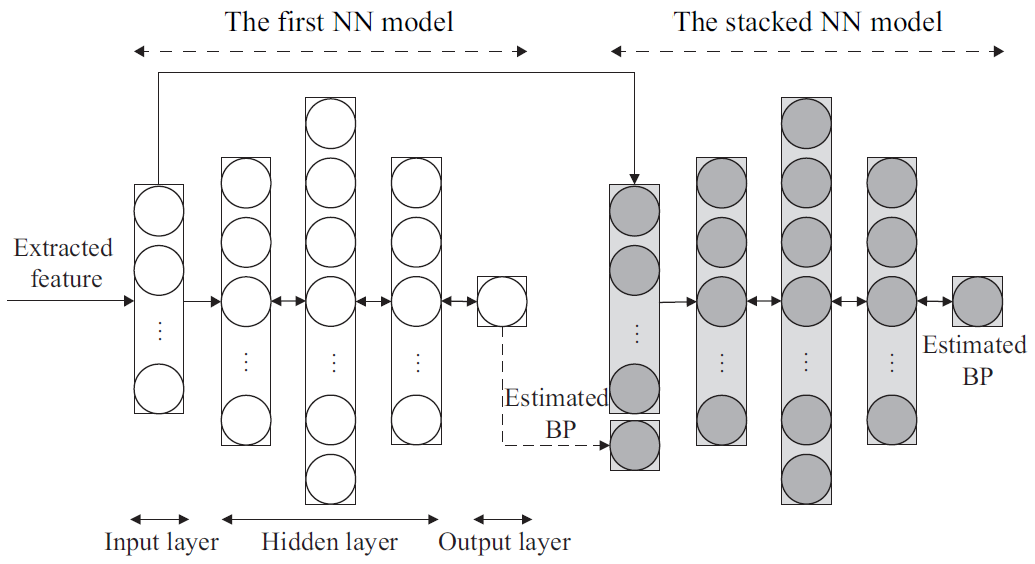
Figure 1. Block diagram of two-stage system based on the stacked NN.
Applsci 11 03923 g001
Figure 2. Block diagram of the bootstrap algorithm.
Applsci 11 03923 g002
Figure 3. Block diagram of the NN-based BPE employing DA-MGD. Abbreviation; multivariate Gaussian distribution generateor (MVGG).
Applsci 11 03923 g003
Figure 4. Data augmentation results for DiaT, PTTf and reference DBP (unit: mmHg). (a,c): the bootstrap algorithm, (b,d): the proposed algorithm.
Applsci 11 03923 g004
Figure 5. Data augmentation results for PTTb, PTTt and reference DBP (unit: mmHg). (a,c): the bootstrap algorithm, (b,d): the proposed algorithm.
Applsci 11 03923 g005
Figure 6. Data augmentation results for TPVP, PWV and reference DBP (unit: mmHg). (a,c): the bootstrap algorithm, (b,d): the proposed algorithm.
Applsci 11 03923 g006
Figure 7. Delineation for strength of the MGD.
Applsci 11 03923 g007
Table 1. Feature extraction information. Abbreviations; pulse transit time (PTT), PTTtop (PTTt), PTTfoot (PTTf), PTTbottom (PTTb), pulse wave velocity (PWV), systolic time (SysT), diastolic time (DiaT), time difference between VPs (TDVP), time difference RPPs (TDRPP).
NoPPG and ECGPPG OnlyECG Only
1 PTTt = P PPG ( n ) P ECG ( n ) SysT = P PPG ( n ) V PPG ( n ) # of RPP
2 PTTf = V PPG ( n ) P ECG ( n ) DiaT = V PPG ( n + 1 ) P PPG ( n ) TDRPP
3 PTTb = S PPG ( n ) P ECG ( n ) # of VP-
4 PWV = d / PTTb TDVP-
Table 2. Experimental results (unit: mmHg) of the proposed algorithm and bootstrap algorithm for estimating the BP using the first NN. Abbreviations; data augmentation (DA), standard deviation of error (SDE), confidence interval (CI).
ItemBPBaseline (without DA)Bootstrap (5 Times)Bootstrap (20 Times)Proposed (50 Subjects*8)Proposed (100 Subjects*8)
MESDEr-ValueMESDEr-ValueMESDEr-valueMESDEr-ValueMESDEr-Value
1 setSBP−4.510.00.370.49.50.33−1.410.20.30−1.87.20.38−4.67.60.41
DBP−4.48.30.42−2.58.70.42−1.28.90.18−3.87.80.43−3.27.70.46
2 setSBP−1.38.40.542.010.00.52−2.59.90.53−1.88.00.57−1.37.80.55
DBP−0.18.20.611.39.30.502.29.20.450.47.70.67−0.27.90.64
3 setSBP1.47.30.43−0.18.20.364.57.80.461.35.20.471.35.10.51
DBP0.06.60.464.37.40.464.77.40.430.46.30.49−1.66.20.48
4 setSBP1.59.70.651.510.00.650.210.70.68−0.78.90.72−1.49.10.73
DBP−3.78.10.731.38.80.660.18.90.66−0.37.50.77−0.77.70.77
5 setSBP1.98.70.504.28.80.530.88.80.491.46.60.561.66.50.57
DBP2.07.10.443.48.10.392.98.00.421.96.60.561.06.60.54
6 setSBP2.07.80.344.97.50.334.57.50.270.04.80.51−0.84.60.48
DBP3.86.50.484.57.60.322.07.70.412.04.60.701.34.60.69
meanSBP0.28.70.472.29.00.451.09.20.46−0.36.80.54−0.96.80.54
DBP−0.47.50.522.18.30.461.88.40.430.16.80.60−0.66.80.60
CISBP2.00.80.11.50.80.12.21.00.11.11.20.11.71.30.1
DBP2.40.60.12.00.60.11.60.60.11.60.90.11.31.00.1
Table 3. Experimental results (unit: mmHg) of the proposed algorithm and bootstrap algorithm for estimating the BP using the stacked NN.
ItemBPBaseline (without DA)Bootstrap (5 Times)Bootstrap (20 Times)Proposed (50 Subjects*8)Proposed (100 Subjects*8)
MESDEr-ValueMESDEr-ValueMESDEr-valueMESDEr-ValueMESDEr-Value
1 setSBP−2.99.20.380.49.20.37−3.410.20.32−2.77.00.40−4.06.30.43
DBP−5.08.10.430.98.50.42−1.88.60.36−2.97.60.46−2.47.50.49
2 setSBP0.48.10.574.19.30.532.29.30.532.27.40.611.37.60.57
DBP0.98.00.64−1.19.10.53−0.78.70.540.37.50.681.77.60.67
3 setSBP1.77.10.450.68.10.380.77.60.461.44.70.501.14.90.51
DBP1.06.20.484.07.20.463.77.20.44−1.35.90.530.96.10.49
4 setSBP0.79.50.670.99.70.691.99.90.67−0.68.70.74−2.99.00.73
DBP0.97.80.751.58.50.691.28.70.660.27.10.791.07.50.77
5 setSBP2.78.30.542.88.50.542.38.50.510.96.40.58−0.96.10.63
DBP1.76.90.480.47.90.401.37.80.421.86.40.581.56.30.59
6 setSBP2.47.50.342.37.10.352.97.20.290.63.90.66−0.84.30.56
DBP3.36.30.530.97.30.451.77.30.440.54.00.781.04.30.74
meanSBP0.88.30.491.98.70.481.18.80.460.36.40.58−1.06.40.57
DBP0.57.20.551.18.10.490.98.10.48−0.26.40.640.66.60.63
CISBP1.60.70.11.10.70.11.80.90.11.31.40.11.61.30.1
DBP2.20.70.11.30.60.11.50.50.11.31.00.11.21.00.1
Publisher’s Note: MDPI stays neutral with regard to jurisdictional claims in published maps and institutional affiliations.