Abstract
The effects of die radius in a streamlined die on design factors, such as the distribution of strain, stress, temperature, damage, and drawing force of a wire, were investigated during wire drawing for a better understanding of streamlined die and improvement in drawing quality of the wire. A numerical simulation was performed with the die radius of the streamlined die. The behavior of the design factors of the drawn wire fabricated by the streamlined die was different from that of the conventional die and was highly dependent on the die radius. The different behaviors of the design factors with the die radius can be explained by the frictional work and redundant work of the wire with die angle. The temperature rise and drawing force were high at a greater die radius because of the great frictional stress and heating effect stemming from the high contact length of the wire and die. Meanwhile, the higher redundant work at the surface area with decreasing die radius led to higher strain inhomogeneity, effective stress, damage value, temperature rise, and drawing force due to the abrupt change in the metal flow of the wire stemming from the high die angle. After the optimization of several design factors with die radius, it was concluded that the optimum IDR values ranged from 0.14 to 0.18, indicating that a streamlined die with a radius of 70 to 90 mm was the most suitable in the present process condition. In particular, the damage value of the wire was reduced in this range of die radii compared to the conventional die.
1. Introduction
The need to reduce the weight of cars has led to an increasing market demand for high-strength steel wire, rod, and bar products for automotive applications. Wire drawing is an essential process for manufacturing wire, rod, and bar products because the desired strength, shape, and size of the products are effectively obtained through the wire drawing process [1,2]. There are four main issues in the wire-drawing industry when considering the manufacturing process. The first is to minimize the drawing energy for the process [3,4]. The second issue is to reduce the strain inhomogeneity of the wire along the radial direction during the drawing process [5,6]. The third is to decrease the occurrence of fracture rate, surface defects, and central bursts [7,8,9]. The fourth issue is to increase the die life [10,11]. Although the properties of the drawn wire have complex interactions with several process parameters, three process parameters in particular can affect the abovementioned four issues during wire drawing: reduction of area (RA) per pass, die angle, and friction at the wire–die interface. Therefore, many researchers have investigated the influence of RA per pass [6,12,13], die angle [14,15,16], and friction at the wire–die interface [17,18] on the drawing force, strain inhomogeneity, defects, and die life.
Although the above three process parameters are highly correlated to each other, the die angle is a key parameter affecting the wire quality and manufacturing process because it primarily controls the contact length between the wire and die [5,19,20]. In addition, the die angle is relatively easy to control in the industrial plants. Castro et al. [14] reported the effect of the die angle on the mechanical properties of a copper alloy during wire drawing. They showed that both the yield and tensile strength increased with increasing die angle, whereas the elongation decreased. Majzoobi et al. [19] showed the relationship between the die angle, RA per pass, and friction coefficient using both experimental and numerical approaches. They found that the optimum die angle increased with increasing RA per pass and friction coefficient. Kraft et al. [16] investigated the effect of the die angle on the texture of a copper wire during the drawing process. They reported that the ratio of the (111) and (200) texture decreases with an increasing die angle, which means that a higher die angle leads to an increase in the randomly oriented grain structure. Chin and Stelf [20] studied the influence of the die angle, RA per pass, and friction coefficient on the strain inhomogeneity of the wire during the process. Their results showed that the die angle and RA per pass strongly affect the stain inhomogeneity of the wire, and the effect of the friction coefficient plays only a minor role in determining the strain distribution of the wire. Most of the studies on the die angle effect during wire drawing have focused on a constant die angle, as shown in Figure 1a. Based on the author’s experiences, the drawing process with a constant die angle explained above has some limitations in improving the quality of wire rod products [21]. Therefore, it is necessary to investigate the influence of curved or streamlined dies (Figure 1b–d) on the drawing performance to improve the drawability and wire properties. Figure 1e shows the variations in die angle along the drawing direction for the dies shown in Figure 1a–d. The die angle of the three streamlined dies changed along the drawing direction.
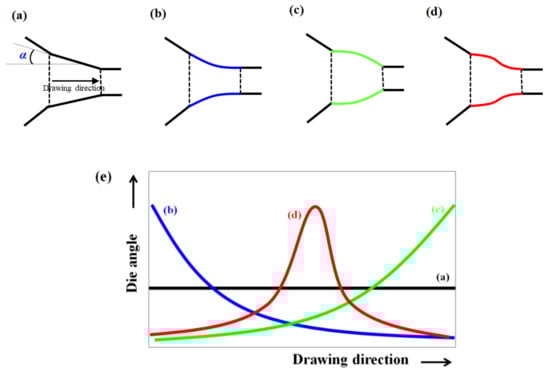
Figure 1.
Schematic explanation of (a) the conventional die, (b–d) streamlined dies, and (e) the variations in die angle along the drawing direction during wire drawing.
There are several studies on the use of streamlined or curved dies during the wire drawing process [21,22,23,24,25]. Devenpeck and Richmond [22] reported that a sigmoid-shaped die provides better fatigue life and ductility of the specimen compared to the conventional die during the strip drawing process. They also showed that the sigmoid-shaped die has a larger interface between the specimen and die than the conventional die. Nowotynska and Kut [24] investigated the effect of die shape on die wear during wire drawing. Their results showed that the streamlined die decreases die wear because it decreases the concentration of die pressure during wire drawing. Zhang et al. [25] analyzed the twin parabolic die for wire drawing using the upper bound analysis.
Although there are some studies on the streamlined die as mentioned above, no study has reported a comprehensive investigation of streamlined dies compared to the conventional die. From a practical point of view, the results are thus difficult to apply in industrial fields. Therefore, the present study focuses on investigating the effects of streamlined dies on the distribution of strain, stress, temperature, drawing force, and damage value of wire during wire drawing, for a better understanding of streamlined die and an improvement in the drawing quality of wire. In addition, from a practical point of view, it is necessary to find the optimum design for a streamlined die considering all the design factors. A numerical simulation was performed for streamlined dies with various die radii. To validate the accuracy of the numerical model used in this study, a wire drawing test was also conducted using the conventional die, and the drawing force and center temperature of the wire obtained from the experiment and those obtained by numerical simulation were compared. Finally, the strain, stress, damage value, temperature, and drawing force were compared as a function of the die radius of the streamlined die during wire drawing to derive a design concept for better quality of wire, rod, and bar products.
2. Experimental and Numerical Procedures
2.1. Experimental Procedure
A twinning-induced plasticity (TWIP) steel billet was fabricated by vacuum induction method. Its analyzed chemical composition by spark optical emission spectrometer (S-OES) was Fe-20.01Mn0.65C0.95Al (wt.%). The as-cast billet was homogenized at 1200 °C for 9 h in a reheating furnace, and then directly hot-rolled into a plate with a final thickness of 20 mm. The temperature range was from 950 °C to 1150 °C during the hot rolling process. After rolling, the thick plate was naturally cooled in air at room temperature (RT, 21 °C) to simulate the rod rolling process.
The hot-rolled plate was subsequently machined into round bars with a diameter of 13 mm and a length of 400 mm for the wire drawing test. At RT, the bars were drawn from a diameter of 13 mm to 11.63 mm at a die angle of 6° and a constant pulling speed of 16.7 mm/s using a drawbench machine, as schematically shown in Figure 2. Prior to drawing, chemical pickling with diluted HCl solution was applied to the wire surface, and then a spray-type lubricant with MoS2 was used on the wire surface. The RA per pass was calculated using the area (A) reduction of the wire during the process as follows:
where the subscripts i and f indicate the before and after values in the wire which undergoes the drawing process, respectively. Accordingly, the RA per pass used in this study was approximately 20%.
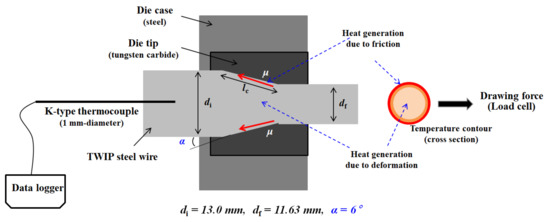
Figure 2.
Schematic of the wire drawing process and terminology used in this study.
The temperature at the center area was measured using a K-type thermocouple with a diameter of 1 mm, as schematically shown in Figure 2 [26]. The drawing force measurement was also performed using an installed load cell in the drawbench machine. Tensile tests were conducted at an initial strain rate of 10–3 s–1 using an Instron tension machine at RT. A round-type tensile specimen with gauge dimensions of 5 mm in diameter and 25 mm in length was used [27].
2.2. Numerical Procedure
Depending on the process parameters, a wire undergoes inhomogeneous deformation during wire drawing [12,28]. In addition, owing to the heat generated by the plastic deformation of the wire and the frictional heating between the wire and die, the temperature rise varies with the wire area during the wire drawing process [29]. In other words, a complex distribution of stain, stress, and temperature occurs with area of the wire during wire drawing. Therefore, finite element (FE) analysis was utilized to evaluate the temperature, stress, and strain distributions of the drawn wire because it provides reliable results for temperature and deformation distribution in a deformed specimen. DEFORM FE commercial software with version 11.0 (Scientific Forming Technologies Corporation, Columbus, OH, USA) was used to simulate the wire drawing process. Taking advantage of the axisymmetric nature of the wire drawing process, a two-dimensional axisymmetric module was selected to reduce the computational cost. In addition, a rather short workpiece length of 100 mm was chosen based on several length tests to keep the calculation time low. The initial 13 mm-diameter wires were drawn to 11.63 mm using the conventional die and the four streamlined dies with die radii of 4, 16, 64, and 128 mm as shown in Figure 3. The conventional die can be considered a streamlined die with an infinite die radius, which is referred to as “inf.” hereafter. The total number of elements in the wire was approximately 12,000. The die and wire were assumed to be a rigid body and isotropic material, respectively. The elastic behavior of the die and wire was not considered in this simulation since wire drawing is a bulk-forming process with a large plastic deformation. Accordingly, the constitutive behavior of the wire can typically be described using Hollomon’s law as follows:
where K is the strain-hardening coefficient and n refers to the strain-hardening exponent. The K and n values were derived by curve fitting of the RT tensile curve, as shown in Figure 4: σ = 1934ε0.46 MPa. The following shear friction model was used in this study because the wire drawing process results in the formation of relatively high pressure,
where τ and k are the shear stress on the contact surface and the shear yield stress of the material, respectively. The shear friction factor (m) in the wire–die interface was chosen to be 0.1 [30,31], and other process conditions and physical properties were kept similar to the real experiments. The ambient and initial wire temperatures were approximately 21 °C. The temperature rise (ΔT) during wire drawing was numerically calculated using the following equation [32,33]:
where Q, ρ, Cp, and β refer to the heat energy, density, specific heat capacity, and fraction factor from mechanical work to heat energy, respectively. These values are listed in Table 1 based on references [32,34,35]. β is assumed to be 0.9 because the mechanical energy stored within the deformed wire as elastic energy is small [32,33]. In this study, the thermal properties of the wire and die were assumed to be constant because of the relatively small temperature change of the wire and die during the process: from 20 to 150 °C.
τ = mk
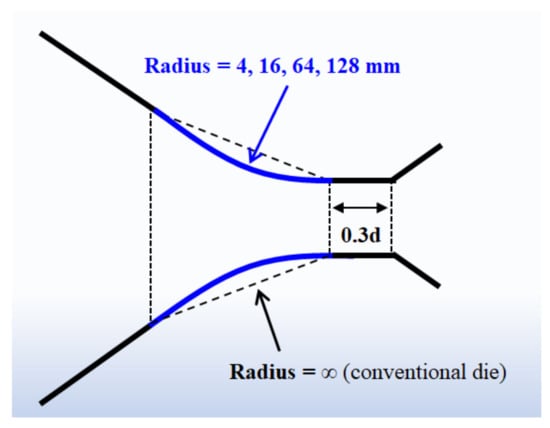
Figure 3.
Schematic explanation of die geometry used in this study.

Figure 4.
True stress–strain curve of the hot-rolled TWIP steel.

Table 1.
Thermal properties of wire and die used in this simulation.
3. Validation of Numerical Model
Prior to analyzing the results of the numerical simulation, the accuracy of the numerical model used in this study was validated by comparing the numerically simulated results with the measured ones in the TWIP steel wire during the conventional wire drawing process.
Figure 5a compares the drawing force of the TWIP steel wire based on experiments and numerical simulations. The drawing force obtained by the numerical simulation is in good agreement with the experimental value. Figure 5b compares the measured and numerically simulated center temperatures of the wire. As expected, the center temperature increased along the drawing direction. The center temperature obtained by numerical simulation was also in good agreement with the experimental steady-state center temperature. However, it was found that the measured center temperature was slightly lower than the simulated temperature. This inconsistency is related to the applied m and β values used in this study.
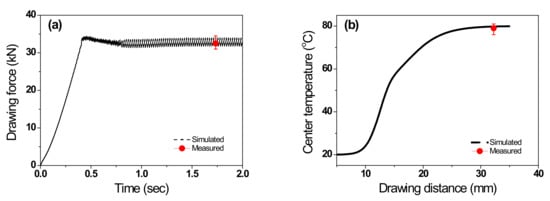
Figure 5.
Comparison of measured and simulated (a) drawing force and (b) center temperature of the wire during the conventional wire drawing process used in this study.
Meanwhile, the present results also need to be confirmed by some experimental data with streamline die because the validation of the model was only conducted using the conventional die. However, it is known that if the model is verified under one simple condition, it can be used in other similar situations. In this respect, the strain, stress, temperature, and drawing force of the wire drawn with streamlined dies can be predicted using this model because the drawing condition using the conventional die belongs to one of the streamlined die conditions. Overall, from an engineering application point of view, it can be concluded that the proposed FE analysis for the wire drawing process is suitable for evaluating the characteristics of strain, stress, temperature, damage value, and drawing force with the die shape.
4. Results
4.1. Comparison of Strain
As shown in Figure 6, the effective strain of the wire increased with the distance from the center regardless of the die radius [36]. However, the effective strain profiles were quite different depending on the die radius, as shown in Figure 7a. As the die radius increased, the uniformity of the effective strain of the wire increased along the radial direction. The effective strain of the wire fabricated by the die with a radius of 128 was more uniform than that of the wire manufactured by the conventional die. Furthermore, the effective strain of the wire by the die with a radius of 64 was similar to that of the wire by the conventional die. Regardless of the die shape, the center area had a similar theoretically calculated effective strain (ε) based on the nominal area reduction using the following Equation:
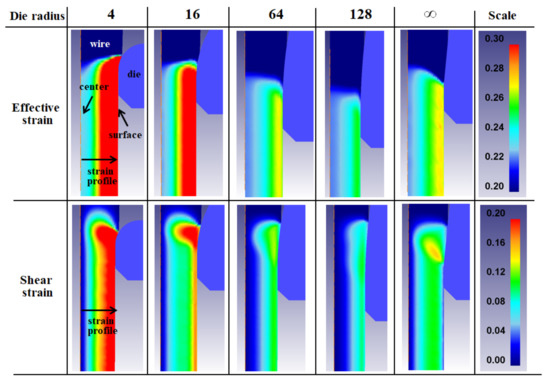
Figure 6.
Comparison of contour in effective strain and shear strain of the wire with the die radius.
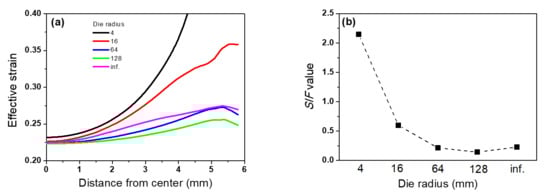
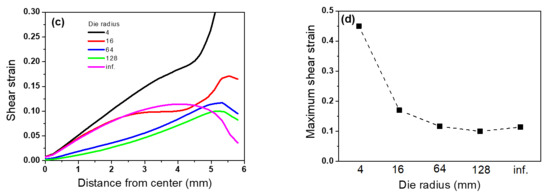
Figure 7.
Comparison of (a) effective strain profile along the radial direction, (b) SIF value, (c) shear strain profile along the radial direction, and (d) the maximum shear strain of the wire with the die radius.
To evaluate the level of inhomogeneity with the die radius, the strain inhomogeneity factor (SIF) was calculated using the following equation:
where Smax and Smin are the maximum and minimum effective strains, respectively. As shown in Figure 7b, the SIF decreased with increasing die radius, and the specimens subjected to the 128-radius die had the smallest deviation of effective strain, indicating that a larger die radius improves the homogeneity of the wire along the radial direction.
Figure 6 also compares the shear strain of the wire with the die radius. The profiles of shear strain along the radial direction exhibited a pattern similar to that of the effective strain, as shown in Figure 7c. All wires had the maximum shear strain near the surface and the minimum shear strain at the center, which is consistent with the results of a previous study [37]. The shear strain of the wire increased with decreasing die radius because additional redundant work in the surface area was restrained with increasing the die radius [38]. In addition, the shear strain of the wire fabricated by the die with a radius of 128 was more uniform than that of the wire manufactured by the conventional die, which is confirmed by the result of the maximum shear strain with the die radius as shown in Figure 7d.
4.2. Comparison of Stress and Damage
Figure 8 compares the contour of the effective stress of the wire with the die radius. The stress was concentrated at the surface area with decreasing die radius. The wire using the die with a radius of 64 had a similar contour of effective stress to the wire using the conventional die. The die with a radius of 128 improved the stress distribution of the wire compared to the conventional die, which is also confirmed by the comparison of the maximum effective stress, as shown in Figure 9a.
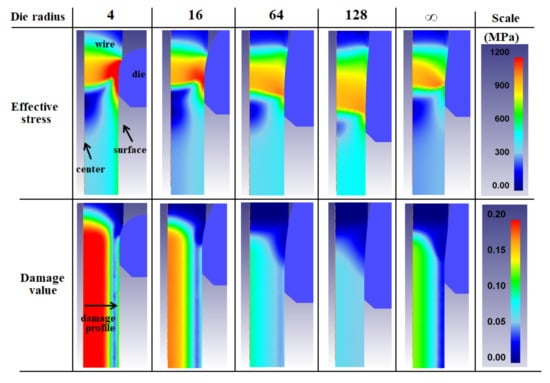
Figure 8.
Comparison of contour in effective stress and damage value of the wire with the die radius.
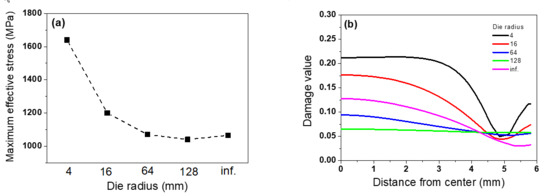
Figure 9.
Comparison of (a) the maximum effective stress and (b) damage value along the radial direction of the wire with the die radius.
It is necessary to analyze the damage value of the workpiece during the plastic forming process to evaluate the formability. The normalized Cockcroft and Latham fracture criterion [39,40] was applied in this study using the following equation:
where σ* is the highest tensile stress and is the effective stress. Figure 8 compares the damage values of the wire for different values of die radius. The center area had the highest damage value, and the surface area had the minimum value regardless of the die radius. The damage value decreased with increasing die radius, as shown in Figure 9b. For example, the wires manufactured by dies with radii of 4 and 16 had higher damage values compared to the conventional die, and the wires manufactured by the dies with radii of 64 and 128 had lower damage values compared to the conventional die. In particular, the damage value of the wire using the die with a radius of 128 was significantly reduced compared to that of the conventional die, and the profile of the damage value by the die with a radius of 128 was uniform along the radial direction of the wire.
4.3. Comparison of Temperature and Drawing Force
It is important to calculate the temperature distribution of the wire during wire drawing because the microstructures and mechanical properties depend on the temperature during the forming process [41]. Figure 10 shows the temperature contour and profile with the die radius. During the wire drawing process, the temperature rise originates from two factors, as shown in Figure 2: the frictional stress at the wire–die interface and the heat generation stemming from the plastic deformation of the wire [1]. Thus, the surface area of the wire had a higher temperature compared to the center area regardless of the die radius because of the surface heating of the wire stemming from the frictional stress at the wire–die interface. The center temperature increased in a parabolic manner during the drawing process (Figure 10b). Meanwhile, the behavior of the temperature rise showed a complex relationship with the die radius. The temperature rise of the wire was high when dies with a low radius were used, and it was also high when dies with a high radius were used. For example, the minimum temperature rise among the streamlined dies occurred in the wire manufactured by the die with a radius of 64. Interestingly, the temperature rise was lowest in the wire by the conventional die as shown in Figure 10c.
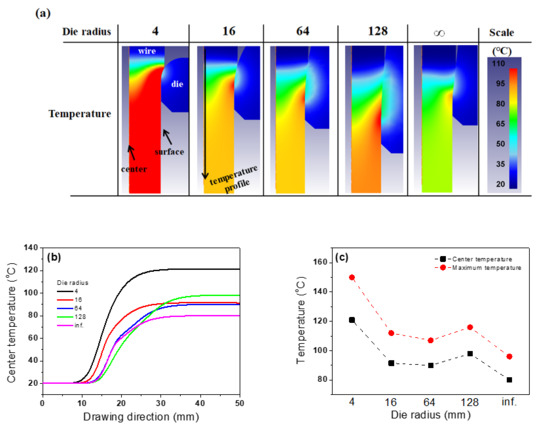
Figure 10.
Comparison of (a) temperature contour, (b) history of center temperature along the drawing direction, and (c) the steady-state center temperature and the maximum temperature of the wire with the die radius.
Figure 11 compares the drawing force with the die radius. It was observed that the drawing force had a similar pattern to the temperature rise with the die radius. The wire manufactured by the die with a radius of 128 exhibited the maximum drawing force owing to the greater contact length of the wire and die, and the conventional die had the minimum drawing force.

Figure 11.
Comparison of (a) history of drawing force along the drawing direction and (b) the steady-state drawing force with the die radius.
5. Discussion
To produce high-quality wires, it is necessary to derive a practical strategy based on the results achieved in the above comparative study using FE analysis. To derive practical solutions, we need to consider all design factors, such as strain and stress distribution, temperature rise, drawing force, and damage value. A new non-dimensional indicator for the die radius (IDR) was defined as follows to deduce general conclusions by considering several design factors:
where Rdie is the die radius and dm is the mean diameter of the wire, which is represented as follows:
The calculated IDR values are summarized in Table 2 based on the die radius. Figure 12 shows the variations in the SIF value, maximum shear stress, maximum effective stress, maximum damage value, temperature rise, and drawing force with the IDR value. Roughly, all design factors increased with the IDR value. For example, the wire by the die with a radius of 4 had the highest SIF value, shear stress, effective stress, damage value, and temperature rise. However, in the domain of a small IDR value, the design factors did not follow macroscopic trends. For instance, the wire fabricated by the die with a radius of 128 had the smallest SIF value, shear stress, effective stress, and damage value, but it had a higher temperature rise and drawing force, which means that the optimal die design exists around this IDR value.
Table 2.
Die radius and related IDR value used in this study.

Figure 12.
Variations in (a) SIF value, (b) maximum shear strain, (c) maximum effective stress, (d) maximum damage value, (e) temperature rise, and (f) drawing force of a wire with IDR.
To understand the behavior of design factors with IDR value and determine the optimal die design, the drawing behavior of the wire by streamlined die needs to be understood. The effect of the die radius on the design factors is highly related to the die angle (α) during wire drawing, as shown in Figure 1e. Additionally, the die angle controlled the contact length (lc) of the wire and die. According to the geometry of the conventional die (Figure 2), lc can be represented as follows:
Figure 13 shows the normalized lc with the die angle for the conventional die. As the die angle increases, the lc decreases sharply. A high lc indicates a larger frictional stress or frictional heating due to the longer contact distance of the wire and die in the deformation zone of the die. In contrast, a low lc indicates a higher redundant deformation and surface hardening because of the abrupt and excessive direction change of the metal flow in the deformation zone of the die (Figure 14) [38]. As shown in Figure 6, as the die radius increases, the die angle decreases, leading to an increase in lc. From the lc perspective, the behavior of design factors can be understood. The temperature rise and drawing force were high at a higher die radius (small IDR value) because of the great frictional stress and heating effect stemming from the high lc.
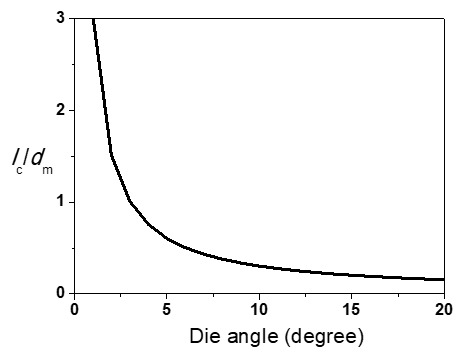
Figure 13.
Calculated contact length of wire and die with die angle in the conventional die used in this study.
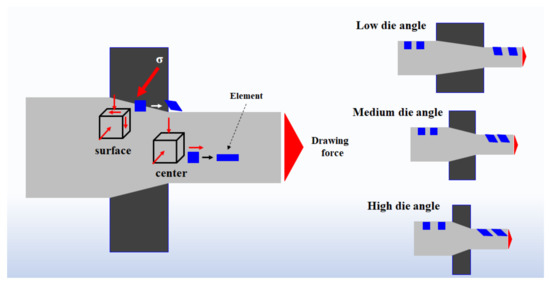
Figure 14.
Schematic of redundant work at the surface area of the drawn wire with the die angle.
In contrast, the higher SIF value, effective stress, damage value, and temperature rise were highly related to the unsound metal flow or redundant work at the surface area [38,42]. As shown in Figure 14, the grid of the wire, especially at the surface area, was distorted from the rectangular shape in the deformation zone during wire drawing, and the amount of distortion of the grid increased as the die angle increased or the die radius decreased. That is, the wire around the surface area had a shearing strain or internal distortion due to the conical shape of the die during the wire drawing process, which is related to the redundant work. The redundant work increased with decreasing die radius. A higher redundant effect at the surface area with increasing IDR value led to a higher SIF value, effective stress at the surface area, damage value at the center area, temperature rise, and drawing force as shown in Figure 12. In contrast, a greater frictional effect at the surface area with decreasing IDR value led to a higher temperature rise and drawing force. Therefore, the optimum combination of die design can be derived from the IDR value by optimizing the effects of metal flow and lc. For instance, the temperature rise increased with increasing lc in a small IDR region due to the greater frictional effect, and then decreased with decreasing lc in a medium IDR region owing to the smaller frictional effect, followed by increased with decreasing lc in a higher IDR region due to the higher redundant work effect. Figure 15 shows a schematic of the variations in various design factors with IDR value. The SIF value, maximum shear stress, maximum effective stress, maximum damage value, temperature rise, and drawing force must be minimized by optimizing the design factors. Based on the results in Figure 15, the optimum IDR values ranged from 0.14 to 0.18, indicating that a streamlined die with a radius of 70 to 90 mm was most suitable in the present process condition using Equation (8). That is, the optimum die radius varied with wire size, but suitable die radius can be determined regardless of wire size using Equation (8).
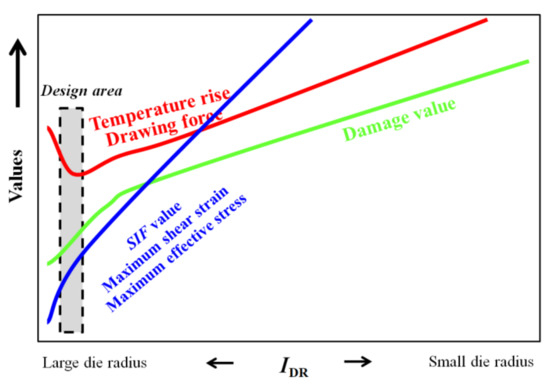
Figure 15.
Schematic description of variations in various design factors with IDR.
Interestingly, we can reduce the damage value of the wire in this range of die radii compared to the conventional die (Figure 9b). The damage value was highly dependent on the highest tensile stress of the wire, as shown in Equation (7), because the normalized Cockcroft and Latham fracture criterion [40] was used in this study. It is known that the principal stress in the center area is the tensile stress state during wire drawing, and the stress in the center area is higher than that of the surface area [43], indicating that the center area exhibited the higher damage value, as shown in Figure 8. As the die angle decreased or the die radius increased, the strain distribution was more uniform along the radial direction of the wire, as shown in Figure 7. This means that the principal stress was also uniform with increasing die radius, leading to the low damage value in the center area of the wire. Overall, the damage value increased with decreasing die radius or increasing IDR, as shown in Figure 12d. The proposed design concept can provide process engineers with practical seeding ideas to select the optimal die design for high-quality drawn wire, which can be beneficial for industrial plants. The practical strategy was valid for most metals because it was derived from the general conditions of plastic deformation. In addition, it is noted that the effects of a streamlined die on the residual stress of the wire during wire drawing should be considered to obtain a wire with higher fatigue resistance. In this respect, further research is necessary.
6. Conclusions
Based on the findings presented in this study, the following conclusions are drawn:
- The distribution of design factors such as strain, stress, temperature rise, damage value, and drawing force of the wire fabricated by the streamlined die was different from that of the wire manufactured by the conventional die during wire drawing. Furthermore, the behavior of the design factors of the wire fabricated by the streamlined die was highly dependent on the die radius.
- The different behaviors of the design factors in the wire manufactured by the streamlined die can be explained by the frictional work and redundant work with die angle. The temperature rise and drawing force were high at a higher die radius (small IDR value) because of the great frictional stress and heating effect stemming from the high contact length of the wire and die. Additionally, the higher redundant work at the surface area with decreasing die radius (large IDR value) led to a higher SIF value, effective stress at the surface area, damage value at the center area, temperature rise, and drawing force due to the abrupt change in the metal flow of the wire stemming from the high die angle.
- After the optimization of several design factors, it is concluded that the optimum IDR values range from 0.14 to 0.18, indicating that a streamlined die with a radius of 70–90 mm was the most suitable in the present process condition. In particular, the damage value of the wire was reduced in this range of die radii compared to the conventional die. The proposed design concept can provide process engineers with practical seeding ideas to select the optimal die design for high-quality wires.
Author Contributions
J.-K.H. designed and performed the experiments, analyzed data, and wrote the paper. The author has read and agreed to the published version of the manuscript.
Funding
This work was supported by the National Research Foundation of Korea (NRF) grant funded by the Korea government (MSIT, South Korea) (Grant No. 2018R1D1A1B07050103).
Conflicts of Interest
The author declares no conflict of interest.
References
- Wright, R.N. Wire Technology: Process Engineering and Metallurgy; Butterworth-Heinemann: Oxford, UK, 2011. [Google Scholar]
- Nishida, S.; Yoshie, A.; Imagumbai, M. Work Hardening of Hypereutectoid and Eutectoid Steels during Drawing. ISIJ Int. 1998, 38, 177–186. [Google Scholar] [CrossRef][Green Version]
- Siegert, K.; Möck, A. Wire drawing with ultrasonically oscillating dies. J. Mater. Process. Technol. 1996, 60, 657–660. [Google Scholar] [CrossRef]
- Luis, C.J.; Leon, J.; Luri, R. Comparison between finite element method and analytical methods for studying wire drawing processes. J. Mater. Process. Technol. 2005, 164–165, 1218–1225. [Google Scholar] [CrossRef]
- Sadok, L.; Luksza, J.; Majta, J. Inhomogeneity of mechanical properties in stainless steel rods after drawing. J. Mater. Process. Technol. 1994, 44, 129–141. [Google Scholar] [CrossRef]
- Hwang, J.K.; Son, I.H.; Yoo, J.Y.; Zargaran, A.; Kim, N.J. Effect of reduction of area on microstructure and mechanical properties of twinning-induced plasticity steel during wire drawing. Met. Mater. Int. 2015, 21, 815–822. [Google Scholar] [CrossRef]
- Haddi, A.; Imad, A.; Vega, G. The influence of the drawing parameters and temperature rise on the prediction of chevron crack formation in wire drawing. Int. J. Fract. 2012, 176, 171–180. [Google Scholar] [CrossRef]
- Avitzur, B. Analysis of central bursting defects in extrusion and wire drawing. J. Eng. Ind. 1968, 90, 79–90. [Google Scholar] [CrossRef]
- Hwang, J.K. Effects of process conditions, material properties, and initial shape of flaw on the deformation behavior of surface flaw during wire drawing. ISIJ Int. 2019, 59, 2052–2061. [Google Scholar] [CrossRef]
- Kim, T.H.; Kim, B.M.; Choi, J.C. Prediction of die wear in the wire-drawing process. J. Mater. Process. Technol. 1997, 65, 11–17. [Google Scholar] [CrossRef]
- Takada, M.; Matsubara, H.; Kawagishi, Y. Wear of cemented carbide dies for steel cord wire drawing. Mater. Trans. 2013, 54, 2011–2017. [Google Scholar] [CrossRef]
- Hasani, G.H.; Mahmudi, R.; Karimi-Taheri, A. On the strain inhomogeneity in drawn copper wires. Int. J. Mater. Form. 2010, 3, 59–64. [Google Scholar] [CrossRef]
- GVK, S.S.; Tan, M.J.; Liu, Z. Influence of drawing practices on the mechanical, texture and work hardening characteristics of Co-Cr-Ni-Mo wires. Mater. Sci. Eng. A 2018, 713, 94–104. [Google Scholar] [CrossRef]
- De Castro, A.L.R.; Campos, H.B.; Cetlin, P.R. Influence of die semi-angle on mechanical properties of single and multiple pass drawn copper. J. Mater. Process. Technol. 1996, 60, 179–182. [Google Scholar] [CrossRef]
- Masse, T.; Fourment, L.; Montmitonnet, P.; Bobadilla, C.; Foissey, S. The optimal die semi-angle concept in wire drawing, examined using automatic optimization techniques. Int. J. Mater. Form. 2013, 6, 377–389. [Google Scholar] [CrossRef]
- Kraft, F.F.; Chakkingal, U.; Baker, G.; Wright, R.N. The effects of die angle on texture and annealing response of ETP copper wire. J. Mater. Process. Technol. 1996, 60, 171–178. [Google Scholar] [CrossRef]
- El-Domiaty, A.; Kassab, S.Z. Temperature rise in wire-drawing. J. Mater. Process. Technol. 1998, 83, 72–78. [Google Scholar] [CrossRef]
- Haddi, A.; Imad, A.; Vega, G. Analysis of temperature and speed effects on the drawing stress for improving the wire drawing process. Mater. Des. 2011, 32, 4310–4315. [Google Scholar] [CrossRef]
- Majzoobi, G.H.; Saniee, F.F.; Aghili, A. An investigation into the effect of redundant shear deformation in bar drawing. J. Mater. Process. Technol. 2008, 201, 133–137. [Google Scholar] [CrossRef]
- Chin, R.K.; Stelf, P.S. A computational study of strain inhomogeneity in wire drawing. Int. J. Mach. Tools Manuf. 1995, 35, 1087–1098. [Google Scholar] [CrossRef]
- Richmond, O.; Morrison, H.L. Streamlined wire drawing dies of minimum length. J. Mech. Phys. Solids 1967, 15, 195–203. [Google Scholar] [CrossRef]
- Devenpeck, M.L.; Richmond, O. Strip-drawing experiments with a sigmoidal die profile. J. Eng. Ind. 1965, 87, 425–428. [Google Scholar] [CrossRef]
- Lo, S.W.; Lu, Y.H. Wire drawing dies with prescribed variations of strain rate. J. Mater. Process. Technol. 2002, 123, 212–218. [Google Scholar] [CrossRef]
- Nowotyńska, I.; Kut, S. The influence of Die Shape and Back Tension Force on its Wear in the Process of Wire Drawing. Arch. Metall. Mater. 2019, 64, 1131–1137. [Google Scholar]
- Zhang, S.H.; Chen, X.D.; Zhou, J.; Zhao, D.W. Upper bound analysis of wire drawing through a twin parabolic die. Meccanica 2016, 51, 2099–2110. [Google Scholar] [CrossRef]
- Hwang, J.K. The temperature distribution and underlying cooling mechanism of steel wire rod in the Stelmor type cooling process. Appl. Therm. Eng. 2018, 142, 311–320. [Google Scholar] [CrossRef]
- Hwang, J.K. Effects of diameter and preparation of round shaped tensile specimen on mechanical properties. Mater. Sci. Eng. A 2019, 763, 138119. [Google Scholar] [CrossRef]
- Zottis, J.; Diehl, C.A.T.S.; Rocha, A.S. Evaluation of experimentally observed asymmetric distributions of hardness, strain and residual stress in cold drawn bars by FEM-simulation. J. Mater. Res. Technol. 2018, 7, 469–478. [Google Scholar] [CrossRef]
- Lee, S.K.; Kim, D.W.; Jeong, M.S.; Kim, B.M. Evolution of axial surface residual stress in 0.82 carbon steel wire during multi pass drawing process considering heat generation. Mater. Des. 2012, 34, 363–371. [Google Scholar] [CrossRef]
- Hwang, S.K.; Baek, H.M.; Lee, J.W.; Son, I.H.; Im, Y.T.; Bae, C.M. The effect of microstructure and texture evolution on mechanical properties of low carbon steel in a non-circular drawing sequence. J. Mater. Process. Technol. 2014, 214, 318–325. [Google Scholar] [CrossRef]
- Baek, H.M.; Hwang, S.K.; Joo, H.S.; Im, Y.T.; Son, I.H.; Bae, C.M. The effect of a non-circular drawing sequence on delamination characteristics of pearlitic steel wire. Mater. Des. 2014, 62, 137–148. [Google Scholar] [CrossRef]
- Curtze, S.; Kuokkala, V.T. Dependence of tensile deformation behavior of TWIP steels on stacking fault energy, temperature and strain rate. Acta Mater. 2010, 58, 5129–5141. [Google Scholar] [CrossRef]
- Yang, H.K.; Zhang, Z.J.; Dong, F.Y.; Duan, Q.Q.; Zhang, Z.F. Strain rate effects on tensile deformation behaviors for Fe-22Mn-0.6C-(1.5Al) twinning-induced plasticity steel. Mater. Sci. Eng. A 2014, 607, 551–558. [Google Scholar] [CrossRef]
- Felder, E.; Levrau, C.; Mantel, M.; Truong Dinh, N.G. Identification of the work of plastic deformation and the friction shear stress in wire drawing. Wear 2012, 286–287, 27–34. [Google Scholar] [CrossRef]
- Neu, R.W. Performance and characterization of TWIP steels for automotive applications. Mater. Perform. Charact. 2013, 2, 244–284. [Google Scholar] [CrossRef]
- Lin, H.S.; Hsu, Y.C.; Keh, C.C. Inhomogeneous deformation and residual stress in skin-pass axisymmetric drawing. J. Mater. Process. Technol. 2008, 201, 128–132. [Google Scholar] [CrossRef]
- Hwang, J.K. Drawing direction effect on microstructure and mechanical properties of twinning-induced plasticity steel during wire drawing. J. Mater. Eng. Perform. 2019, 28, 2834–2844. [Google Scholar] [CrossRef]
- Hosford, W.F.; Caddell, R.M. Metal Forming: Mechanics and Metallurgy, 3rd ed.; Cambridge University Press: Cambridge, UK, 2007. [Google Scholar]
- Cockcroft, M.G.; Latham, D.J. Ductility and the workability of metals. J. Inst. Met. 1968, 96, 33–39. [Google Scholar]
- Oh, S.I.; Chen, C.C.; Kobayashi, S. Ductile Fracture in Axisymmetric Extrusion and Drawing—Part 2: Workability in Extrusion and Drawing. J. Manuf. Sci. Eng. 1979, 101, 36–44. [Google Scholar] [CrossRef]
- Karimi Taheri, A.; Maccagno, T.M.; Jonas, J.J. Dynamic Strain Aging and the Wire Drawing of Low Carbon Steel Rods. ISIJ Int. 1995, 35, 1532–1540. [Google Scholar] [CrossRef]
- Caddell, R.M.; Atkins, A.G. Optimum Die Angles and Maximum Attainable Reductions in Rod-Drawing. J. Eng. Ind. 1969, 9, 664–671. [Google Scholar] [CrossRef]
- Cho, D.; Jang, Y.C.; Lee, Y. Evaluation of the prediction ability of ductile fracture criteria over a wide range of drawing conditions. J. Mech. Sci. Technol. 2019, 33, 4245–4254. [Google Scholar] [CrossRef]
Publisher’s Note: MDPI stays neutral with regard to jurisdictional claims in published maps and institutional affiliations. |
© 2021 by the author. Licensee MDPI, Basel, Switzerland. This article is an open access article distributed under the terms and conditions of the Creative Commons Attribution (CC BY) license (https://creativecommons.org/licenses/by/4.0/).