Article

The Use of Chemical Sensors to Monitor Odour Emissions at Municipal Waste Biogas Plants

by
Marta Wiśniewska
*,
Andrzej Kulig
and
Krystyna Lelicińska-Serafin
Faculty of Building Services, Hydro and Environmental Engineering, Warsaw University of Technology, 20 Nowowiejska Street, 00-653 Warsaw, Poland
*
Author to whom correspondence should be addressed.
Appl. Sci. 2021, 11(9), 3916; https://doi.org/10.3390/app11093916
Submission received: 9 March 2021 / Revised: 23 April 2021 / Accepted: 24 April 2021 / Published: 26 April 2021

Abstract

:
Municipal waste treatment plants are an important element of the urban area infrastructure, but also, they are a potential source of odour nuisance. Odour impact from municipal waste processing plants raises social concerns regarding the well-being of employees operating the plants and residents of nearby areas. Chemical methods involve the determination of the quantitative composition of compounds comprising odour. These methods are less costly than olfactometry, and their efficiency is not dependent on human response. The relationship between the concentration of a single odorant and its odour threshold (OT) is determined by the odour activity value (OAV) parameter. The research involved the application of a multi-gas detector, MultiRae Pro. Measurements by means of the device were conducted at three municipal waste biogas plants located in Poland. In this paper we describe the results obtained when using a detector during the technological processes, the unitary procedures conducted at the plants, and the technological regime. The determination of these relationships could be useful in the development of odour nuisance minimization procedures at treatment plants and the adjustment to them. This is of paramount importance from the viewpoint of the safety and hygiene of the employees operating the installations and the comfort of residents in the areas surrounding biogas plants. Monitoring of expressed odorant emissions allows the course of technological processes and conducted unit operations to be controlled.

1. Introduction

Municipal waste management plants are an inseparable element of municipal waste management systems in cities and rural areas, and at the same time, they constitute a potential source of emission of substances causing olfactory nuisance—odorants [1].
It is the emission of odorants that can cause the negative image of municipal waste treatment plants and raises social concerns regarding the well-being of employees operating the plants and residents of nearby areas [2,3,4].
For designing and support of minimization plans for odour nuisance, odour emissions are monitored. An important element in implementing appropriate odour and air pollution reduction strategies is the characterization of the compounds that make up the odour mixture [5]. Samples of the test gases can be analyzed by means of analytical methods (e.g., gas chromatography—GC) or sensor methods (e.g., electronic noses or detectors) [6,7]. The electronic nose allows for monitoring and continuous odour control and reduces the need for multiple sampling. The operation of the electronic nose is based on the use of a sensor matrix that transforms the chemical information provided in the signal. The task of an e-nose is to record and characterize the mixture of volatile substances depending on the concentration of the individual components of the odour. The operation of the device relates to the introduction of complex mathematical equations and statistical algorithms responsible for correct interpretation of the results. Detectors, on the other hand, indicate those compounds that result from the sensors. They are installed in the device and are calibrated. They do not require the direction of algorithms, which makes them easier to operate than e-noses. Detectors, depending on the type of sensor, are based on different types of chemical processes [8,9]. In order to implement measures to reduce odour nuisance, the participation and potential of the compounds (or chemical family) in the formation of the odour mixture are also important. For this purpose, an odour activity value (OAV) can be defined, which is the ratio of the chemical concentration of a single compound to its odour threshold (OT). OAVs have been widely employed for odorants monitoring in gas emission from waste biological stabilization [10]. An important element in implementing appropriate odour and air pollution reduction strategies is also the odour nuisance of gas mixture, which can be determined by the use of sensory methods, including dynamic and field olfactometry [11].
Chemical methods involve the determination of the quantitative composition of compounds comprising odour. The methods are less costly than olfactometry, and their efficiency is not dependent on human response. Odour research should not be based exclusively on the identification of odour gas mixture components. It should be one of the elements of the analysis [4,12]. Malodorous substances in the mixture can mutually strengthen or weaken the intensity and change the hedonic odour quality. Due to this, in the assessment of the odour impact of municipal waste biogas plants, as well as other objects causing odour nuisance, the determination of the odour and odorant concentration is very helpful [13,14,15].
Concentrations of individual chemicals, odorants, can be weighted using their corresponding odour thresholds (OTs). Thanks to this procedure it is possible to identify substances whose concentrations exceed the limits of odour perception. The OT parameter is defined as the chemical concentration of compounds at which 50% of the test population distinguishes the presented gas sample from the odourless gas [16]. The relationship between the concentration of a single odorant and its OT is determined by the odour activity value (OAV) parameter, which is a factor used as an odour surrogate to identify the odorous potential of each substance contained in a gas sample [10,17]. This relationship is used to monitor the emission of odorous compounds, among others, during aerobic stabilization of digestate and composting of waste [18,19,20,21,22]. OAV is a dimensionless quantity used as a proxy parameter for odour concentration and is applied to identify the odour potential of individual substances contained in an analyzed gas sample [23]. Parker et al. [24] claim that substances with the highest OAV contribute to odour nuisance the most, which is logically explainable. A problem arising from the use of the OAV parameter is the large discrepancy in the literature data in relation to OT of the individual odorants, as well as the failure to consider the interactions between the different substances in the test sample. It can produce different effects on the quality of odour perception [24,25]. However, the OAV helps in determining the major odour contributors in the biological stabilization of waste and in the food industry [10,26,27]. Sensor-based methods for odorant measurement, which have been frequently used in portable gas detectors in recent years, are characterized primarily by uncomplicated operation, relatively low investment, and implementation costs, as well as handiness [28,29,30]. In addition to the advantages indicated, gas detectors are characterized by low sensitivity, which can be affected by factors such as humidity and the presence of other substances [2,12]. The sensors used in the detectors differ from each other, among other things, in construction and principle of operation. There are, among others, electrochemical (amperometric) and photoionization (PID) sensors. In electrochemical sensors (EC), analyte particles diffuse through a membrane and the inner electrolyte towards the surface of the working electrode suitably polarised concerning the reference electrode. The signal obtained from the electrochemical redox reaction is proportional to the concentration of the analyte near the sensor [31,32,33]. The principle of PID sensor operation is based on the phenomenon of photoinization. A high-energy light source is needed to perform the photoionization process. The energy of light, usually with a wavelength shorter than 143 nm, determines the detectable chemical compounds. If the ionization potential of a sample molecule is lower than the ionization energy of the photons, the molecule becomes ionized and generates a current signal proportional to the concentration of ionized compounds [34].
Another example of the use of the detection method is the electronic nose, which is characterized by more complicated operation compared to detectors. The electronic nose consists of a sensor array simulating the receptors of the human olfactory system, a data processing unit, and a pattern recognition system that recognizes the odour patterns of the test substance, a function performed by the brain in the human olfactory system [35].
The characteristic compounds of the decomposition processes of organic matter are primarily volatile organic compounds that include methanol, methylamine, dimethylamine, methyl ethyl ketone, styrene, toluene, methanethiol, ethanethiol, dimethyl sulphide, and acetone, as well as inorganic compounds such as ammonia or hydrogen sulphide [36,37]. Volatile organic compound (VOC) is a term used for a wide group of organic compounds which have a vapour pressure of at least 0.01 kPa at 20 °C [38]. VOCs are also characterized by low solubility in water. VOCs are involved in photochemical reactions in the atmosphere that produce photochemical oxidants.
This work aimed to analyze the suitability of a portable gas detector as a device that can be a tool for monitoring odorant emission and technological processes. This is particularly important from the viewpoint of taking care of life and health quality, and the well-being of residents. The study also analyzed the correlation between the concentrations of individual compounds emitted in different plants for the mechanical—biological treatment of municipal waste. The analysis of the different correlation coefficients will allow to determine the differences in the values obtained for them.

2. Materials and Methods

Study Methodology

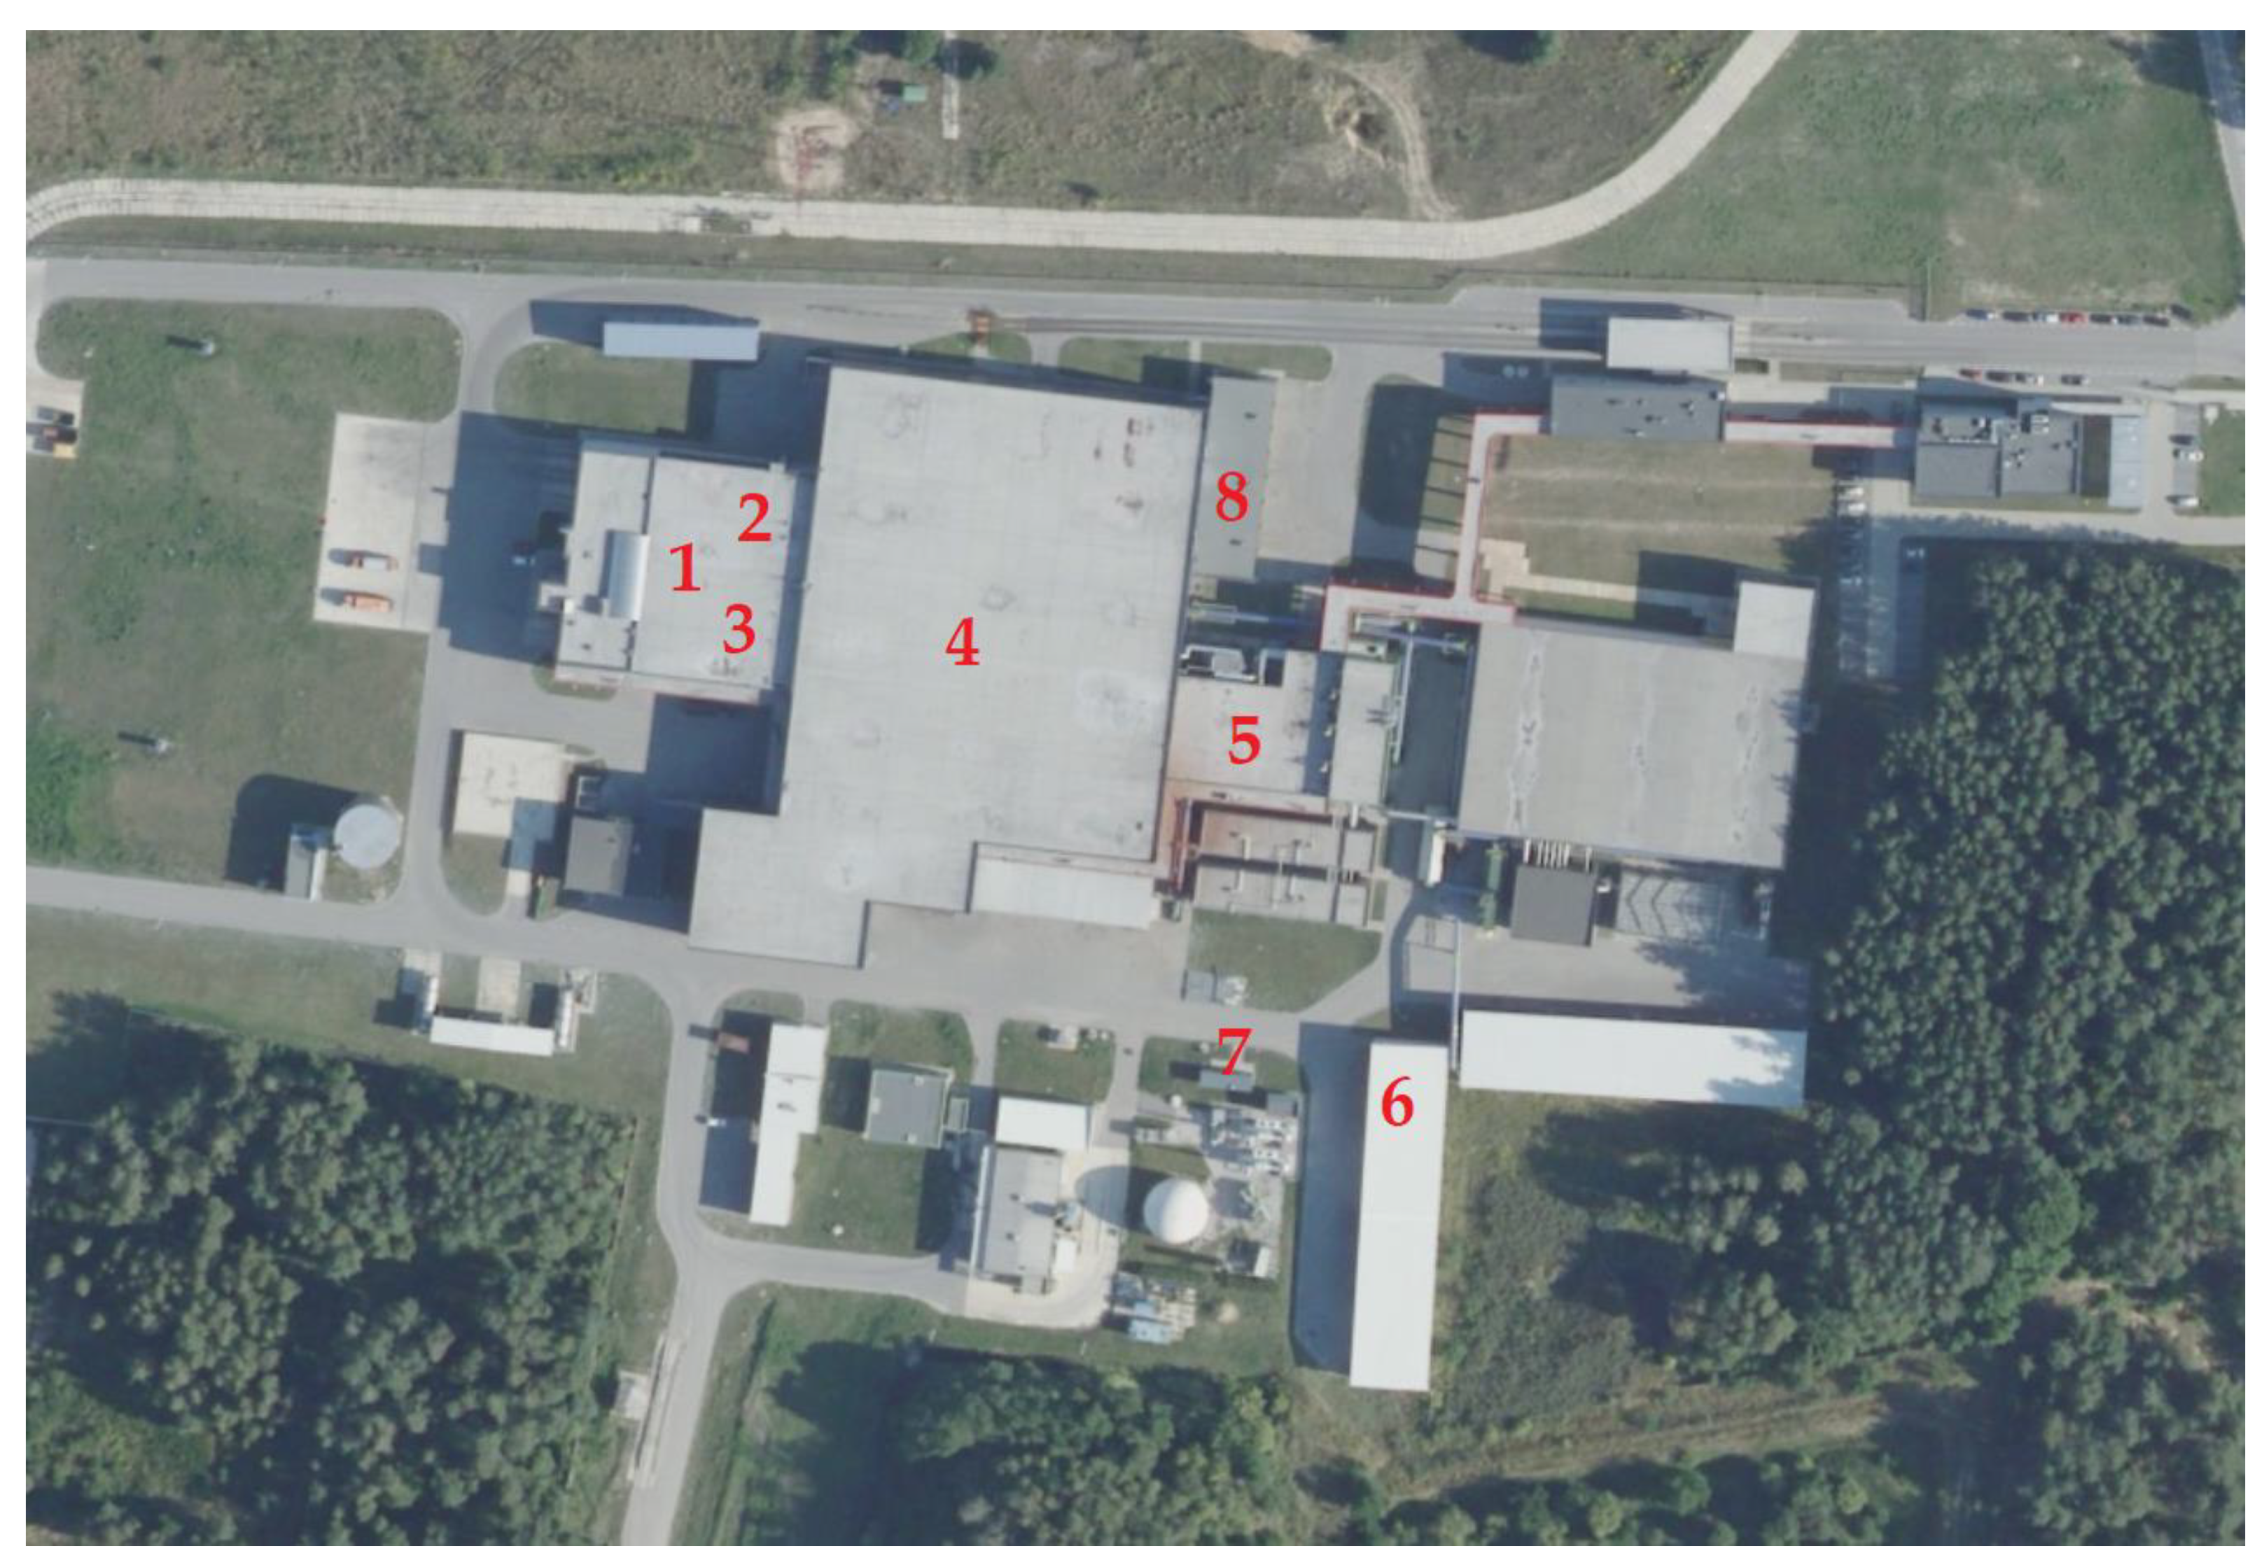
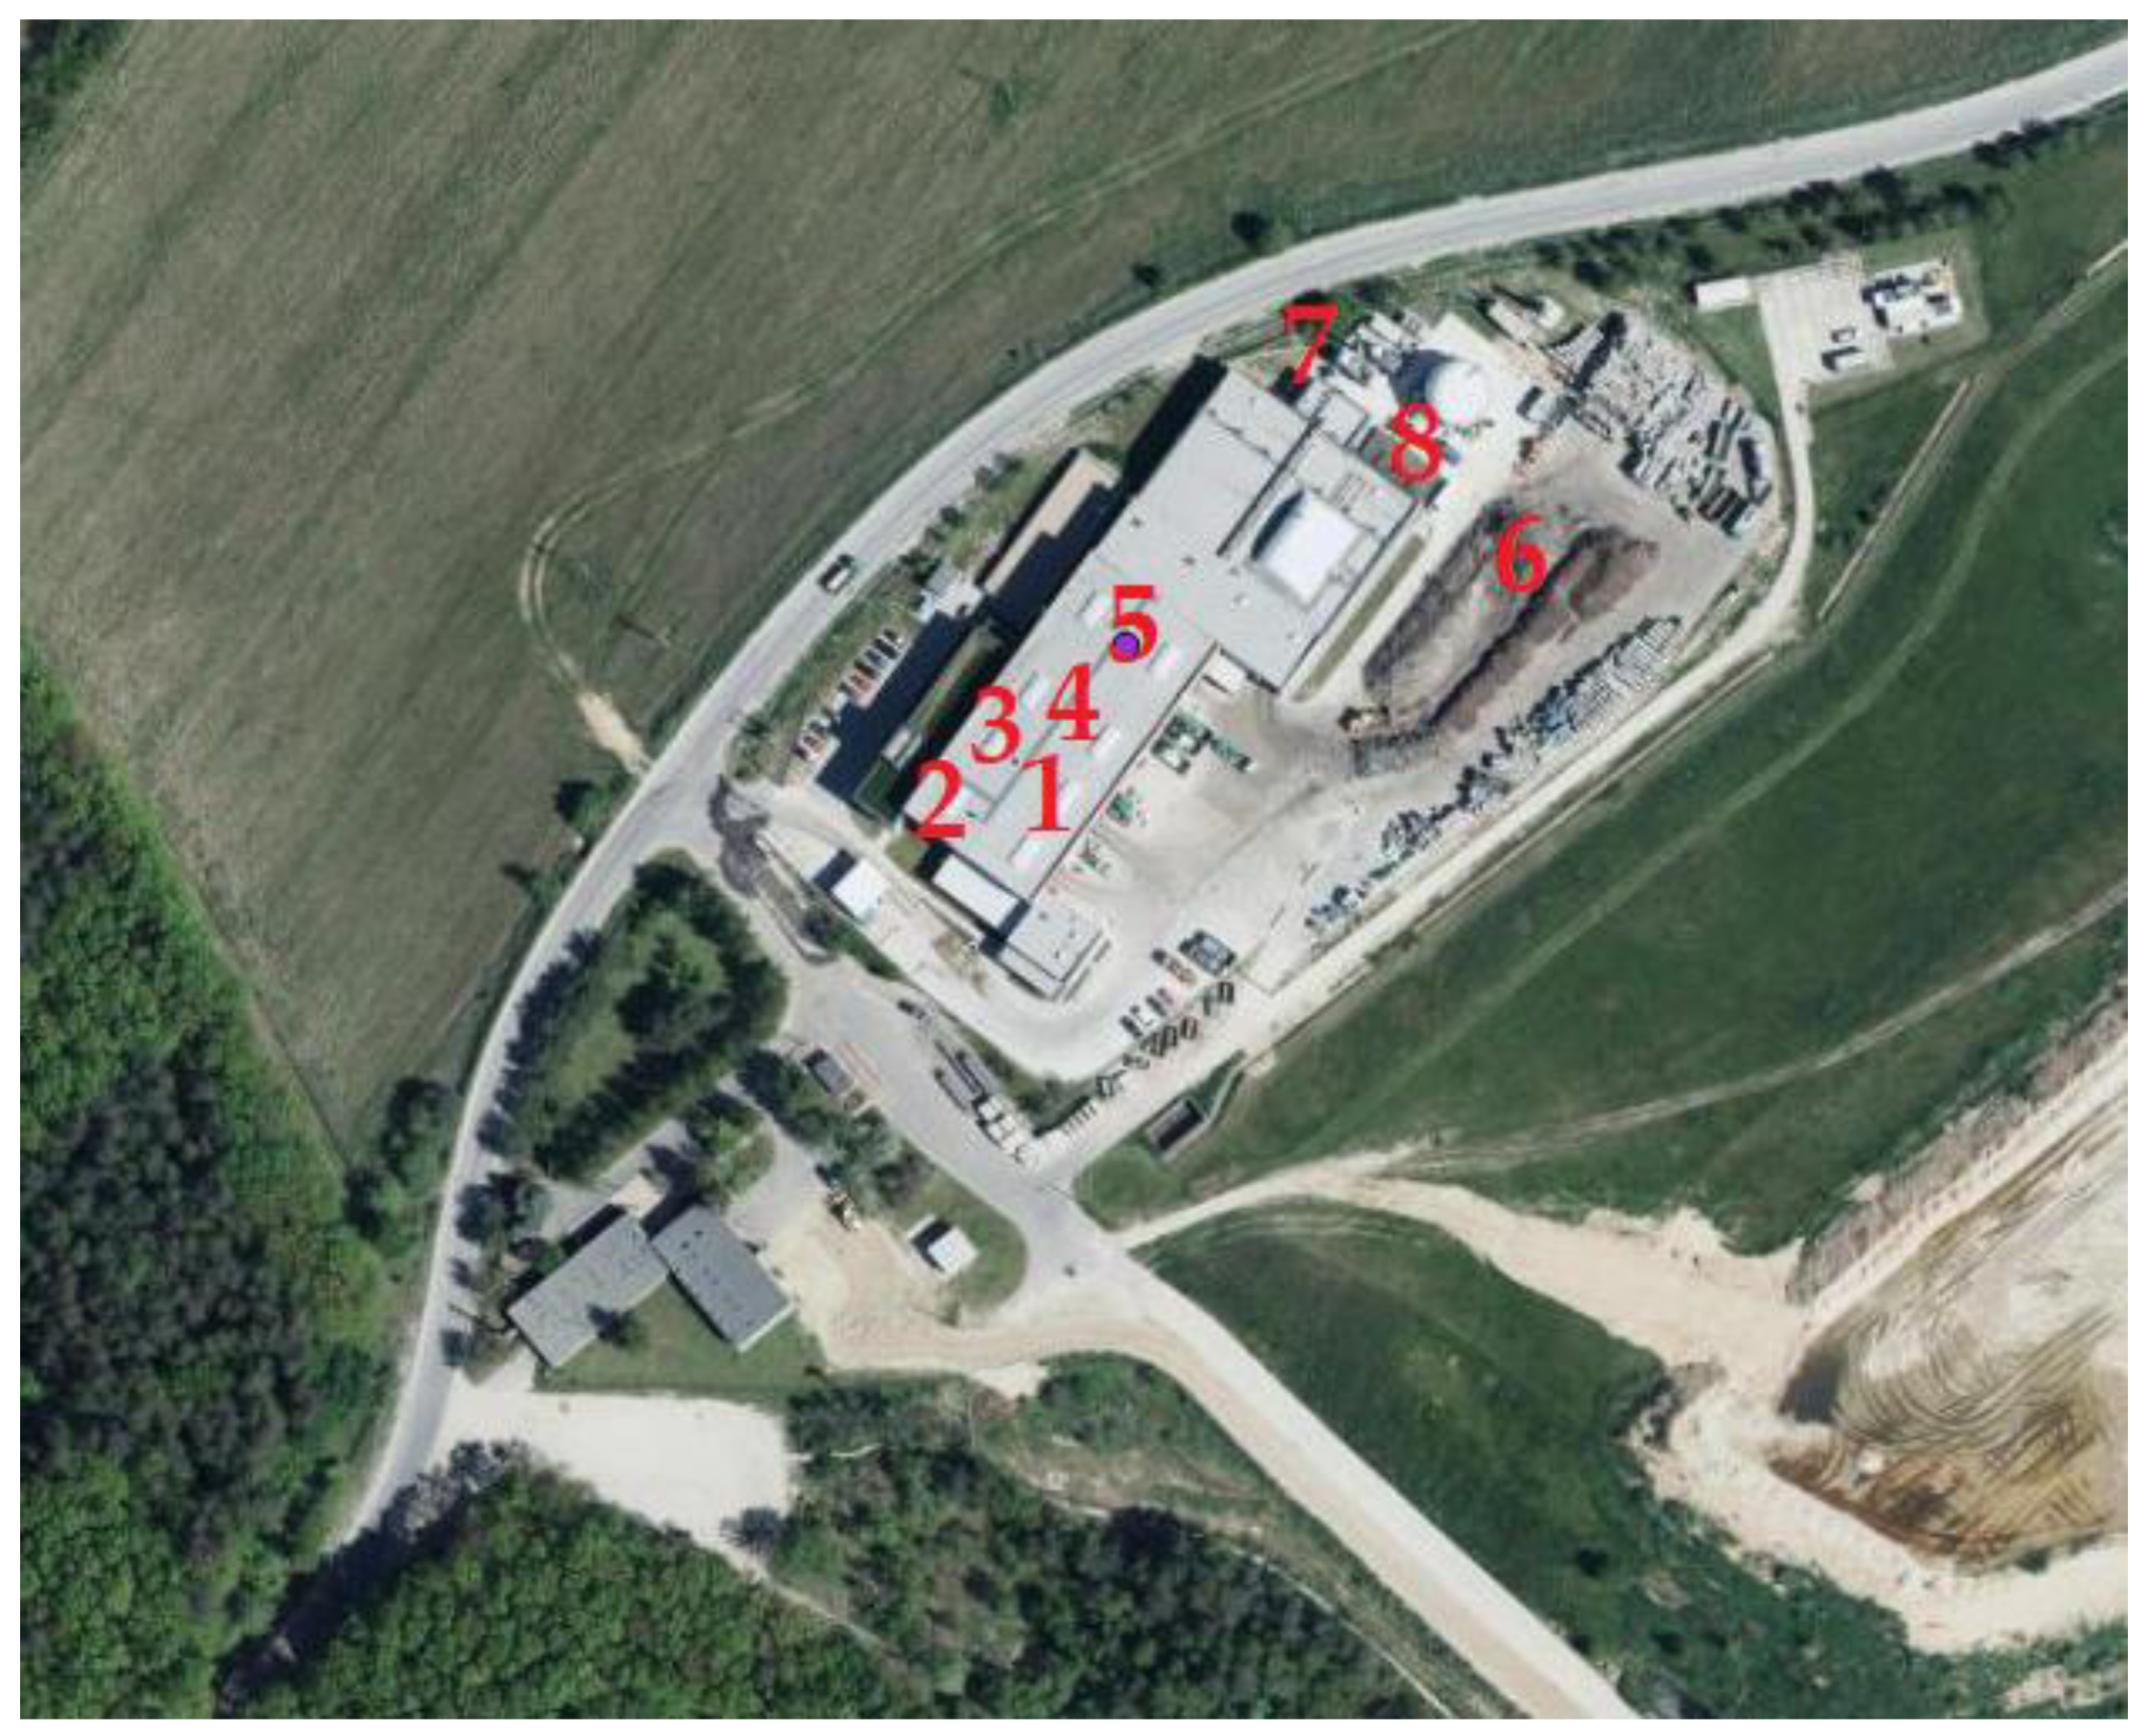
The research involved the application of a multi-gas detector, MultiRae Pro. The device is equipped with four sensors for gas concentration detection, i.e., ammonia (EC sensor, range 0–100 ppm, resolution 1 ppm, response time (RS) 60 s), hydrogen sulphide (EC sensor, resolution 0–100 ppm, range 0.1 ppm, RS 35 s), methanethiol (EC sensor, range 0–10 ppm, resolution 0.1 ppm, RS < 35 s), and volatile organic compounds (PID sensor, range 0–2000 ppm, resolution 0.01 ppm, RS 15 s). The chemical compounds are typical for the anaerobic decomposition of organic waste [39,40]. The operation ranges of the devices and the threshold levels for odour identification for selected chemical compounds are presented in Table 1. For VOCs, toluene was taken as the base compound, which is consistent with [41]. In chromatographic studies aimed at quantitative evaluation of VOCs, the results of which have not yet been published, it has been confirmed that toluene was the compound found at all indicated measuring points in the largest quantity. All sensors were regularly calibrated by a specialist service company. In the case of the VOC sensor, calibration was carried out using a reference gas in the form of 0.01 ppm isobutylene. For the other sensors, the following reference gases were used: 50 ppm NH3, 10 ppm H2S, and 5 ppm CH3SH. The detector cooperates with Pro Rae Studio software (Rae System), permitting the reading of results recorded every minute. The measurements by means of the device were conducted at three municipal waste biogas plants located in Poland: in Biała Podlaska (5 July 2019), in Promnik (11 July 2019), and in Wólka Rokicka (18 July 2019). These are the installations that constitute an important element of the municipal solid waste (MSW) management system in the service areas. Biodegradable fractions from MSW—collected selectively or mechanically separated from the mixed waste stream—are processed under anaerobic conditions. Additionally, these installations act as technological lines for sorting out secondary raw materials and fuel from waste. The research was conducted at selected measurement points (1–8) identified as odour nuisance points and located in such places as waste storage, mechanical treatment, fermentation preparation, oxygen stabilization, technological wastewater pumping station, biofilter with the open surface (in Biała Podlaska and Wólka Rokicka), and digestate dewatering (in Promnik). Table 2 shows measurement points at analyzed waste treatment plants. The measurement points are marked in Figure 1, Figure 2 and Figure 3. For points 2, 3, 5, 6, and 8 (biofilter) a static shield with a measuring stub was used for the determination of the chemical compounds—to minimize outside conditions.
In addition, the odour concentration (cod) was determined at each point using the Nasal Ranger® field olfactometer according to the methodology given in [21]. This is not the standardized method. The odour concentration parameter was calculated as the geometric mean of the two measurements analogically to the European Standard EN 13725:2003 (Air Quality—Determination of Odour Concentration by Dynamic Olfactometry) [42]. The mentioned norm is dedicated to dynamic olfactometry in which the cod parameter is determined in an olfactometric laboratory after taking a gas sample in a bag. Unlike standard olfactometry, field olfactometry allows for measurements in situ, taking more gas samples and there is no risk of chemical reactions occurring in the gas mixture. At each measuring point, microclimate parameters, inside and outside air temperature (Ti and To) and relative humidity of inside and outside air (RHi and RHo) were simultaneously controlled using the Rotronic HydroPalm psychrometer with HygroClip2 HC2-S3 sensor. Measurements were conducted at a height of 1.5 m.
The results of the studies were analyzed in correlation with STATISTICA 13.1 (StatSoft). Three different correlation coefficients were calculated, i.e., Pearson’s, Spearman’s and Kendall’s. Pearson’s correlation coefficient is used to study linear relationships between data. It is a standardized covariance. Pearson correlation coefficient is calculated when both variables are measurable and have a distribution close to normal and the relationship is rectilinear.
Spearman’s rank correlation coefficient, like Pearson’s, is used to study the relationship between data, but unlike it, it allows you to study any monotonous dependencies, not just linear relationships. Ranks determine the position at which a variable is located when the data is organized. Where two equally observed values occur, they shall be assigned an arithmetic mean, which shall be calculated from their position(s). Kendall’s tau factor is based on the difference between the probability that two variables are in the same order (for the observed data) and the likelihood that their order of is different [43,44].
Table 1. Sensor specifications of a gas detector MultiRae Pro and threshold level of odour identification for selected chemical compounds.
PID SensorRangeResolutionResponse Time (RT) t90 (s) *Odour Threshold (OT)
(ppm)
Volatile organic compounds (VOCs)
Ionization energy (IE) 10.6 eV
0–1000 ppm10 ppb
(0.01 ppm)
15based on main components **
Electrochemical SensorRangeResolutionResponse Time (RS) t90 (s) *Odour Threshold (OT) (ppm)
Ammonia (NH3)0–100 ppm1 ppm605.2 [14]
Hydrogen sulphide (H2S)0–100 ppm0.1 ppm350.0081 [45]
Methanethiol (CH3SH)0–10 ppm0.1 ppm<350.00393 [45]
* Response Time (t90): The time for a sensor to reach 90% of its final stable reading. Typically, an exposure of twice the t90 time is required to get a stable reading. ** Toluene (IE = 8.82 eV; OT = 0.33 ppm [46]) is the dominant compound in the mixture of volatile organic compounds (VOCs) in the tested process gases in analyzed waste biogas plants (based on own, yet unpublished, chromatographic analysis); moreover based on [41] toluene can be used with a close relationship (R2 = 0.95) in conversion from a GC-based VOC concentration to a PID-based VOC concentration; other compounds present in the highest amounts in process gases from the studied biogas plants processing municipal waste are styrene (IE = 8.43 eV; OT = 0.047 ppm [47]) and phenol (IE = 8.51 eV; OT = 0.048 ppm [48]).
Table 2. Measurement points in particular waste treatment plants.
Mark of Measurement PointBiogas Plant
Biała PodlaskaPromnikWólka Rokicka
1Waste storage plant (inside the hall)
2Mixed waste storage ***
3Selectively collected waste storage ***
4Mechanical treatment
5Fermentation preparation ***
6Oxygen stabilization ***
7Technological wastewater pumping station
8Biofilter ***Digestate dewateringBiofilter ***
*** Surface sources for which the gas sample was taken from under the static shield.
OAV parameters were calculated by equation:
OAV = OC i OT i
where:
OCi—concentration of individual odorant (ppm),
OTi—odour threshold of individual odorant (ppm).

3. Results and Discussion

Table 3 shows the results of microclimate parameters in particular biogas plants. These are the mean values of inside (Ti, RHi) and outside (To, RHo) parameters. From a measurement viewpoint, the outside and inside conditions did not generate a significant difference due to the stable temperature and humidity conditions of the biogas plants and the measurement results at individual locations.
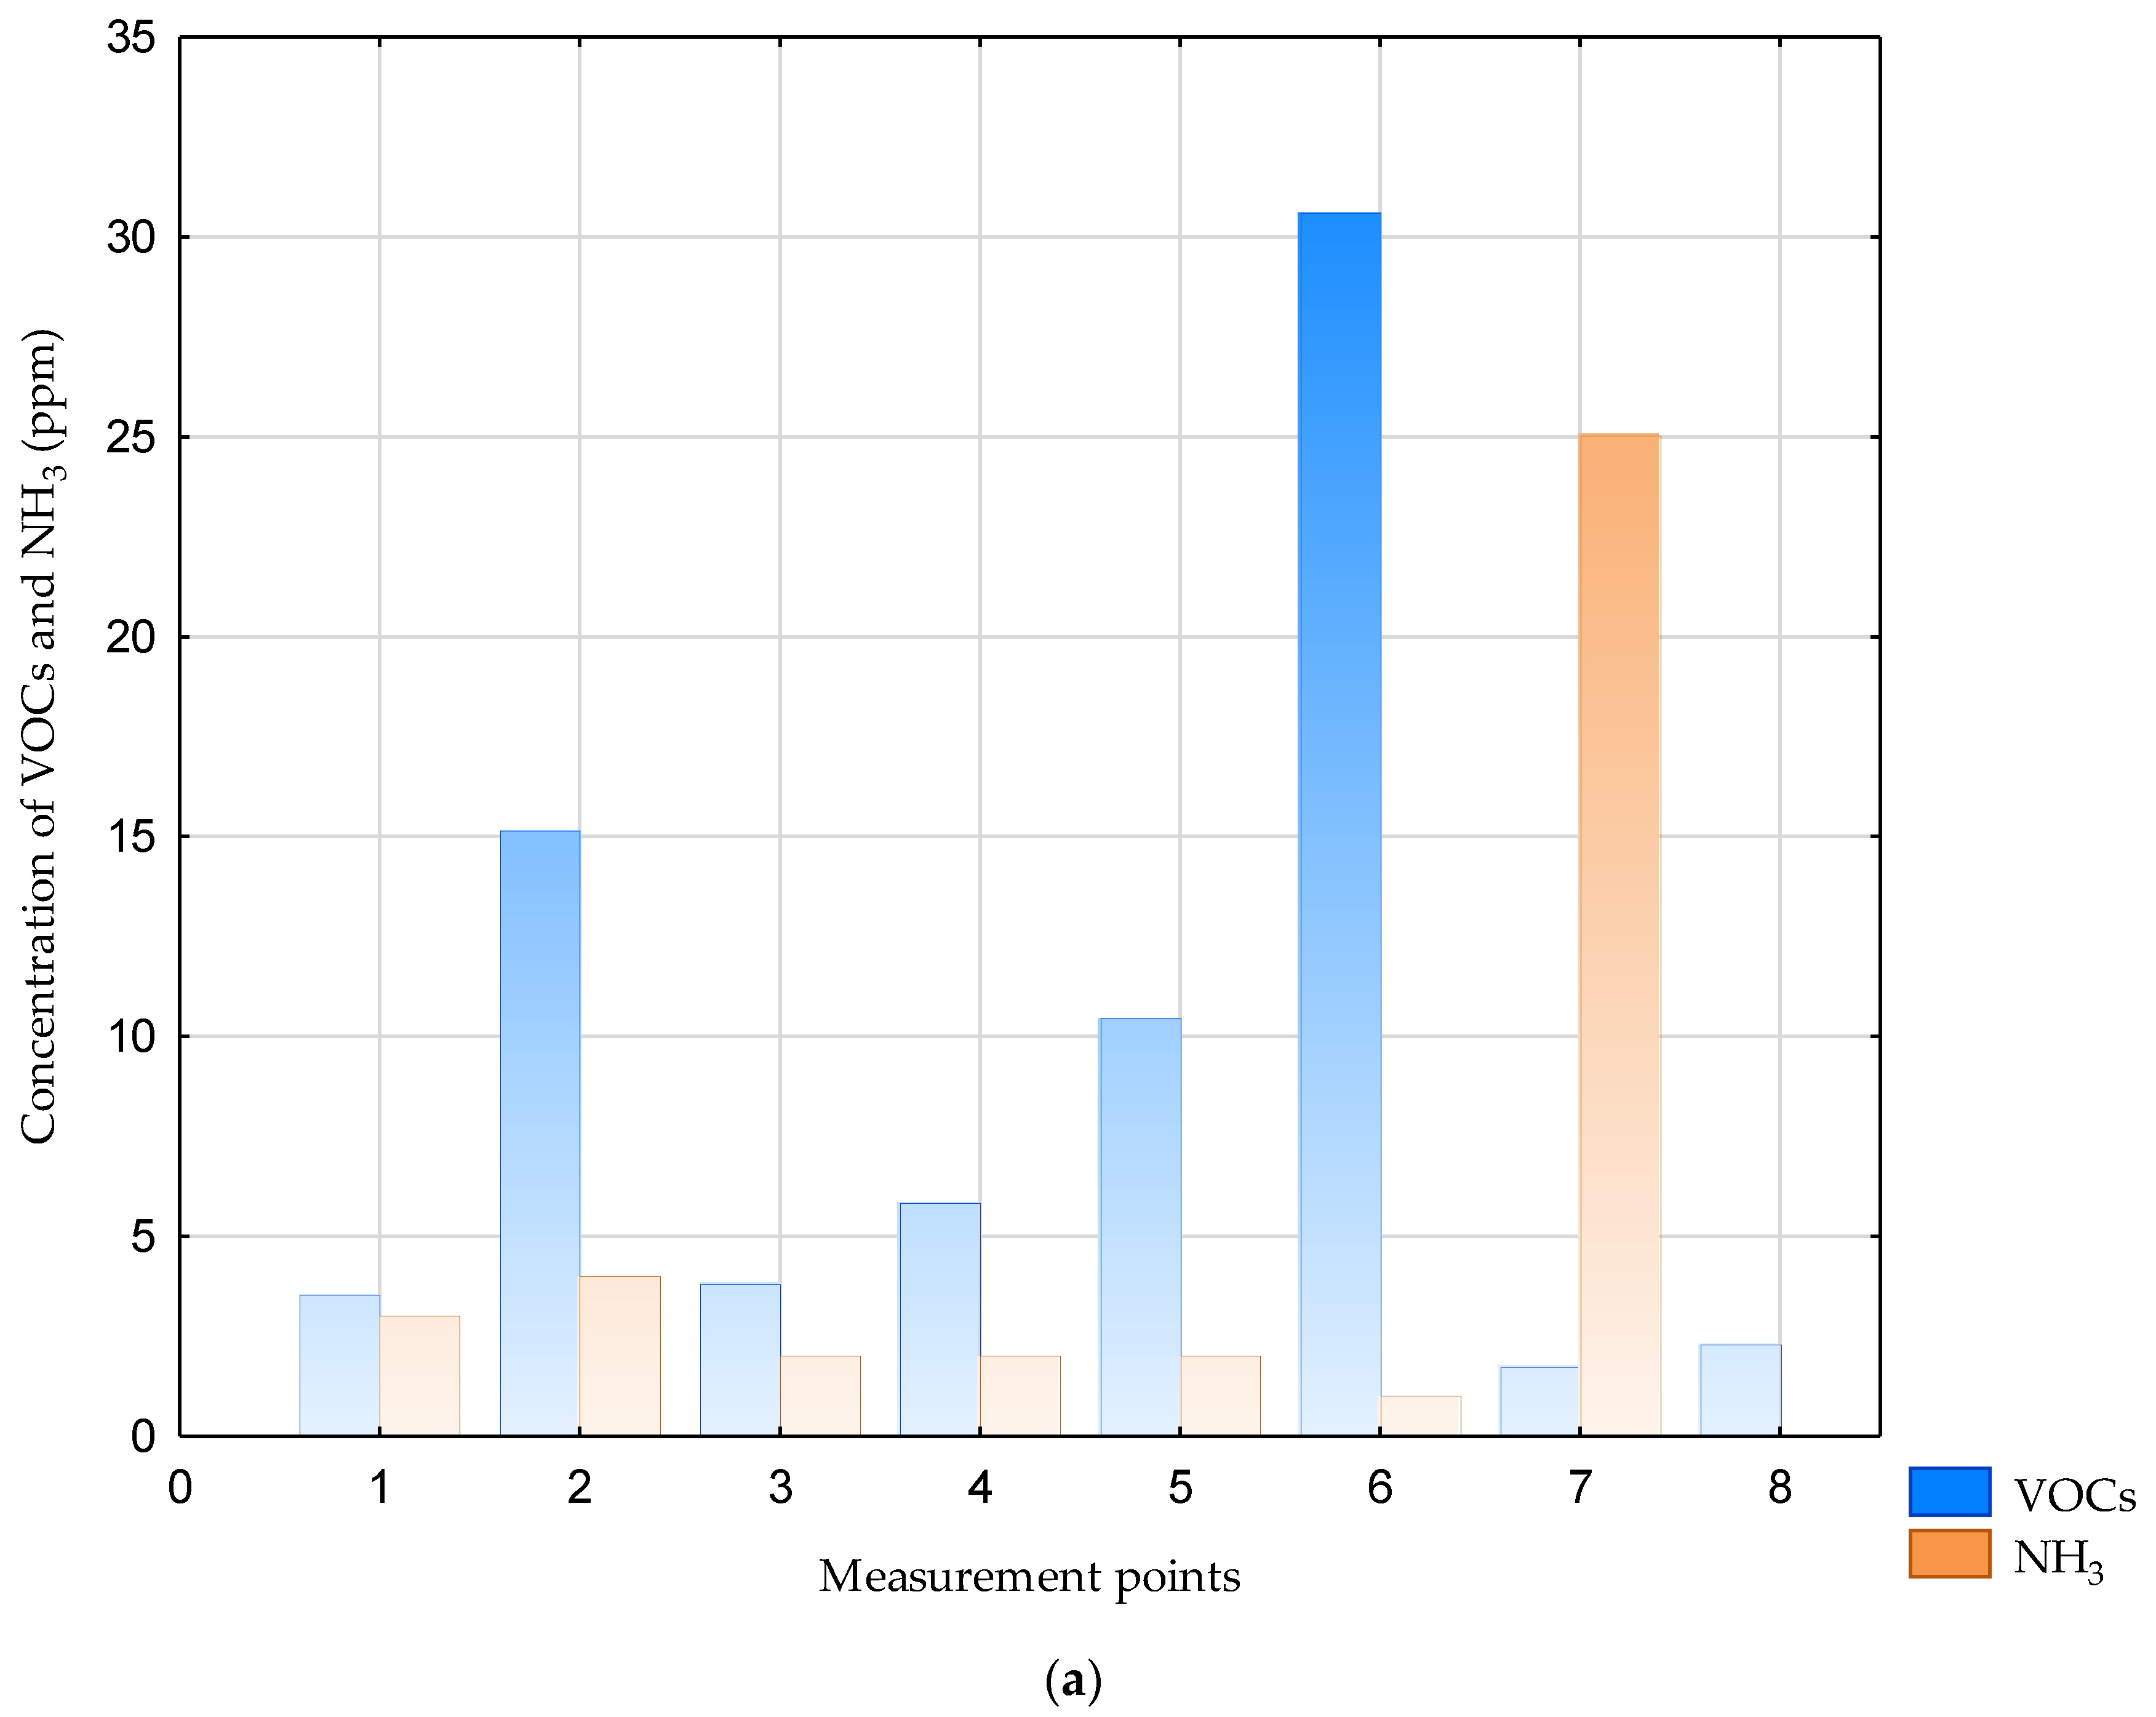
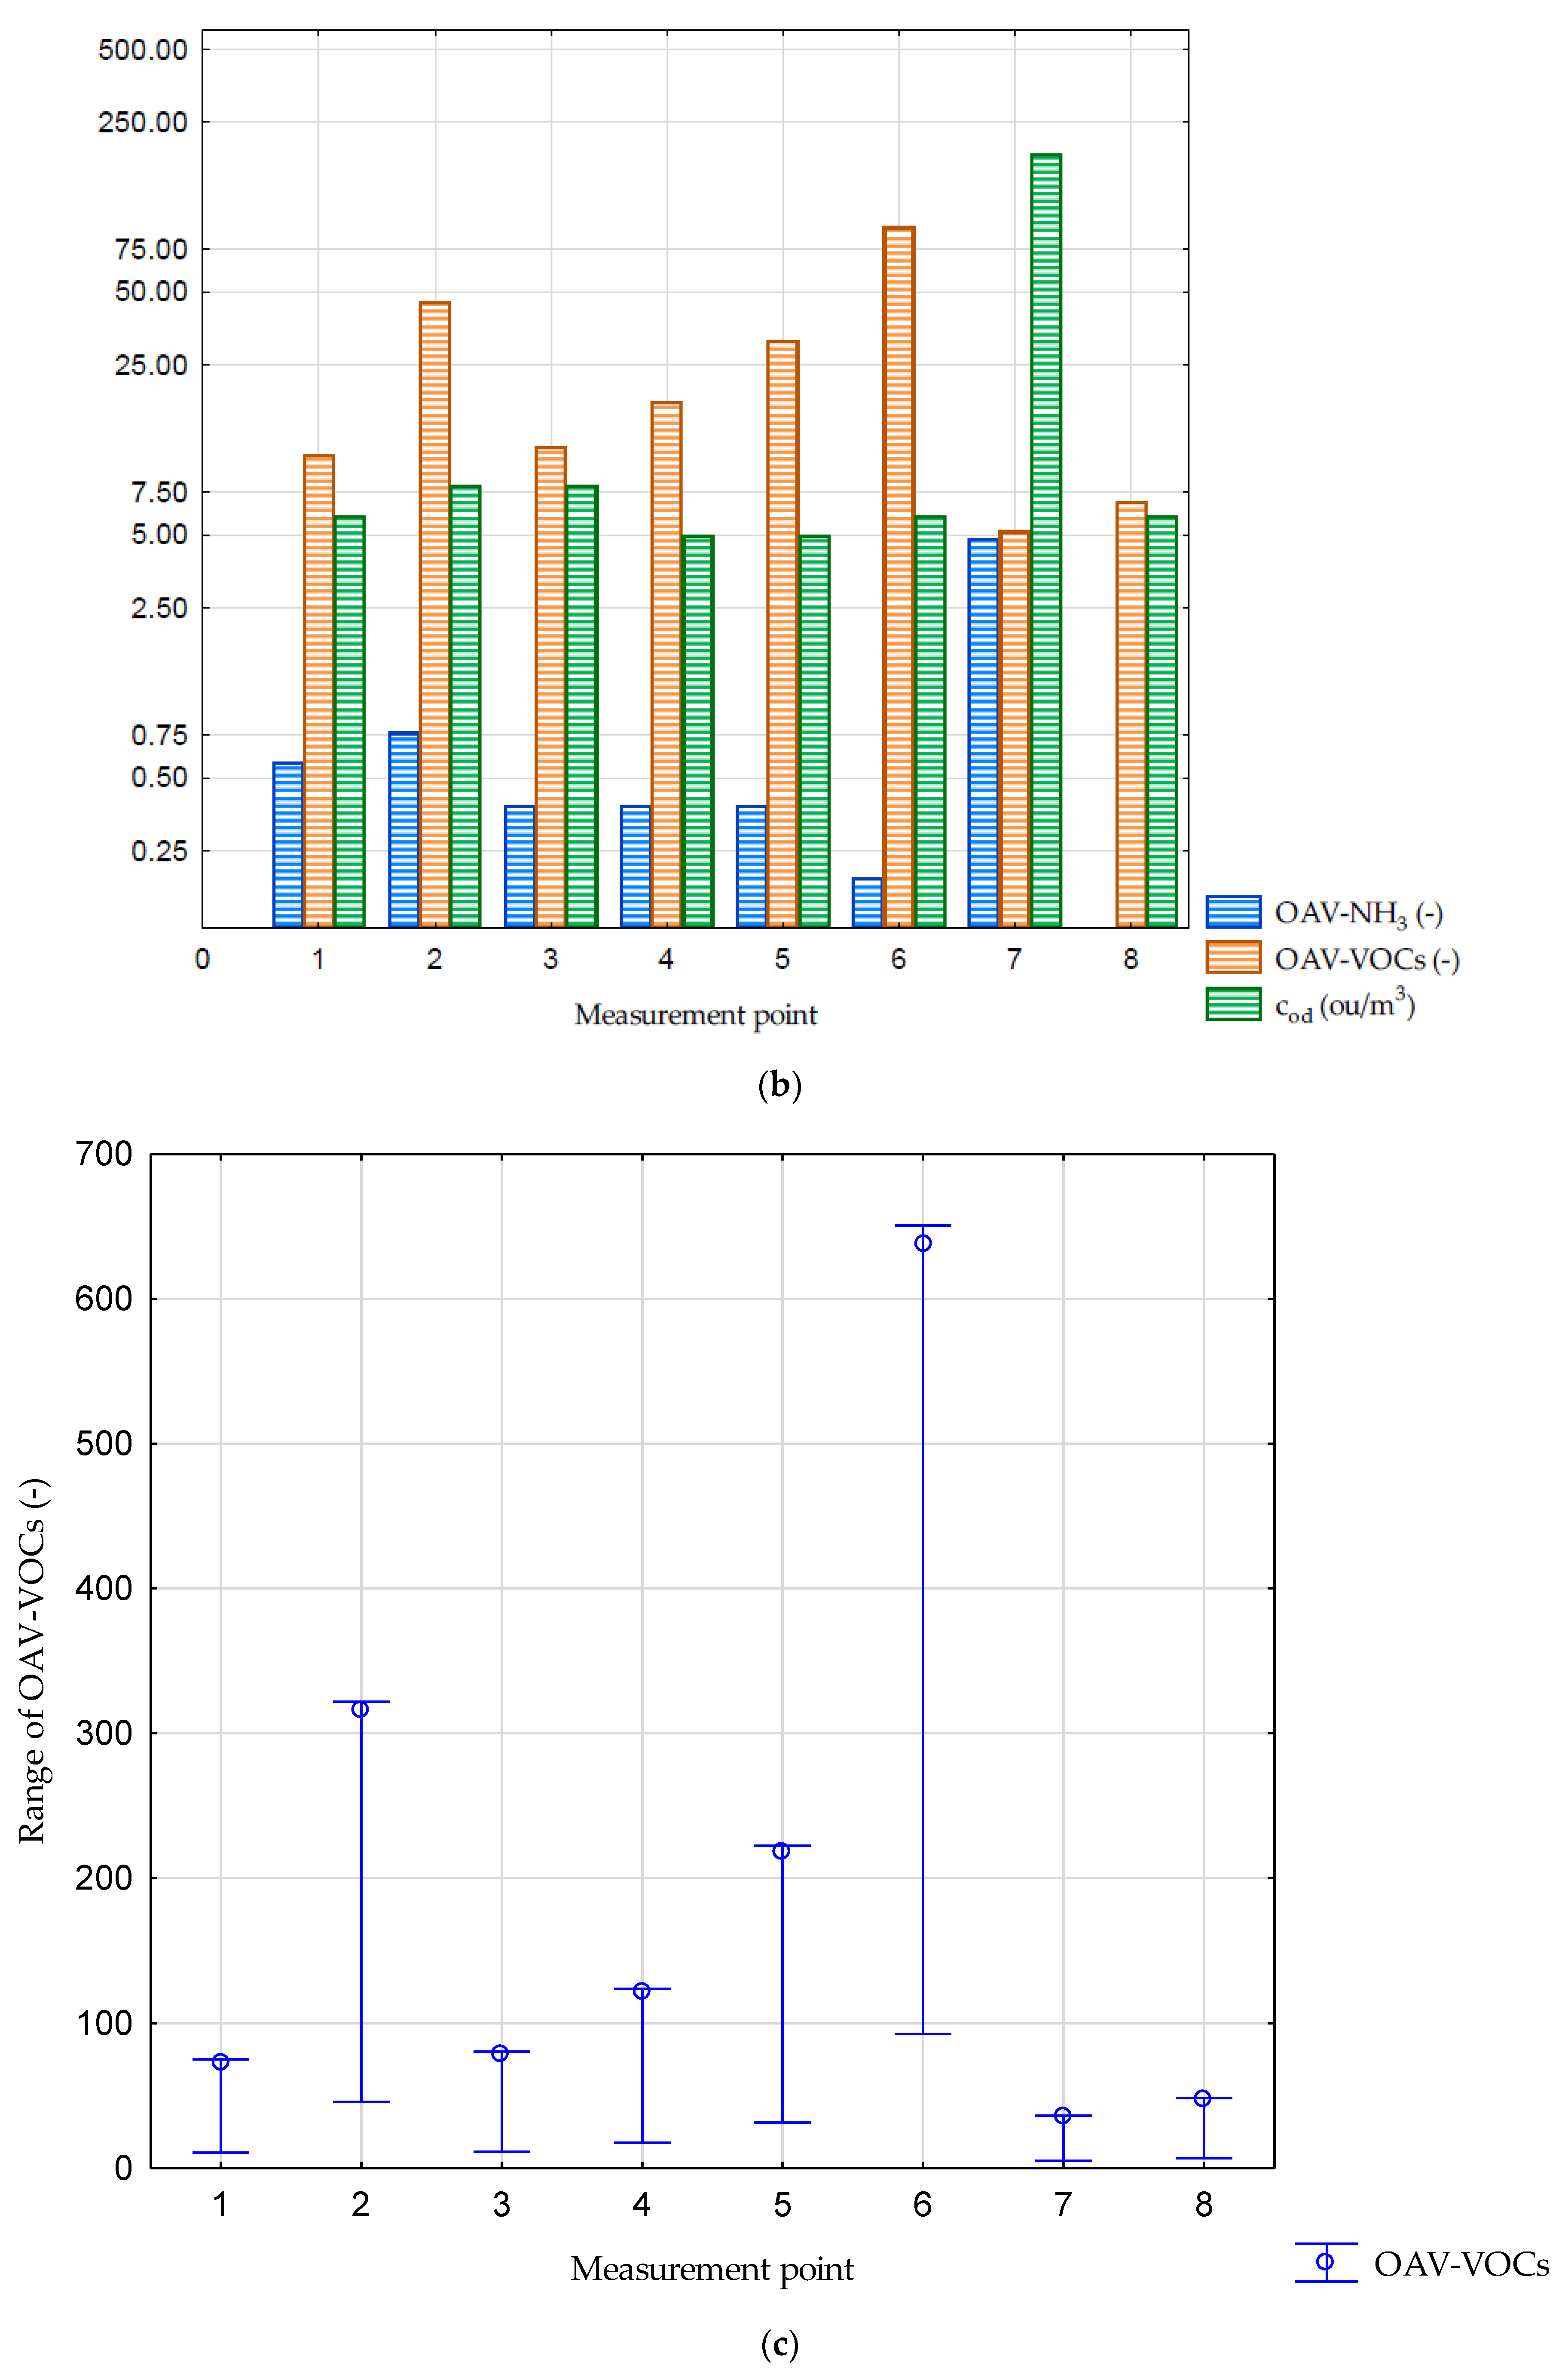
Figure 4, Figure 5 and Figure 6 show the results of measurements of chemical compounds and odour concentrations and OAVs at analyzed biogas plants at particular measurement points. Figure 4a, Figure 5a and Figure 6a present the results of odorant concentrations, Figure 4b, Figure 5b and Figure 6b indicate the odour activity values (based on toluene) and odour concentration and Figure 4c, Figure 5c and Figure 6c show the range of OAV-VOC values. Figures showing the relationship between OAV and cod (Figure 5b and Figure 6b use a logarithmic scale (values converted with natural logarithm) on the value axis (Y-axis) to make figures easier to read. The presented results are an arithmetic mean of five-minute measurements, for which the standard deviation was less than 5%. Hydrogen sulphide and methanethiol were not determined at any of the studied plants at the indicated measurement points due to the limit of compound detection. Therefore, the graphs do not include these compounds.
At the biogas plant located in Biała Podlaska, the source of the highest VOC emission was the oxygen stabilization of the digestate (16.22 ppm). At this point, the highest ammonia emission (49 ppm) was simultaneously observed. At the analyzed plant, this process is carried out in the technological field. These results are related to the type of treated waste and the processing technology used. Only at this biogas plant (among the plants included in the research), is biodegradable waste collected selectively at source the feedstock for the fermentation process. In addition, no dewatering of the digestate is performed in the process line of this biological treatment plant. After the fermentation process is completed (21 days), the digestate is transported to the technological field where it undergoes a single-stage aerobic stabilization. Emissions of hydrogen sulphide and methanethiol were not detected at any measurement point. In turn, the lowest emission of odorants at this biogas plant was observed in the case of the technological wastewater pumping station. The measurement results may have been influenced by the nature of wastewater being pumped—both sewage from a social and office building and wastewater gravitationally flowing from the technological field. Analyzing Figure 4b,c, it is interesting to observe that the highest values of the OAV parameter are also related to the aerobic stabilization of the digestate, but contrary to Figure 5a (bigger ammonia concentration), they are mainly related to OAV-VOCs (ranging from 1.52 to 345.11, depending on the dominant component), which is due to the low value of OT for main constituents. The highest OAVs correspond to the highest values of odour concentration. The highest odour concentration was observed in the case of oxygen stabilization, where at the same time the highest OAV for both VOCs and NH3 was determined. At this measurement point, ammonia is more responsible for the odour concentration than at other points of technological line. The general trend for this biogas plant was the highest OAV determined for VOCs. The larger the OAV, the more likely that compound would contribute to the overall odour of a complex odour mixture [18].
At the plant in Promnik, the sources of the highest VOC concentrations were waste storage inside the processing building (3.01 ppm), technological wastewater pumping station (2.92 ppm), and digestate dewatering (3.39 ppm). In the case of this biogas plant, there was no selective collection of biodegradable fractions in the serviced area. The fermentation process at the plant in Promnik is carried out in chambers with an automatic loading and unloading system. The highest result of ammonia concentration was obtained in the pumping station of technological wastewater (43 ppm). It was related to the decomposition processes taking place in wastewater and may be due to the faulty pumping station or a too-long storage time. In this case, the effluent comes from both the fermentation chambers and the digestate aerobic stabilization chamber. A high concentration of ammonia was also noted at the point of digestate aerobic stabilization (the second degree of the process) provided under a roofed shelter (7 ppm). Moreover, at the biogas plant in Promnik, all processes in the halls are carried out with closed gates with full-encapsulation, which undoubtedly increases the level of odorant concentrations inside the buildings and minimizes the nuisance outside. The general trend for this biogas plant was the highest OAV determined for VOCs. Analyzing Figure 5b,c, it can be observed that the OAV-VOCs were at a similar level at individual measurement points (ranging from 2.67 to 72.13, depending on the dominant component). A similar level of odour concentration was also observed at individual points of the technological line. The exception was the technological wastewater pumping station, where the highest odour concentration (187 ou/m3) and the highest OAV-NH3 (8.27) were recorded. In this case ammonia was more responsible for the odour concentration than at other measuring points.
At the biogas plant located in Wólka Rokicka, the source of the highest VOC concentration was, as in the case of the biogas plant in Biała Podlaska, the aerobic stabilization of the digestate (30.58 ppm). However here, in contrast to the biogas plant in Biała Podlaska, the feedstock for the fermentation process is a biodegradable fraction separated mechanically from the mixed waste stream. In the case of the analyzed biogas plant, similarly to the one in Promnik, there is no selective collection of biodegradable fractions in the serviced area. The fermentation process at the plant in Wólka Rokicka is carried out in chambers without an automatic loading and unloading system. Moreover, no digestate dewatering is implemented there. After the fermentation process is completed, the digestate is followed by one-stage oxygen stabilization in prisms located at the technological field. The source of the highest ammonia concentration at this biogas plant was the wastewater pumping station (25 ppm). In this case, wastewater comes mainly from the processing building where the first degree of digestate oxygen stabilization is carried out. Higher concentrations of both ammonia and volatile organic compounds in the case of waste storage (compared to the biogas plant in Biała Podlaska) may result from the waste collection system in the service area and the input to the biogas plant in the form of mixed municipal waste. The general trend for this biogas plant was the highest OAV determined for VOCs. Analyzing Figure 6b,c it can be observed that the highest value of OAV-VOCs parameter accompanies aerobic stabilization of the digestate carried out in the technological yard (ranging from 5.18 to 650.64, depending on the dominant component). In turn, the highest odour concentration was recorded at the measuring point, where the highest OAV-NH3 was also observed—similarly to Promnik biogas plant. This time it was also technological wastewater pumping station, in which ammonia was more responsible for the odour concentration than at other measuring points. In other places of the technological line, the influence of VOCs was dominant.
Various correlation coefficients were analyzed while searching for the relationships between odorant concentrations and between OAVs and odour concentration. Table 4 shows the correlation coefficients (r-Pearson’s, rho-Spearman’s, and taub-Kendall’s) at individual biogas plants.
When analysing all the results obtained at the tested biogas plants, strong correlations between both VOC and NH3 concentrations and OAVs and odour concentrations are visible only in the case of Biała Podlaska waste treatment plant. At other installations, the above-mentioned dependencies are not evident for all obtained results, regardless of the correlation coefficients tested. Significant differences in correlation coefficients between individual analyzed biogas plants may be due to different types of feedstock preparation and different fermentation technologies applied. Only at the biogas plant located in Biała Podlaska is the biodegradable waste collected selectively the material directed to the fermentation process. In addition, the digestate is also subjected to single-stage stabilization on the process site. Compared to the other biogas plants analyzed, there were also visible differences in the origin of the technological wastewater. Therefore, it can be assumed that the technological process in such a configuration as applied at the biogas plant in Biała Podlaska affects the observed correlations between the analyzed parameters. This inference is consistent with the results obtained in [49,50], where it was stated that odours generated by waste treatment depend on the type of raw material, the stage of the decomposition and the operating conditions at the site. Moreover, Toledo et al. [51] found that fresh organic waste in the form of the organic fraction of MSW (which is the input to Biała Podlaska biogas plant) were the most influential odorous substrates, due to their high concentration in biodegradable organic matter. The bold values of the correlation coefficients indicate statistically significant relationships. At other biogas plants tested, the analysis of the correlation between NH3 and VOC concentrations at all measuring points also showed no significant relationship. Strong correlations were only demonstrated at selected sections of the technological process, e.g., in the waste storage section, mechanical treatment, oxygen stabilization, and digestate dewatering [1,30]. Differences in correlation coefficients between OAV-NH3-cod and OAV-VOC-cod may result from the fact that ammonia emissions depend mostly on the C/N ratio of the treated waste and temperature, moisture content, and pH of the environment, whereas volatile compound emissions are correlated mainly to the temperature and oxygen concentration in the environment [37,49].

4. Conclusions

The main conclusions of this research can be summarised as follows:
  • The article presents a practice, in the form of a chemical sensor method, and a tool, in the form of a portable gas detector, for monitoring odorant emission from biogas plants processing municipal waste.
  • Measurement research by means of the analyzed method and device can facilitate future activities related to the minimization of odour emissions and can aid in finding the relationships between odorant emissions and the type of treated waste, technological processes, and technological regime.
  • In the analyzed studies, the highest concentrations of odorants were associated with oxygen stabilization of digestate (both VOC and NH3 concentrations) and with technological wastewater generated at biogas plants (mainly NH3 concentrations). For this reason, special attention should be paid to the encapsulation of biological processes and all wastewater-related operations, and proper exploitation of the pumping station.
  • The portable gas detector can be used to control technological processes in municipal waste biogas plants by measuring the odorant concentrations and calculating the odour activity value (OAV). Thanks to this result, it is possible to plan the activities aimed at minimizing the odour nuisance related to the presence of specific compounds (groups of compounds) in the mixture of process gases. In all analyzed biogas plants, the highest OAV level was determined for VOCs. This indicates the need for VOC monitoring in line with the requirement of Best Available Techniques for waste treatment [52]. The OAV for VOCs can be determined taking into account the predominant components in the VOC mixture. In the case of process gases emitted at the analyzed biogas plants processing municipal waste, the dominance of toluene is very clear, followed by phenol and styrene.
  • At the analyzed waste biogas plants, the highest odour concentration concerns the places for which the highest OAV values were determined—either for VOCs, or for NH3, or both. These places were the technological wastewater pumping station and the oxygen stabilization process.
  • The analysis of the correlations between VOC and NH3 concentrations shows only a slight connection between these parameters. In many parts of the analyzed technological lines, VOC and NH3 emissions occurred alternately and the concentrations of both the dominant odorants changed. This was confirmed by the OAV analysis, which indicated that only at the technological wastewater pumping station was a similar contribution of NH3 and VOCs to the overall odour of a complex odour mixture observed.
  • An unquestionable disadvantage of the analyzed device representing the chemical sensor method is the relatively small range of chemical compound determination. For low odorant concentrations, the use of the device may be unreliable. The device is also sensitive to high humidity. The manufacturer declares a permissible humidity level of 95%, which means limiting the possibility of measurements (e.g., in the line supplying processed air to deodorizing installation or in the tunnel for aerobic stabilization of digestate).
  • Further work should be carried out to clarify the correlation between individual odorant characteristics for the treatment of municipal waste.

Author Contributions

Data curation, investigation, and writing—original draft preparation, M.W.; conceptualization, methodology, and supervision, A.K.; writing—review and editing, visualisation, and validation, K.L.-S. All authors have read and agreed to the published version of the manuscript.

Funding

Work was co-financed by Warsaw University of Technology.

Institutional Review Board Statement

Not applicable.

Informed Consent Statement

Not applicable.

Data Availability Statement

Data available on request due to for not publishing them until now.

Conflicts of Interest

The authors declare no conflict of interest.

References

  1. Wiśniewska, M.; Kulig, A.; Lelicińska-Serafin, K. The impact of technological processes on odorant emissions at municipal waste biogas plants. Sustainability 2020, 12, 5457. [Google Scholar] [CrossRef]
  2. Gostelow, P.; Parsons, S.; Stuetz, R. Odour measurements for sewage treatment works. Water Res. 2001, 35, 579–597. [Google Scholar] [CrossRef]
  3. Tsai, C.-J.; Chen, M.-L.; Ye, A.-D.; Chou, M.-S.; Shen, S.-H.; Mao, I.-F. The relationship of odor concentration and the critical components emitted from food waste composting plants. Atmos. Environ. 2008, 42, 8246–8251. [Google Scholar] [CrossRef]
  4. Rincón, C.A.; De Guardia, A.; Couvert, A.; Wolbert, D.; Le Roux, S.; Soutrel, I.; Nunes, G. Odor concentration (OC) prediction based on odor activity values (OAVs) during composting of solid wastes and digestates. Atmos. Environ. 2019, 201, 1–12. [Google Scholar] [CrossRef]
  5. Gallego, E.; Roca, F.J.; Perales, J.F.; Sanchez, G.; Esplugas, P. Characterization and determination of the odorous charge in the indoor air of a waste treatment facility through the evaluation of volatile organic compounds (VOCs) using TD-GC/MS. Waste Manag. 2012, 32, 2469–2481. [Google Scholar] [CrossRef] [PubMed]
  6. Szulczyński, B.; Wasilewski, T.; Wojnowski, W.; Majchrzak, T.; Dymerski, T.; Namieśnik, J.; Gębicki, J. Different ways to apply a measurement instrument of E-nose type to evaluate ambient air quality with respect to odour nuisance in a vicinity of municipal processing plants. Sensors 2017, 17, 2671. [Google Scholar] [CrossRef] [Green Version]
  7. Wiśniewska, M.; Kulig, A.; Lelicińska-Serafin, K. Odour Emissions of municipal waste biogas plants—Impact of technological factors, air temperature and humidity. Appl. Sci. 2020, 10, 1093. [Google Scholar] [CrossRef] [Green Version]
  8. Borowik, P.; Adamowicz, L.; Tarakowski, R.; Siwek, K.; Grzywacz, T. Odor detection using an E-nose with a reduced sensor array. Sensors 2020, 20, 3542. [Google Scholar] [CrossRef]
  9. Wasilewski, T.; Migoń, D.; Gębicki, J.; Kamysz, W. Critical review of electronic nose and tongue instruments prospects in pharmaceutical analysis. Anal. Chim. Acta 2019, 1077, 14–29. [Google Scholar] [CrossRef]
  10. Rincón, C.A.; De Guardia, A.; Couvert, A.; Le Roux, S.; Soutrel, I.; Daumoin, M.; Benoist, J.C. Chemical and odor characterization of gas emissions released during composting of solid wastes and digestates. J. Environ. Manag. 2019, 233, 39–53. [Google Scholar] [CrossRef]
  11. Grzelka, A.; Sówka, I.; Miller, U. Methods for assessing the odor emissions from livestock farming facilities. Inżynieria Ekol. 2018, 19, 56–64. [Google Scholar] [CrossRef] [Green Version]
  12. Muñoz, R.; Sivret, E.C.; Parcsi, G.; Lebrero, R.; Wang, X.; Suffet, I.M.; Stuetz, R.M. Monitoring techniques for odour abatement assessment. Water Res. 2010, 44, 5129–5149. [Google Scholar] [CrossRef] [PubMed]
  13. Belgiorno, V.; Naddeo, V.; Zarra, T. Odour Impact Assessment Handbook 2013; Belgiorno, V., Naddeo, V., Zarra, T., Eds.; Wiley: Chichester, UK, 2013. [Google Scholar]
  14. Kośmider, J.; Mazur-Chrzanowska, B.; Wyszyński, B. Odory [Odours]; PWN: Warszawa, Poland, 2012. [Google Scholar]
  15. Sówka, I.; Skrętowicz, M.; Sobczyński, P.; Zwoździak, J. Estimating odour impact range of a selected wastewater treatment plant for winter and summer seasons in Polish conditions using CALPUFF model. Int. J. Environ. Pollut. 2014, 54, 242. [Google Scholar] [CrossRef] [Green Version]
  16. Capelli, L.; Sironi, S.; Del Rosso, R.; Céntola, P.; Grande, M.I. A comparative and critical evaluation of odour assessment methods on a landfill site. Atmos. Environ. 2008, 42, 7050–7058. [Google Scholar] [CrossRef]
  17. Bax, C.; Sironi, S.; Capelli, L. How can odors be measured? An overview of methods and their applications. Atmosphere 2020, 11, 92. [Google Scholar] [CrossRef] [Green Version]
  18. Blazy, V.; De-Guardia, A.; Benoist, J.C.; Daumoin, M.; Guiziou, F.; Lemasle, M.; Wolbert, D.; Barrington, S. Correlation of chemical composition and odor concentration for emissions from pig slaughterhouse sludge composting and storage. Chem. Eng. J. 2015, 276, 398–409. [Google Scholar] [CrossRef]
  19. Fang, J.; Zhang, H.; Yang, N.; Shao, L.; He, P. Gaseous pollutants emitted from a mechanical biological treatment plant for municipal solid waste: Odor assessment and photochemical reactivity. J. Air Waste Manag. Assoc. 2013, 63, 1287–1297. [Google Scholar] [CrossRef]
  20. Schiavon, M.; Martini, L.M.; Corrà, C.; Scapinello, M.; Coller, G.; Tosi, P.; Ragazzi, M. Characterisation of volatile organic compounds (VOCs) released by the composting of different waste matrices. Environ. Pollut. 2017, 231, 845–853. [Google Scholar] [CrossRef]
  21. Wiśniewska, M.; Kulig, A.; Lelicińska-Serafin, K. Olfactometric testing as a method for assessing odour nuisance of biogas plants processing municipal waste. Arch. Environ. Prot. 2020, 46, 60–68. [Google Scholar] [CrossRef]
  22. Zhu, Y.-L.; Zheng, G.-D.; Gao, D.; Chen, T.-B.; Wu, F.-K.; Niu, M.-J.; Zou, K.-H. Odor composition analysis and odor indicator selection during sewage sludge composting. J. Air Waste Manag. Assoc. 2016, 66, 930–940. [Google Scholar] [CrossRef]
  23. Laor, Y.; Parker, D.; Pagé, T. Measurement, prediction, and monitoring of odors in the environment: A critical review. Rev. Chem. Eng. 2014, 30, 139–166. [Google Scholar] [CrossRef]
  24. Parker, D.B.; Koziel, J.A.; Cai, L.; Jacobson, L.D.; Akdeniz, N.; Bereznicki, S.D.; Lim, T.T.; Caraway, E.A.; Zhang, S.; Hoff, S.J.; et al. Odor and odorous chemical emissions from animal buildings: Part 6. odor activity value. Trans. ASABE 2012, 55, 2357–2368. [Google Scholar] [CrossRef]
  25. Wu, C.; Liu, J.; Yan, L.; Chen, H.; Shao, H.; Meng, T. Assessment of odor activity value coefficient and odor contribution based on binary interaction effects in waste disposal plant. Atmos. Environ. 2015, 103, 231–237. [Google Scholar] [CrossRef]
  26. Di, Y.; Liu, J.; Liu, J.; Liu, S.; Yan, L. Characteristic analysis for odor gas emitted from food waste anaerobic fermentation in the pretreatment workshop. J. Air Waste Manag. Assoc. 2013, 63, 1173–1181. [Google Scholar] [CrossRef] [Green Version]
  27. Guclu, G.; Sevindik, O.; Kelebek, H.; Selli, S. Determination of volatiles by odor activity value and phenolics of cv. Ayvalik early-harvest olive oil. Foods 2016, 5, 46. [Google Scholar] [CrossRef] [Green Version]
  28. Hayes, J.; Stevenson, R.; Stuetz, R. The impact of malodour on communities: A review of assessment techniques. Sci. Total. Environ. 2014, 500–501, 395–407. [Google Scholar] [CrossRef]
  29. Wiśniewska, M. Methods of assessing odour emissions from biogas plants processing municipal waste. J. Ecol. Eng. 2020, 21, 140–147. [Google Scholar] [CrossRef]
  30. Wiśniewska, M.; Kulig, A.; Lelicińska-Serafin, K. The importance of the microclimatic conditions inside and outside of plant buildings in odorants emission at municipal waste biogas installations. Energies 2020, 13, 6463. [Google Scholar] [CrossRef]
  31. Bontempelli, G.; Comisso, N.; Toniolo, R.; Schiavon, G. Electroanalytical sensors for nonconducting media based on electrodes supported on perfluorinated ion-exchange membranes. Electroanalysis 1997, 9, 433–443. [Google Scholar] [CrossRef]
  32. Cao, Z.; Buttner, W.J.; Stetter, J.R. The properties and applications of amperometric gas sensors. Electroanalysis 1992, 4, 253–266. [Google Scholar] [CrossRef]
  33. Szulczyński, B.; Gębicki, J. Currently commercially available chemical sensors employed for detection of volatile organic compounds in outdoor and indoor air. Environments 2017, 4, 21. [Google Scholar] [CrossRef] [Green Version]
  34. Rezende, G.C.; Le Calvé, S.; Brandner, J.J.; Newport, D. Micro photoionization detectors. Sens. Actuators B Chem. 2019, 287, 86–94. [Google Scholar] [CrossRef]
  35. Capelli, L.; Sironi, S.; Del Rosso, R. Electronic noses for environmental monitoring applications. Sensors 2014, 14, 19979–20007. [Google Scholar] [CrossRef] [PubMed]
  36. Font, X.; Artola, A.; Sánchez, A. Detection, composition and treatment of volatile organic compounds from waste treatment plants. Sensors 2011, 11, 4043–4059. [Google Scholar] [CrossRef] [Green Version]
  37. Moreno, A.; Arnaiz, N.A.; Font, R.; Carratalá, A. Chemical characterization of emissions from a municipal solid waste treatment plant. Waste Manag. 2014, 34, 2393–2399. [Google Scholar] [CrossRef] [PubMed] [Green Version]
  38. European Commission. Council directive 1999/13/EC of 11 March 1999 on the limitation of emissions of volatile organic compounds due to the use of organic solvents in certain activities and installations. Offic. J. Eur. Commun. 1999, L 085, 1–24. [Google Scholar]
  39. Cheng, Z.; Sun, Z.; Zhu, S.; Lou, Z.; Zhu, N.; Feng, L. The identification and health risk assessment of odor emissions from waste landfilling and composting. Sci. Total. Environ. 2019, 649, 1038–1044. [Google Scholar] [CrossRef] [PubMed]
  40. Orzi, V.; Riva, C.; Scaglia, B.; D’Imporzano, G.; Tambone, F.; Adani, F. Anaerobic digestion coupled with digestate injection reduced odour emissions from soil during manure distribution. Sci. Total. Environ. 2018, 621, 168–176. [Google Scholar] [CrossRef] [PubMed]
  41. Jia, C.; Cao, K.; Valaulikar, R.; Fu, X.; Sorin, A.B. Variability of Total Volatile Organic Compounds (TVOC) in the indoor air of retail stores. Int. J. Environ. Res. Public Health 2019, 16, 4622. [Google Scholar] [CrossRef] [PubMed] [Green Version]
  42. Standard EN 13725: 2003. Air Quality-Determination of Odour Concentration by Dynamic Olfactometry; CEN: Brussels, Belgium, 2003. [Google Scholar]
  43. Rassia, S.T. Statistical analysis. In SpringerBriefs in Public Health; Springer Science and Business Media: Berlin/Heidelberg, Germany, 2017; pp. 53–63. [Google Scholar]
  44. Kelley, K.; Darku, F.B.; Chattopadhyay, B. Sequential accuracy in parameter estimation for population correlation coefficients. Psychol. Methods 2019, 24, 492–515. [Google Scholar] [CrossRef] [PubMed]
  45. Amoore, J.E.; Hautala, E. Odour as an aid to chemical safety: Odor thresholds compared with threshold limit values and vol-atilities for 214 industrial chemicals in air and water dilution. J. Appl. Toxicol. 1983, 3, 272–290. [Google Scholar] [CrossRef]
  46. Gębicki, J.; Dymerski, T.; Namieśnik, J. Investigation of air quality beside a municipal landfill: The fate of malodour com-pounds as a model VOC. Environments 2017, 4, 7. [Google Scholar] [CrossRef]
  47. Leonardos, G.; Kendall, D.; Barnard, N. Odor threshold determinations of 53 odorant chemicals. J. Air Pollut. Control. Assoc. 1969, 19, 91–95. [Google Scholar] [CrossRef] [Green Version]
  48. DHHS. Criteria for a Recommended Standard: Occupational Exposure to Phenol; DHHS (NIOSH) Publication: Spokane, WA, USA, 1976; pp. 76–196. [Google Scholar]
  49. Conti, C.; Guarino, M.; Bacenetti, J. Measurements techniques and models to assess odor annoyance: A review. Environ. Int. 2020, 134, 105261. [Google Scholar] [CrossRef] [PubMed]
  50. Toledo, M.; Gutiérrez, M.; Siles, J.; Martín, M. Full-scale composting of sewage sludge and market waste: Stability monitoring and odor dispersion modeling. Environ. Res. 2018, 167, 739–750. [Google Scholar] [CrossRef] [PubMed]
  51. Toledo, M.; Gutiérrez, M.; Siles, J.; Martín, M. Odor mapping of an urban waste management plant: Chemometric approach and correlation between physico-chemical, respirometric and olfactometric variables. J. Clean. Prod. 2019, 210, 1098–1108. [Google Scholar] [CrossRef]
  52. European Union. Commission implementing decision (EU) 2018/1147 of 10 August 2018 establishing best available tech-niques (BAT) conclusions for waste treatment, under Directive 2010/75/EU of the European parliament and of the council. Off. J. Eur. Union 2018, 208, 38–90. [Google Scholar]
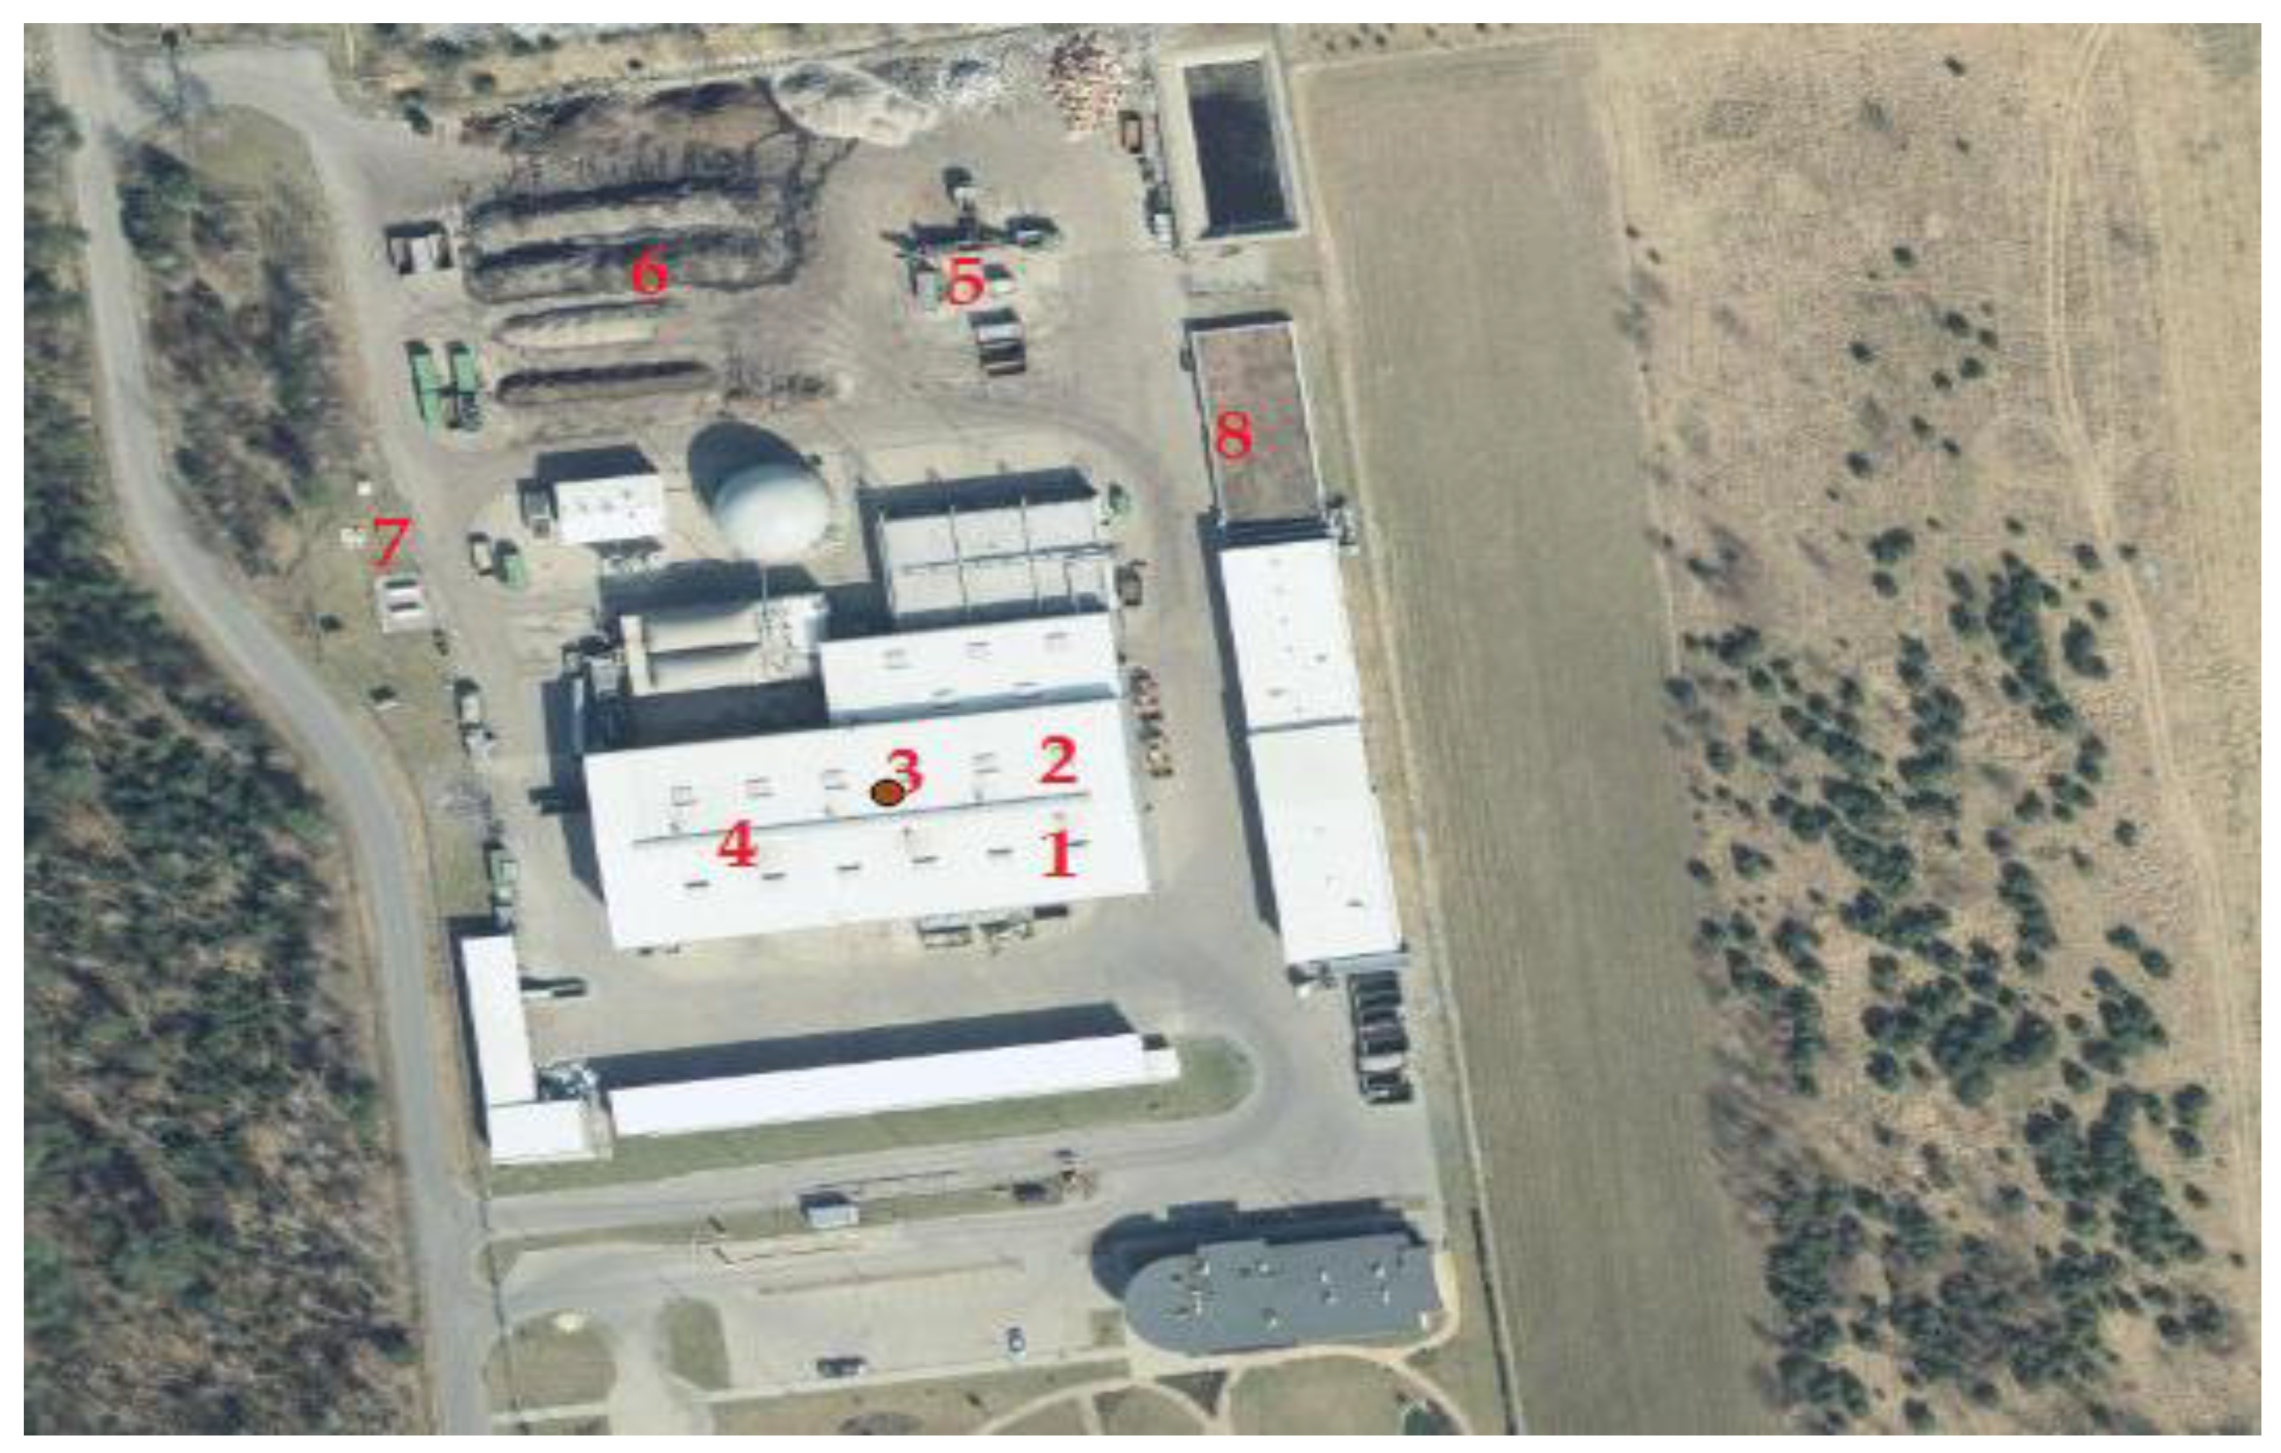
Figure 1. Measurement points locations at biogas plant in Biała Podlaska.
Applsci 11 03916 g001
Figure 2. Measurement points locations at biogas plant in Promnik.
Applsci 11 03916 g002
Figure 3. Measurement points locations at biogas plant in Wólka Rokicka.
Applsci 11 03916 g003
Figure 4. The results obtained at biogas plant located in Biała Podlaska, (a) Odorant concentrations. (b) Odour activity values (based on toluene) and odour concentration at individual measurement points: 1, inside the waste storage plant; 2, mixed waste storage; 3, selectively collected waste storage; 4, mechanical treatment; 5, fermentation preparation; 6, oxygen stabilization; 7, technological wastewater pumping station; and 8, biofilter. (c) Range of odour activity values (based on toluene, styrene, and phenol).
Applsci 11 03916 g004aApplsci 11 03916 g004b
Figure 5. The results obtained at biogas plant located in Promnik. (a) Odorant concentrations. (b) Odour activity values (based on toluene) and odour concentration at individual measurement points: 1, inside the waste storage plant; 2, mixed waste storage; 3, selectively collected waste storage; 4, mechanical treatment; 5, fermentation preparation; 6, oxygen stabilization; 7, technological wastewater pumping station; and 8, digestate dewatering. (c) Range of odour activity values (based on toluene, styrene, and phenol).
Applsci 11 03916 g005aApplsci 11 03916 g005b
Figure 6. The results obtained at biogas plant located in Wólka Rokicka. (a) Odorant concentrations. (b) Odour activity values (based on toluene) and odour concentration at individual measurement points: 1, inside the waste storage plant; 2, mixed waste storage; 3, selectively collected waste storage; 4, mechanical treatment; 5, fermentation preparation; 6, oxygen stabilization; 7, technological wastewater pumping station; and 8, biofilter. (c) Range of odour activity values (based on toluene, styrene, and phenol).
Applsci 11 03916 g006aApplsci 11 03916 g006b
Table 3. The results of microclimate parameter measurements.
Biogas PlantTi (°C)To (°C)RHi (%)RHo (%)
Biała Podlaska21.320.147.850.2
Promnik20.116.663.156.6
Wólka Rokicka26.025.349.340.7
Table 4. Correlation coefficients between VOC and ammonia concentrations, OAV-NH3 and cod, and OAV-VOCs-cod at individual plants.
Biogas Plant LocationVOC-NH3OAV-NH3-codOAV-VOCs-cod
rrhotaubrrhotaubrrhotaub
Biała Podlaska0.9950.7370.6170.9990.9340.8900.9950.8850.794
Promnik0.149−0.160−0.1540.9270.6130.4900.4150.4610.34
Wólka Rokicka−0.307−0.220−0.1890.9900.5440.459−0.307−0.346−0.276
Publisher’s Note: MDPI stays neutral with regard to jurisdictional claims in published maps and institutional affiliations.