1. Introduction-Method and Instrumentation
X-ray and neutron-transmission imaging are used for non-destructive measurements of samples originating from a broad range of application areas. Whereas X-ray imaging is well known from its medical applications, neutron imaging is more suitable for transmission through materials like metals or minerals. This is due to the different types of radiation–matter interactions, which for X-rays is proportional to the electron density of a material, i.e., it scales with the number of electrons in the atom, whereas the neutron interacts with the atomic nuclei. Combining both neutron and X-ray measurements of a specific sample allows for the use of the different contrast mechanisms provided by these two imaging modalities to enable enhancements of the information obtained for a sample. By implementing an X-ray source in the neutron imaging instrument NEUTRA [
1], we enabled both X-ray and neutron imaging capabilities within a single facility, available for external users at the spallation neutron source SINQ of the Paul Scherrer Institute. This article provides an overview of the facility, but in particular a retrospective of this pioneering installation and its results as a forerunner of bi-modal neutron and X-ray imaging, which is now available or planned for at many leading neutron imaging instruments worldwide, including ICON at PSI, Switzerland; NEXT at ILL Grenoble, France; nEXT at NIST, USA; ODIN at ESS, Sweden; and VENUS at ORNL, USA. Compared to the XTRA setup with its sequential approach, the before mentioned facilities prefer a simultaneous scanning with the source/detectors perpendicular to each other, viewing the sample at the same time. In these cases, the beam geometry cannot be identical, and the comparison can only be done after reconstruction of the data on the voxel level.
1.1. Neutron vs. X-ray Imaging: Physics and Cross-Section Data
Both X-rays and neutrons can transmit through many objects and be recorded subsequently by position-sensitive area detectors, providing corresponding radiographic images. This allows for non-destructive examinations of the interior of samples. Such imaging facilities are quite easy: the beam from the source is sent to the sample via a collimator and the transmitted part of the beam is registered by the radiation imaging detector. Today, most image data are obtained in a digital format, i.e., a discrete pixel data set of the spatial intensity distribution can be generated (see below). The image formation of both types of radiation follows the Beer Lambert law, however, the attenuation characteristics of both radiations are significantly different and often complementary. The energy and wavelength-dependent attenuation coefficients of neutrons and X-rays can be calculated from tabulated cross sections [
2,
3]. Most laboratory X-ray sources are of the tube type and provide a continuous spectrum of X-ray photons depending on the tube voltage. However, X-ray imaging is also performed at synchrotron light sources [
4].
X-rays are electromagnetic radiation that mainly interacts with the electrons in the atomic shell. This leads to a distinct dependence on the atomic number Z. The more electrons there are in a chemical element, the stronger it interacts with the X-ray radiation. Therefore, X-rays do not easily penetrate metals while biological materials, mainly consisting of hydrogen and carbon, are quite transparent.
Neutrons, on the other hand, are charge-free particles existing in the atomic nuclei together with the protons. Free neutrons result from nuclear reactions, e.g., fission of heavy nuclei like uranium or plutonium or from bombarding of heavy nuclei, e.g., lead, with a highly energetic proton beam, inducing spallation. Neutron imaging needs quite powerful neutron sources, i.e., a fission research reactor like FRM-2 in Munich [
5], a spallation neutron source like SINQ [
6], or the European Spallation Source, to reach the neutron flux required for acquiring single images within a few seconds and with sufficiently high spatial resolution, comparable to that of an X-ray tube. The energy range most useful for neutron imaging and scattering investigations is in the range of thermal (25 meV) and cold neutrons (<25 meV). At these energies, neutrons have favorable properties to interact with condensed matter, e.g., due to wavelengths (according to de Broglie‘s relation) of a few Ångstrom-matching interatomic distances.
In addition, at such energies they have a high probability to be captured by relevant isotopes such as 3He, 10B, 6Li, and 157Gd, which thereby produce charged particles inducing, for example, light emissions in scintillator materials. Thus, the detection efficiency is particularly high in this spectral range.
In contrast to X-rays, neutrons, which carry no charge, interact with the atomic nuclei and thus there is no systematic dependence of cross sections on the atomic number. There are even strong variations in neutron–matter interactions depending on the isotope considered, e.g., 1H and 2D, 6Li and 7Li, or 10B and 11B. Even high Z materials like lead or uranium are transmitted relatively well, whereas hydrogen has a high scattering cross section for thermal and cold neutrons. Therefore, combining X-ray and neutron imaging in a dual modality setup allows for the use of their complementary contrast mechanisms for a better understanding of the hidden structures of samples subject to radiographic inspection.
This is underlined by the example in
Figure 1 with the same image quality and spatial resolution but very different contrasts for the involved components and structures. How far the involved attenuation properties can deviate for X-rays and neutrons is exemplified by the data in
Table 1.
1.2. Standard Configuration of the NEUTRA Facility
NEUTRA [
1] is the thermal neutron imaging instrument at the spallation neutron source SINQ [
6] of the Paul Scherrer Institute (PSI) in Switzerland. It provides neutron radiography and tomography options of medium to large size objects (a few mm up to 35 cm) using a thermal neutron spectrum. The instrument has been operational since the late 1990s and was the first dedicated neutron imaging instrument at PSI, established together with the spallation source (
Figure 2a). It has seen more than 20 years of international scientific and industrial user service. For nearly 15 years, the special feature of a 320 kV X-ray tube has been available at NEUTRA, allowing bi-modal imaging with identical imaging geometry, enabling straight forward registration of X-ray and neutron datasets.
NEUTRA consists of evacuated neutron flight-tubes downstream of a 20 mm diameter pinhole and is viewed in SINQ’s D
2O moderator tank. NEUTRA features three measurement positions to trade flux versus resolution. These positions are at distances of 3.8 m (position 1), 7.3 m (position 2), and 10.5 m (position 3) from the collimating pinhole. They provide collimation ratios from 200 to 550, with about an order of magnitude difference in available flux and maximum beam cross sections from 10 × 10 to 35 × 35 cm
2. Position 1 is tightly enclosed by shielding walls and can be assessed only from the top. In this position (position 1) the optional 320 kV X-ray source has been installed and can be moved remotely into the operating position in the neutron beam axis (
Figure 2b). The standard detectors utilized at NEUTRA consist of a scintillator screen, light optics, and a digital camera system [
7]. Scintillator screens and cameras, as well as the detector systems are easily exchangeable and enable straightforward adaptations to each individual use case.
1.3. Properties of the X-ray Setup XTRA
An X-ray tube, GE ISOVOLT-Titan 320, can be positioned in the beam path of NEUTRA at position 1 close to the SINQ target block wall, thereby providing an almost identical imaging geometry for neutrons and X-rays. The tube features a tungsten target with two focus spot sizes of either 3 mm or 5.5 mm diameter.
The X-ray tube is mounted on a linear stage, which allows remote controlled positioning of the X-ray source spot in the center of the beam path. For this purpose, one has to remove the first section of the evacuated collimator pipe. A special scintillator-changing box that allows switching between a neutron and X-ray scintillator screen has been built for the detector at position 2 (
Figure 3). The corresponding beam collimations for neutrons and X-rays are provided in
Table 2 alongside the corresponding geometrical parameters. The initial beam aperture for the neutrons D is about a factor 4 to 7 times larger than the X-ray source spot size P. The collimation length L differs in favor of the neutrons because the neutron aperture is inside the target block close to the moderator tank while the X-ray tube has to be positioned in the flight path downstream of the source shielding (see
Figure 2b). Thus, the maximum discrepancy in collimation is about 4, the minimum <2, in all cases in favor of the X-ray collimation due to the small spot size as compared to D. However, in general, the resolution is not limited by the beam divergence but only by the inherent properties of the detector systems used. Therefore, the resulting spatial resolutions of the neutron and X-ray imaging systems in NEUTRA are on par with each other.
1.4. Detector Features at NEUTRA and Modifications for the XTRA Option
The most sensitive scintillator screen for thermal neutrons with respect to the light emission is based on
6Li in conjunction with ZnS. This combination has been in use since the early application of digital detectors [
7], but it has been optimized continuously. Layers between 0.05 and 0.3 mm can be produced where light output and spatial resolution are in competition [
8]. For X-ray detection, calcium tungstate CaWO4 or gadolinium oxysulfide Gd2O2S screens are commonly in use. The layer thickness is about 0.1 mm. In principle, gadolinium oxysulfide is sensitive to neutrons too due to the high capture probability by Gd. However, its light emission is much less than that provided by 6Li/ZnS screens. The neutron and X-ray interaction with the scintillator screen generates charged particles that induce light emission in the phosphors to be registered by camera-based detection systems. Cameras are currently the most common type of acquisition systems due to the high sensitivity, linearity, dynamic range, and signal-to-noise ratio. In addition to a detector setup at position 2 for medium sample sizes, another detector system is operational at position 3 for the larger field of view (35 cm), in this case, however, without a remotely controlled scintillator exchanger.
2. Data Interpretation and Data Fusion
The transmission image obtained by neutrons and by X-rays can be described by the Beer–Lambert law
For a homogenous material of the thickness d in beam direction
x this is
where
I0 is the incident intensity, which can be measured without a sample in the beam, while
I is the transmitted intensity. The incident beam is attenuated exponentially depending on the linear attenuation coefficient
A of the material in the beam and the thickness
d of the material layer, which enters the equation through the integral along the flight path in the x-direction.
The difference between neutron and X-ray attenuation is solely reflected by the specific linear attenuation coefficients, which we here denote as ∑ and µ, respectively. As outlined earlier, both the neutron and X-ray linear attenuation coefficients are highly energy dependent. The linear attenuation coefficient ∑ is related to the tabulated total microscopic cross sections σ (absorption and scattering) [
2,
3] through the number density
N of atoms per cm
3 by ∑ =
N*
σ and, thus, has the unit of a reciprocal length (cm
−1). For composite materials (with
i as the index of the specific material) it is
In the case of X-rays, there are no tabulated microscopic cross sections available. The database is directly in the unit cm
−1 or even as “mass-attenuation coefficient µ/ρ” in cm
2/g, with the density ρ [
3].
The transmission T refers to the exponential term of the Beer–Lambert law (Equation (2)) as
From this it becomes obvious that for a single transmission image, only the
can be retrieved without a priori knowledge about material phases and thickness of the sample. Through tomography, which requires a number of projection images to be taken on, e.g., a range of 180°, the local attenuation coefficient
A(
x,
y,
z) can be retrieved with the corresponding spatial resolution of a specific measurement and the reconstructed discrete voxels according to
Ai,j,k [
9].
Using the XTRA setup, two individual data sets, Tθ,i,j, where θ refers to the projection angle, and tomographic reconstructions of ∑i,j,k and µi,j,k can be obtained. Both data sets (Tn and Tx) and tomograms (∑i,j,k and µi,j,k) can be correlated in the best case pixel, voxel-wise. Different strategies to combine the data, depending on the aim of a specific investigation, can be applied.
- A.
Combination of final analyses results
In many cases, neutrons and X-rays will provide different images of the very same object due to the different contrast behaviors. Thus, different material phases will be better resolved in one or the other reconstructed volume. Therefore, the structure and specific features of these material phases are analyzed in the respective reconstructed volume where it is best resolved. For example, the porosity found in one material by one modality together with the cracks found with the other modality in another phase provide a more complete picture of the specimen than any single modality would have been able to provide. The added value of the combined instrumentation in NEUTRA is that the found features can be directly correlated spatially and, to stay in the given example, a correlation of porosity in one material and cracking in another might be identified and constitute synergetic added value and information content. Today, this approach is extensively applied to investigations of liquid, in particular water, uptake in materials, which are better resolved by X-rays [
10]. Another prominent example is battery research, where X-rays resolve the structural components and only neutrons are sensitive to the Li exchange process [
11].
- B.
Combined analyses of separate data-sets
Another approach to the data analyses, which was developed subsequently, involves correlated analyses of both data sets, as represented in bivariate histograms, and corresponding combined segmentation. Often, this colocation analysis requires a registration operation to align the two data sets. At NEUTRA, this is less important due to the use of the same beam geometry and thus the projections are already aligned through the setup. There are cases when the sample has been displaced between the acquisitions. In these cases, the registration is mostly done using commercial software such as VG Studio MAX. This enables, in many cases, the identification of specific material phases due to their complementary contrast behavior and specific combinations of neutron and X-ray attenuation (
Figure 4) [
12,
13]. Specifically, in [
12] the registration was done using a combination of commercially available and custom-developed Monte Carlo-based algorithms.
- C.
Analyses of combined data sets
The most advanced approach consists in the attempt to correlate data before or during reconstruction. One example is to use X-ray data with a high signal-to-noise ratio and higher resolution to improve the quality of the reconstructed neutron data. The concept of using structural priors provided by reconstructed X-ray data to improve the quality of the reconstructed neutron data was demonstrated by [
14].
Visualization of bi-modal tomographic data is another challenge not only for data presentation but also for inspection and understanding. For efficient visualization, different strategies are known and applied. These include but are not limited to the following:
- (i)
Visualization based on color coding using the measured intensity of the modalities directly based on different color models and opacity:
Let each contrast modality control a color channel in an RGB image [
13] (
Figure 4). The remaining color channel is usually the average of the two modalities;
Let one contrast modality index a color map while the brightness is controlled by the other modality;
Interpret the images as orthogonal vectors, and the computed length of the vector sum and angle between the sum and an image will indicate which is more intense compared to the HSV color model.
- (ii)
Visualization based on segmentation:
3. Examples of Applications
The neutron investigations at NEUTRA that were combined with X-ray imaging investigations of the same objects elsewhere were reported rather early [
15] and provided justification for the installation of the XTRA X-ray source at the NEUTRA beamline.
Over the years, a wealth of studies has been performed bi-modally at NEUTRA, of which a few seminal examples of different research areas shall be discussed retrospectively, highlighting the pioneering character of this installation.
3.1. The Sword from Oberwil
In September 2010 a sword was retrieved near the village of Oberwil from the ground of the lake of Zug.
Presumably it has been lying there for more than 450 years. The highly ornamented hilt with detailed wood carvings and a multitude of decorative metal inlays indicates that this weapon was already very exclusive at the time it was made and was mainly intended as a showpiece. Nevertheless, signs of wear on the hilt and marks on the blade indicate that it had been in regular use. More detailed information on the history and conservation treatment of the sword can be found in [
16,
17].
The aim of the combined neutron/X-ray tomography investigation [
18] was to learn more about its making and the condition after the conservation treatment. The X-ray/neutron tomography combination proved especially beneficial due to its complementarity with regards to the metal and organic parts. While X-rays showed high transmission through the wooden parts of the sword hilt, the multitude of small decorative inlays and nails yielded very high contrast. Neutron tomography allowed good penetration of the iron-based blade and showed high contrast for the wooden parts (
Figure 5). Information on the wood structure cannot be retrieved from the X-ray data. This is due to the low attenuation of wood and thus the low contrast and the concurrent high attenuation of the very large number of small decorative metal nails and inlays covering the entire hilt. From XRF (X-ray fluorescence) analyses, which are reported in [
17], it is known that the small metallic inlays consist of tin amalgam. The presence of tin and mercury results in very high X-ray attenuation coefficients for these small decorations, yielding strong artefacts in the reconstructed tomography data set. While it is still possible to obtain information on the distribution of the metallic decorations, it is practically impossible to retrieve details from the wood structure as the reconstruction artefacts from the tin amalgam superimpose this information. The metal of the blade itself, which consists to the greatest part of iron, does not show these difficulties. The result of the neutron tomography proves complementary to these X-ray data. The metallic decorations on the grips are practically invisible, while the wood shows a very high contrast. While it is not possible to obtain much information on the decorations, the structure in the wood can be analyzed. It shows that different wood species were used for the construction. While the visible parts of the grip and the guard are made of box wood (Buxus sempervirens), the small plate used in the pommel as an interlock appears to consist of softwood (cf.
Figure 6b). The neutron data also reveals information on the actual mounting of the different parts of the grip; between the tang and grip, thin plates of softwood have been inserted preventing the grip from moving (cf.
Figure 6c). It furthermore appears that part of the knots, which are used as decorative elements, are not natural but seem to have been added artificially. This can be seen in the characteristics of the wood structure, i.e., the tree ring borders, which naturally converge towards knots containing a nail as a decorative element (cf.
Figure 6d). This behavior is not visible for all apparent knots, which implies that some are not naturally grown, but artificially added for symmetry reasons.
A comparison of the whole sword, composed of three stacked volumes, is given in
Figure 7 in the outer rendering format
3.2. Crucible Fragments from Augusta Raurica
Augusta Raurica was a Roman settlement in Northern Switzerland on the south bank of the Rhine river. The settlement played an important role as an administrative, cultural, commercial, and industrial center in the region. Due to the relatively intact nature of the site, many important finds have been made, such as the silver treasure of Augusta Raurica. In addition to such spectacular finds, the houses and workshops of the common people play a very important role for the understanding of the daily life in such Roman settlements. Metal working and especially bronze casting is of particular interest for the archaeologists as a couple of workshops have been found in good condition. The researchers hope to gather more information on the technologies used for the production of metal objects during this period. One aspect of the whole process is the melting of the metal in melting pots or crucibles. The Roman craftsmen used different types of crucibles, with several layers of differing materials.
The goal of the presented investigation was to evaluate the structure and build-up of several crucible fragments, all found during excavations in Augusta Raurica [
19].
By means of the XTRA setup at NEUTRA we performed sequential tomography runs with thermal neutrons and 150 kV X-rays. The results are shown in
Figure 8 as vertical slices through the stack of ceramic shards. The grey levels are scaled to provide matching distributions within the bulk ceramic zones. This scaling allows a comparison between the two data sets and the respective deviations from the grey level of the ceramic zones. Both X-ray CT and neutron CT reveal regions that show a bright contrast, but the origin might be different: for neutrons these bright regions originate from organic components with their high hydrogen content, while for X-rays these bright regions are related to enclosures with higher density, such as metals.
The neutron and X-ray data are combined using color channel coding,
Figure 8 (right), providing a qualitative overview of the material composition in the shards, indicating organic materials as intense green and metals as red/orange on a background of green/brown, representing the mineral phases of the clay in the ceramic structures.
3.3. Investigations of Construction Materials
The investigations of water uptake/transport in concrete and cement-based materials are one of the oldest and still also the most frequent [
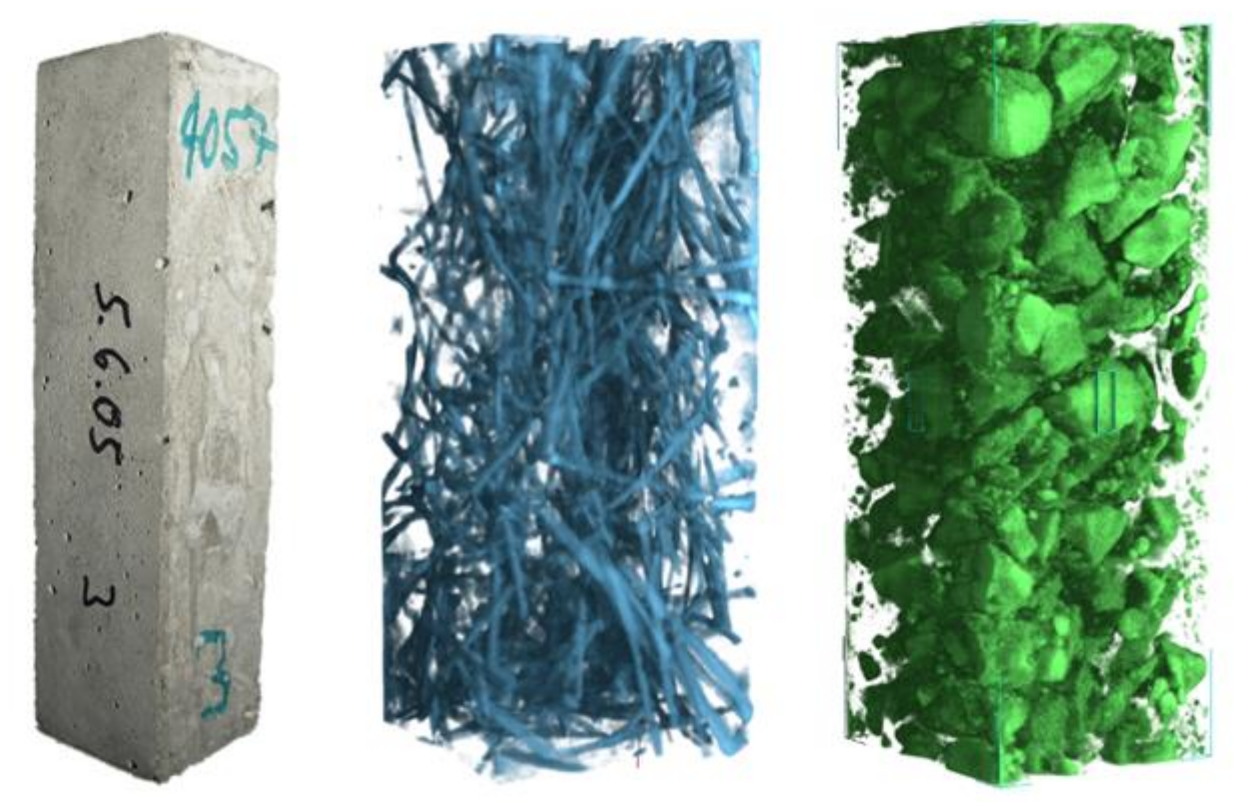
20] applications of transmission neutron imaging. The addition of the X-ray imaging modality allows for a significant extension of such investigations. One of our first applications of bi-modal N/X imaging focused on the investigation of the inner structure of fiber-reinforced concrete [
21], which allowed for the segmentation of aggregates and air voids from the neutron tomographic dataset, while the distribution of fiber reinforcement (0.1 mm stainless steel fibers) was based on the corresponding X-ray tomography (see
Figure 9).
Note that the spatial resolution of the neutron images in [
21] was more than an order of magnitude worse than it is today, and thus X-ray tomography provided better resolution of the steel fiber network.
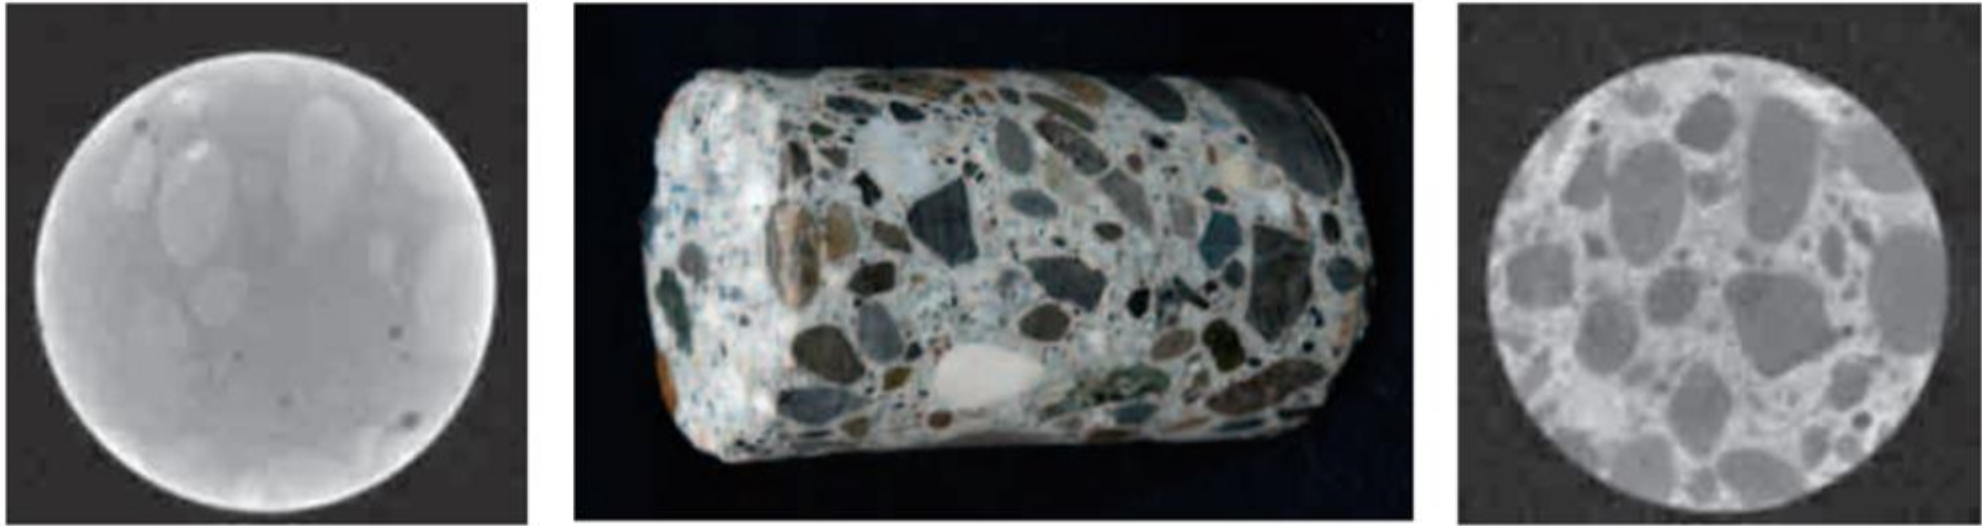
Concrete is one of the porous materials where the benefit of bimodal neutron/X-ray imaging is established by the high sensitivity and resolution of X-rays for the porous matrix, while neutrons provide superior contrast for the observation of a liquid hydrogenous phase distributed within the matrix. Only the combination of both provides meaningful insights. For example, the interfaces between light weight aggregate internal curing reservoirs and the adjacent cement paste can be detected by X-ray imaging while neutron imaging hardly enables a distinction of these phases. Thus, while the morphologies of such interfaces is examined by X-ray imaging, their impact on the water transport and function for internal curing reservoirs [
22] can only be illuminated by the added sensitivity of neutrons for the water distribution, see
Figure 10.
Another concrete-related field of investigation in which such a bi-modal approach has shown invaluable potential is the issue of corrosion of metal reinforcements in concrete. Corrosion of reinforcements is a threat to the sustainability and safety of our basic infrastructure and causes significant cost to society. Neutron imaging provides unique insights on corrosion of reinforcements within the concrete environment and the non-destructive nature allows for continued observations of corrosion processes in the context of the surrounding material. An example of an investigation at NEUTRA showing the 3D distribution of corrosion products and thus the extent of corrosion in a reinforced concrete specimen is shown in
Figure 11 [
24].
High resolution bi-modal neutron/X-ray studies enable yet more detailed insights, not only identifying individual corrosion pits on the rebar surfaces but correlating their respective position with different phases in the surrounding concrete matrix.
3.4. Study of Minerals
Apart from concrete and cement-based materials, the combination of neutrons and X-rays in imaging at NEUTRA has also been applied to visualize the inner structure of minerals. The combined information from the bimodal tomographies allowed for superior identification of the different phases contained in, for example, bog ore (see
Figure 12) and pyrite (see
Figure 13) [
25].
3.5. Multi-Modal Observations of Water Transport in Soils
Finally, bi-modal X-ray and neutron imaging has been established as a prominent tool for investigations of water transport in geological materials, in particular in soils [
26].
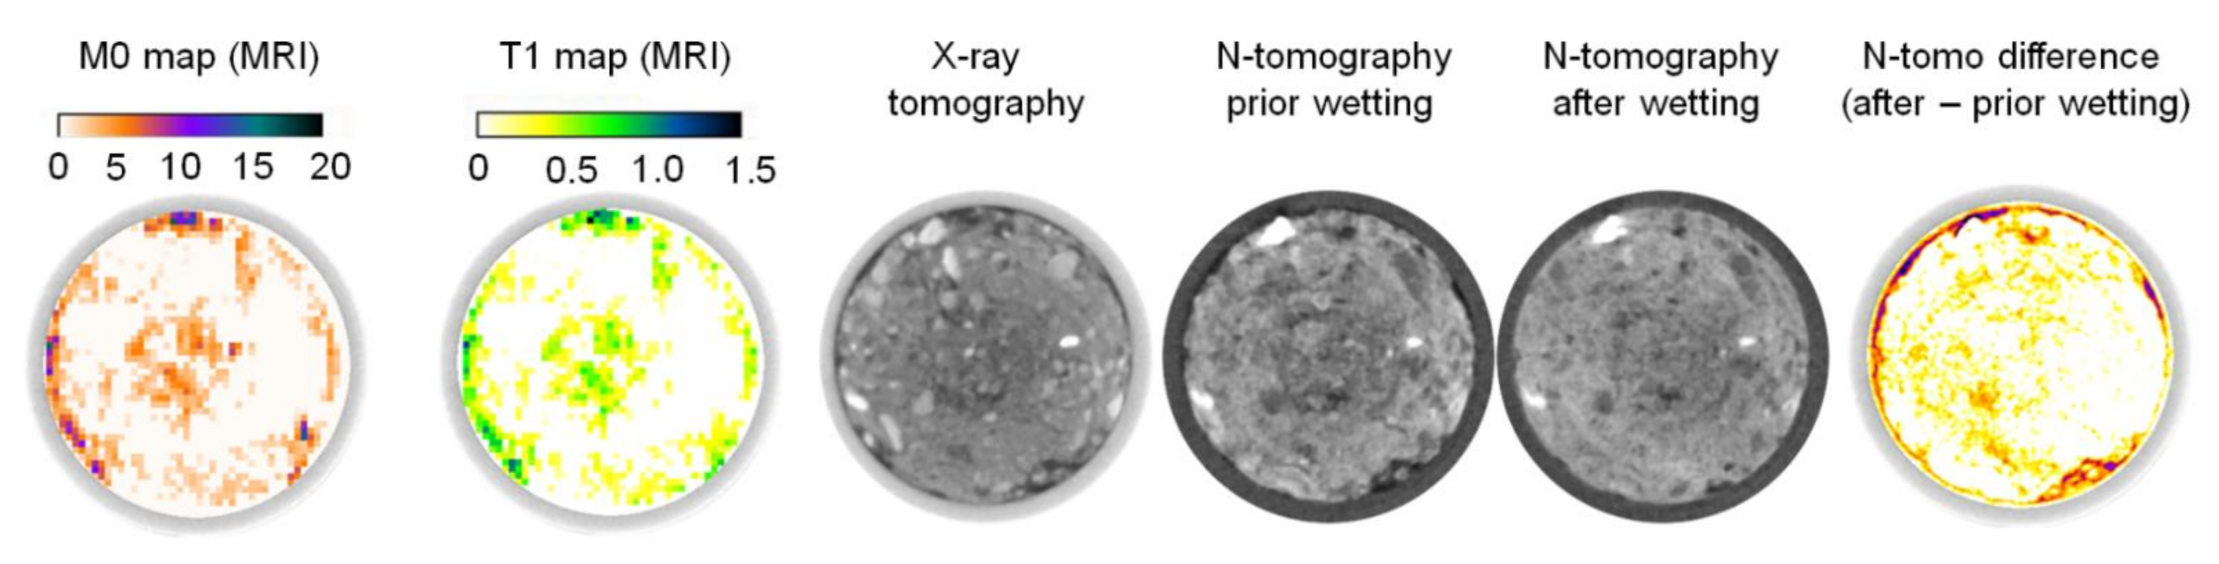
Here, a specific example shall be presented, where a third modality, namely magnetic resonance imaging (MRI), complemented NEUTRA’s bi-modal N/X capability.
Snehota et al. [
26] and Jelinkova et al. [
27] realized this tri-modal non-destructive imaging approach to study quasi-steady state flow instabilities in structured soil as well as flow dynamics during recurrent ponded infiltration on undisturbed soil samples, respectively.
Figure 14 shows corresponding tomographic slices of a soil sample observed by all three modalities at two different states of wetting. The provision of X-ray images allowed for the distinction between air voids and sand grains that are difficult to be identified correctly by the other modalities (N, MRI). The tri-modal imaging approach proved to be a well-suited tool for understanding the effects of entrapped residual air bubbles on water transport in soil.


 ,
, 


