Article

Life Cycle Assessment of an Innovative Hybrid Energy Storage System for Residential Buildings in Continental Climates

1
GREiA Research Group, Universitat de Lleida, Pere de Cabrera s/n, 25001 Lleida, Spain
2
National Council or Research Italy, Institute for Advanced Energy Technologies (CNR ITAE), Salita S. Lucia Sopra Contesse 5, 98126 Messina, Italy
3
Eurac Research, Institute for Renewable Energy, Viale Druso 1, 39100 Bolzano, Italy
*
Author to whom correspondence should be addressed.
Appl. Sci. 2021, 11(9), 3820; https://doi.org/10.3390/app11093820
Submission received: 26 March 2021 / Revised: 13 April 2021 / Accepted: 22 April 2021 / Published: 23 April 2021
(This article belongs to the Special Issue Retrofitting Buildings and Energy Efficiency)

Abstract

:
With the aim of contributing to achieving the decarbonization of the energy sector, the environmental impact of an innovative system to produce heating and domestic hot water for heating demand-dominated climates is assessed is evaluated. The evaluation is conducted using the life cycle assessment (LCA) methodology and the ReCiPe and IPCC GWP indicators for the manufacturing and operation stages, and comparing the system to a reference one. Results show that the innovative system has a lower overall impact than the reference one. Moreover, a parametric study to evaluate the impact of the refrigerant is carried out, showing that the impact of the overall systems is not affected if the amount of refrigerant or the impact of refrigerant is increased.

1. Introduction

The European Green Deal [1] includes new ambitious targets in Europe related to greenhouse gas (GHG) emissions to move towards a climate-neutral economy and to achieve the commitments under the Paris Agreement [2]. These key targets for 2030 include cuts of at least 40% GHG emissions compared to that of 1990 levels to achieve at least 32% share for renewable energy and to improve the energy efficiency at least by 32.5%. With these targets, Europe aims at becoming the first climate-neutral continent.
Key actions highlighted within this new strategy are the decarbonization of the energy sector, which clearly needs more renewable energy use and more energy storage implementation and to ensure that buildings are more energy efficient [3]. This can be obtained by merging green and smart technologies into a green smart building (GSB), as suggested and discussed in detail by Pramanik et al. [4]. However, a building automation control system is needed, especially in complex systems, such as the one reported by Liberati et al. [5]. In that study, an economic model predictive control approach was used to handle the problem of managing both electric and heating resources in a smart building to achieve nearly zero energy consumption and automated participation to demand response programs. An intelligent supervisory predictive control (ISPC) was proposed by Gonçalves et al. [6] to minimize energy consumption without sacrificing the thermal comfort of building occupants. The proposed methodology proved to be capable of assisting supervisory predictive control in commercial buildings for real-time applications. A comprehensive review of the importance of sensors in the built environment and their influence on energy saving, thermal and visual comfort, as well as indoor air quality was reported by Dong et al. [7].
With these targets in mind, a new concept was developed, where heating and domestic hot water (DHW) for buildings are produced with a high share of renewable energy (solar photovoltaic (PV)) and integration of both thermal and electrical storage [8]. Moreover, the concept is based on the use of a heat pump with a refrigerant that has low global warming potential (GWP) and is connected to the PV panels with direct current (DC). This approach is also a contribution towards the development of net-zero energy buildings (NZEB) [9].
Heat pumps have been integrated with energy storage for different purposes. For example, Meng et al. [10] showed that integrating thermal energy storage (TES) with an air source heat pump can reduce the number of on–off operations. Meng et al. [11] evaluated the heating energy and economic viability of an air source heat pump with latent TES for heating. Chwieduk and Chwieduk [12] analyzed the use of a PV system driving a heat pump with water storage and with batteries storage.
According to the literature, the choice of refrigerant plays a key role in vapor compression heat pumps since not only is the performance affected by this selection but also the environmental impact [13,14]. Refrigerants to be used should have low GWP and ozone depletion potential (ODP); GWP should be lower than 150 (EU Regulation 517/2014). Refrigerants complying with these requirements are natural refrigerants, hydrocarbons (HCs), low-GWP hydrofluorocarbons (HFCs), novel hydrofluoroolefins (HFOs), and hydrochlorofluorolefins (HCFOs) [15].
In this paper, an innovative system to produce heating and domestic hot water for heating demand-dominated climates is assessed from an environmental point of view. This system includes sensible, latent, and electrical storage to increase the use of renewable energy decreasing the use of fossil fuels, both as final energy in heating production in the building and as primary energy in the production of electricity for the grid. Moreover, this system integrates a three-media refrigerant/phase change material (PCM)/water heat exchanger in a heat pump using a low GWP refrigerant, R32. The performance of such a heat exchanger was demonstrated to be highly efficient [16]. Moreover, the economic performance of the full system has also been assessed [8]. The systems showed a payback time of 12.4 year with energy savings of 622 kWhel per year. That analysis also showed that this system is best suited for low-energy buildings in cold climates.
A step forward is the analysis of the environmental performance of this innovative system. Therefore, in this paper, LCA is used to evaluate the environmental impact of the system and to assess the contribution of the refrigerant used in the overall impact, considering the huge efforts by the industry to develop refrigerants with low GWP and to develop heat pumps to use those refrigerants.

2. Methods

2.1. Case Study

The selected building was assumed to be located in Stuttgart, in the German state of Baden-Württemberg, in the southwest side of the country where a reference building was defined for a continental climate where the studied system would be implemented. Moreover, a reference system was defined to compare the environmental and energetic performance with regard to the innovative system.
As a reference building, a refurbished multi-family house (MFH) was considered as the most representative building typology for the building stock in continental climate regions. The building has a total of five floors, with two dwellings per floor and an individual staircase located inside the building envelope. Each dwelling has a living surface area of 50 m2, inhabited by three people. The ceiling/floor heights considered were 2.5 m/3.0 m, while the building width/depth was 16.3 m/7.6 m. A flat concrete roof and a glazing ratio of 20% in the north and south facades were assumed according to the most common MFH. The building model includes two zones per dwelling (1–2 and 3–4), plus the staircase zone.
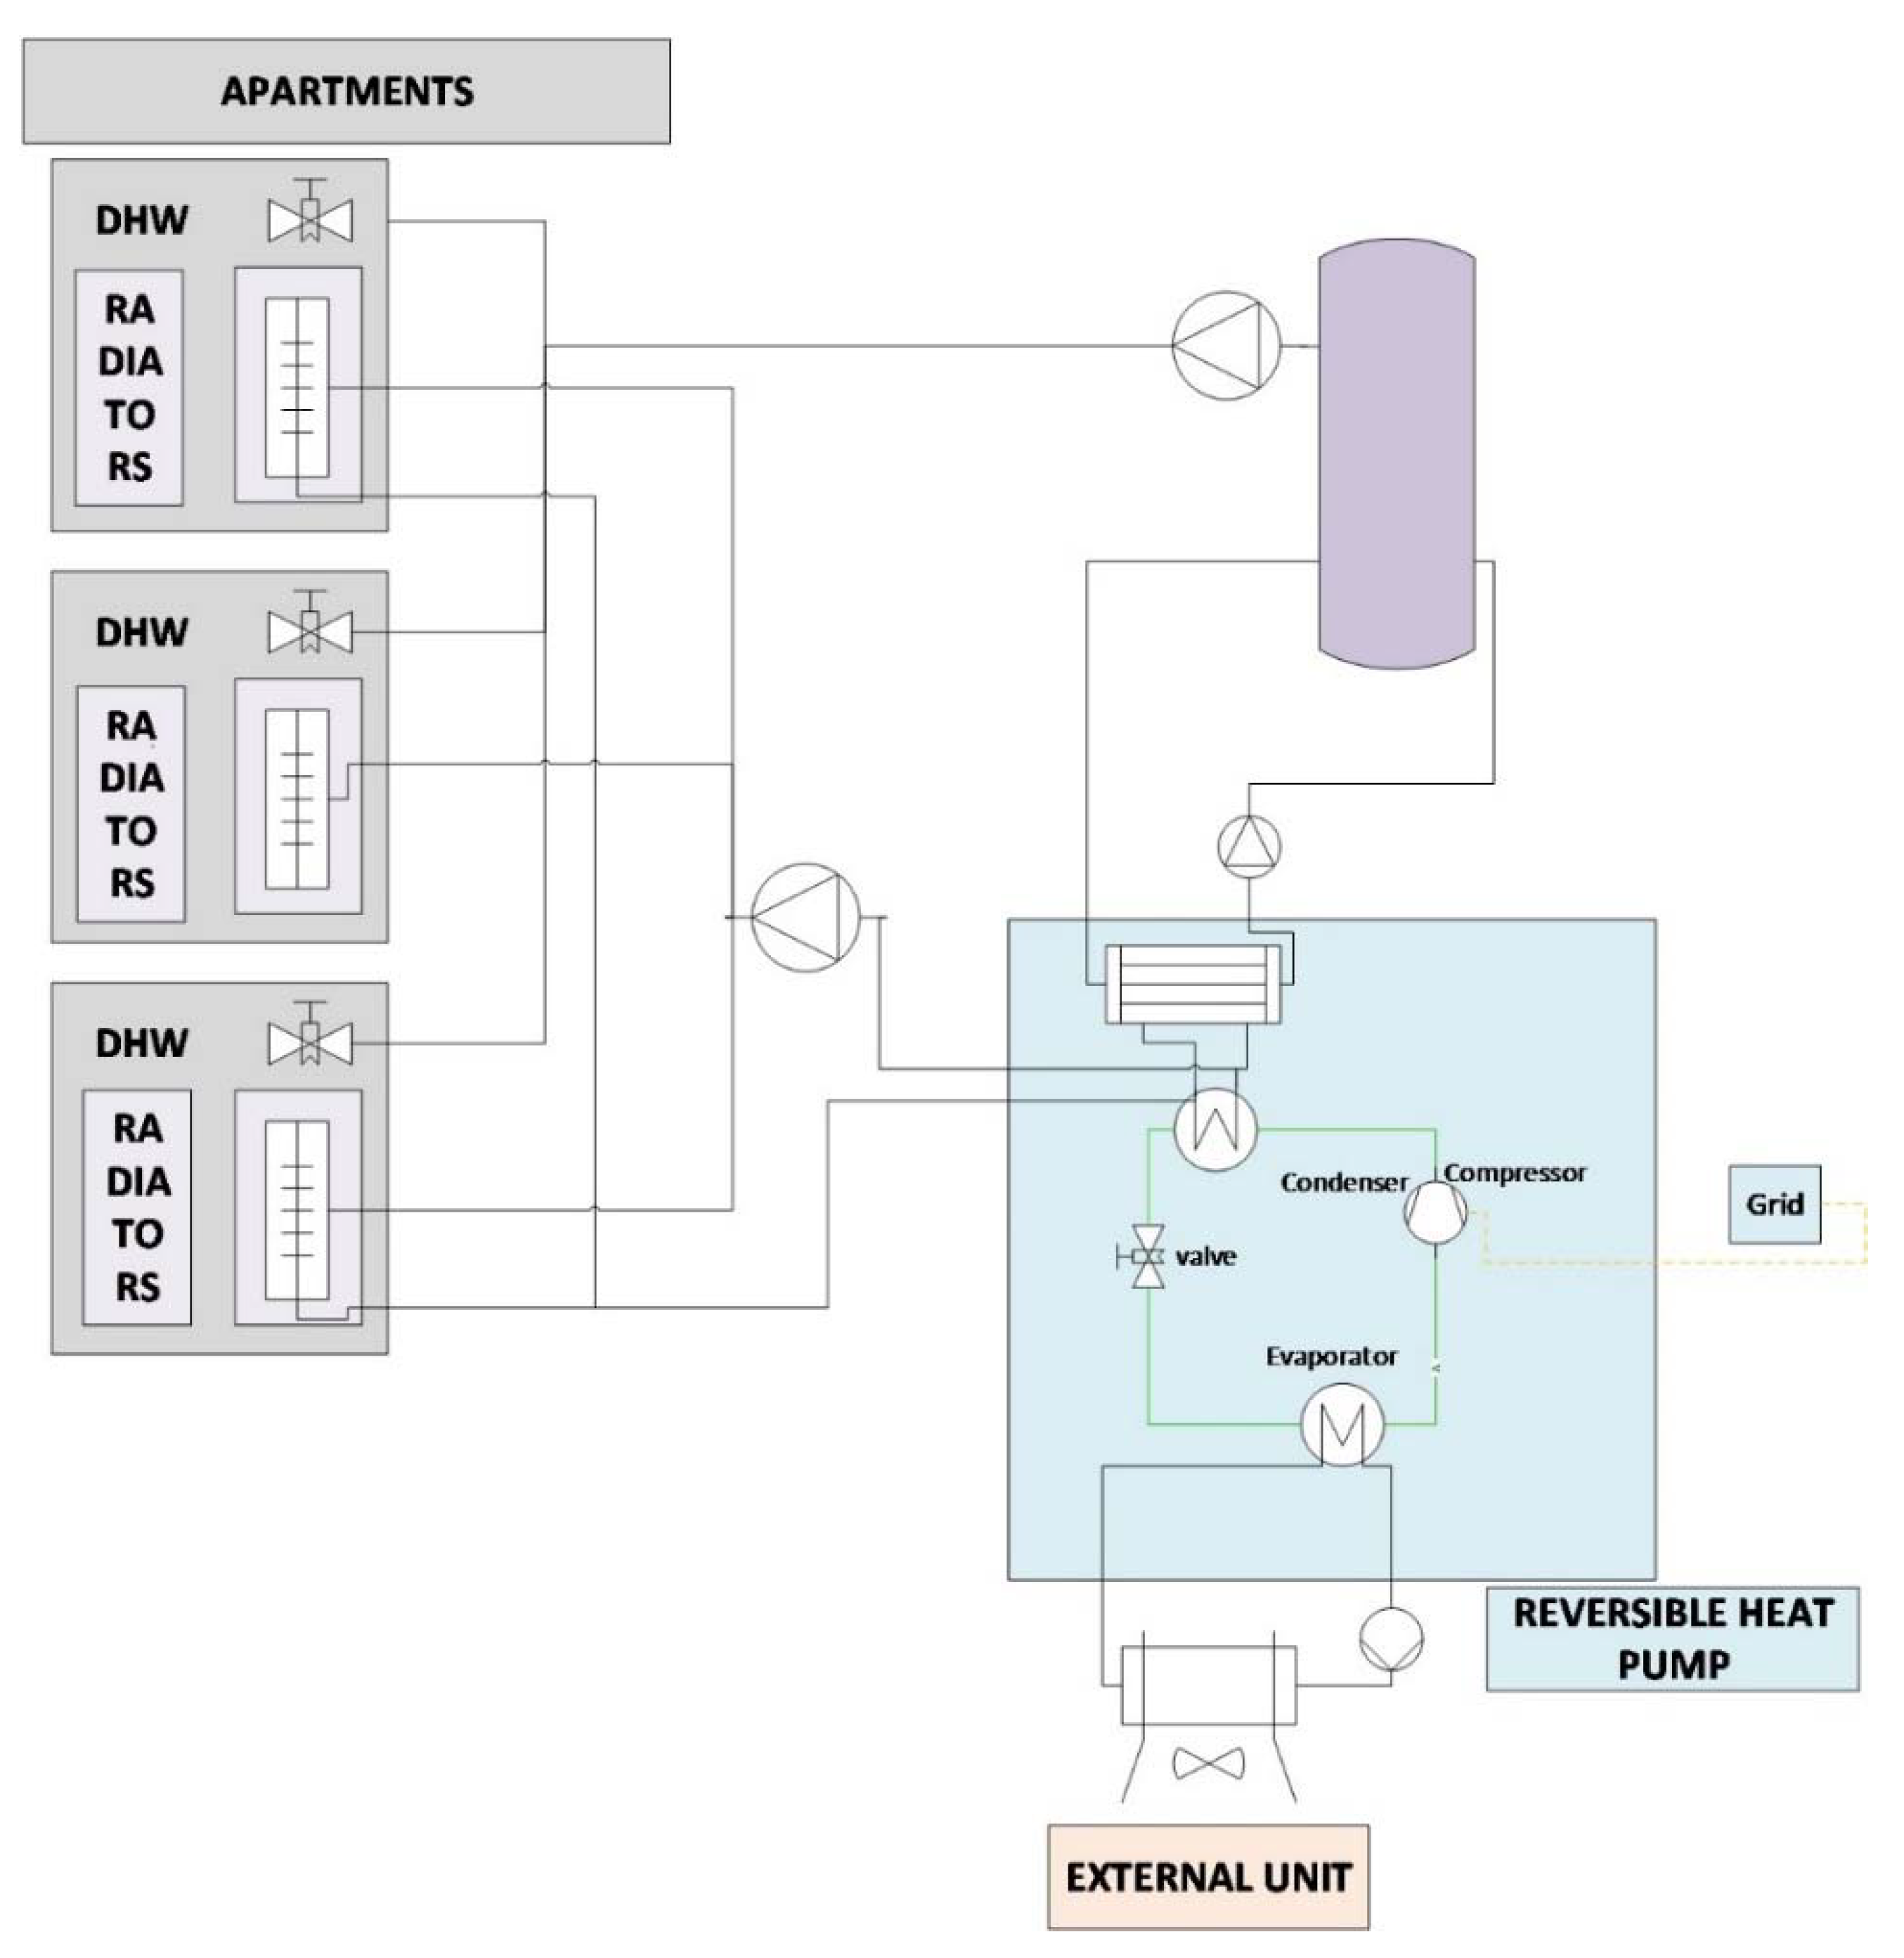
The reference system consists of an air–water heat pump that can provide heat to a DHW storage tank by means of a heat exchanger located inside the storage tank, and also to the heating system of each dwelling, as shown in Figure 1. An electric heater inside the DHW tank was considered as a back-up for DHW production. The sizing of the main system components was carried out considering heating and DHW demand of the building (Table 1).
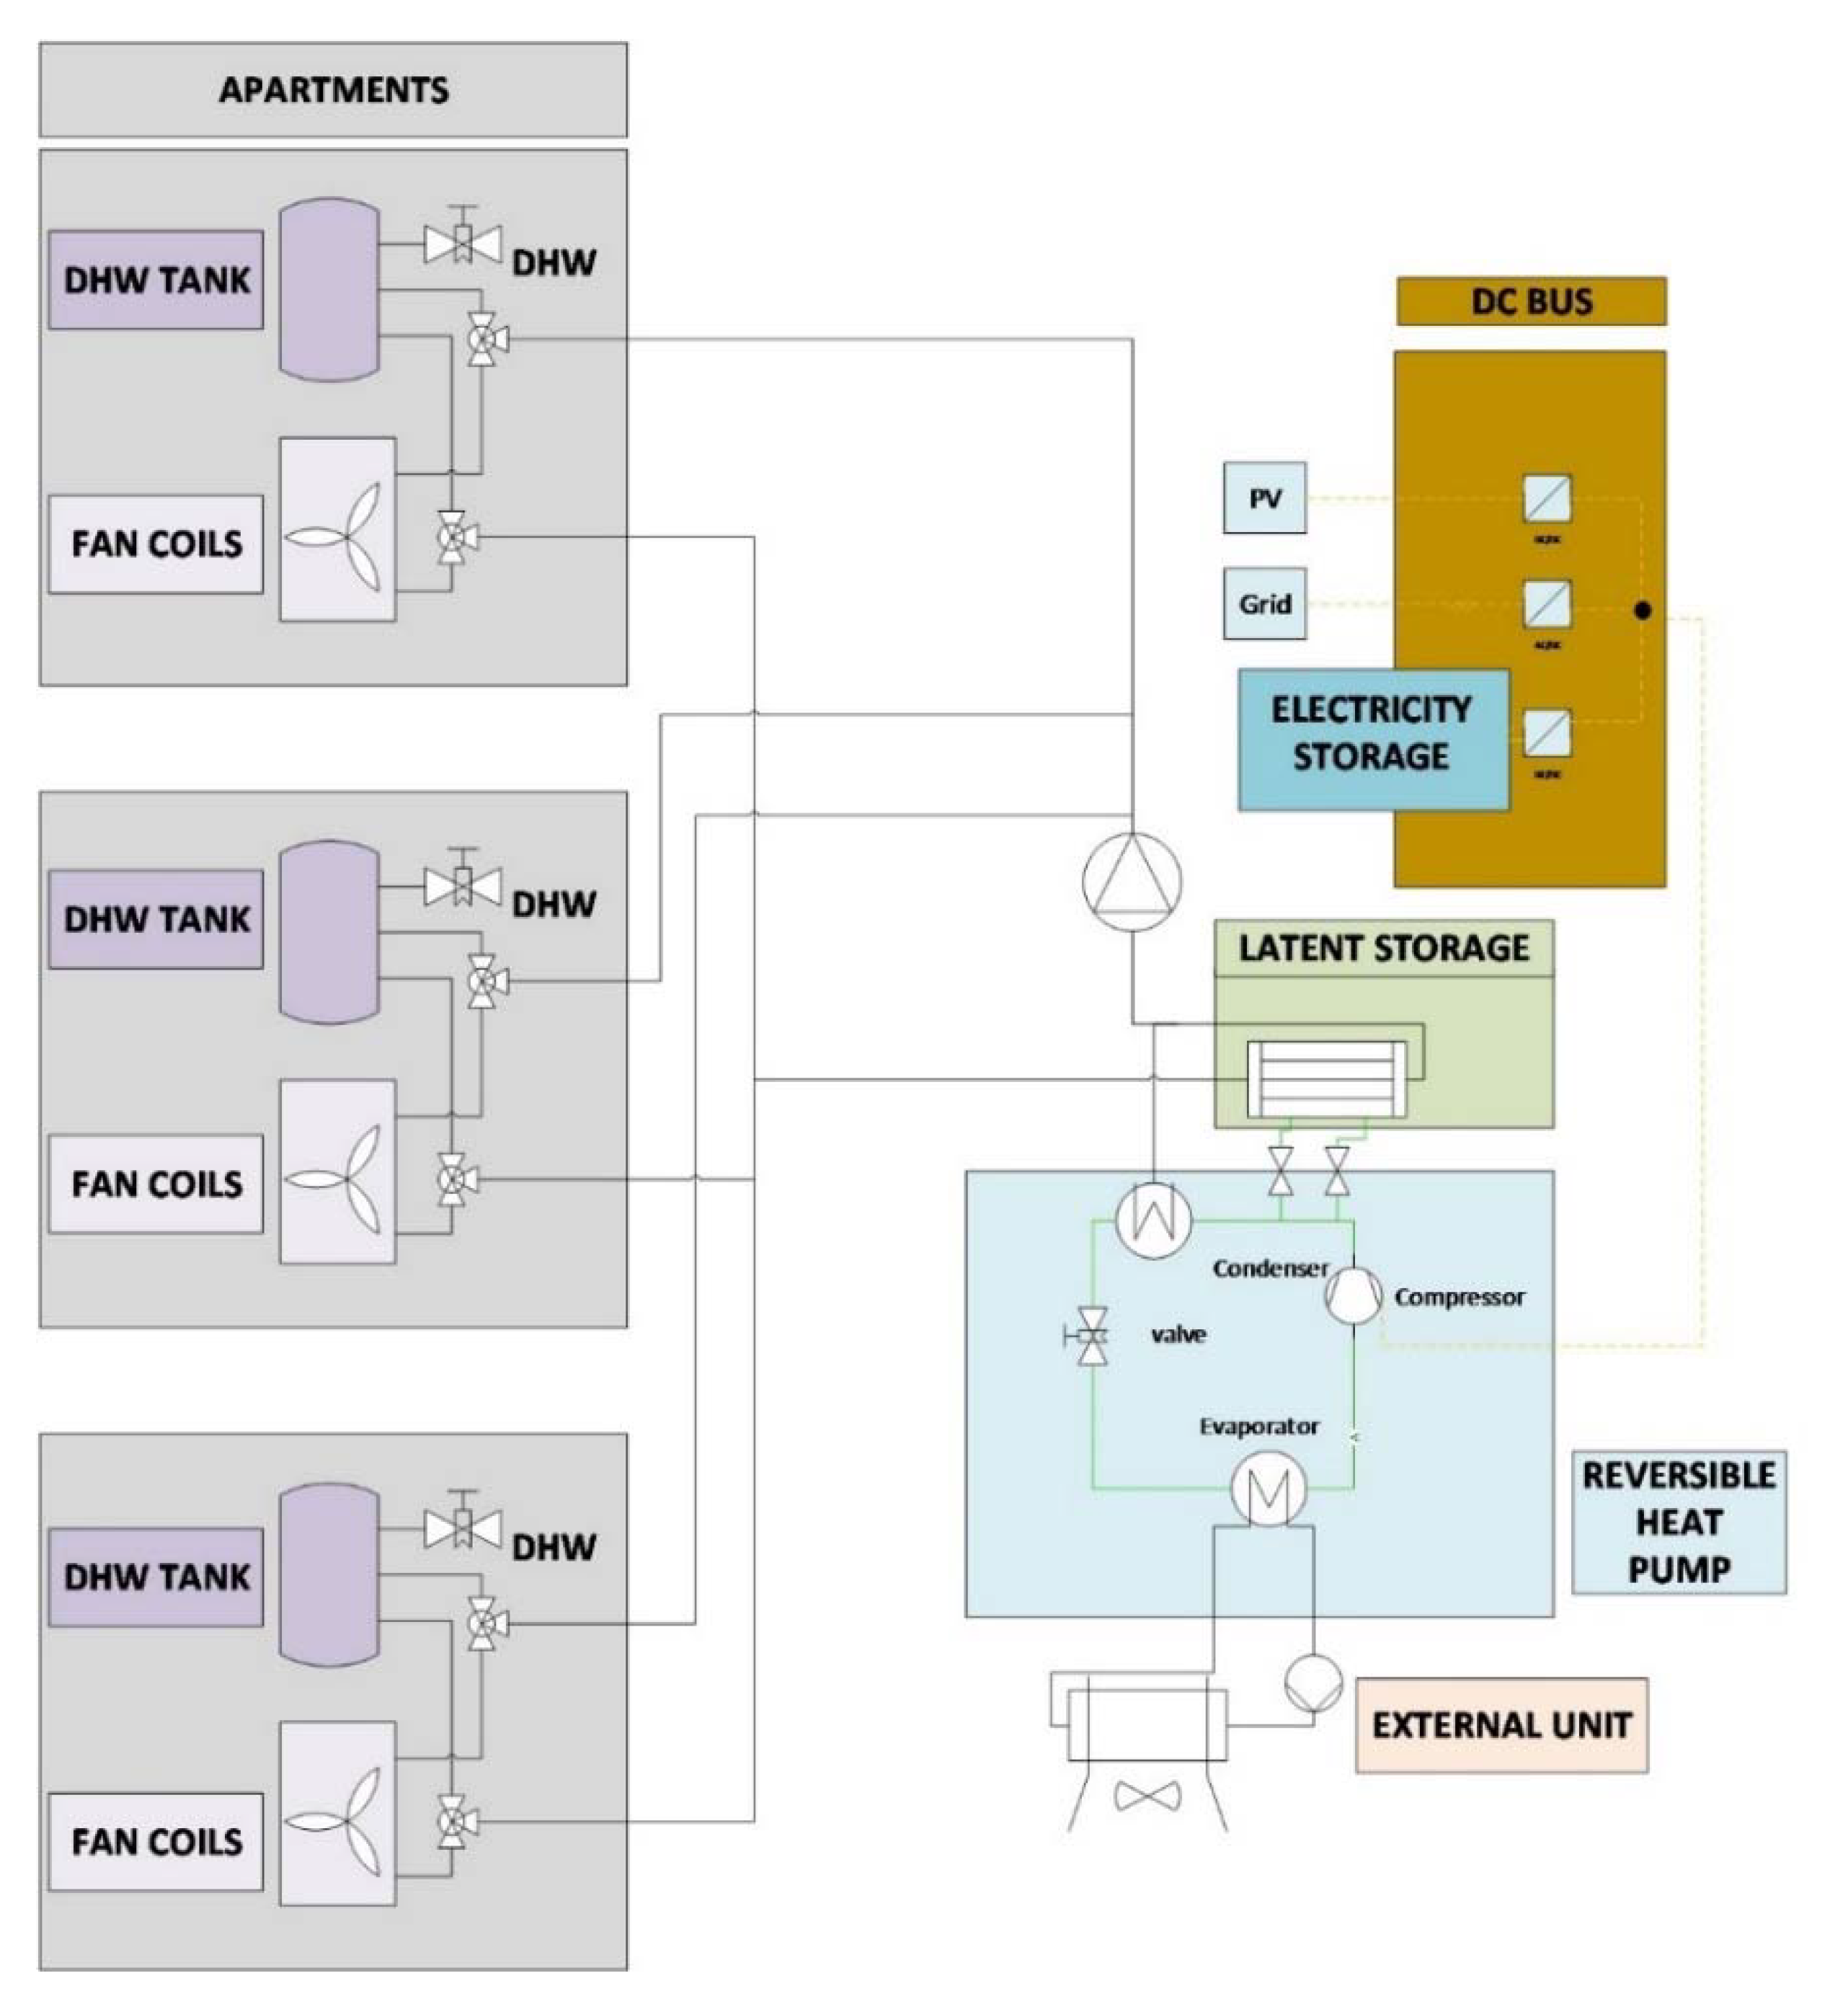
The diagram of the general layout of the innovative system is shown in Figure 2. The main components of the system are a PV system connected to the heat pump, 10 sensible heat storage DHW storage tanks (one for each dwelling), a high-temperature latent heat storage tank, and an electric battery. The latent heat storage is connected at the compressor outlet to store part of the energy contained in the hot refrigerant gas that leaves the compressor, which is used to generate DHW in an efficient way. There are many innovative aspects in the proposed system, such as the direct integration of an innovative three-media refrigerant/PCM/water heat exchanger (RPW-HEX) in the hot superheated section of the heat pump, the use of electric storage combined with both sensible and latent heat storage, and the use of a DC microgrid and innovative control for coupling the electric grid with the thermal distribution. Therefore, the use of PV panels and both the thermal and electrical storage systems help increasing the share of renewable energy. A description of system operating modes can be found in [8].
The sizing of the main system components was performed as follows: the sensible heat storage capacity was fixed according to indications from technology provider, the heat pump size was fixed to ensure the coverage of building space heating peak demand obtained from the dynamic simulations described in the following section (16 kW at the yearly minimum external temperature, −12 °C), and the latent heat thermal energy storage size was fixed to maximize its contribution to DHW production. The PV system nominal power and the electrical storage capacity were designed through an iterative process and to ensure that the yearly self-consumption and self-sufficiency KPIs (key performance indicators), obtained from the dynamic simulations explained in the following section, are both greater than 40%. As a result, the sizing that the main system components should have is shown in Table 2.

2.2. System Simulations

Dynamic simulations were performed in TRNSYS [17] to obtain the energy consumption of the reference building described in the previous section. The energy consumption of the innovative system to guarantee comfort inside the building, needed for the operational stage of the LCA, was obtained simulating each system component using standard and specifically developed TRNSYS types along with performance maps provided by the manufacturer of the component. Instead, the energy consumption of the heat pump of the reference system was estimated from the energy demand profile of the building, and assuming constant seasonal coefficient of performance for space heating (2.8) and space cooling (3.8) and for DHW production (3.0 in winter and 3.7 in summer). Climate data of the selected location (Stuttgart) were taken from the Meteonorm database [18] to estimate the energy consumption for heating, cooling, and DHW supply.
The components of the innovative system can be divided in the following sub-systems:
  • Heat pump
  • Latent heat thermal energy storage
  • Distribution
  • Space heating and cooling emission system
  • Domestic hot water
  • Electrical system
A full one-year time frame was considered for all the TRNSYS simulations using a timestep of 1 min. The use of a relative short timestep for an annual simulation was necessary given the complexity of the system in terms of number of components and possible operational modes.

2.3. LCA Methodology

Life cycle assessment (LCA) is a methodology that is used to evaluate the environmental impact of a product over its entire life cycle. This LCA study considers a system through its life cycle from cradle to grave. The life cycle of a product system includes the manufacturing phase (extraction of raw materials, handling, and processing), operational phase (the normal and intended use of the product), and the disposal phase (the end of the product until landfill disposal) [19].
In common, the major focus of utilizing LCA methodology is on reducing the environmental impact of specific products under consideration for more sustainable solutions through decision-making process [20]. A full LCA requires significant effort and expertise, although according to UNE-EN ISO 14040:2006 standard [21], performing an LCA should at least be performed through four main interrelated steps. Those steps are definition of the goal and scope, developing the life cycle inventory (LCI), carrying out the life cycle impact assessment (LCIA), to finally interpreting the results.
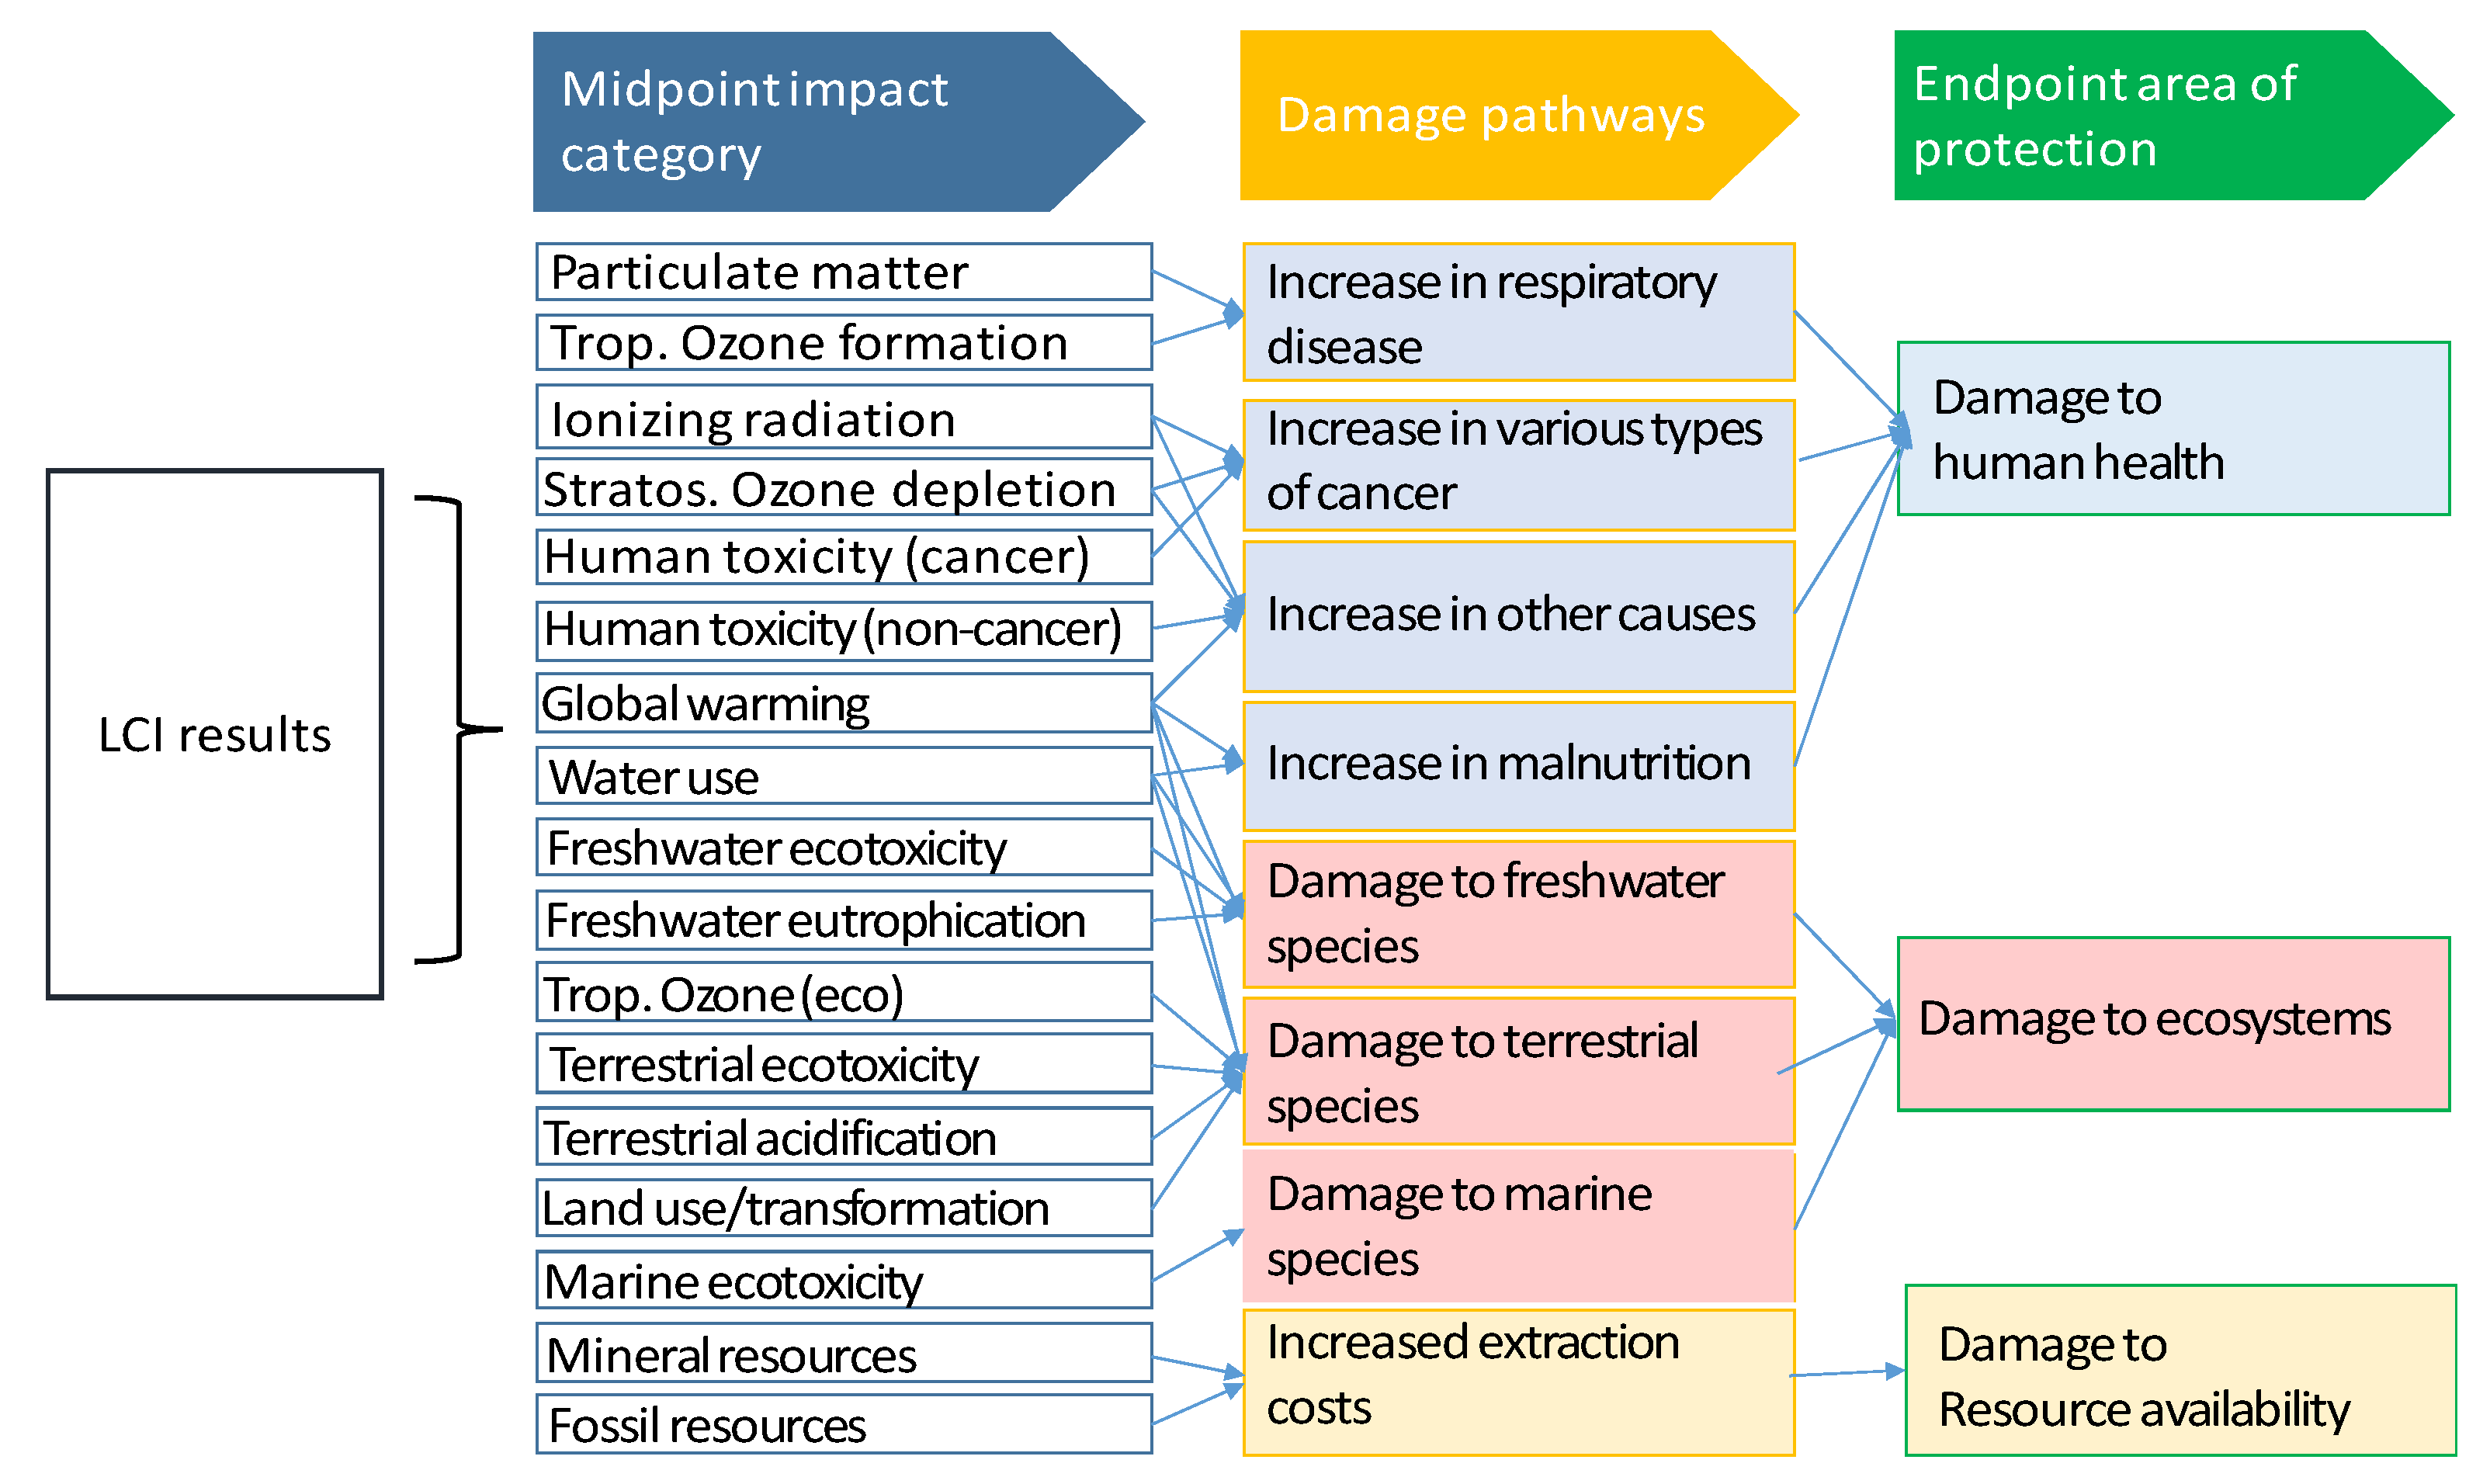
The LCA of this study is based on the impact assessment method ReCiPe and global warming potential (GWP), extracted from the database Ecoinvent [22]. ReCiPe indicator was indicated by the Joint Research Commission of European Union [23] as the best method for the European context in comparison with EPS2000, Eco-indicator 99, and IMPACT2002+. The ReCiPe indicator, a method used to assess the environmental impact, is based on an update version of CML and Eco-indicator 99 [19]. The primary objective of the ReCiPe method is to transform the long list of life cycle inventory results into a limited number of indicator scores. These indicator scores express the relative severity on an environmental impact category. In ReCiPe indicators are determined at two levels, eighteen midpoint indicators, and three endpoint indicators. Midpoint indicators focus on single environmental interventions at the level of a cause–effect chain between emissions and the endpoint level. Endpoint indicators show the environmental impact on three higher damage levels: effect on human health, biodiversity, and resource scarcity [24]. Converting midpoints to endpoints simplifies the interpretation of the LCA results (Figure 3).
The IPCC GWP indicator is used for characterization at midpoint level, and only this indicator was selected as representative for all midpoint model currently used in LCA studies according to the Joint Research Commission of European [26]. The IPCC GWP is an indicator based on the ratio of the radiative damage force of the greenhouse gases. In order to measure GWP, the gas must have a long atmospheric lifetime, which means that the gas lasts long enough in the atmosphere to mix and spread through it. This given time used by GWP depends on if it is desired to predict the emissions long-term effects (GWP 100a) or their short-term effects (GWP 20a), where the values of the GWP are measured in kgCO2-eq [27].
The assessment of each impact category according to each indicator is given in Equation (1):
I M P j = k d k , j . L C I k
where I M P j is the j impact category, d k , j is the coefficient of damage (extracted from database Ecoinvent) associated with the component k and impact j and, finally, the L C I k is the life cycle inventory LCI entry (i.e., kg of paraffin) [28].

2.3.1. Definition of Goal and Scope

The goal of the LCA activities carried out in this paper is related to the materials and components. Benchmarking against conventional products was intended and achieved by the use of equivalent reference systems that should provide similar functionalities to the building. It is then one of the main goals of the LCA study to identify the components with higher environmental impact.
The study was focused on the system and not on the building, meaning only the relevant components of the system were included in the LCA study. Therefore, the following parts (modules) of the innovative system were included: high-temperature latent heat thermal energy storage (RPW-HEX), electrical storage and DC bus, compression DC-driven chiller (heat pump), sensible heat storage (decentralized tank), and PV system.

2.3.2. Functional Unit

The scope of this study was defined according to the performance characteristics of the system under study. The functional unit must be consistent with the objectives and scope of the system (according to UNE EN ISO 14040 and 14044) [21,29] since it determines the reference flow from which the inputs and outputs of the system are determined. The results of the LCA will be expressed on the basis of the functional unit. In this study, the functional unit of a 1 m2 of livable floor per year was adopted, based on publications of LCA studies in the construction sector [19,20]. A 30-year system lifespan is assumed for this study. Depending on the lifespan of the different components, the number of replacements of every component or product along the 30-year period was also calculated, which is a crucial point to be considered in the manufacturing phase.

2.3.3. System Boundaries

The study accounts for the raw material extraction to final disposal of the portion of the life cycle and considers embodied environmental impacts. The system boundaries determine which unit processes are included in the LCA study. This model encompasses three distinct phases of evaluation where each product during its lifetime goes through different stages, and there are a number of operations in each phase:
  • Manufacturing stage—materials production phase, including extraction of raw materials, transportation to the factory, and manufacturing processes.
  • Operational stage—all activities related to the use of the systems, including all operating energy for heating, cooling, and domestic hot water (DHW).
  • End-of-life stage—the dismantling and demolishing of the system components and their transport to the landfill site and/or to recycling sorting plants.

2.3.4. Inventory Analysis of the Manufacturing Stage

The life cycle inventory analysis (LCIA) is defined as a phase of the LCA involving the compilation of inputs and outputs for a given product system throughout its life cycle [30]. The LCI data were extracted from a recompilation of data with the help of different partners of the project. The inventory list of all the materials used for the manufacturing phase of the system that spans this study is shown in Table 3 and Table 4 for the reference system and the innovative system, respectively. All data were provided by the producers of the equipment. The tables list the elements to be considered, their amount in the system (named “unit” in the table), as well as their quantification (in units or kg); the replacement is the number of times that given unit has to be replaced during the time life of the whole system, which provides the total amount.

2.3.5. Inventory Analysis of the Operational Stage

The annual energy consumption of both systems was obtained through simulations, as explained in Section 2.2, using a set-point temperature of 25 °C in summer and 20 °C in winter, and is shown in Table 5 for the reference system and in Table 6 for the innovative system.
Comparing the total annual energy consumption of the innovative system with that of the reference system, it can be clearly seen that the innovative solution achieves significant reduction in the electricity consumption, from 15,292 to 10,973 kWh per year, which represents a reduction of almost 30%.

2.3.6. LCIA of Manufacturing and Disposal Stage

The LCIA for the manufacturing and disposal stage of the reference and the innovative systems are shown in Table 7 and Table 8, respectively.

2.3.7. LCIA of the Operational Stage

The LCIA of the operation stage are presented in Table 9 for the reference and in Table 10 for the innovative one.

3. Results and Discussion

The results are presented for the functional unit m2 of living floor area. Moreover, the results are presented first considering the ReCiPe and then the IPCC GWP indicator. The interpretation of the results of the impact assessment are presented in this section. The results are interpreted demonstrating four aspects: the comparison between the impact scores of the studied systems, the damage categories, the materials’ contribution percentage to the total impact score, and the parametric study of influence of the refrigerant in the system. Moreover, a parametric study based on the refrigerant used in the heat pump is shown.

3.1. LCA Results

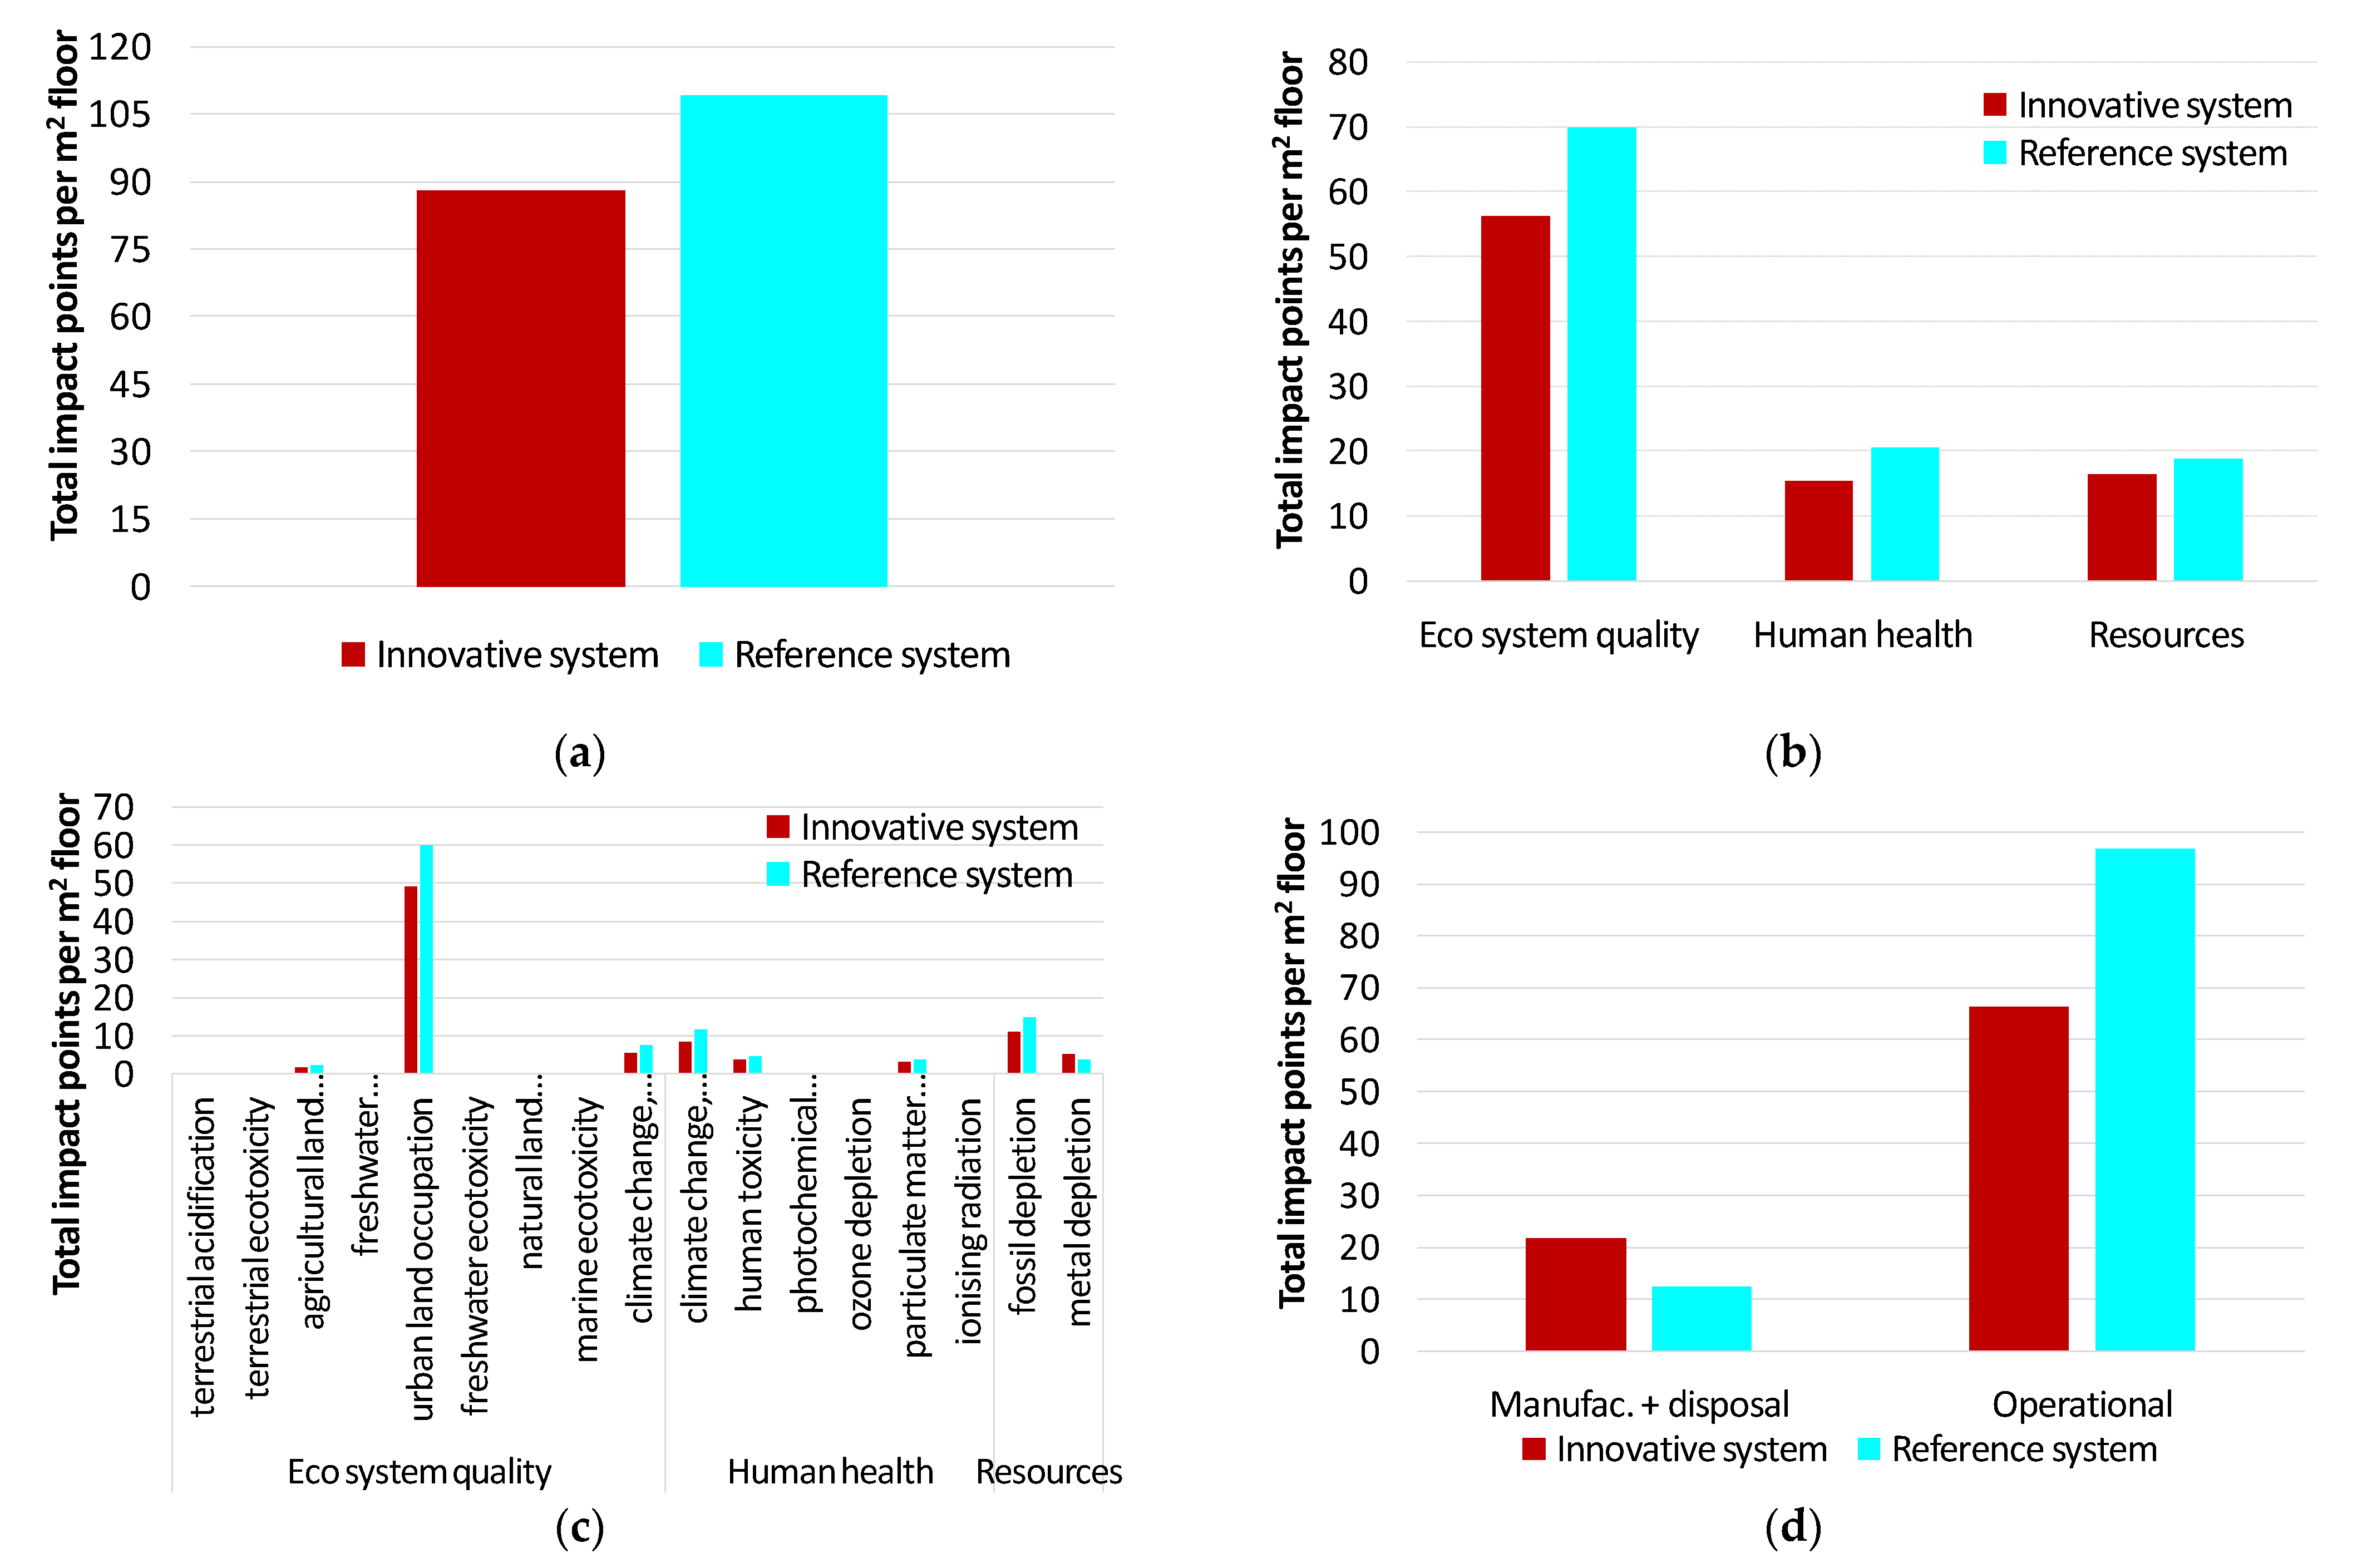
The results per m2 of living floor using the ReCiPe indicator are presented below. The total impact of the reference system is higher (109 impact points) than the innovative system (88 impact points) (Figure 4a). Moreover, in all damage categories (Figure 4b), the impact of the innovative system is lower than that of the reference system. When going to more detail (Figure 4c), the only category where the impact of the innovative system is higher than that of the reference is the metal depletion sub-category within the resources category; nevertheless, the other subcategory, fossil depletion, shows lower impact for the innovative system than for the reference system.
Finally, when the life cycle stages are evaluated (Figure 4d), the impact of the innovative system in the manufacturing and disposal stages is higher than the reference one (22 impact points vs. 13 impact points). However, this is highly compensated during the operational stage, where the innovative system has 66 impact points vs. the 97 of the reference system.
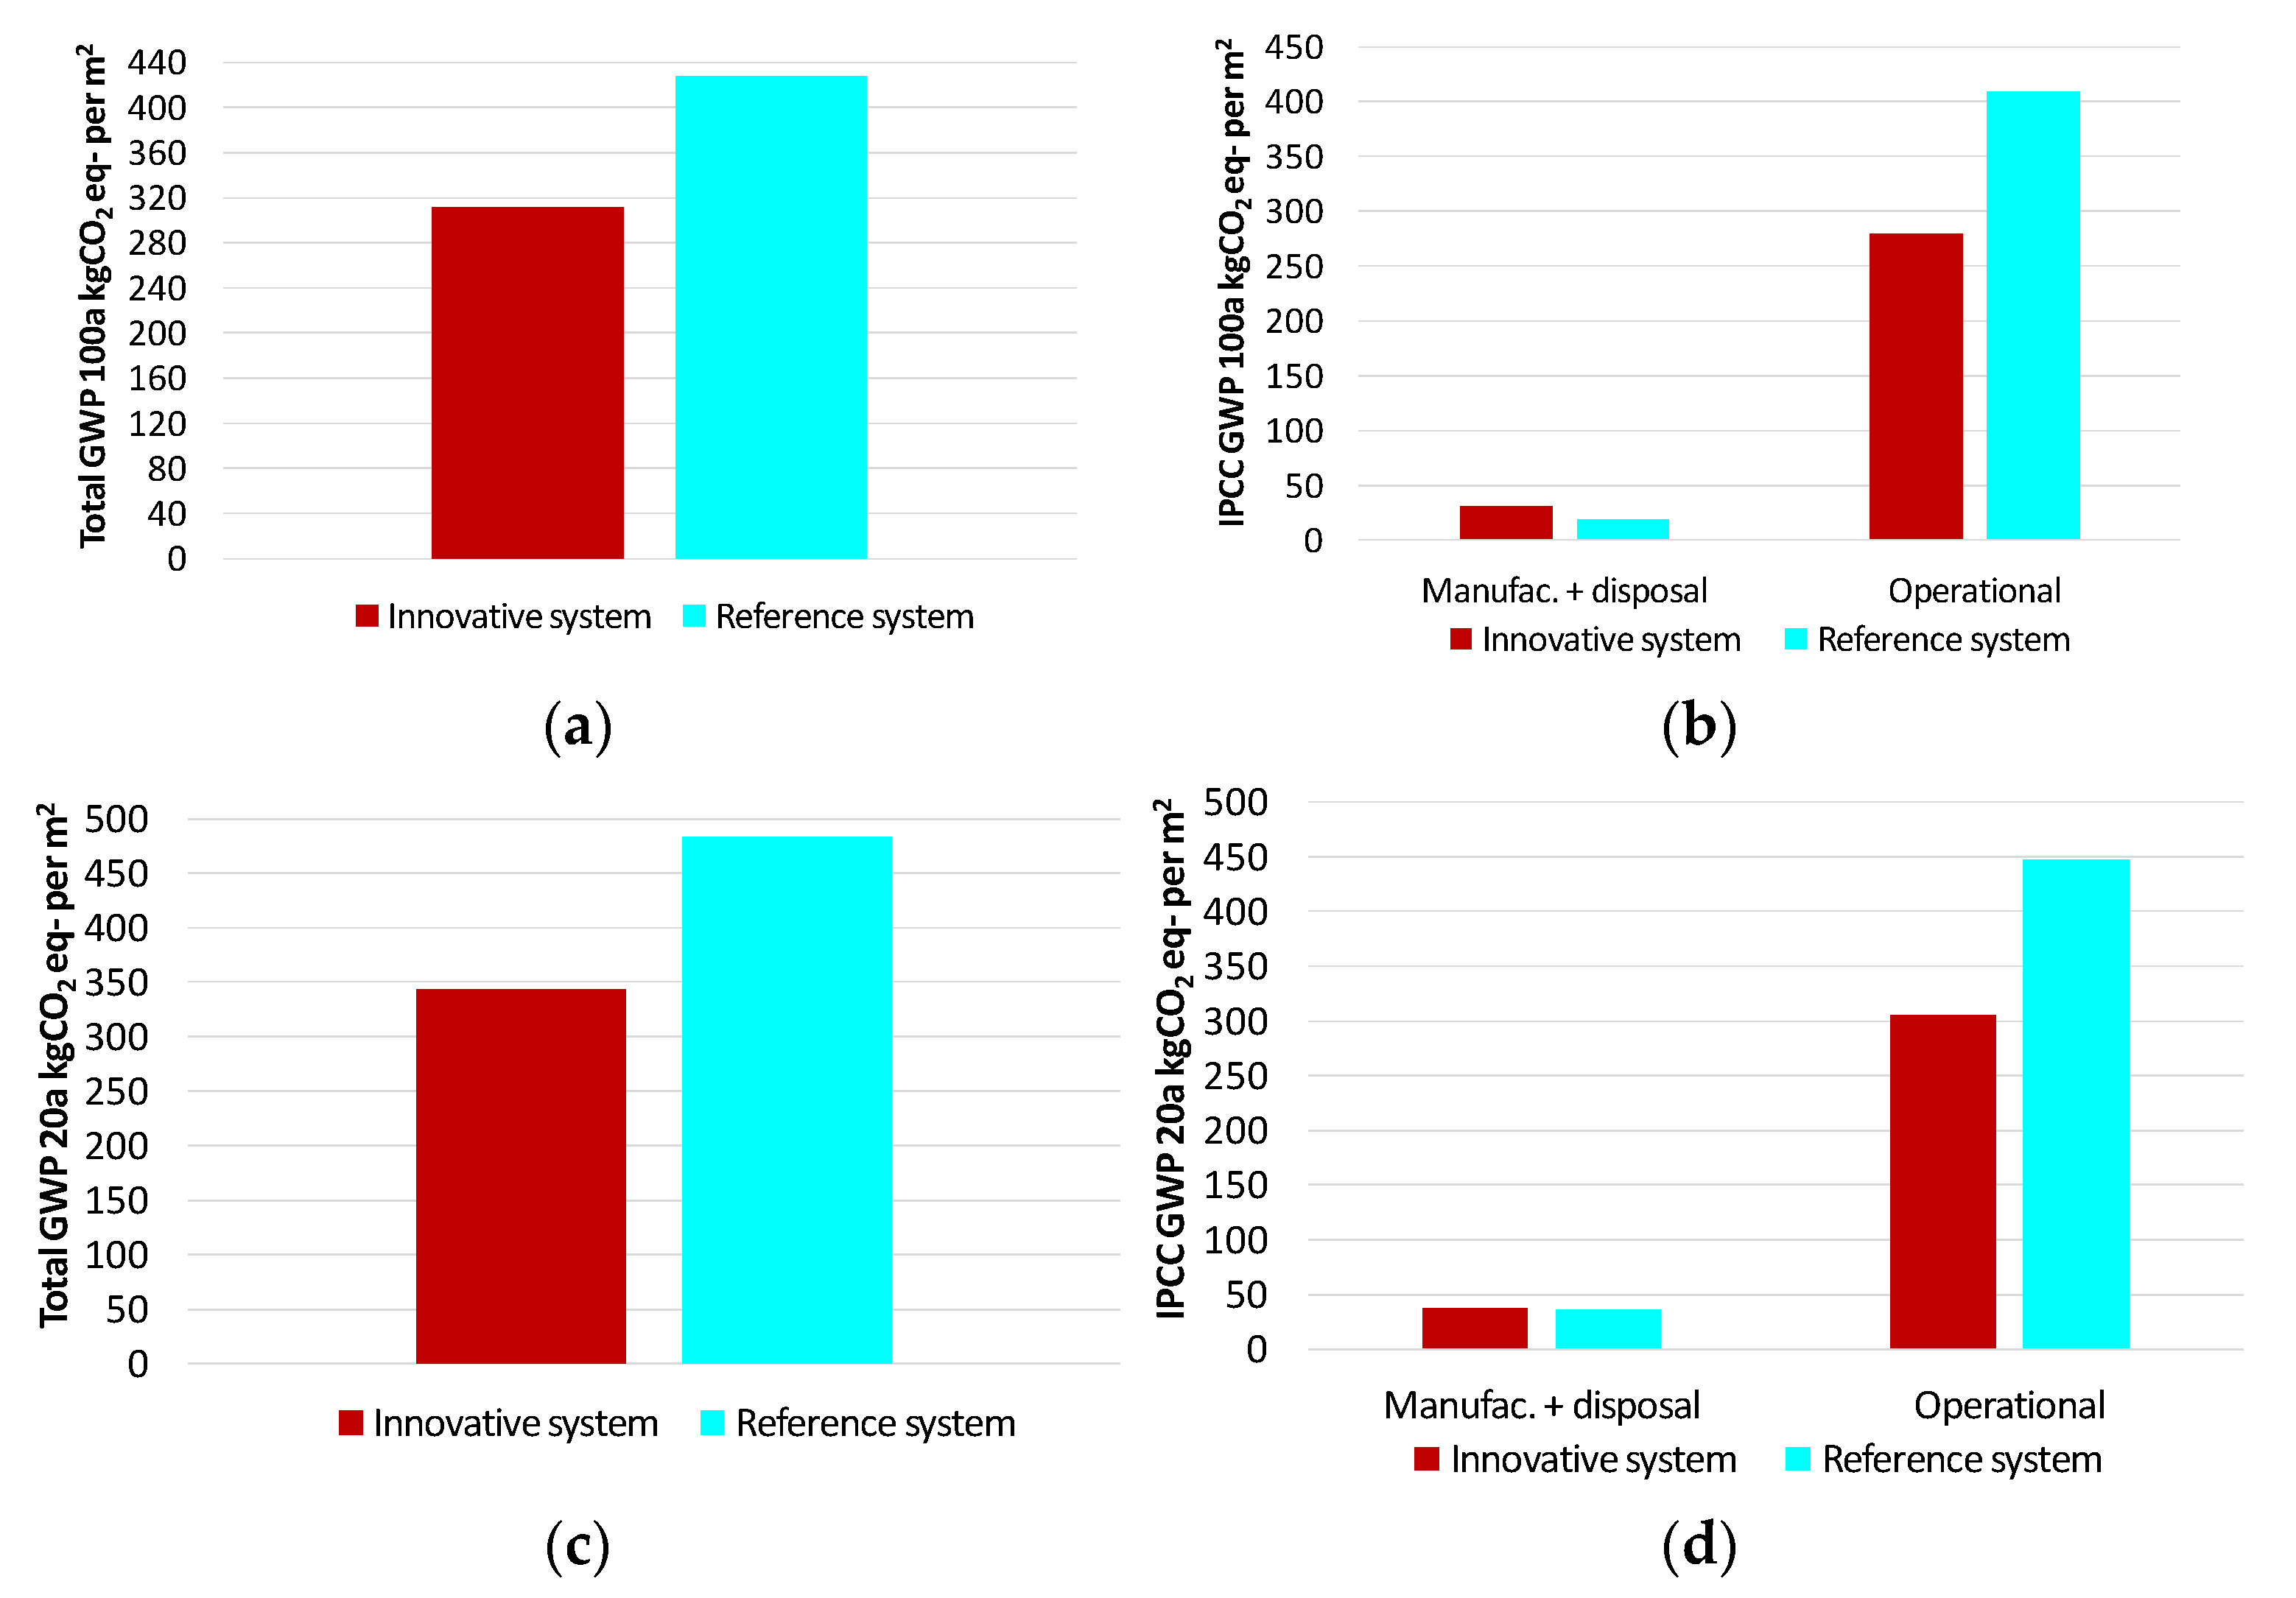
When the IPCC GWP indicator is considered (Figure 5), both for the 100-year and 20-year horizon, the reference system has higher impact than the innovative one (428 kg CO2 eq. per m2 vs. 312 kg CO2 eq. per m2 for GWP 100a; and 482 kg CO2 eq. per m2 vs. 343 kg CO2 eq. per m2 for GWP 20a).
When the life cycle stages are considered (Figure 5b,d), the biggest difference is in the operational stage, where the reference system has higher impact due to the higher use of electricity from the grid vs. the use of renewable energy, both thermal and electrical, in the innovative system. On the other hand, in the manufacturing and disposal stage, the reference system has a lower impact than the innovative one (19 kg CO2 eq. per m2 vs. 31 kg CO2 eq. per m2 for GWP 100a; and 36 kg CO2 eq. per m2 vs. 37 kg CO2 eq. per m2 for GWP 20a).

3.2. Parametric Study: Influence of the Refrigerant in the System

In the continental climate system, a parametric study of the influence of the refrigerant impact was carried out. The Ecoinvent database [31] only includes the refrigerant R134a, but the HYBUILD continental demo makes use of the refrigerant R32, which has a global warming potential (GWP) half of that of R134a (675 kg CO2 eq. vs. 1430). Therefore, different refrigerants that could be used in the innovative system without major changes to the equipment were selected (Table 11). As can be seen in Table 11, these refrigerants have a GWP similar to that of R134a (or slightly higher) or lower, going to as low as 3 kg CO2 eq. Therefore, the impact of the refrigerant in the overall LCA of the system was calculated, changing the refrigerant impact from 150% to 0%, with 100% being the impact of R134a.
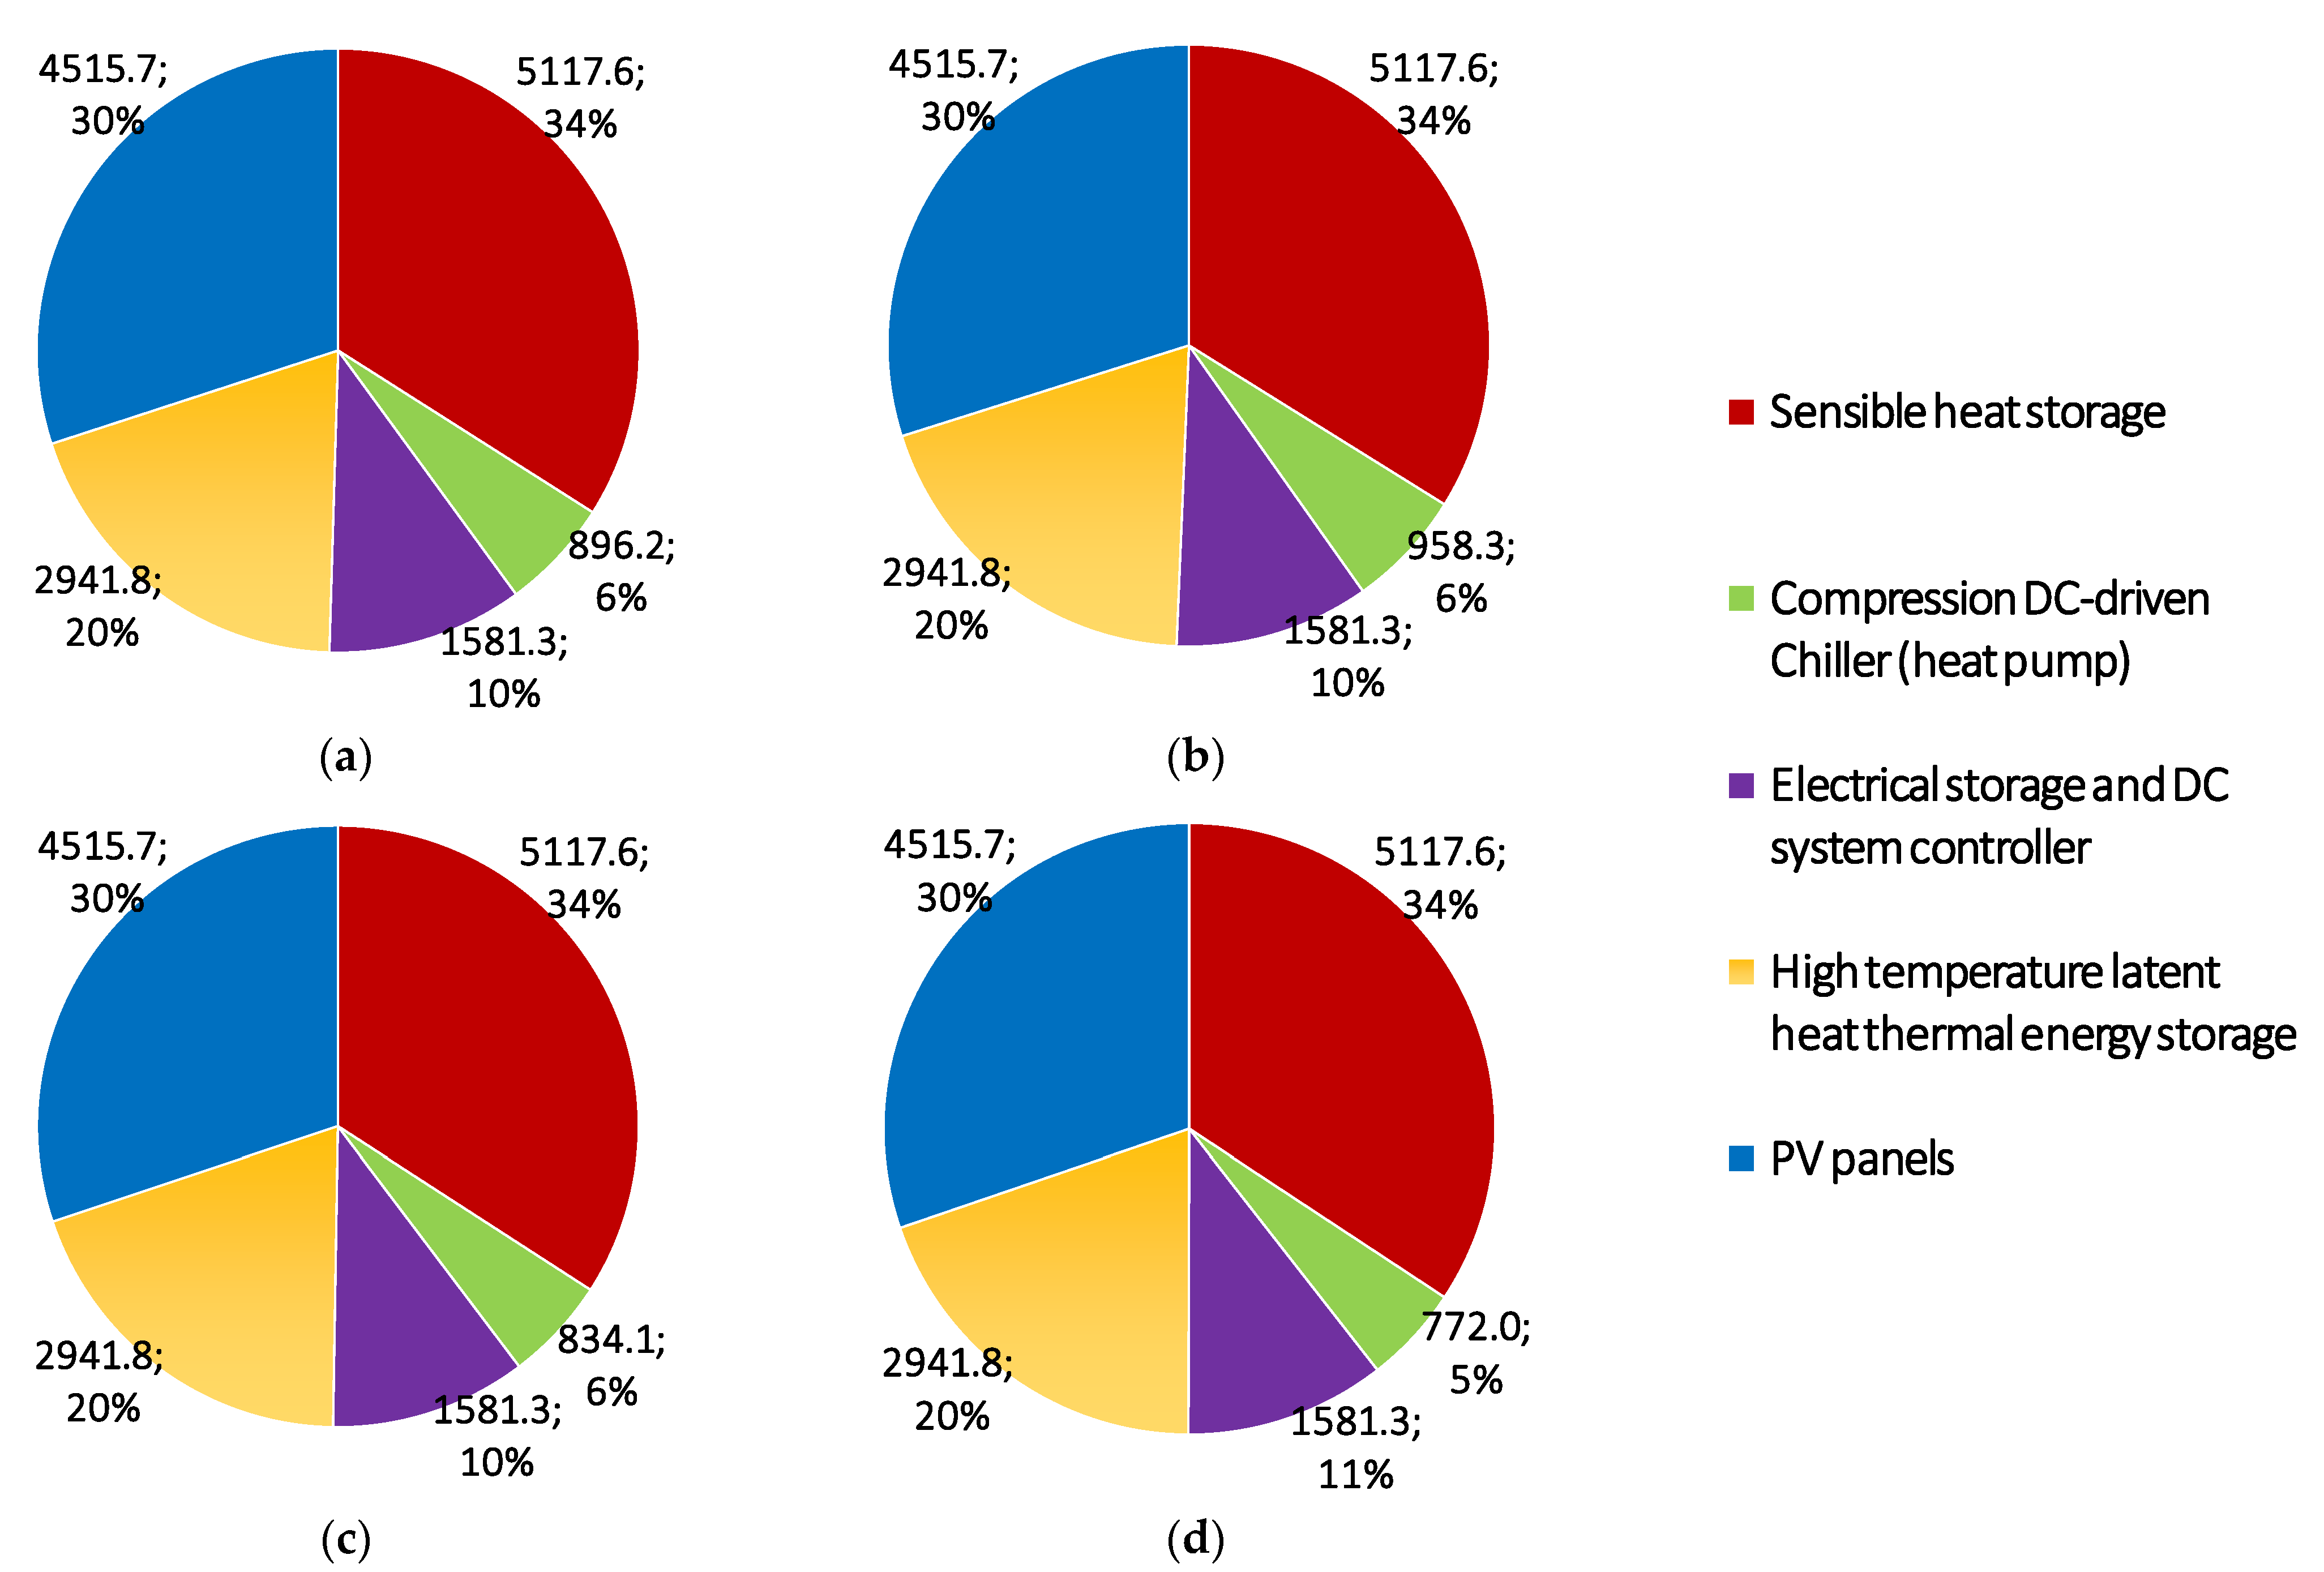
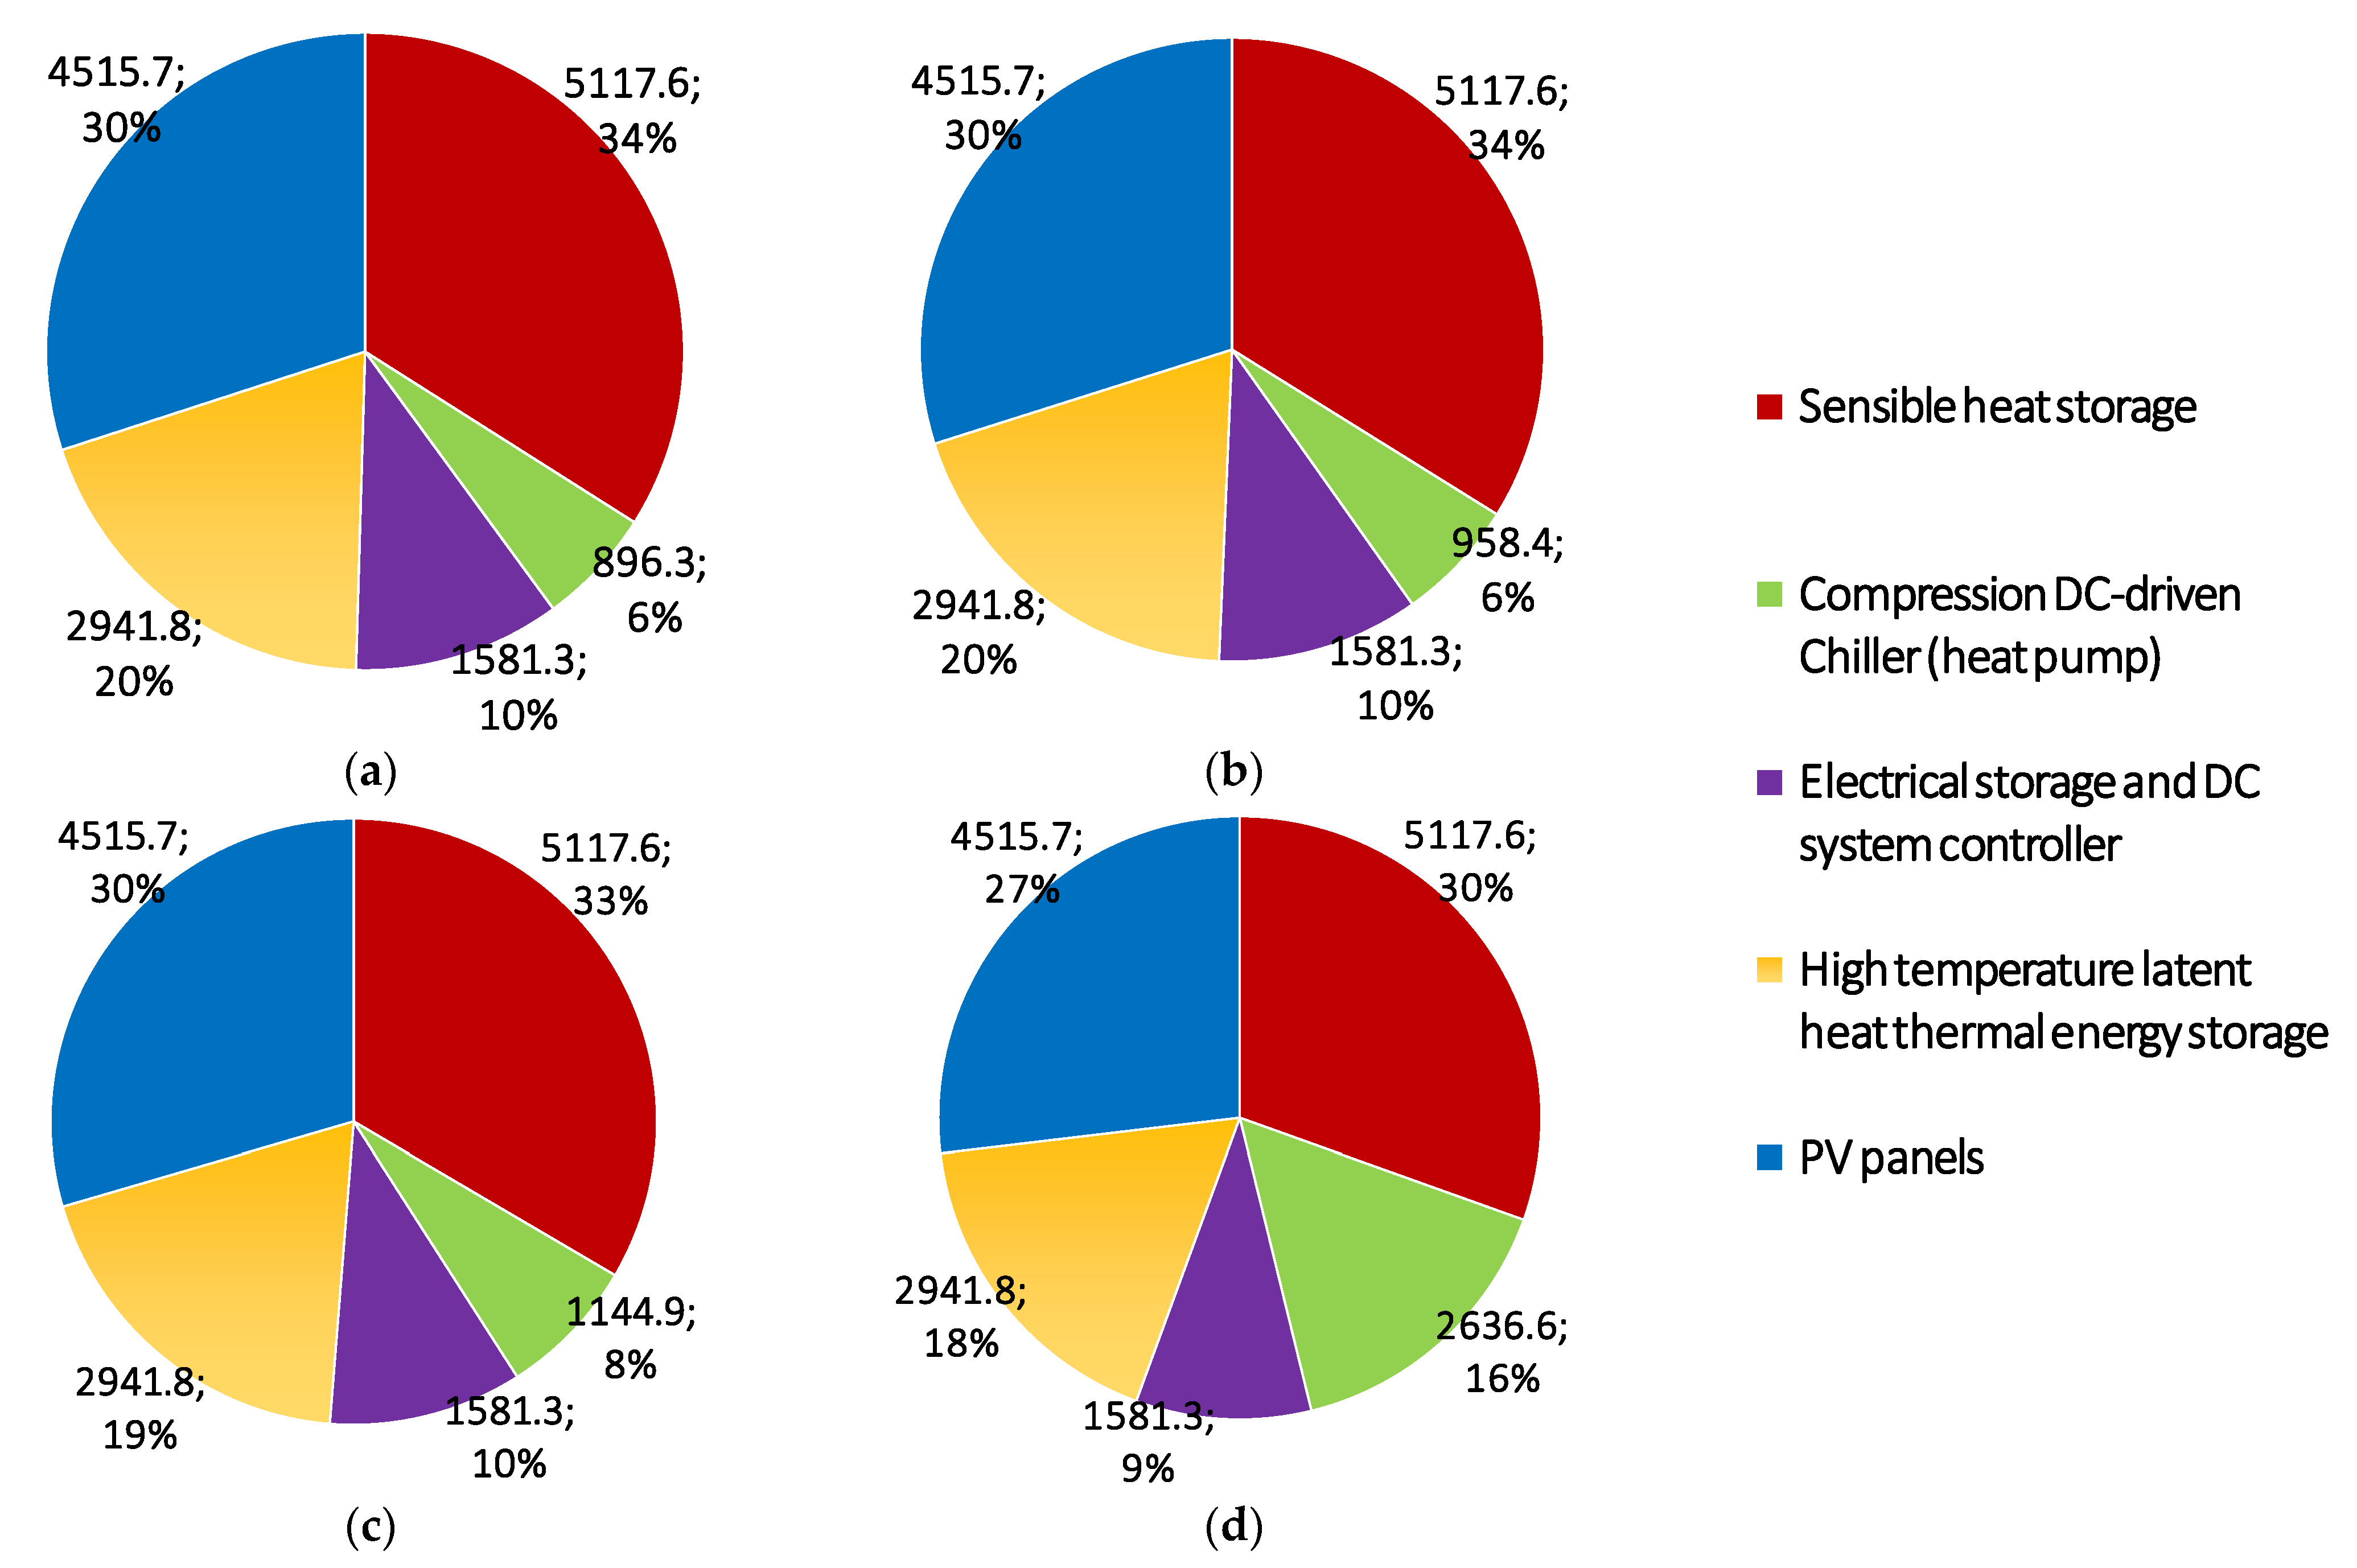
Figure 6 shows that the contribution of the compression DC-driven chiller is between 5% and 6% in all cases studied, showing that the GWP of the refrigerant does not have any influence in the overall LCA analysis.
Given these results, a new parametric study was conducted varying the replacement rate of the refrigerant. In the initial LCA, a life cycle of the refrigerant of 15 years was considered. Figure 7 shows that to see a change on the contribution of the compression DC-driven chiller in the overall LCA, the refrigerant life cycle needs to be considered as lower than 5 years, which is very unrealistic [36].

4. Conclusions

A detailed LCA was carried out of an innovative system for heating and domestic hot water production, including sensible, latent, and electric storage. The LCA was performed comparing the results to a selected reference system. The LCA was carried out for a functional units m2 of living floor area, and using two different indicators, ReCiPe and IPCC GWP (20 years and 100 years). The operational data were given by simulations as explained in Section 2.2.
Results show that when using the ReCiPe indicator, the overall impact of the innovative system is lower than that of the reference system. In all damage categories, the impact of the innovative system is lower than that of the reference system. Again, the impact of the manufacturing and disposal stage is higher than for the operational stage, but this difference is compensated with the one of the operational stage (lower in the innovative system).
On the other hand, when using the IPCC GWP indicator, the impact of the innovative system is lower than that of the reference system. The impact of the operation stage clearly makes the difference, since although in the manufacturing stage, the impact of the innovative system is very similar than that of the reference system, the decrease in the operational stage in the innovative clearly compensates for it.
If the contribution of the different subsystems is analyzed, it can be seen that the sensible heat storage and the PV panels are the subsystems with higher impact (both with a contribution of 34% and 30%, respectively), while the high-temperature latent TES storage sub-system has a contribution of 20%. The other two sub-systems considered, the electrical storage and the compression heat pump, have a contribution of 10% and 6%, respectively.
Finally, the parametric study carried out analyzed the influence of the impact of the refrigerant. The analysis was conducted taking R134a as baseline, since this is the refrigerant found in the used database Ecoinvent. The analysis performed on changing both the impact of the refrigerant or the amount of refrigerant shows that the contribution of the refrigerant to the overall impact of the studied system does not vary enough to consider that decreasing the impact of the refrigerant will contribute to decreasing the overall impact of the innovative system.
Author Contributions

Conceptualization, L.F.C.; G.Z. and V.P.; methodology, L.F.C. and N.L.; formal analysis, G.Z.; investigation, N.L.; F.T. and V.P.; resources, L.F.C. and A.F.; data curation, L.F.C.; writing—original draft preparation, N.L. and L.F.C.; writing—review and editing, G.Z.; V.P.; A.F.; M.D. and F.T.; visualization, N.L.; supervision, L.F.C.; project administration, L.F.C.; A.F. and M.D.; funding acquisition, L.F.C.; A.F. and M.D. All authors have read and agreed to the published version of the manuscript.

Funding

This project has received funding from the European Union’s Horizon 2020 research and innovation programme under grant agreement No 768824 (HYBUILD). This work was partially funded by the Ministerio de Ciencia, Innovación y Universidades de España (RTI2018-093849-B-C31–MCIU/AEI/FEDER, UE) and by the Ministerio de Ciencia, Innovación y Universidades–Agencia Estatal de Investigación (AEI) (RED2018-102431-T). The authors would like to thank the Catalan Government for the quality accreditation given to their research group (2017 SGR 1537). GREiA is certified agent TECNIO in the category of technology developers from the Government of Catalonia. This work is partially supported by ICREA under the ICREA Academia programme.

Institutional Review Board Statement

Not applicable.

Informed Consent Statement

Not applicable.

Data Availability Statement

The data presented in this study are openly available in DataverseCat repository (https://dataverse.csuc.cat/ (accessed on 23 March 2021)) at doi:10.34810/data44.

Acknowledgments

The authors would like to thank all partners that contributed in the inventory (CSEM Centre Suisse d’Electronique et de Microtechnique SA–Recherche et Développement, Ochsner Wärmepumpen GmbH, Pink GmbH, AKG Verwaltungsgesellschaft mbH, and National Council or Research Italy, Institute for Advanced Energy Technologies).

Conflicts of Interest

The authors declare no conflict of interest.

References

  1. European Commission. EU Green Deal 2020. Available online: https://ec.europa.eu/info/strategy/priorities-2019-2024/european-green-deal_en (accessed on 15 February 2021).
  2. United Nations Framework Convention on Climate Change; Paris Agreement: Paris, France, 2015.
  3. Zhao, N.; You, F. Can renewable generation, energy storage and energy efficient technologies enable carbon neutral energy transition? Appl. Energy 2020, 279, 115889. [Google Scholar] [CrossRef]
  4. Pramanik, P.K.D.; Mukherjee, B.; Pal, S.; Pal, T.; Singh, S.P. Green Smart Building. Green Smart Build. 2019. [Google Scholar] [CrossRef] [Green Version]
  5. Liberati, F.; Di Giorgio, A.; Giuseppi, A.; Pietrabissa, A.; Habib, E.; Martirano, L. Joint Model Predictive Control of Electric and Heating Resources in a Smart Building. IEEE Trans. Ind. Appl. 2019, 55, 7015–7027. [Google Scholar] [CrossRef]
  6. Gonçalves, D.; Sheikhnejad, Y.; Oliveira, M.; Martins, N. One step forward toward smart city Utopia: Smart building energy management based on adaptive surrogate modelling. Energy Build. 2020, 223, 110146. [Google Scholar] [CrossRef]
  7. Dong, B.; Prakash, V.; Feng, F.; O’Neill, Z. A review of smart building sensing system for better indoor environment control. Energy Build. 2019, 199, 29–46. [Google Scholar] [CrossRef]
  8. Emhofer, J.; Marx, K.; Barz, T.; Hochwallner, F.; Cabeza, L.F.; Zsembinszki, G.; Strehlow, A.; Nitsch, B.; Wiesflecker, M.; Pink, W. Techno-Economic Analysis of a Heat Pump Cycle Including a Three-Media Refrigerant/Phase Change Material/Water Heat Exchanger in the Hot Superheated Section for Efficient Domestic Hot Water Generation. Appl. Sci. 2020, 10, 7873. [Google Scholar] [CrossRef]
  9. Wei, W.; Skye, H.M. Residential net-zero energy buildings: Review and perspective. Renew. Sustain. Energy Rev. 2021, 142, 110859. [Google Scholar] [CrossRef]
  10. Meng, Q.; Ren, X.; Wang, W.; Xiong, C.; Li, Y.; Xi, Y.; Yang, L. Reduction in on-off operations of an air source heat pump with active thermal storage and demand response: An experimental case study. J. Energy Storage 2021, 36, 102401. [Google Scholar] [CrossRef]
  11. Yu, M.; Li, S.; Zhang, X.; Zhao, Y. Techno-economic analysis of air source heat pump combined with latent thermal energy storage applied for space heating in China. Appl. Therm. Eng. 2021, 185, 116434. [Google Scholar] [CrossRef]
  12. Chwieduk, B.; Chwieduk, D. Analysis of operation and energy performance of a heat pump driven by a PV system for space heating of a single family house in polish conditions. Renew. Energy 2021, 165, 117–126. [Google Scholar] [CrossRef]
  13. Wu, D.; Hu, B.; Wang, R. Vapor compression heat pumps with pure Low-GWP refrigerants. Renew. Sustain. Energy Rev. 2021, 138, 110571. [Google Scholar] [CrossRef]
  14. Calm, J.M. The next generation of refrigerants—Historical review, considerations, and outlook. Int. J. Refrig. 2008, 31, 1123–1133. [Google Scholar] [CrossRef]
  15. Bamigbetan, O.; Eikevik, T.M.; Nekså, P.; Bantle, M. Review of vapour compression heat pumps for high temperature heating using natural working fluids. Int. J. Refrig. 2017, 80, 197–211. [Google Scholar] [CrossRef]
  16. Mselle, B.D.; Vérez, D.; Zsembinszki, G.; Borri, E.; Cabeza, L.F. Performance Study of Direct Integration of Phase Change Material into an Innovative Evaporator of a Simple Vapour Compression System. Appl. Sci. 2020, 10, 4649. [Google Scholar] [CrossRef]
  17. Klein, S.A.; Beckman, W.A.; Mitchell, J.W.; Duffie, N.A.; Duffie, J.A.; Freeman, T.L. TRNSYS 17, Transient System Simulation Program; University of Wisconsin: Madison, WI, USA, 1979. [Google Scholar]
  18. Meteonorm Database. Available online: http://www.meteonorm.com (accessed on 26 November 2011).
  19. Llantoy, N.; Chàfer, M.; Cabeza, L.F. A comparative life cycle assessment (LCA) of different insulation materials for buildings in the continental Mediterranean climate. Energy Build. 2020, 225, 110323. [Google Scholar] [CrossRef]
  20. Karasu, H.; Dincer, I. Life cycle assessment of integrated thermal energy storage systems in buildings: A case study in Canada. Energy Build. 2020, 217, 109940. [Google Scholar] [CrossRef]
  21. ISO 14040:2006(en). Environmental Management—Life Cycle Assessment—Principles and Framework; ISO: Geneva, Switzerland, 2006.
  22. Frischknecht, R.; Jungbluth, N.; Althaus, H.-J.; Doka, G.; Dones, R.; Heck, T.; Hellweg, S.; Hischier, R.; Nemecek, T.; Rebitzer, G.; et al. The ecoinvent Database: Overview and Methodological Framework. Int. J. Life Cycle Assess. 2004, 10, 3–9. [Google Scholar] [CrossRef]
  23. Recommendations for Life Cycle Impact Assessment in the European Context-Based on Existing Environmental Impact Assessment Models and Factors (International Reference Life Cycle Data System—ILCD Handbook); Publications Office of the European Union: Luxembourg, 2011. [CrossRef]
  24. Huijbregts, M.A.J.; Steinmann, Z.J.N.; Elshout, P.M.F.; Stam, G.; Verones, F.; Vieira, M.; Zijp, M.; Hollander, A.; Van Zelm, R. ReCiPe2016: A harmonised life cycle impact assessment method at midpoint and endpoint level. Int. J. Life Cycle Assess. 2017, 22, 138–147. [Google Scholar] [CrossRef]
  25. ReCiPe. Available online: https://www.rivm.nl/en/life-cycle-assessment-lca/recipe (accessed on 15 February 2021).
  26. International Reference Life Cycle Data System (ILCD) Handbook: Analysing of Existing Environmental Impact Assessment Methodologies for Use in Life Cycle Assessment; Publications Office of the European Union: Luxembourg, 2010. [CrossRef]
  27. Fagan, M.L. A Guide to Global Sourcing. J. Bus. Strat. 1991, 12, 21–25. [Google Scholar] [CrossRef]
  28. de Gracia, A.; Rincón, L.; Castell, A.; Jiménez, M.; Boer, D.; Medrano, M.; Cabeza, L.F. Life Cycle Assessment of the inclusion of phase change materials (PCM) in experimental buildings. Energy Build. 2010, 42, 1517–1523. [Google Scholar] [CrossRef]
  29. ISO 14044:2006(en). Environmental Management—Life Cycle Assessment—Requirements and Guidelines; ISO: Geneva, Switzerland, 2006.
  30. Asdrubali, F.; Baldassarri, C.; Fthenakis, V. Life cycle analysis in the construction sector: Guiding the optimization of conventional Italian buildings. Energy Build. 2013, 64, 73–89. [Google Scholar] [CrossRef]
  31. Frischknecht, R.; Rebitzer, G. The ecoinvent database system: A comprehensive web-based LCA database. J. Clean. Prod. 2005, 13, 1337–1343. [Google Scholar] [CrossRef]
  32. Li, Z.; Jiang, H.; Chen, X.; Liang, K. Comparative study on energy efficiency of low GWP refrigerants in domestic refrigerators with capacity modulation. Energy Build. 2019, 192, 93–100. [Google Scholar] [CrossRef]
  33. Fannou, J.-L.C.; Rousseau, C.; Lamarche, L.; Kajl, S. A comparative performance study of a direct expansion geothermal evaporator using R410A and R407C as refrigerant alternatives to R22. Appl. Therm. Eng. 2015, 82, 306–317. [Google Scholar] [CrossRef]
  34. Sánchez, D.; Cabello, R.; Llopis, R.; Arauzo, I.; Catalán-Gil, J.; Torrella, E. Energy performance evaluation of R1234yf, R1234ze(E), R600a, R290 and R152a as low-GWP R134a alternatives. Int. J. Refrig. 2017, 74, 269–282. [Google Scholar] [CrossRef]
  35. Fukuda, S.; Kondou, C.; Takata, N.; Koyama, S. Low GWP refrigerants R1234ze(E) and R1234ze(Z) for high temperature heat pumps. Int. J. Refrig. 2014, 40, 161–173. [Google Scholar] [CrossRef]
  36. Francis, C.; Maidment, G.; Davies, G. An investigation of refrigerant leakage in commercial refrigeration. Int. J. Refrig. 2017, 74, 12–21. [Google Scholar] [CrossRef]
Figure 1. Schematic diagram for the reference system.
Applsci 11 03820 g001
Figure 2. Schematic diagram for the innovative system.
Applsci 11 03820 g002
Figure 3. Overview of the impact categories that are covered in the ReCiPe2016 method and their relation to the areas of protection (adapted from [25]).
Applsci 11 03820 g003
Figure 4. LCA results using ReCiPe indicator: (a) total impact points; (b) total impact points of damage categories; (c) total impact categories towards ReCiPe endpoint single score; (d) impact points per life cycle stage.
Applsci 11 03820 g004
Figure 5. Results per m2 of living floor using the indicator IPCC GWP–kgCO2-eq.: (a) GWP 100a per life cycle stage; (b) GWP 100a total; (c) GWP 20a per life cycle stage; (d) GWP 20a total.
Applsci 11 03820 g005
Figure 6. Contribution of the refrigerant to the overall system change in the refrigerant impact: (a) R134a (100%); (b) 150%; (c) 50%; (d) 0%.
Applsci 11 03820 g006
Figure 7. Contribution of the refrigerant to the overall system change in the refrigerant lifespan: (a) 15 years; (b) 10 years; (c) 5 years; (d) 1 year.
Applsci 11 03820 g007
Table 1. Sizing of the main components for the reference system.
ComponentVariableValueUnit
DHW storage tankStorage capacity420L
Heat pumpMaximum thermal power35kW
Table 2. Sizing of the main components of the innovative system.
ComponentVariableValueUnit
PV panelsPeak power10kWp
Heat pumpNominal heating power30kW
Sensible heat storageStorage capacity140L
Latent heat thermal energy storageAmount of PCM80kg
Electrical storage (battery)Electrical storage capacity15kWh
Table 3. Inventory of the reference system.
ElementUnitQuantity/UnitUnit of MeasurementReplacementTotal Amount
Heat pump
Heat Pump11unit1.51.5
3-Way mixing globe210.4kg2.526
2-Way manual valve62.7kg2.56.7
Check valve11.7kg2.54.2
Non-return valve10.4kg2.51
DHW tank
DHW tank11unit33
2-Way manual valve10.5kg2.51.2
Non-return valve10.4kg2.51
Piping17.6 (m)53.5kg153.5
Insulation17.6 (m)4.6kg14.6
Table 4. Inventory of the innovative system.
ElementUnitQuantity/UnitUnit of MeasurementReplacementTotal Amount
Heat pump
Compressor15kg210
Controller11unit22
Inverter11unit3.33.3
Expansion valve11unit22
Heat exchanger-evaporator122kg1.226.4
Fan-evaporator11unit22
4-way valve11unit22
Refrigerant R3213.5kg27
Expansion vessel18kg1.29.6
Heat exchanger–condenser19.5kg1.211.4
Electric heater11.2kg22.4
Manual 2-way valve10.4kg20.8
Circulating pump14.7kg29.4
Diverter 3-way valve11kg22
Hydraulic separator112kg1.214.4
Security valve10.1kg1.20.12
Flow rate sensor11unit22
Electric storage
Electric battery1225kg0.75168.8
DC–DC converter140kg1.560
AC–DC converter150kg1.575
Electric controller (PLC)10.5kg1.50.75
Current transducer30.24kg1.51.08
Line filter11.8kg1.52.7
Fuses80.02kg1.50.24
Aux power supply10.75kg1.51125
Grid monitoring10.36kg1.50.54
LED indicators50.05kg1.50.375
Insolation monitoring10.39kg1.50.585
Connectors40.03kg1.50.18
Time delay relay10.07kg1.50.105
Power relay10.86kg1.51.29
Relays50.06kg1.50.45
Grid contactor10.84kg1.51.26
DC contactors31kg1.54.5
Battery contactor15.2kg1.57.8
Circuit breakers + aux70.8kg1.58.4
Precharge resistor10.01kg1.50.015
Switches40.2kg1.51.2
Smart meters30.1kg1.50.45
Ethernet switch10.28kg1.50.42
Terminal blocks840.01kg1.51.26
Electric cabinet + acc.130kg1.545
DIN rail60.8kg1.57.2
Wires130kg1.545
Screws1500.04kg1.59
Nuts1000.03kg1.54.5
Washers1000.01kg1.51.5
Slotted wiring duct30.5kg1.52.25
Strain relief bar20.01kg1.50.03
Latent storage
RPW-HEX1220kg1.5330
Paraffin180kg1.5120
Sensible storage
DHW tank110unit0.76.7
PV panels
PV panels180m21.296
Table 5. Annual energy consumption of the reference system.
ComponentDHW (kWh/Year)Heating (kWh/Year)Cooling (kWh/Year)Total (kWh/Year)
Heat pump6113895670015,769
Electric DHW heater0--0
Circulation pump: DHW30 *--30
Circulation pump: heating and cooling-376 **29 ***405
Total6143933272916,204
* Obtained assuming that the heat pump that heats the water inside the DHW tank has a constant average power of 30 kW. This means that the estimated time when the circulation pump is working is obtained by dividing the total annual DHW demand of the building (19,699 kWh) by the energy that the heat pump can provide in 1 h (30 kWh/h), i.e., time = 19,699/30 = 656.6 h. An average electricity consumption of the circulation pump of 45 W was assumed. ** Obtained assuming that the heat pump working in heating mode has a constant average power of 30 kW. This means that the estimated time when the circulation pumps are on is obtained by dividing the total annual heating demand of the building (50.15 kWh/m2) by the energy that the heat pump can provide in 1 h (0.06 kWh/(h·m2)), i.e., time = 50.15/0.06 = 835.8 h. A total of ten circulation pumps was assumed with and an average electricity consumption of 45 W for each pump. *** Obtained assuming that the heat pump working in cooling mode has a constant average cooling power of (30/2.8)·3.8 = 40.71 kW, where a SCOP (seasonal coefficient of performance) of 2.8 and a SEER of 3.8 were assumed. This means that the estimated time when the circulation pump is working is obtained by dividing the total annual cooling demand of the building (5.32 kWh/m2) by the average cooling energy that the heat pump can provide in 1 h (0.0814 kWh/(h·m2)), i.e., time = 5.32/0.0814 = 65.3 h. A total of ten circulation pumps was assumed with and an average electricity consumption of 45 W for each pump.
Table 6. Annual electricity consumption from the grid of the innovative system.
ComponentDHW (kWh/Year)Heating (kWh/Year)Cooling (kWh/Year)Total (kWh/Year)
Heat pumpN/AN/AN/A6374
Electric heater3654--3654
Fan coil-N/AN/A658
Circulation pumpsN/AN/AN/A392
TotalN/AN/AN/A11,078
Table 7. LCIA of the reference system during manufacturing/disposal stage.
ElementMassReCiPeGWP 100aGWP 20a
(kg)Impact/m2 FloorkgCO2-eq /m2kgCO2-eq /m2
Heat pump
Heat pump1.5 (unit)10.29014.00730.071
3-Way mixing globe260.0220.0440.050
2-Way manual valve6.70.0060.0110.013
Check valve4.20.0040.0070.008
Non-return valve10.0010.0020.002
DHW tank
DHW tank3 (unit)2.0274.9225.754
2-Way manual valve1.20.0010.0020.002
Non-return valve10.0010.0020.002
Pipes53.50.0450.0900.102
Insulation4.60.0650.0440.052
Table 8. LCIA of the innovative system during manufacturing/disposal stage.
ElementMassReCiPeGWP 100aGWP 20a
(kg)Impact/m2 FloorkgCO2-eq /m2kgCO2-eq /m2
Heat pump
Compressor100.0300.0610.061
Controller2 (unit)0.0940.1910.221
Inverter3.3 (unit)0.1720.2810.331
Expansion valve20.0450.0010.001
Heat exchanger–evaporator26.40.2980.4610.571
4-Way valve20.0360.0110.001
Refrigerant R3270.0310.3110.461
Expansion vessel9.60.1520.3310.381
Heat exchanger–condenser11.40.0350.0610.081
Electric heater2.40.0070.0010.021
Manual 2-way valve0.80.0990.0210.031
Circulating pump9.40.0290.0510.061
Diverter 3-way valve20.2490.0610.070
Hydraulic separator14.40.0440.080.100
Security valve0.120.0150.0010.001
Flow rate sensor2 (unit)0.0090.0010.001
Electric storage
Electric battery168.82.5642.3642.873
DC–DC converter601.3380.3460.386
AC–DC converter751.6730.4320.482
Electric controller (PLC)0.750.0170.0040.005
Current transducer1.080.0240.0060.007
Line filter2.70.3360.0800.094
Fuses0.240.0300.0070.008
Aux power supply1.1250.0250.0060.007
Grid monitoring0.540.0120.0030.003
LED indicators0.3750.0080.0020.002
Insolation monitoring0.5850.0010.0020.002
Connectors0.180.0040.0010.001
Time delay relay0.1050.0130.0030.004
Power relay1.290.1600.0380.045
Relays0.450.0560.0130.016
Grid contactor1.260.0280.0070.008
DC contactors4.50.1000.0260.029
Battery contactor7.80.0050.0250.033
Circuit breakers + aux8.40.1870.0480.054
Precharge resistor0.0150.0010.0010.001
Switches1.20.1490.0360.042
Smart meters0.450.0560.0130.016
Ethernet switch0.420.0520.0120.015
Terminal blocks1.260.1570.0370.044
Electric cabinet + acc.451.0040.2590.289
DIN rail7.20.1610.0420.046
Wires451.0040.2590.289
Screws90.2010.0520.058
Nuts4.50.5600.1340.156
Washers1.50.1870.0450.052
Slotted Wiring Duct2.250.0500.0130.014
Strain relief bar0.030.0010.0010.001
Latent storage
RPW-HEX3303.7275.7357.148
Paraffin1200.0600.1600.171
Sensible storage
Domestic hot water tank6.7 (unit)4.42310.23511.933
PV panels
PV panels96 (m2)2.0399.03110.708
Table 9. LCIA of the reference system during the operational stage for a 30-year lifespan.
ElementTotal (kWh/Years)ReCiPeGWP 100aGWP 20a
Impact/m2 FloorkgCO2-eq /m2kgCO2-eq /m2
Heat pump15,76994.18398.83434.94
Circulating pump DHW300.180.760.83
Circulating pump H&C4052.4210.2411.17
Total16,20496.78409.83446.94
Table 10. LCIA of the innovative system during the operational stage for a 30-year lifespan.
ElementTotal (kWh/Year)ReCiPeGWP 100aGWP 20a
Impact/m2 FloorkgCO2-eq /m2kgCO2-eq /m2
Heat pump637438.070161.211175.81
Domestic hot water tank with electric heater365421.82492.417100.78
Fan coil6583.93016.64218.149
Circulating pumps3922.3419.91410.812
Total11,07866.166280.184305.55
Table 11. GWP 100a of the selected refrigerant for the parametric study.
RefrigerantsGWP 100aReference
Reference (R134a)1430[32]
R32675[33]
R407c1520[33]
R410a1725[33]
R600a (butane)3[32]
R290 (propane)3[34]
R152a137[34]
R1234ze (E)6[35]
R1234yf4[32]
Publisher’s Note: MDPI stays neutral with regard to jurisdictional claims in published maps and institutional affiliations.