Article

RBS Channeling MATLAB Application for Automated Measurement Control and Evaluation for 6MV Tandetron Accelerator

1
Faculty of Materials Science and Technology in Trnava, Advanced Technologies Research Institute, Slovak University of Technology in Bratislava, 917 24 Trnava, Slovakia
2
Faculty of Materials Science and Technology in Trnava, Institute of Applied Informatics, Automation and Mechatronics, Slovak University of Technology in Bratislava, 917 24 Trnava, Slovakia
3
Research Centre, Univerzitna 8215/1, University of Zilina, 010 26 Zilina, Slovakia
*
Author to whom correspondence should be addressed.
Appl. Sci. 2021, 11(9), 3817; https://doi.org/10.3390/app11093817
Submission received: 22 March 2021 / Revised: 17 April 2021 / Accepted: 19 April 2021 / Published: 23 April 2021
(This article belongs to the Section Materials Science and Engineering)

Abstract

:
Rutherford backscattering spectrometry (RBS) in channeling regimes (RBS/C), as an ion beam analysis method performed on a Tandetron 6MV accelerator, generally gives precise information about the structure of crystalline samples by combining RBS signals in the random and aligned configurations. This paper presents details about the design and implementation of tailored RBS/C measurements (coarse and fine) and data evaluation application developed in MATLAB for in situ accelerator control system ARGUS, delivered by High Voltage Engineering Europa BV (HVEE). Additionally, we examined two different ways of stepping during the measurement to reduce the possible inaccuracies related with goniometer’s backslash affecting the evaluation of spectra. Verification experiment was carried out using a 2-MeV 4He+-beam directed on a Si (100) substrate. The channeling effect is seen as channeling dips of a lower signal in an otherwise rather homogeneous plane. Implemented application significantly facilitates the RBS/C measurement and analysis of the experiments, and also extends the ion beam analysis portfolio of Advanced Technologies Research Institute. Finally, software is ready-to-use for any Tandetron based ion beam facility with the ARGUS software for accelerator control.

1. Introduction

When semiconductors, metals, and other materials have ordered arrays of atoms, they form crystal material. Rutherford backscattering spectrometry (RBS) has been widely used for investigations of solid-state surface layers [1]. The strong influence of the crystal lattice on the trajectories of ions penetrating the solid-state surface layers is known as channeling. A combination of RBS and channeling techniques provides the location of impurities, atoms, and defects distributions in crystals. This information is hardly obtainable from other measurements. In the case of standard RBS, we usually assume the random sample orientation and normal yield is obtained under non-channeling conditions. When the crystal sample is aligned, that is, the direction of the incident beam is oriented with respect to some axis or plane of the crystal (axial or planar channeling), the number of backscattered ions decreases considerably. The procedure to achieve such orientation is called “beam alignment”. For example, in the case of 4He+ primary beam in energy ranges from hundreds of keV to several MeV, the sample surface layer of up to 1 µm can be analyzed. The ions penetrate deeply into the crystal without substantially perturbing the lattice [1,2,3,4].
In the case of RBS/C, it is performed through gradually tilting the sample and monitoring the registered backscattered ions; this causes a decrease in the RBS energy spectrum yield. The dips in the angular distribution of the backscattering yield are used for crystal alignment. To find such channeling dips, a number of energy spectra of backscattering ions has to be measured while the incident-beam direction with respect to the crystal is changed simultaneously in small angular steps [2,5].
The 6 MV Tandetron control software, ARGUS, allows for single or multiple consecutive measurements to be run given in the batch file [6,7]. The typical channeling measurement, including sample crystal alignment, requires collecting typically hundreds of RBS spectra, which in manual evaluation, is cumbersome and time-consuming. Hence, the process automatization is required in order to increase the efficiency of RBS/C measurement. In fact, because of the different experimental setups, control systems, other software, options, and etc., the ion beam facilities are developing their own tailor-made applications and software tools including RBS/C to support the competences in ion beam analysis (IBA) [8,9,10,11].

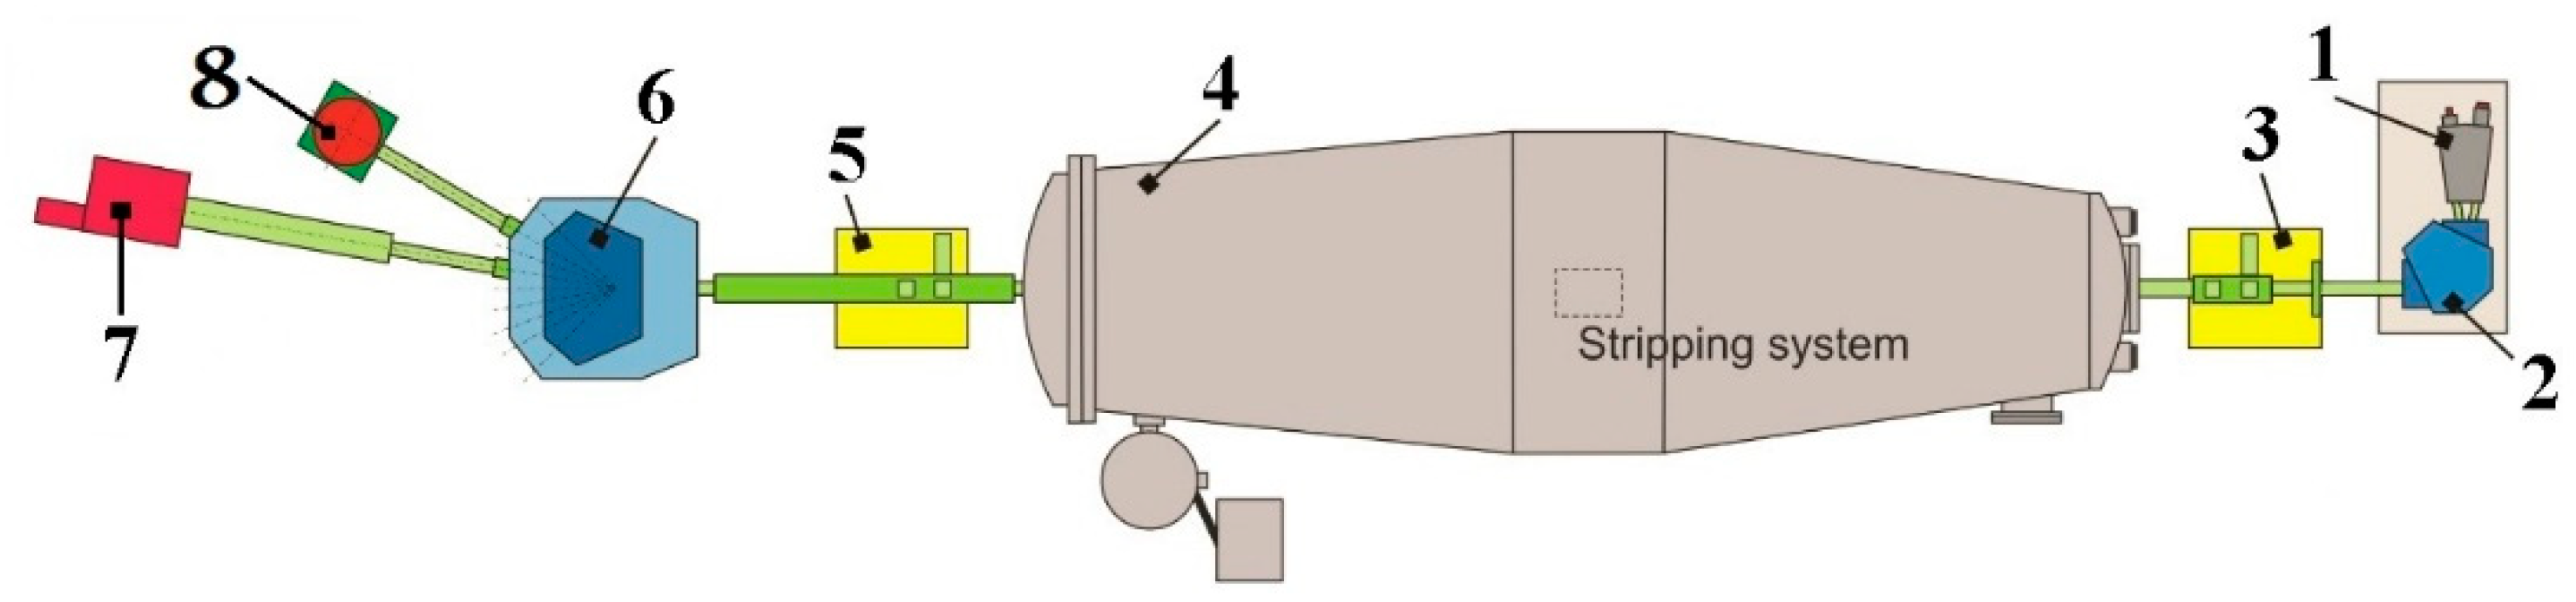
1.1. Accelerator and Ion Beam Analysis

The Advanced Technologies Research Institute at MTF STU in Trnava, as a new ion beam facility established recently [12], provides a set of ion beam analysis and implementation methods for synthesis, modification, and analysis of materials. One of the key devices is the HVEE 6 MV Tandetron. This is a linear tandem ion accelerator with an accelerating voltage in the range from 300 kV to 6 MV. The present ion sources enable the acceleration of all elements from hydrogen to uranium, except for inert gases heavier than helium. The maximum achievable ion energy is 12 MeV for hydrogen, 18 MeV for helium, and over 100 MeV for heavy elements such as gold. The beamlines and experimental end-stations are kept under a high-vacuum (base pressure 10−7 mbar).
In general, HVEE tandem accelerators can work with maximum acceleration voltages from 1 to 9 MV [13]. The beamline (for IBA) was designated to produce a collimated beam with an angular divergence of less than 0.07°. Small divergences were collimated to the spot size of 1.5 mm. Our current experimental setup (Figure 1) is described in detail [8].
The Ion accelerator is operated by real-time TwinCAT SoftPLC interlinked with HVEE control software, ARGUS. Figure 2 shows the control system architecture in the block diagram [14]. Interestingly, our accelerator system was the first one with ARGUS software deployment, and since then, ARGUS is now an integral part of Tandetron installations all over Europe and the world [15,16,17] which predicts potential interest of the ion beam facilities in MATLAB RBS channeling application.

1.2. Motivation

As discussed above, our motivation is to provide a straightforward, automated approach for channeling spectra measurements that can automatically control the process of RBS/C measurements and evaluate acquired data and is suitable for the Tandetron based ion beam facilities. The automation of the process leads to increased work efficiency and reflects the requests defined by our materials researchers.

2. Preliminaries

ARGUS is a basic software for controlling the HVEE Tandetron and built on a VAC Cluster Tool Controller program. It allows controlling the accelerator and overseeing of the technology (Figure 3). Single measurement is defined by required parameters, such as the sample position, the measurement parameters, a dose, and others. Additionally, MPANT is a software used to control the collecting spectra from detectors in multichannel analyzers and their visualization. The IBA module controls the pre-set parameters for termination of measurement and data saving.
The system does not include a module for analysis of measured data. Data from IBA analyses are evaluated by other dedicated codes. For these reasons, the design of our application, especially concerning the measurements, was built on the existing control software functions and interfaces presented above and in the Figure 3. RBS/C measurement is a more complex task, and without a specialized support module, it is a more demanding and time-consuming task. Typically, more than 160 single RBS measurements have to be processed for crystal alignment, and dozens more are needed for the axial or planar channeling angular spectra. Then, we need to locate minima of dips in angular spectra to identify planes and calculate off-set for crystal alignment. Afterwards, the channel minima and its angular width are determined.
Lastly, the expected results of the experiment involve a silicon based micro-electro-mechanical system (MEMS) technology that commonly uses (100)-oriented silicon wafers, where the (100) is the crystallographic plane on the surface of the wafer [17]. Stereographic projection of the (100)-oriented Si crystal is shown in Figure 4.

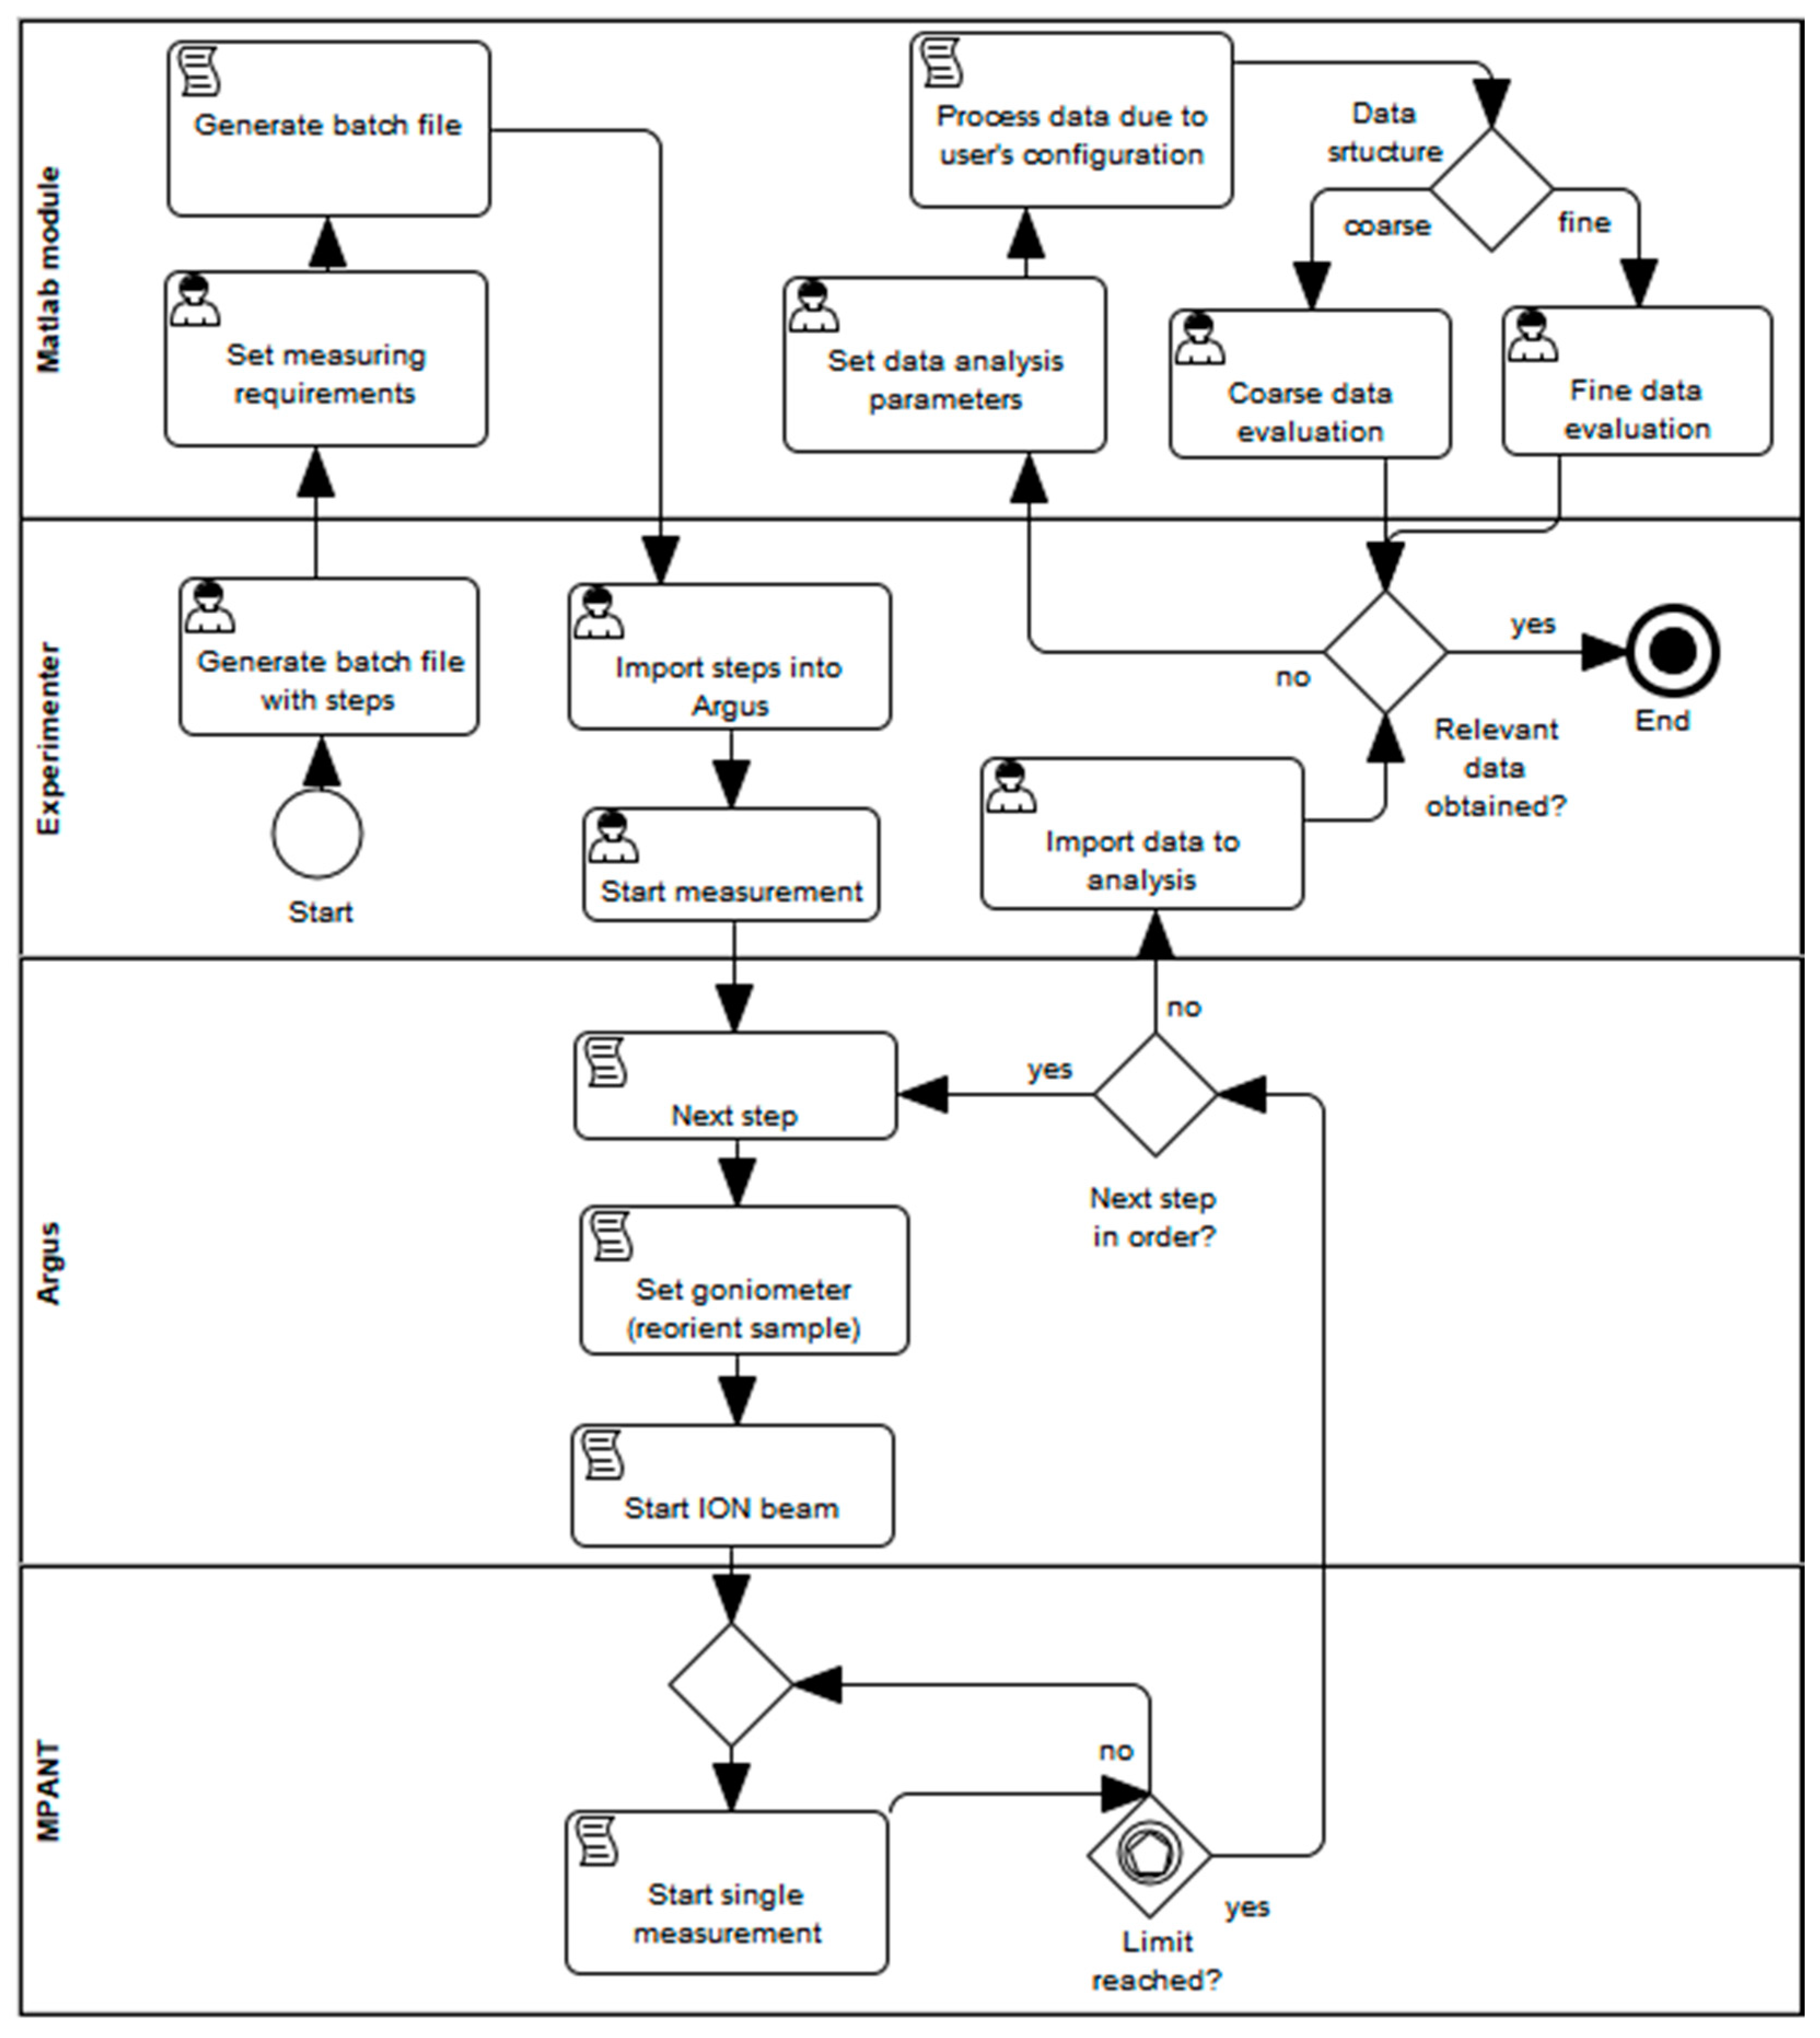
2.1. RBS/C Measurement Procedure

During the RBS measurement, the backscattered ions were detected by a silicon detector with an energy resolution of 13 keV situated at a fixed position and at a scattering angle of 170° [8]. Insulation of the sample holder against the main body of the goniometer allows in-situ measurement of the actual ion beam current which measured 8–10 nA. Secondary electron emission was suppressed by positively biasing the sample holder to 280 V. The crystal sample was mounted on 4-axis goniometer (Figure 5), which enabled rotation around all three axes (see ARGUS and MATLAB notations in Table 1):
During the stepwise rotation of the goniometer around one of the axes, RBS energy spectra were recorded simultaneously. Then, after summing counts (yield) within an appropriately selected region of interest (ROI) of each measured RBS spectrum (as it is shown in Figure 13), we constructed the dependency of YieldROI vs. the angle of tilting (e.g., Figures 14 and 15). In this way, the channeling spectrum was created. The channeling spectrum represents the dependency of YieldROI on the angle of rotation, and the position of dips represent intersections with one of the crystal axes or planes.
At the earliest, channeling dip measurements were typically carried out around the Z-axis (the direction of the incident ion beam), commonly used to align the target crystal. However, if channeling measurements are carried out along azimuthal and tilt angles, the scanning range can be significantly reduced. A more detailed procedure of crystal alignment for RBS/C measurement can be found, e.g., in [1].
Our solution described below uses rotation around axis-X and axis-Y. It generated an angular distribution of the YieldROI which is fitted, and positions of the minima of dips were determined. By connecting the minima of corresponding dips, the projections of crystal planes were generated (e.g., Figures 14 and 15). The intersection of planes represents the angular position which is an offset of the major crystal axis (Figure 16). After entering this offset to the goniometer control, the alignment of the crystal was done. The accuracy of the alignment can be enhanced by repeating this procedure.
Such RBS/C measurement for crystal alignment represented typically about 160 angular displacements (step of 0.2°) of the goniometer, and the RBS spectra recorded with a dose of 0.2 µC, respectively. We call this the “coarse” channeling measurement.
This was followed by the RBS/C angular measurement through a selected axis or plane, which we call the “fine” channeling measurement. In this case, the usual tilting increments were 0.05° or less at the dose of 0.5 µC. The goniometer was driven by stepping motors and the minimum step was 0.01°. After normalization of the channeling YieldROI, the minimum value of the dip, denoted as χmin, and the angular width, were the two main parameters of the channeling spectrum that are determined (e.g., Figure 17).
The previous situation was such that the operator had to write down parameters for every measured step manually into ARGUS to control the measurements. The control system of the Tandetron allows the users to load a set of parameters from a batch file even for multiple experiments, but each single step and parameter had to be written manually. The control parameters were stored in an XML structure.

2.2. Issues

Several issues (more or less known) were identified to be examined or solved within the application:
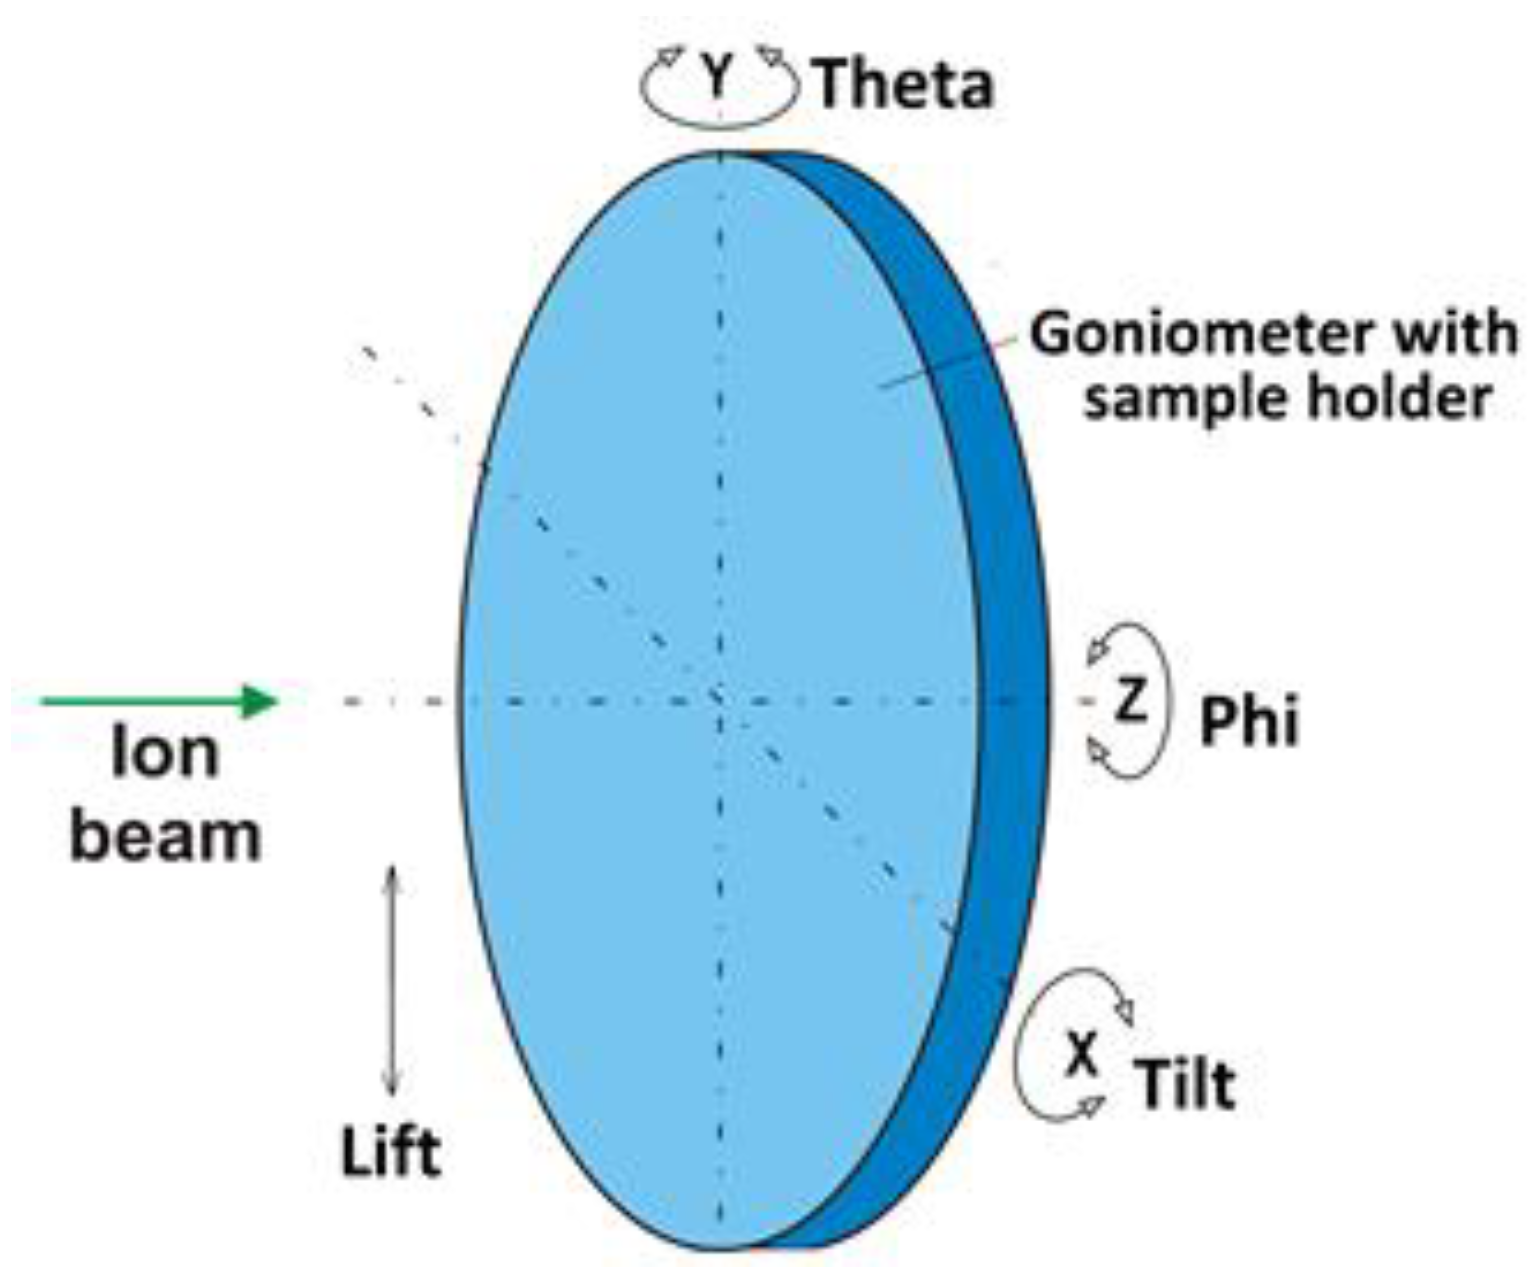
  • Mechanical backslash of the goniometer could have negative influence on the accuracy of the measurement.
  • Measured data are processed manually (which is time consuming); ARGUS doesn’t support an automatic mode for the measurements.
  • An evaluation module for RBS/C in ARGUS is not available (not even an automated one).

3. Software and Experiment

RBS/C application was implemented in the MATLAB environment and developed as a standalone application, expanding the software of the IBA module of ARGUS [18]. The object-oriented approach (together with the use of standard libraries and scripting) was applied to design and develop the application, consequently examined and verified by the experiment carried out using 4He+ ions directed on a Si (100) at energy 2 MeV.

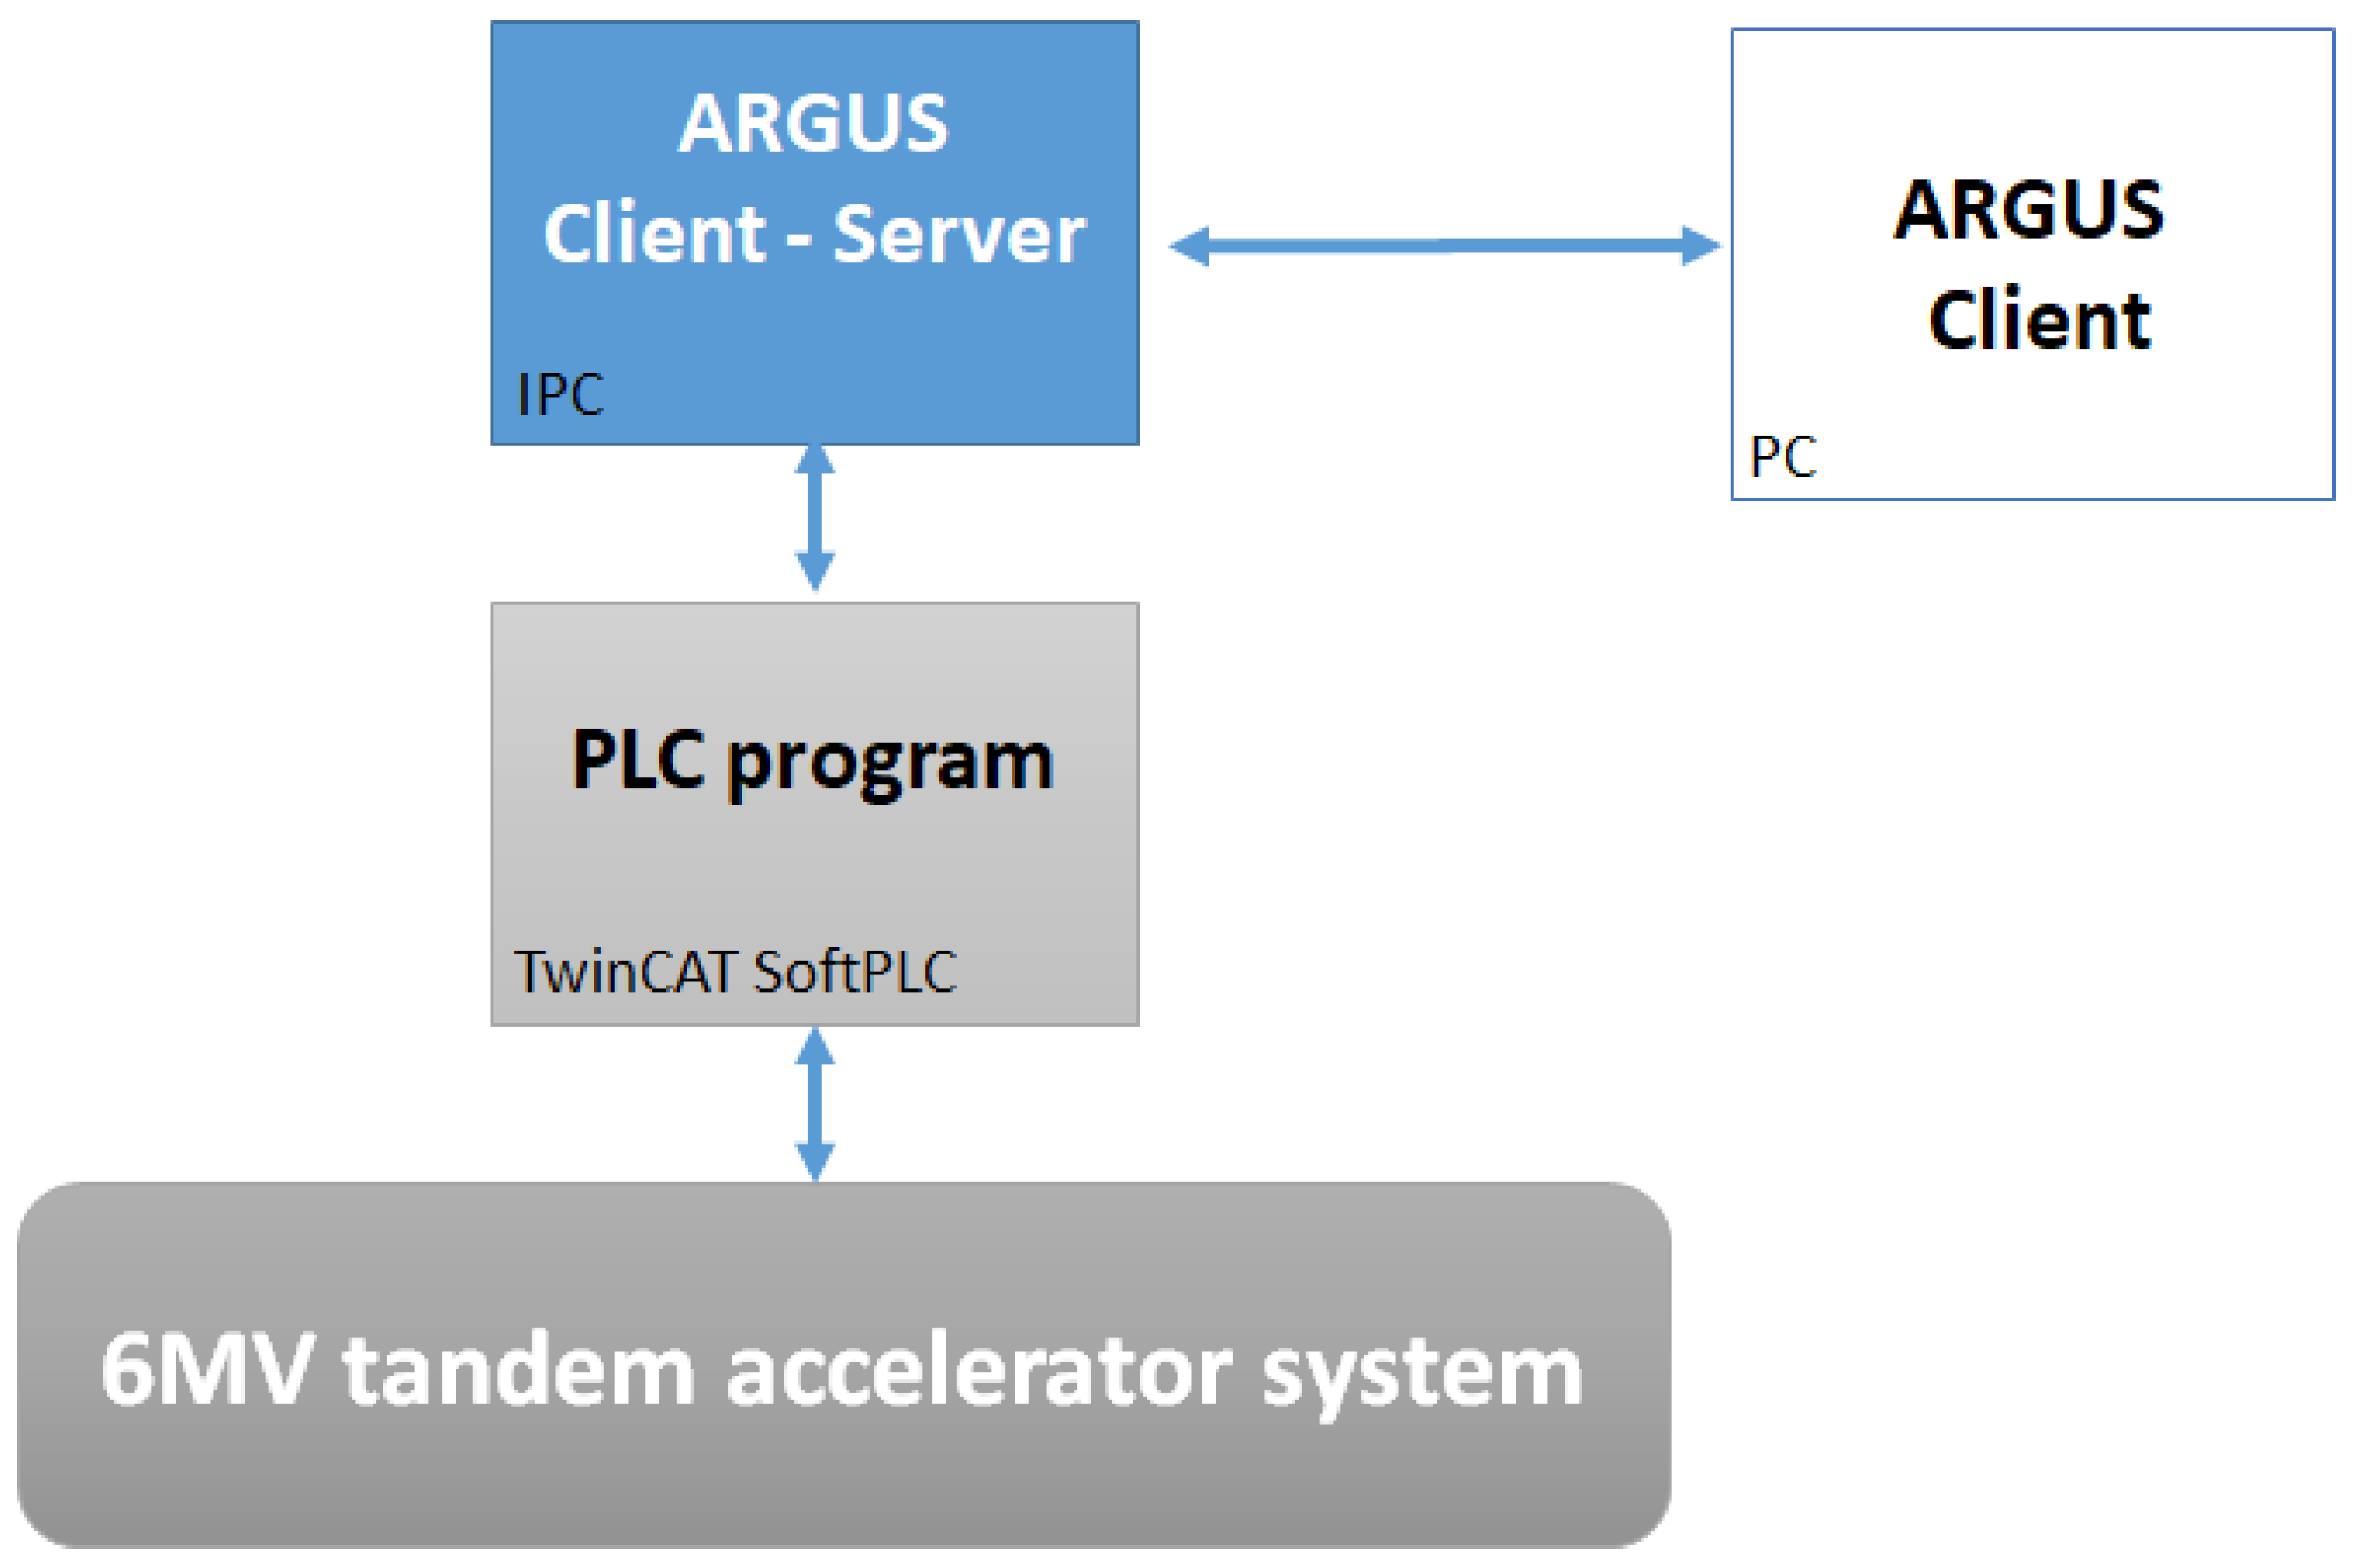
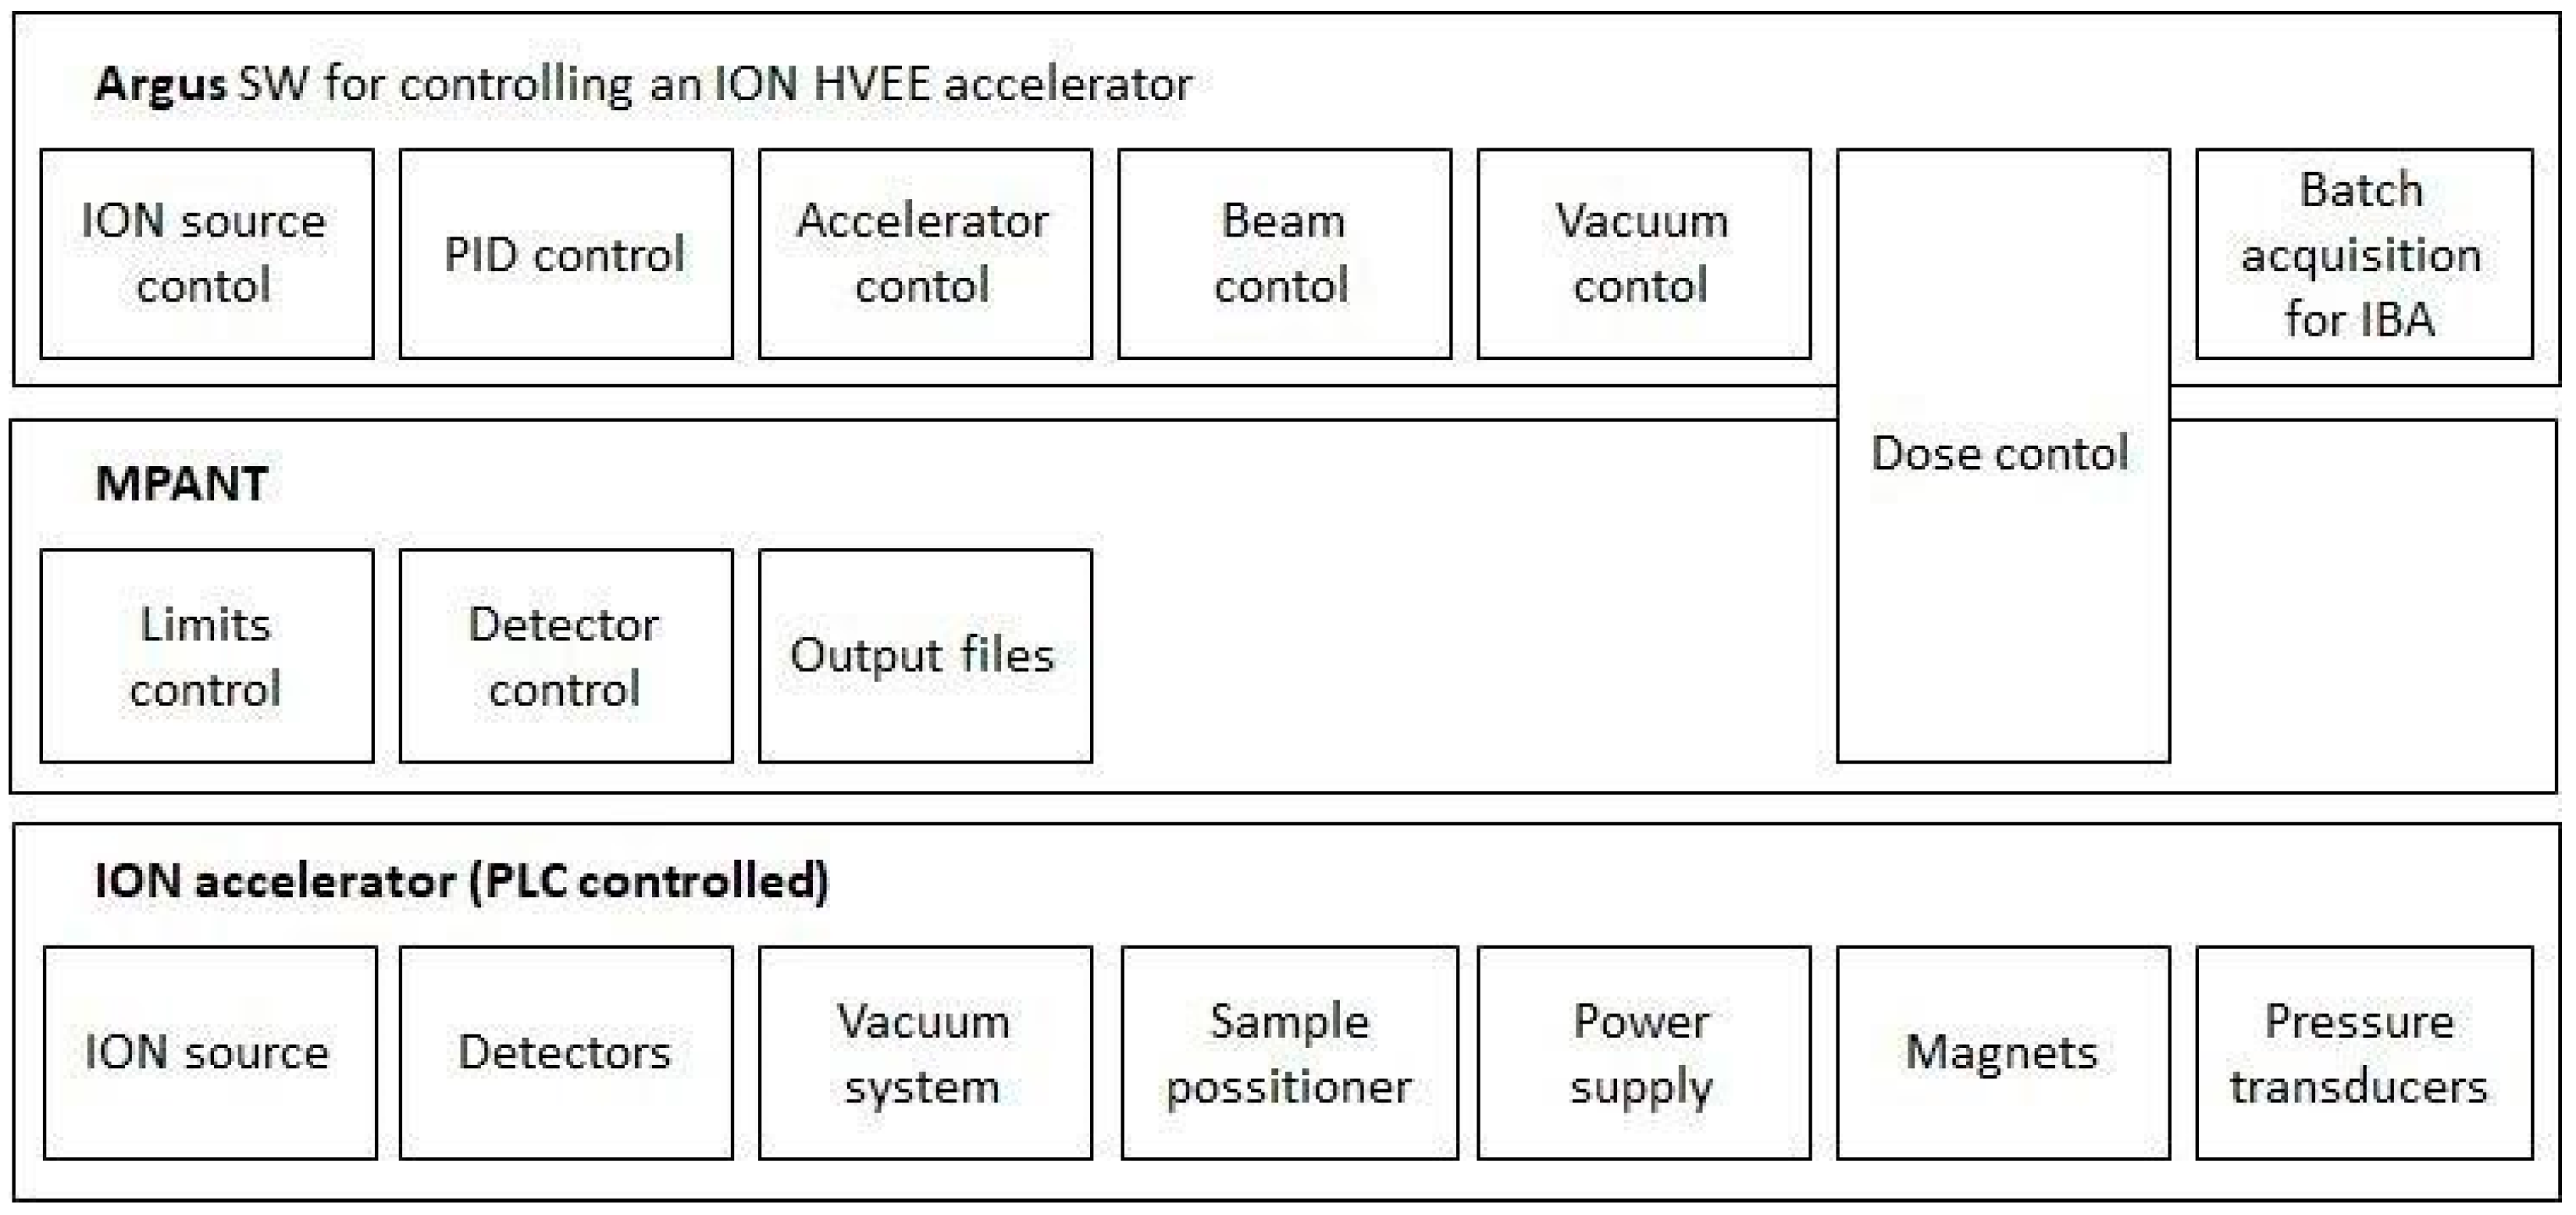
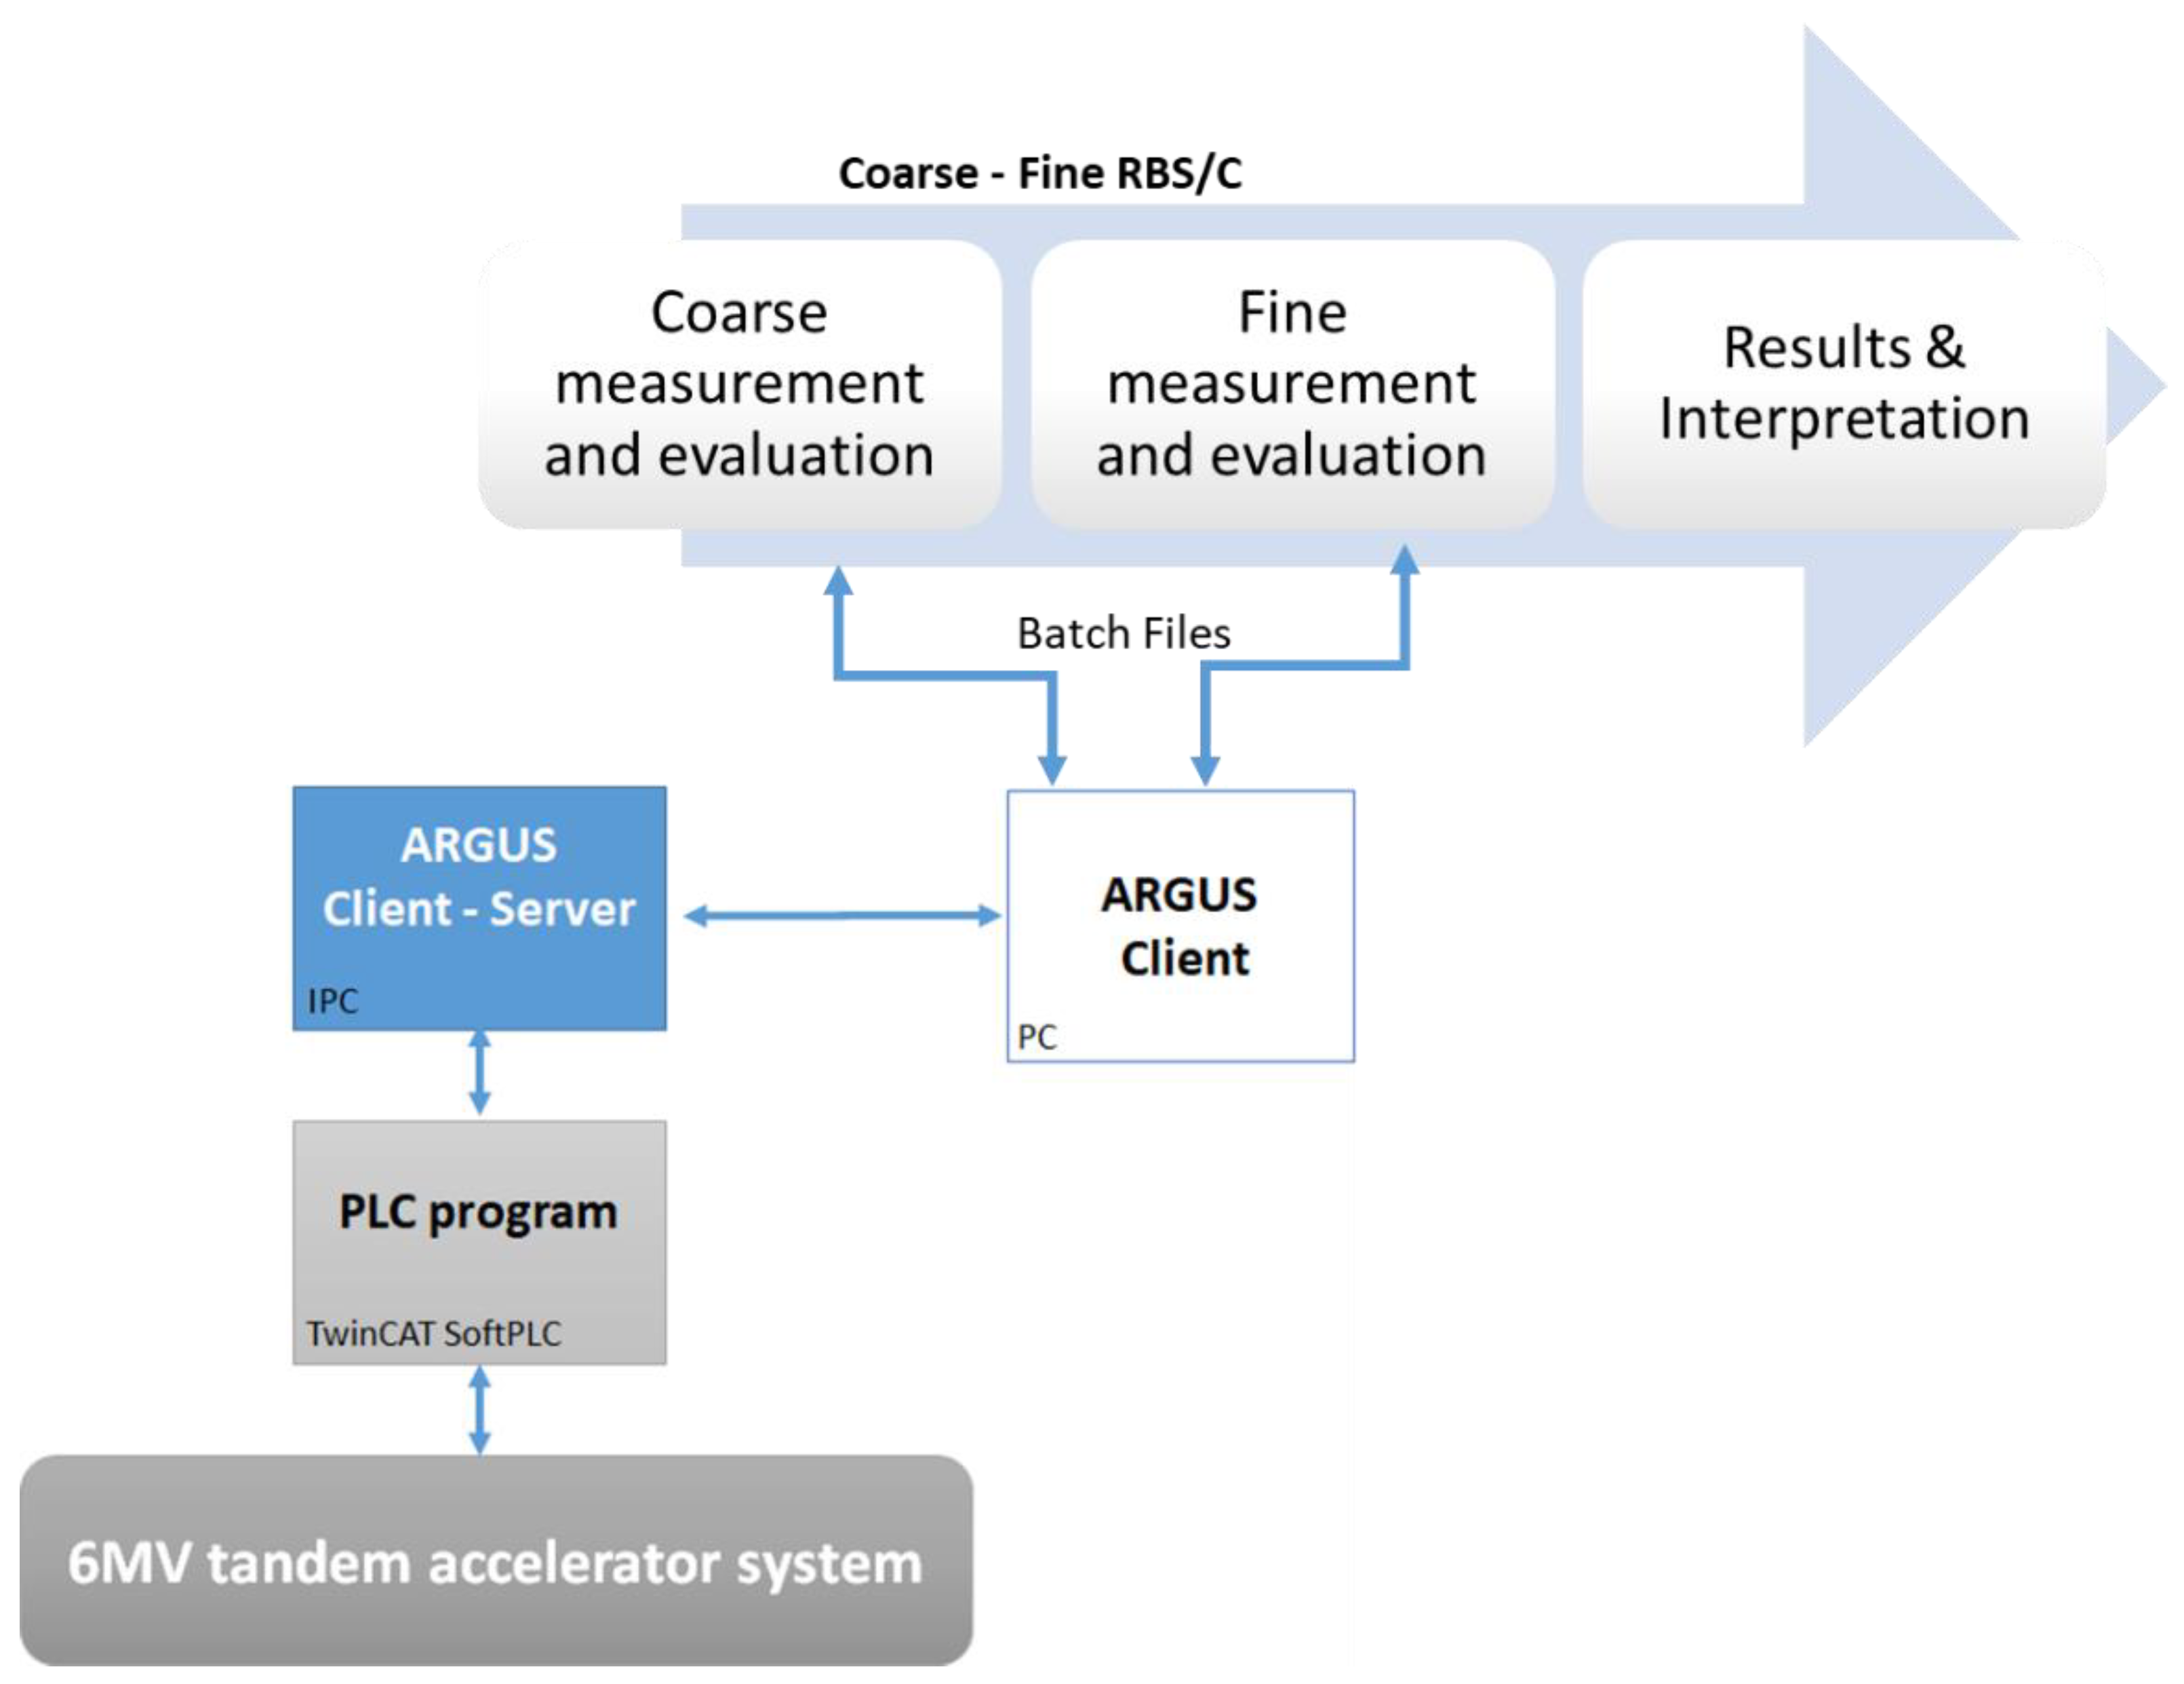
3.1. Design and Architecture

Principally, MATLAB application for RBS/C measurements and evaluation was used over the existing accelerator software control system, ARGUS (Figure 6). The control of ARGUS and the Tandetron accelerator system subsequently was carried out using the batch (BTC) files with settings such as the ion beam start, the position of sample-goniometer, irradiation dose, and the automatic movement of the goniometer during spectrum acquisition.
The system applied both modes leading to the desired parameter determination. This was done automatically by the algorithm or manually by minor user corrections if needed (e.g., by selecting minima).
Coarse measurements and evaluations of the written program were characterized by the partial steps starting from the BTC file generation to perform experiments, ending with the projections of planar axes (intersection) together with axial axis offset calculations (Figure 7). All the procedures, except the measurements in ARGUS, were carried out in our MATLAB application, which included:
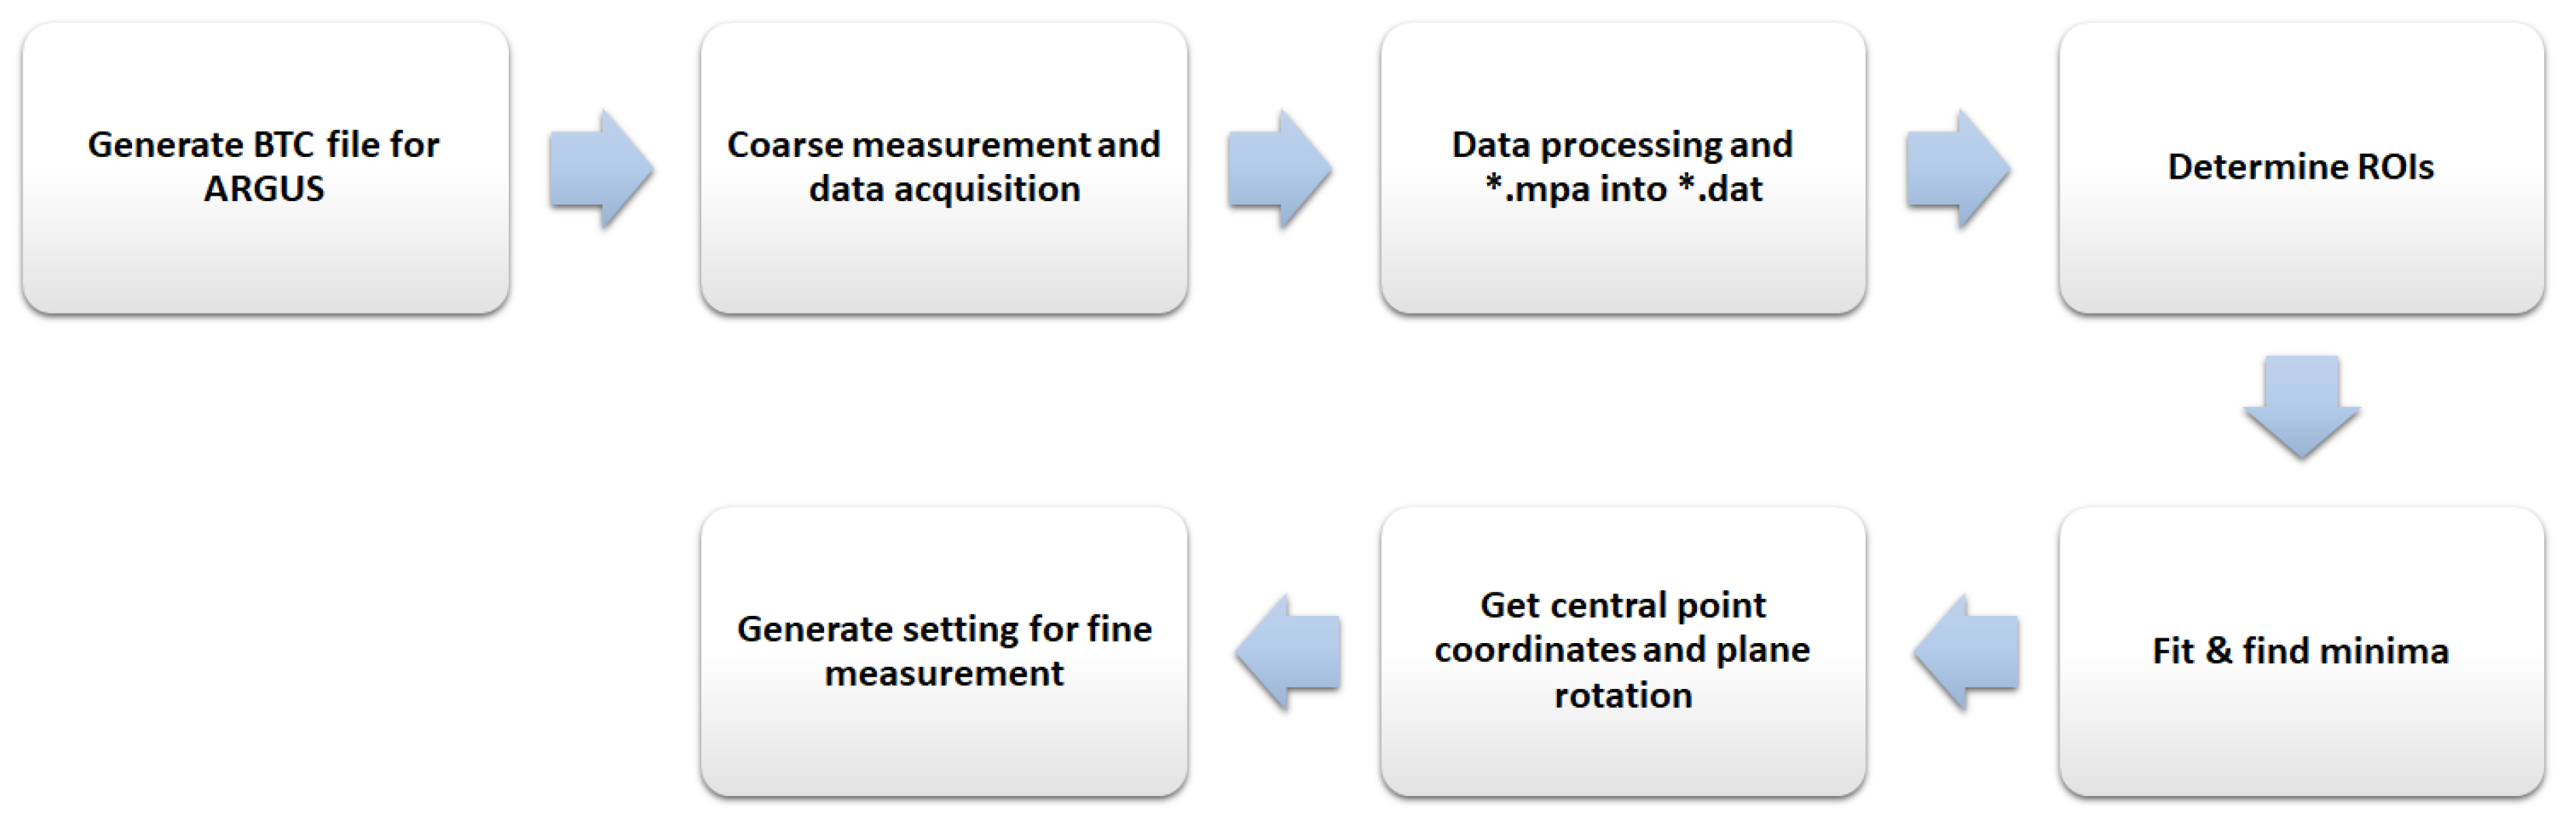
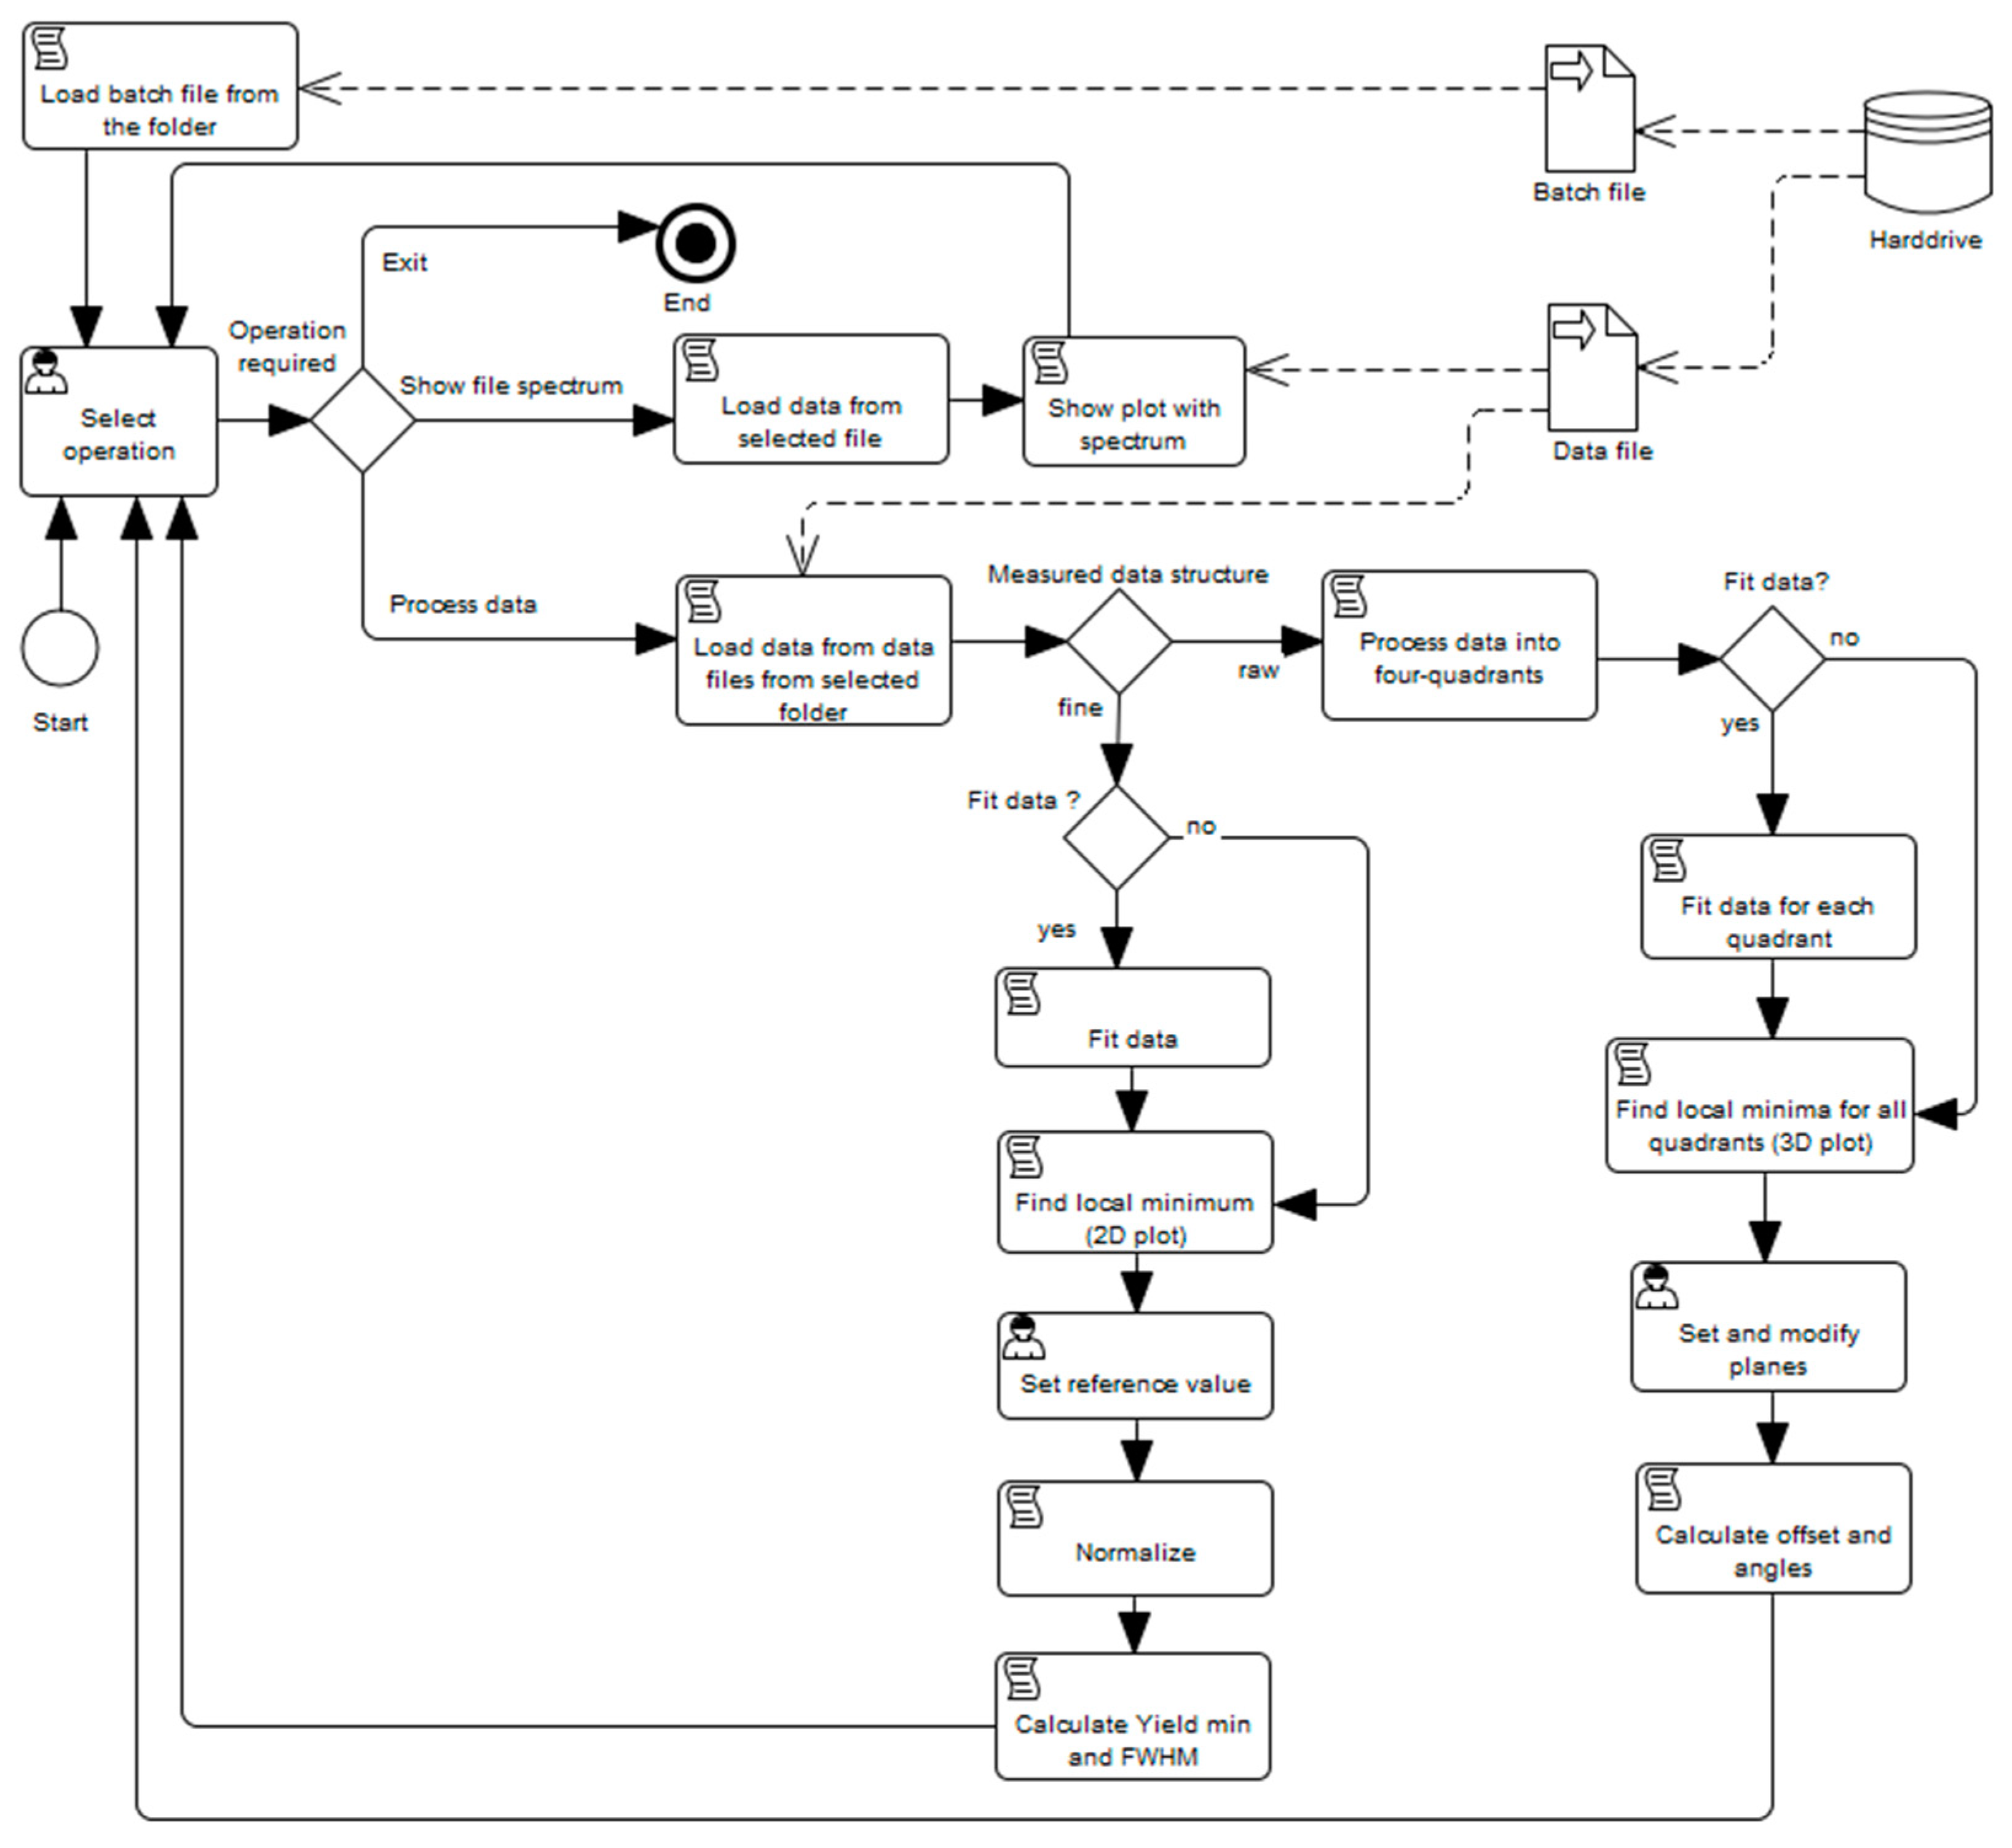
  • Data extraction from * mpa files into * dat files while data processing.
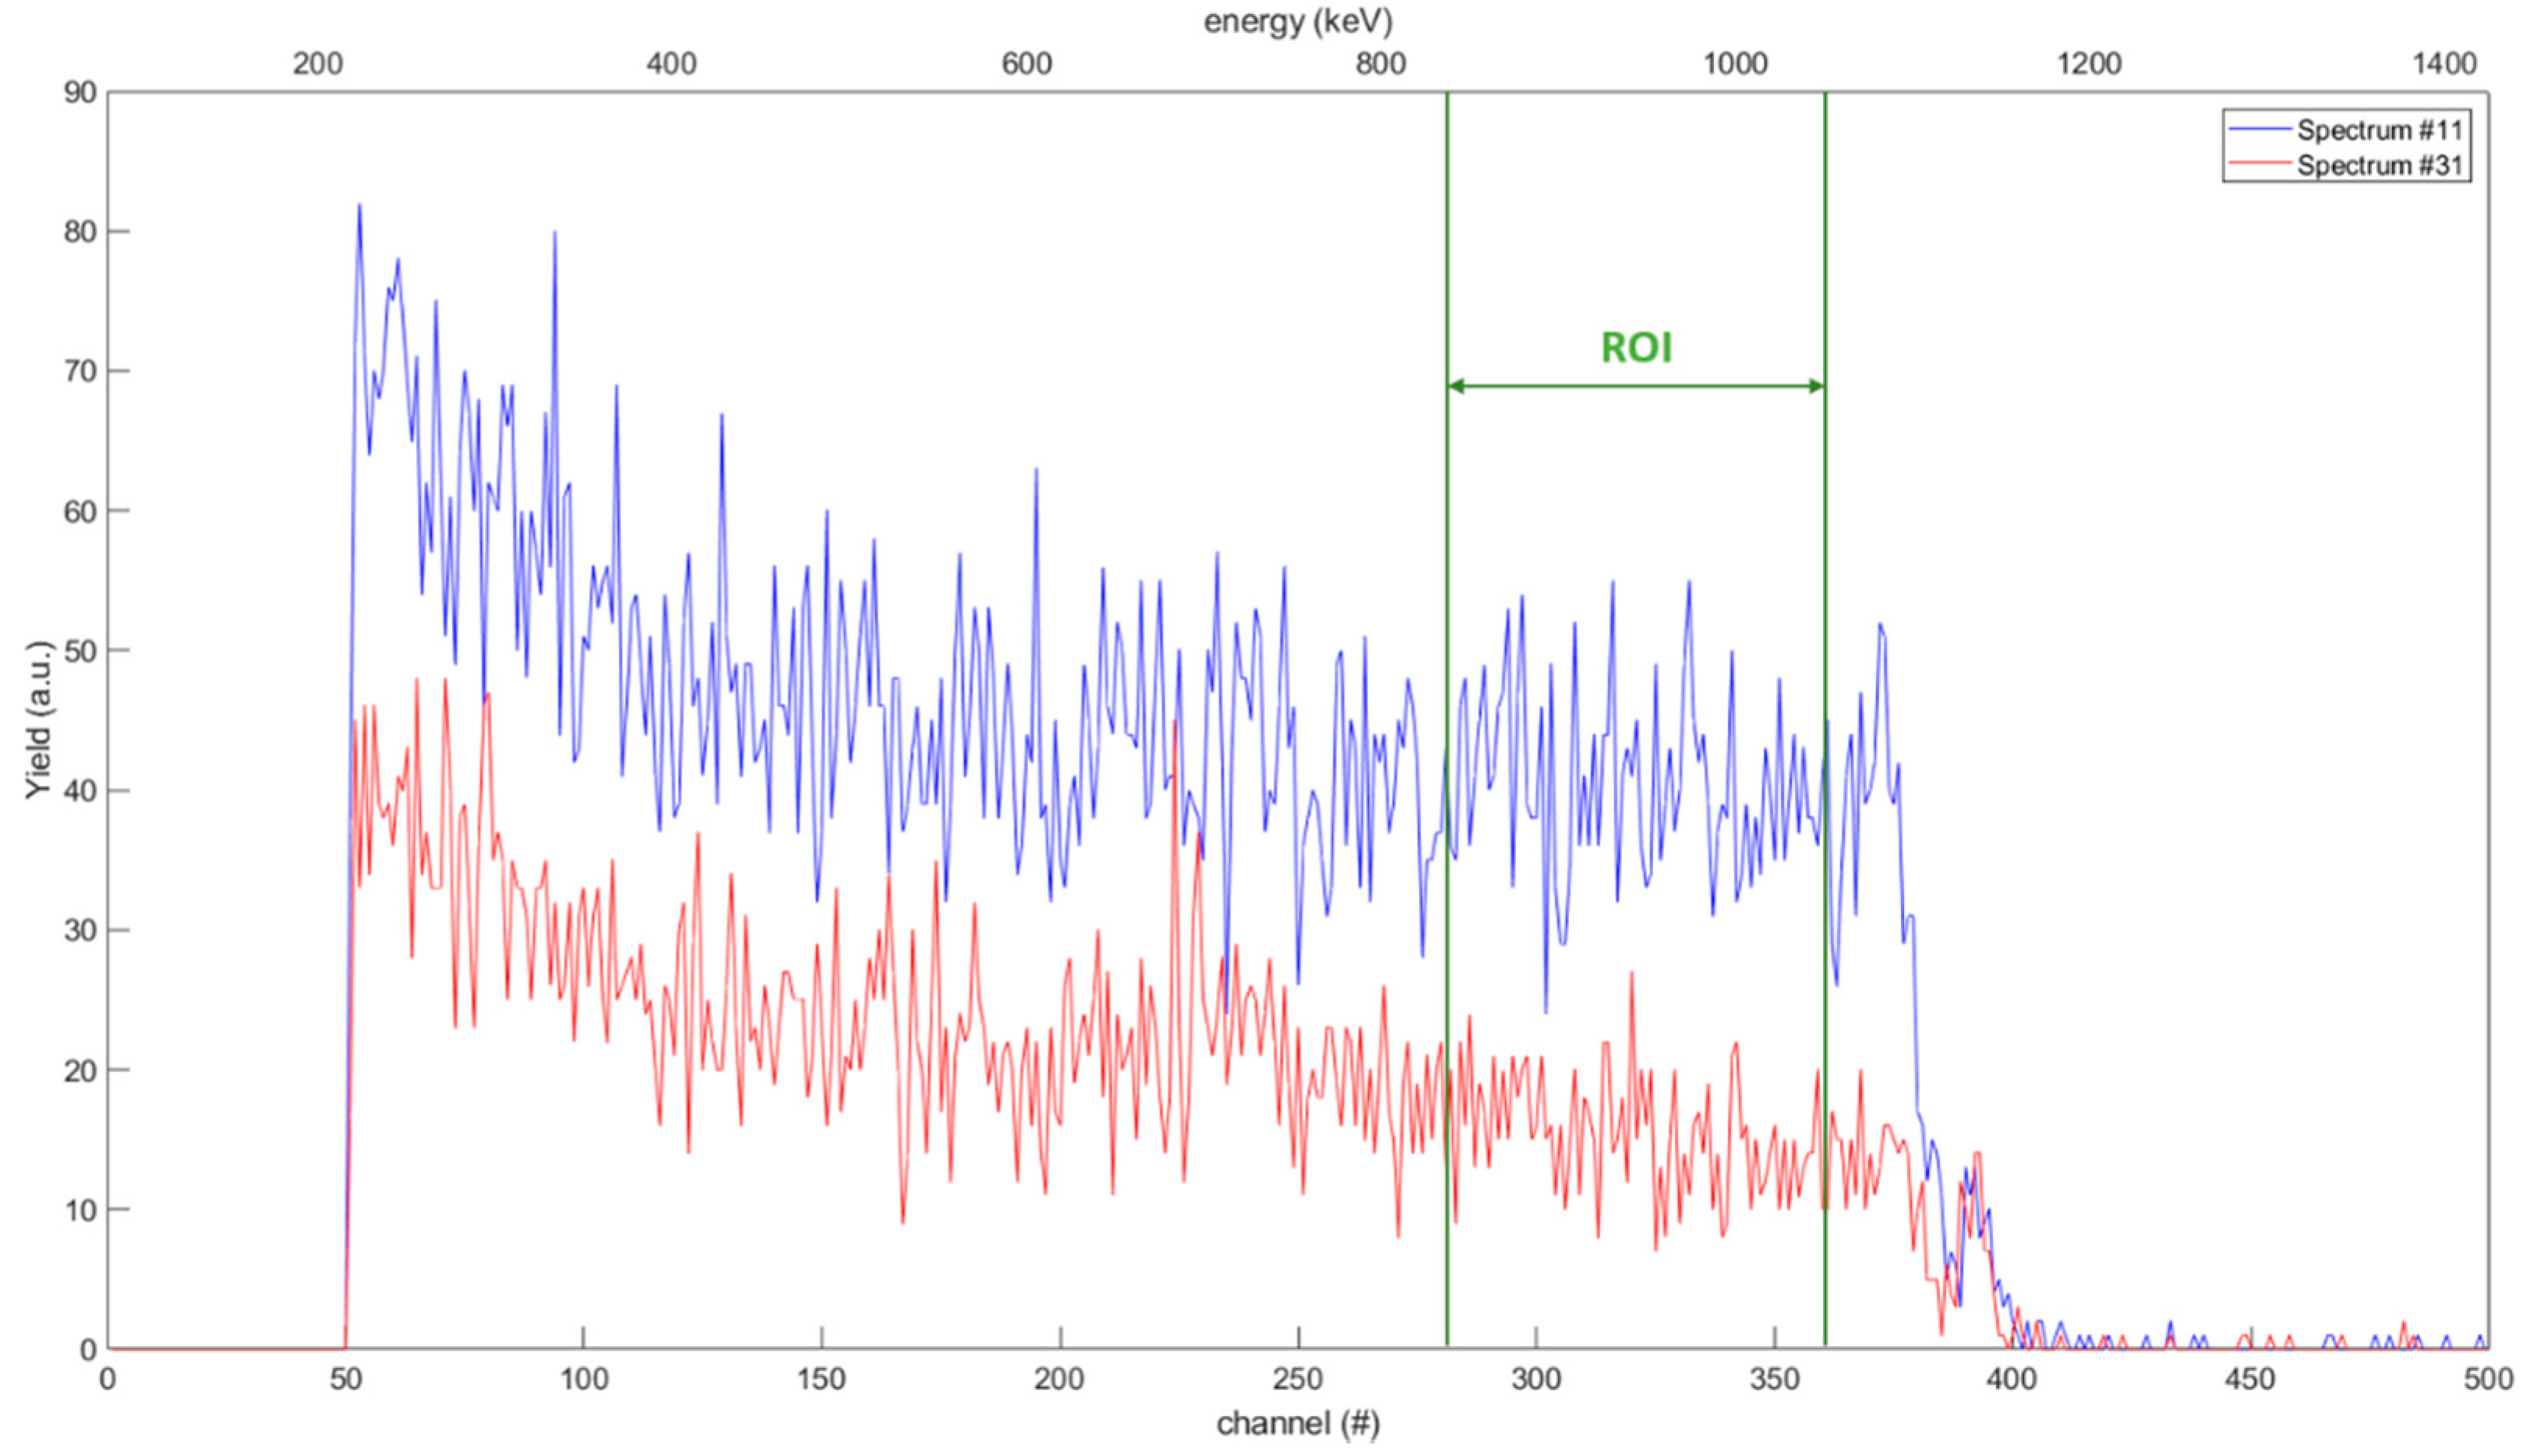
  • Setting region of interests for measured RBS spectra.
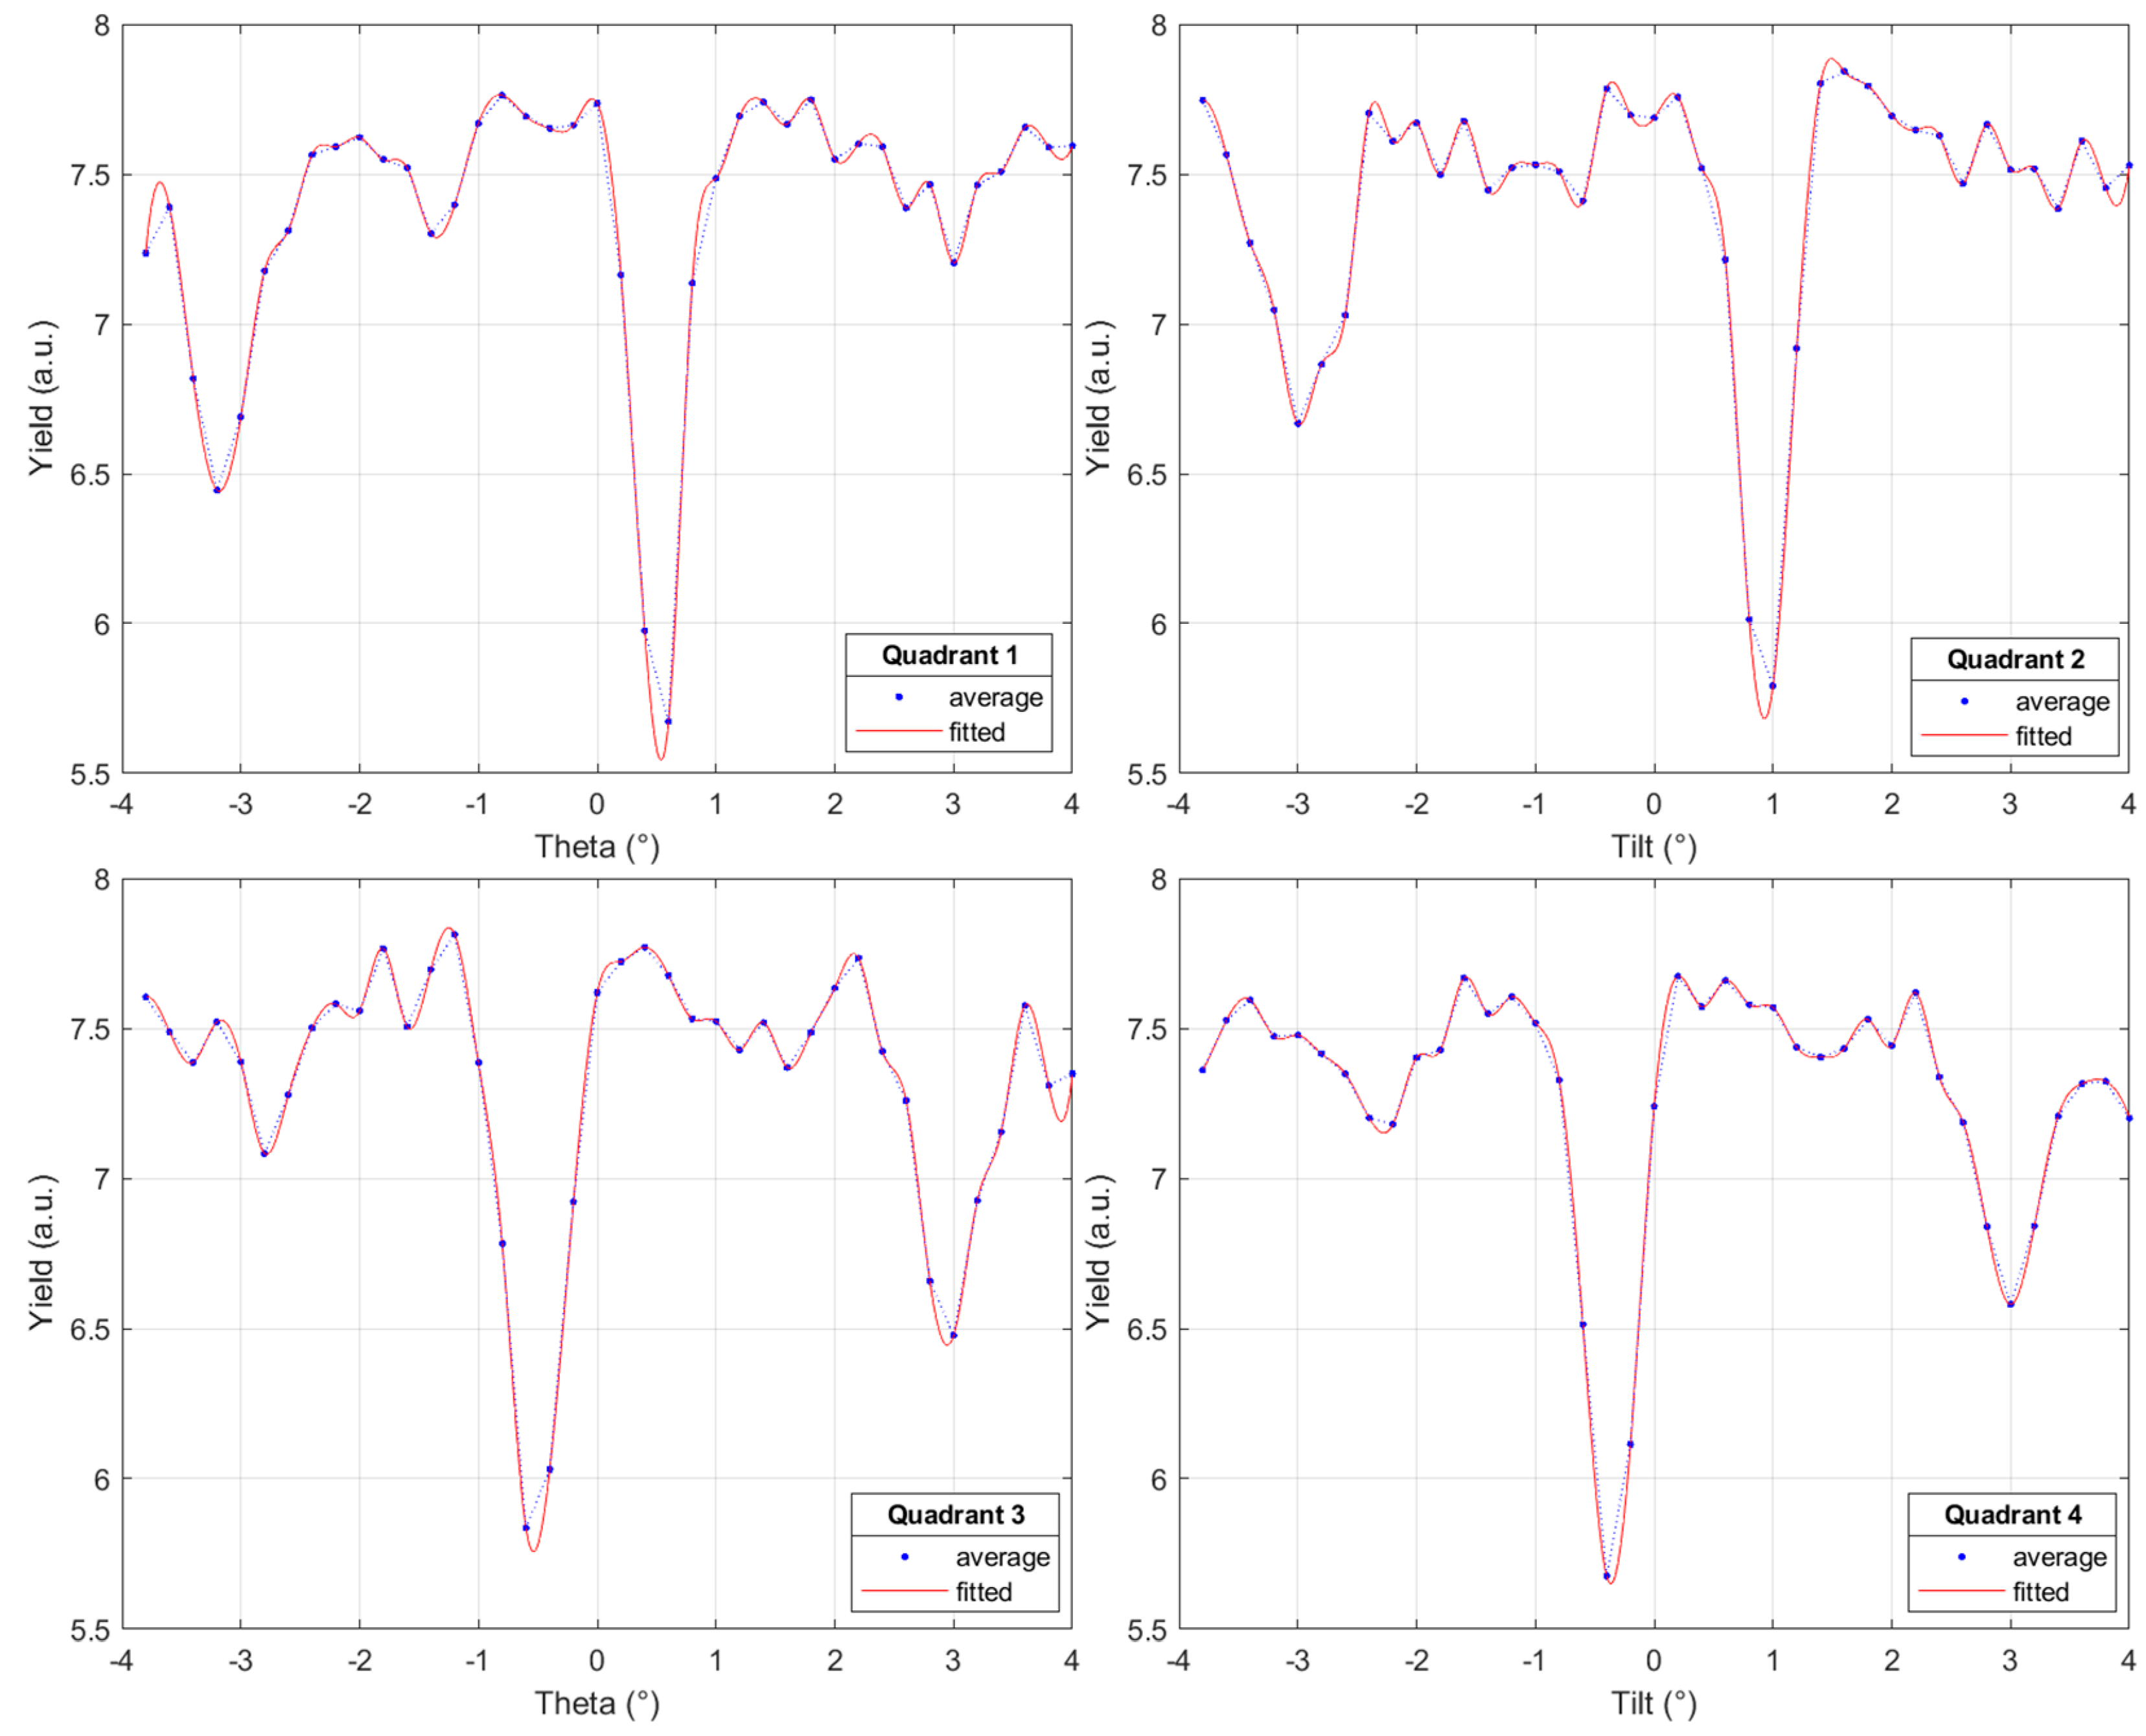
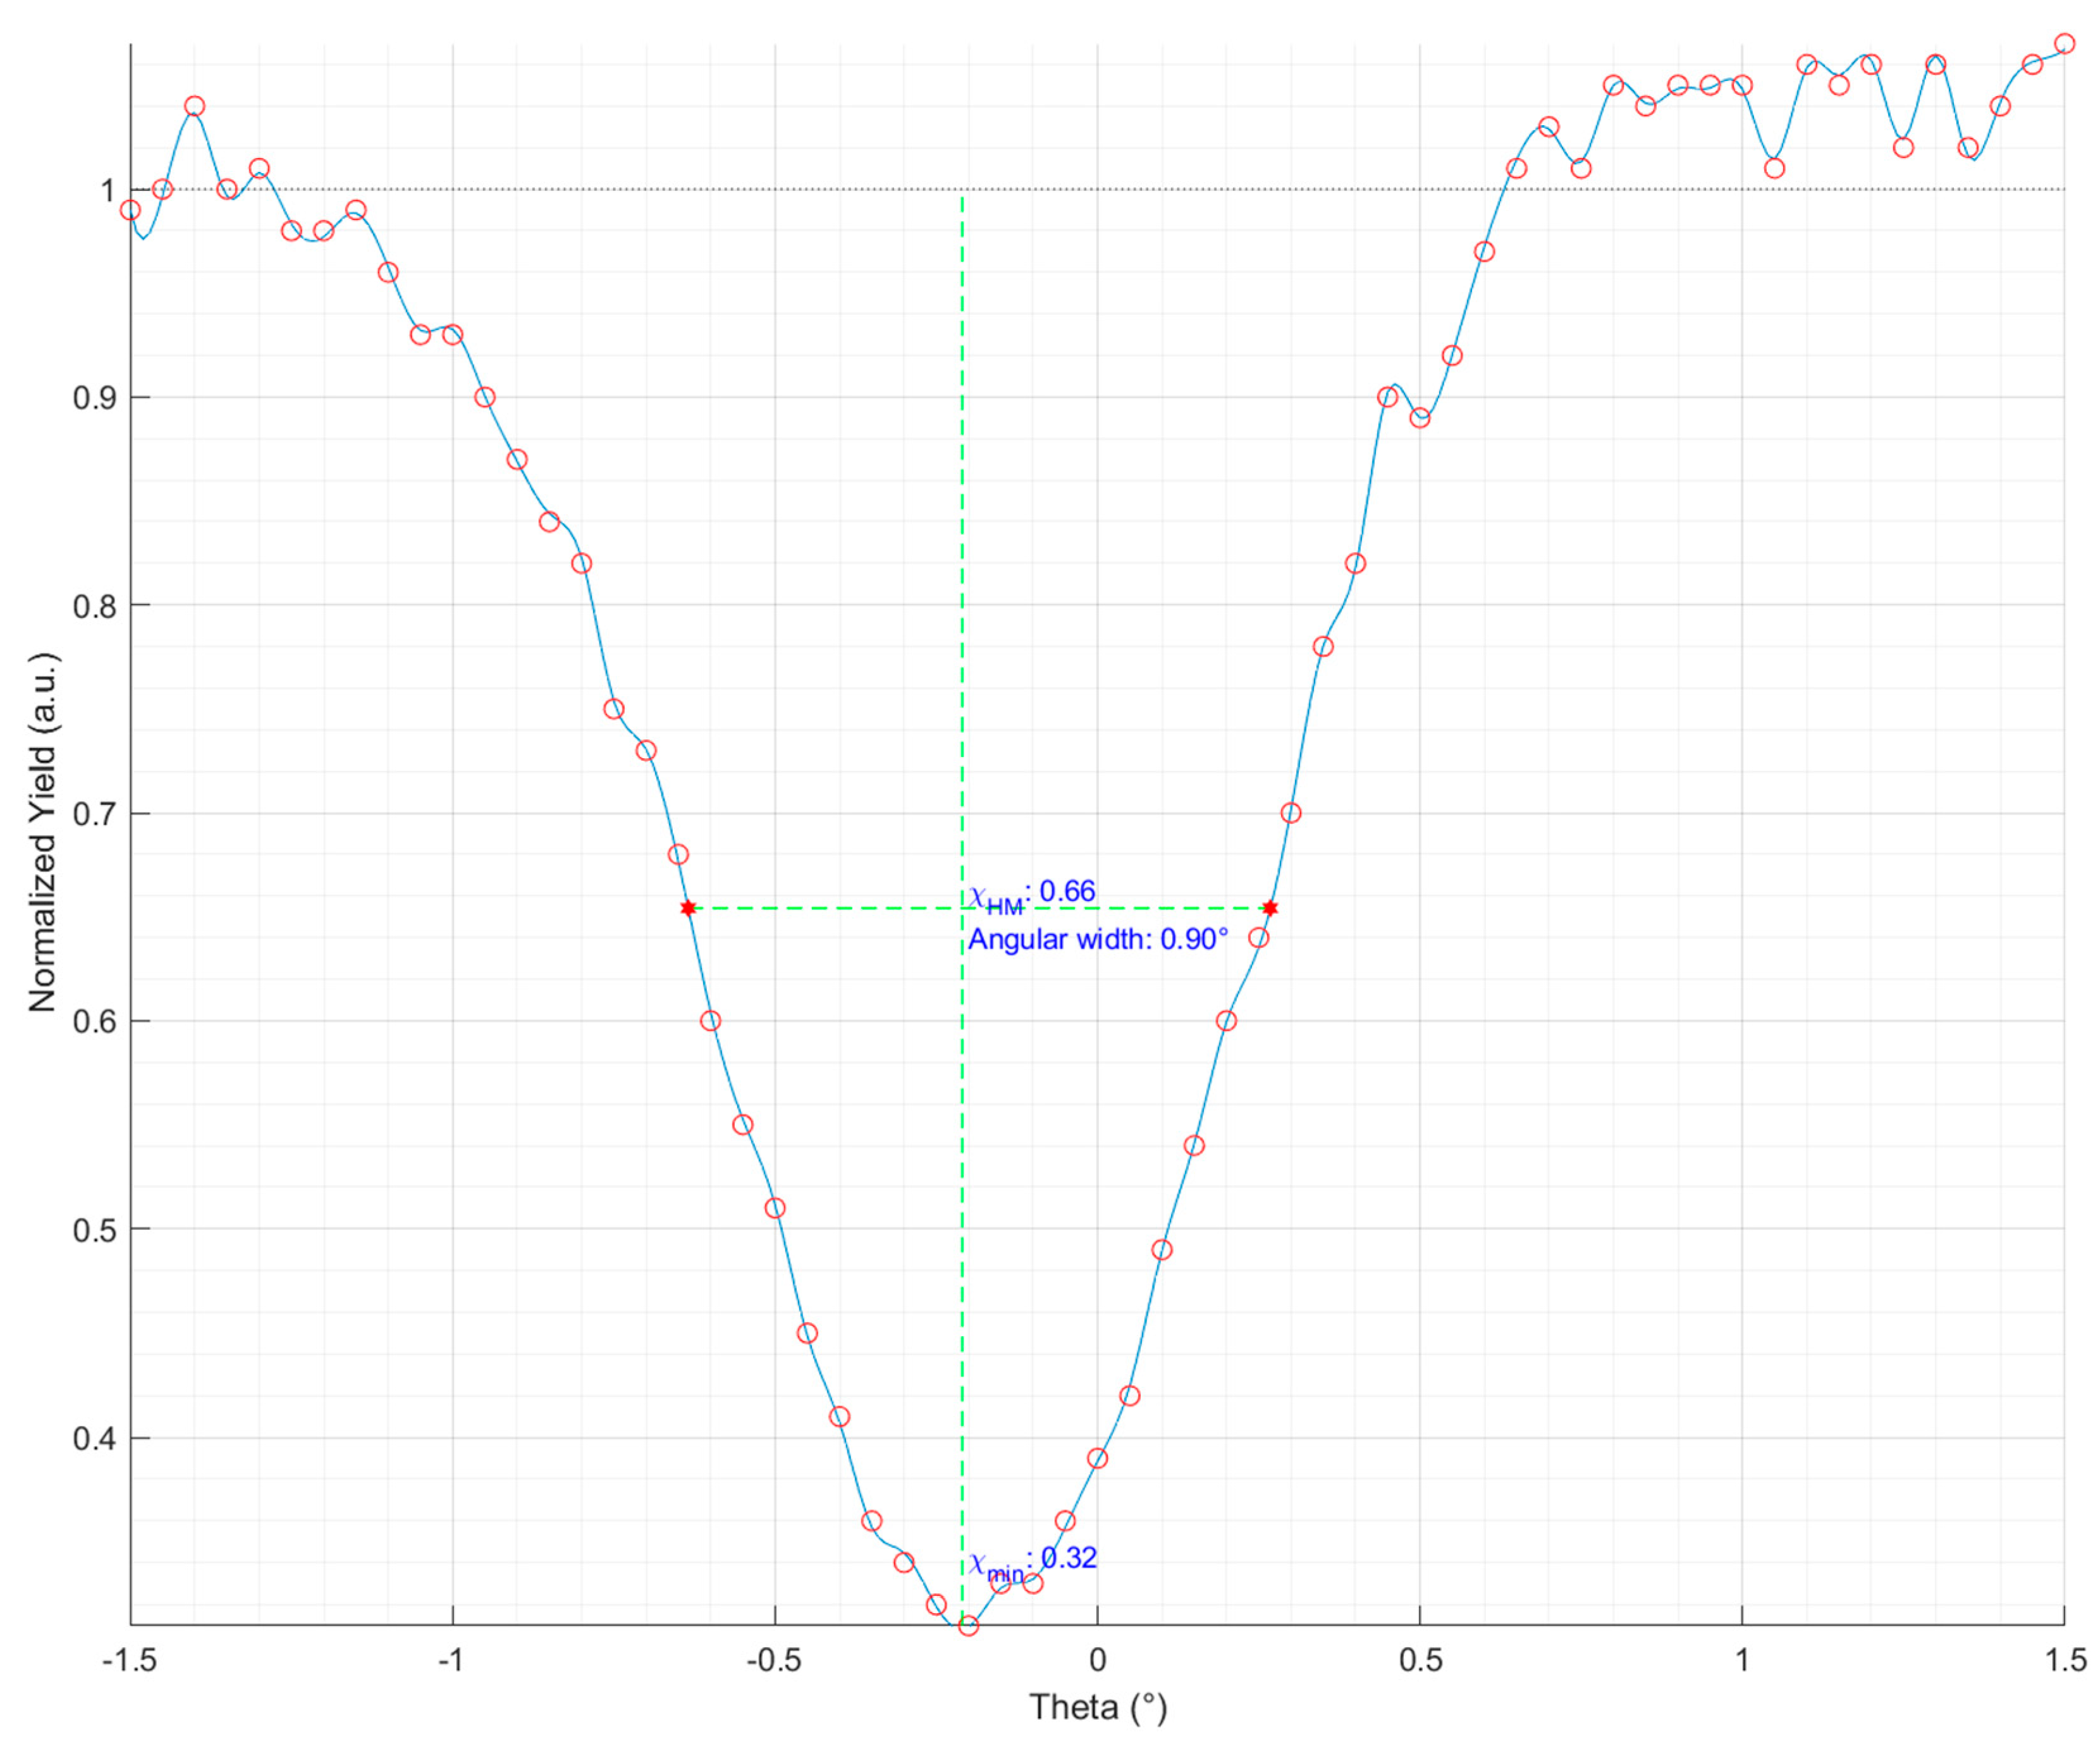
  • Fitting the data and locate minima.
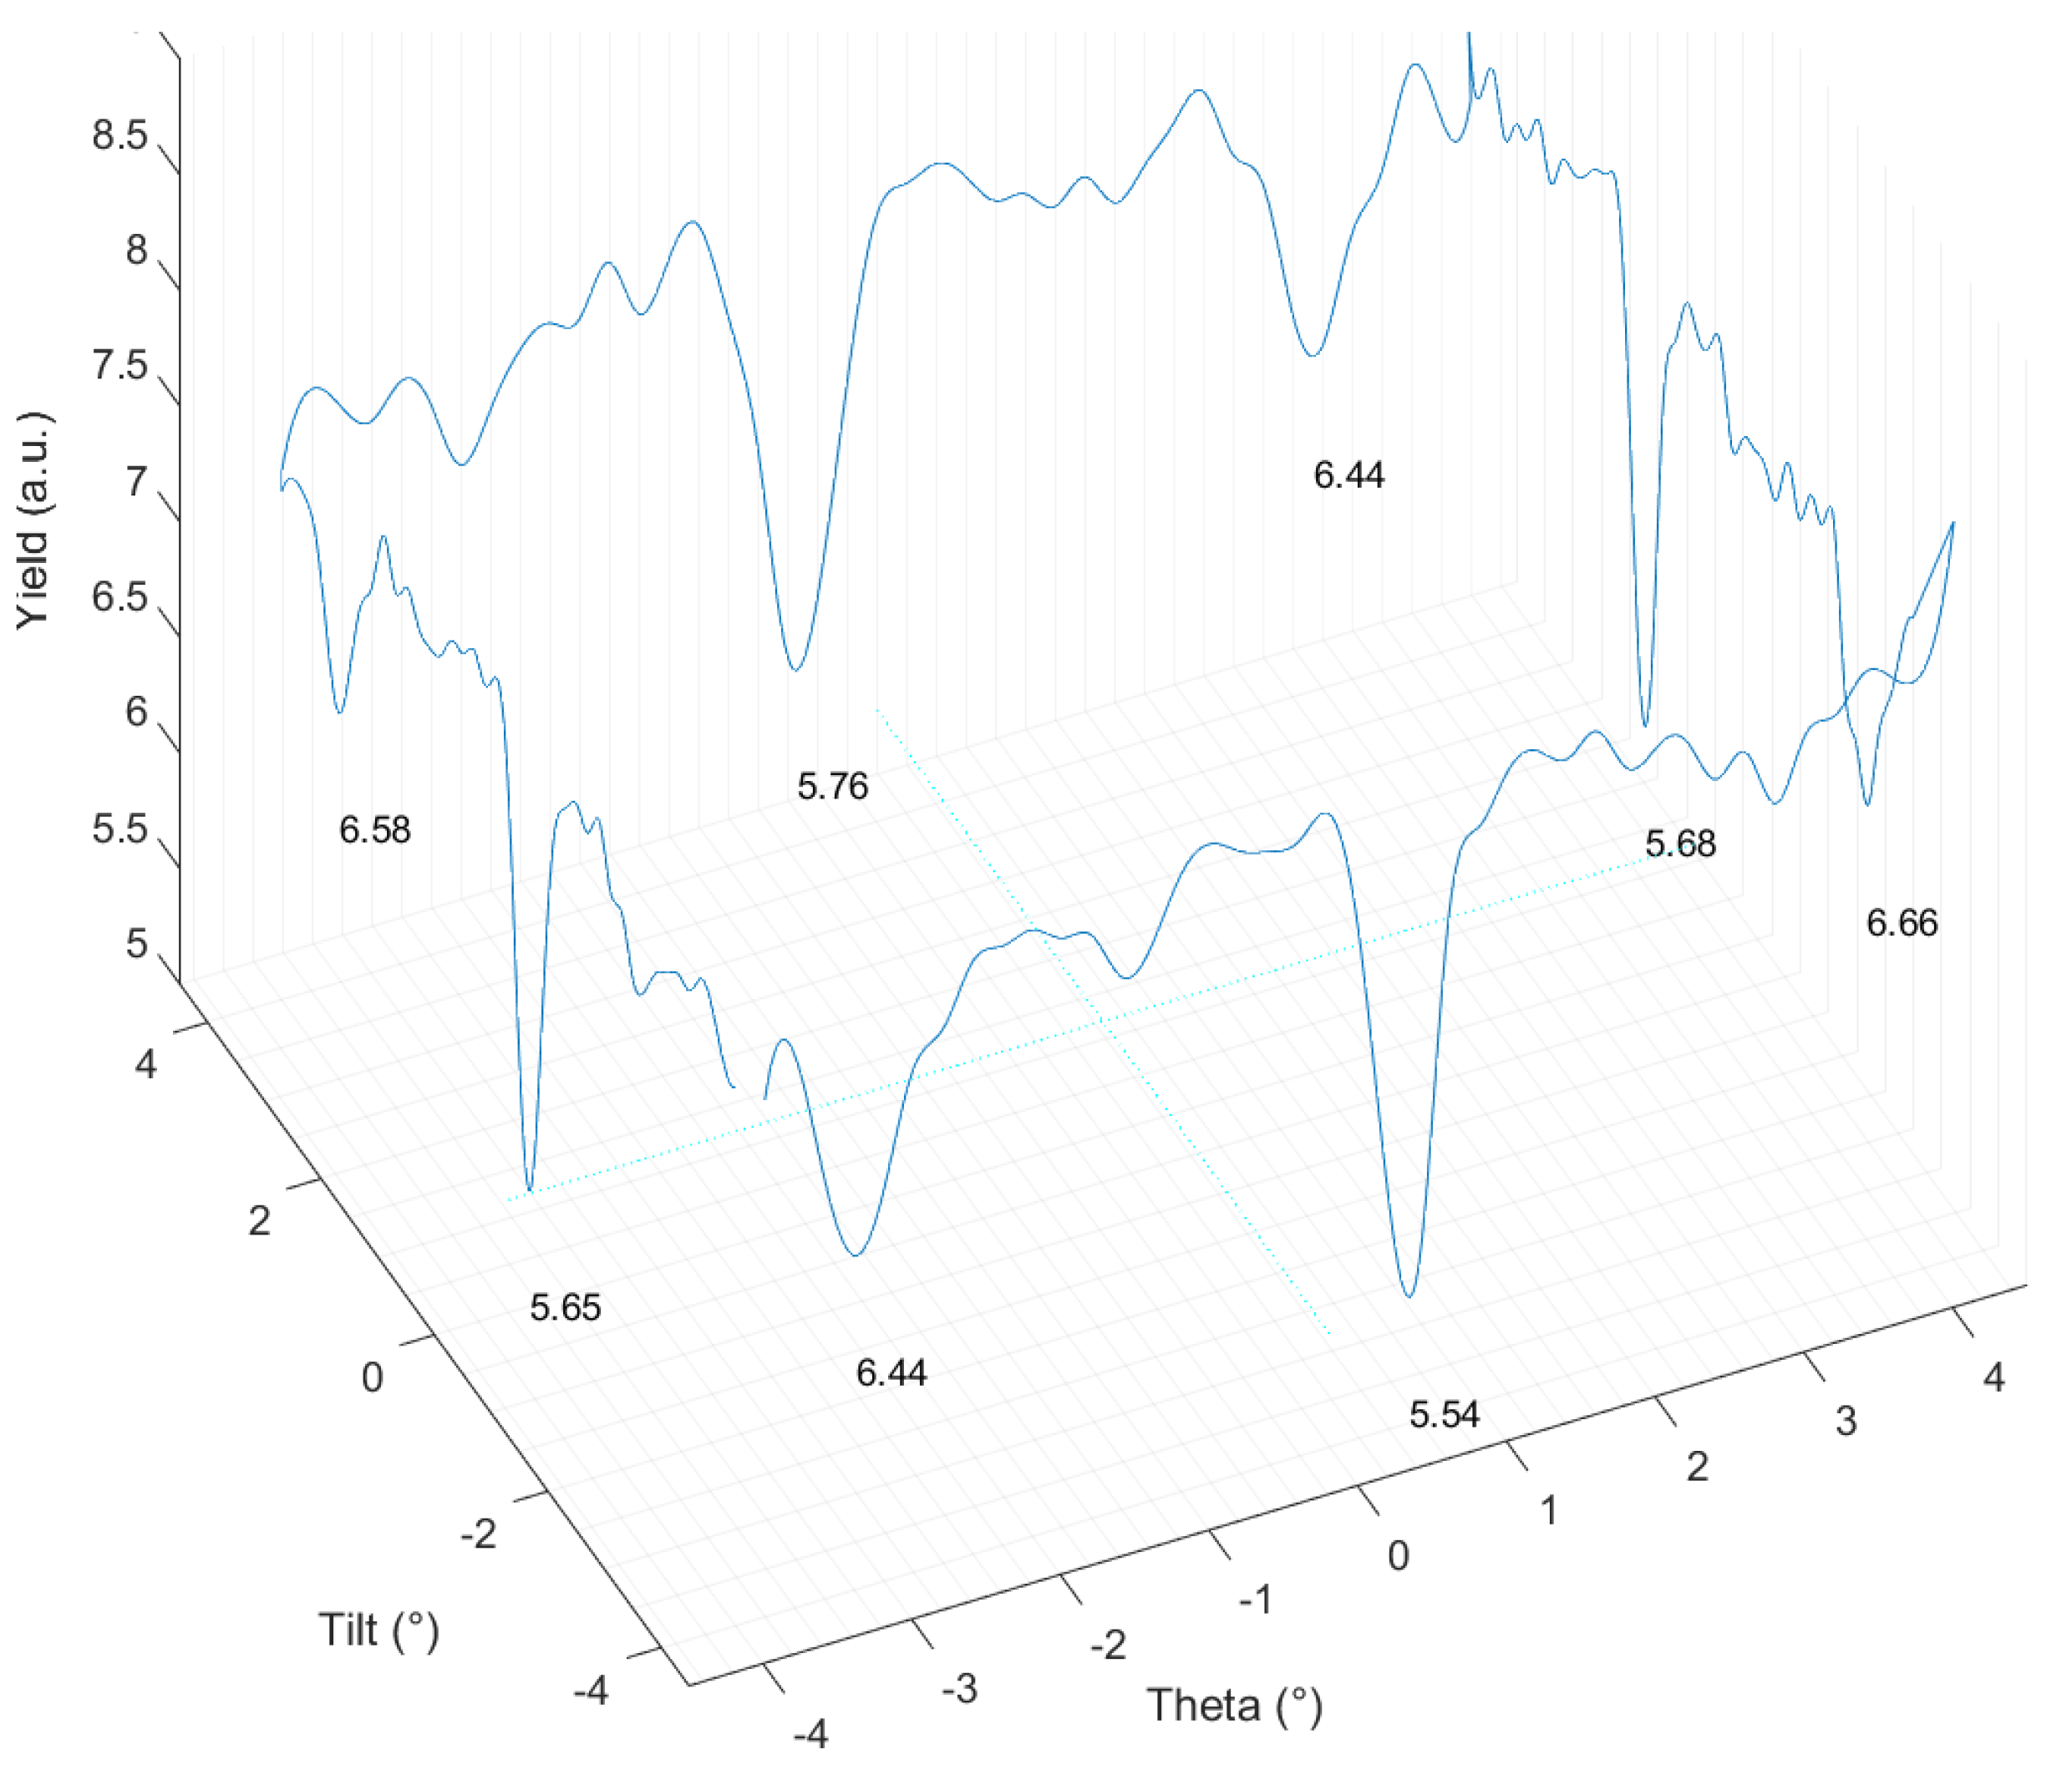
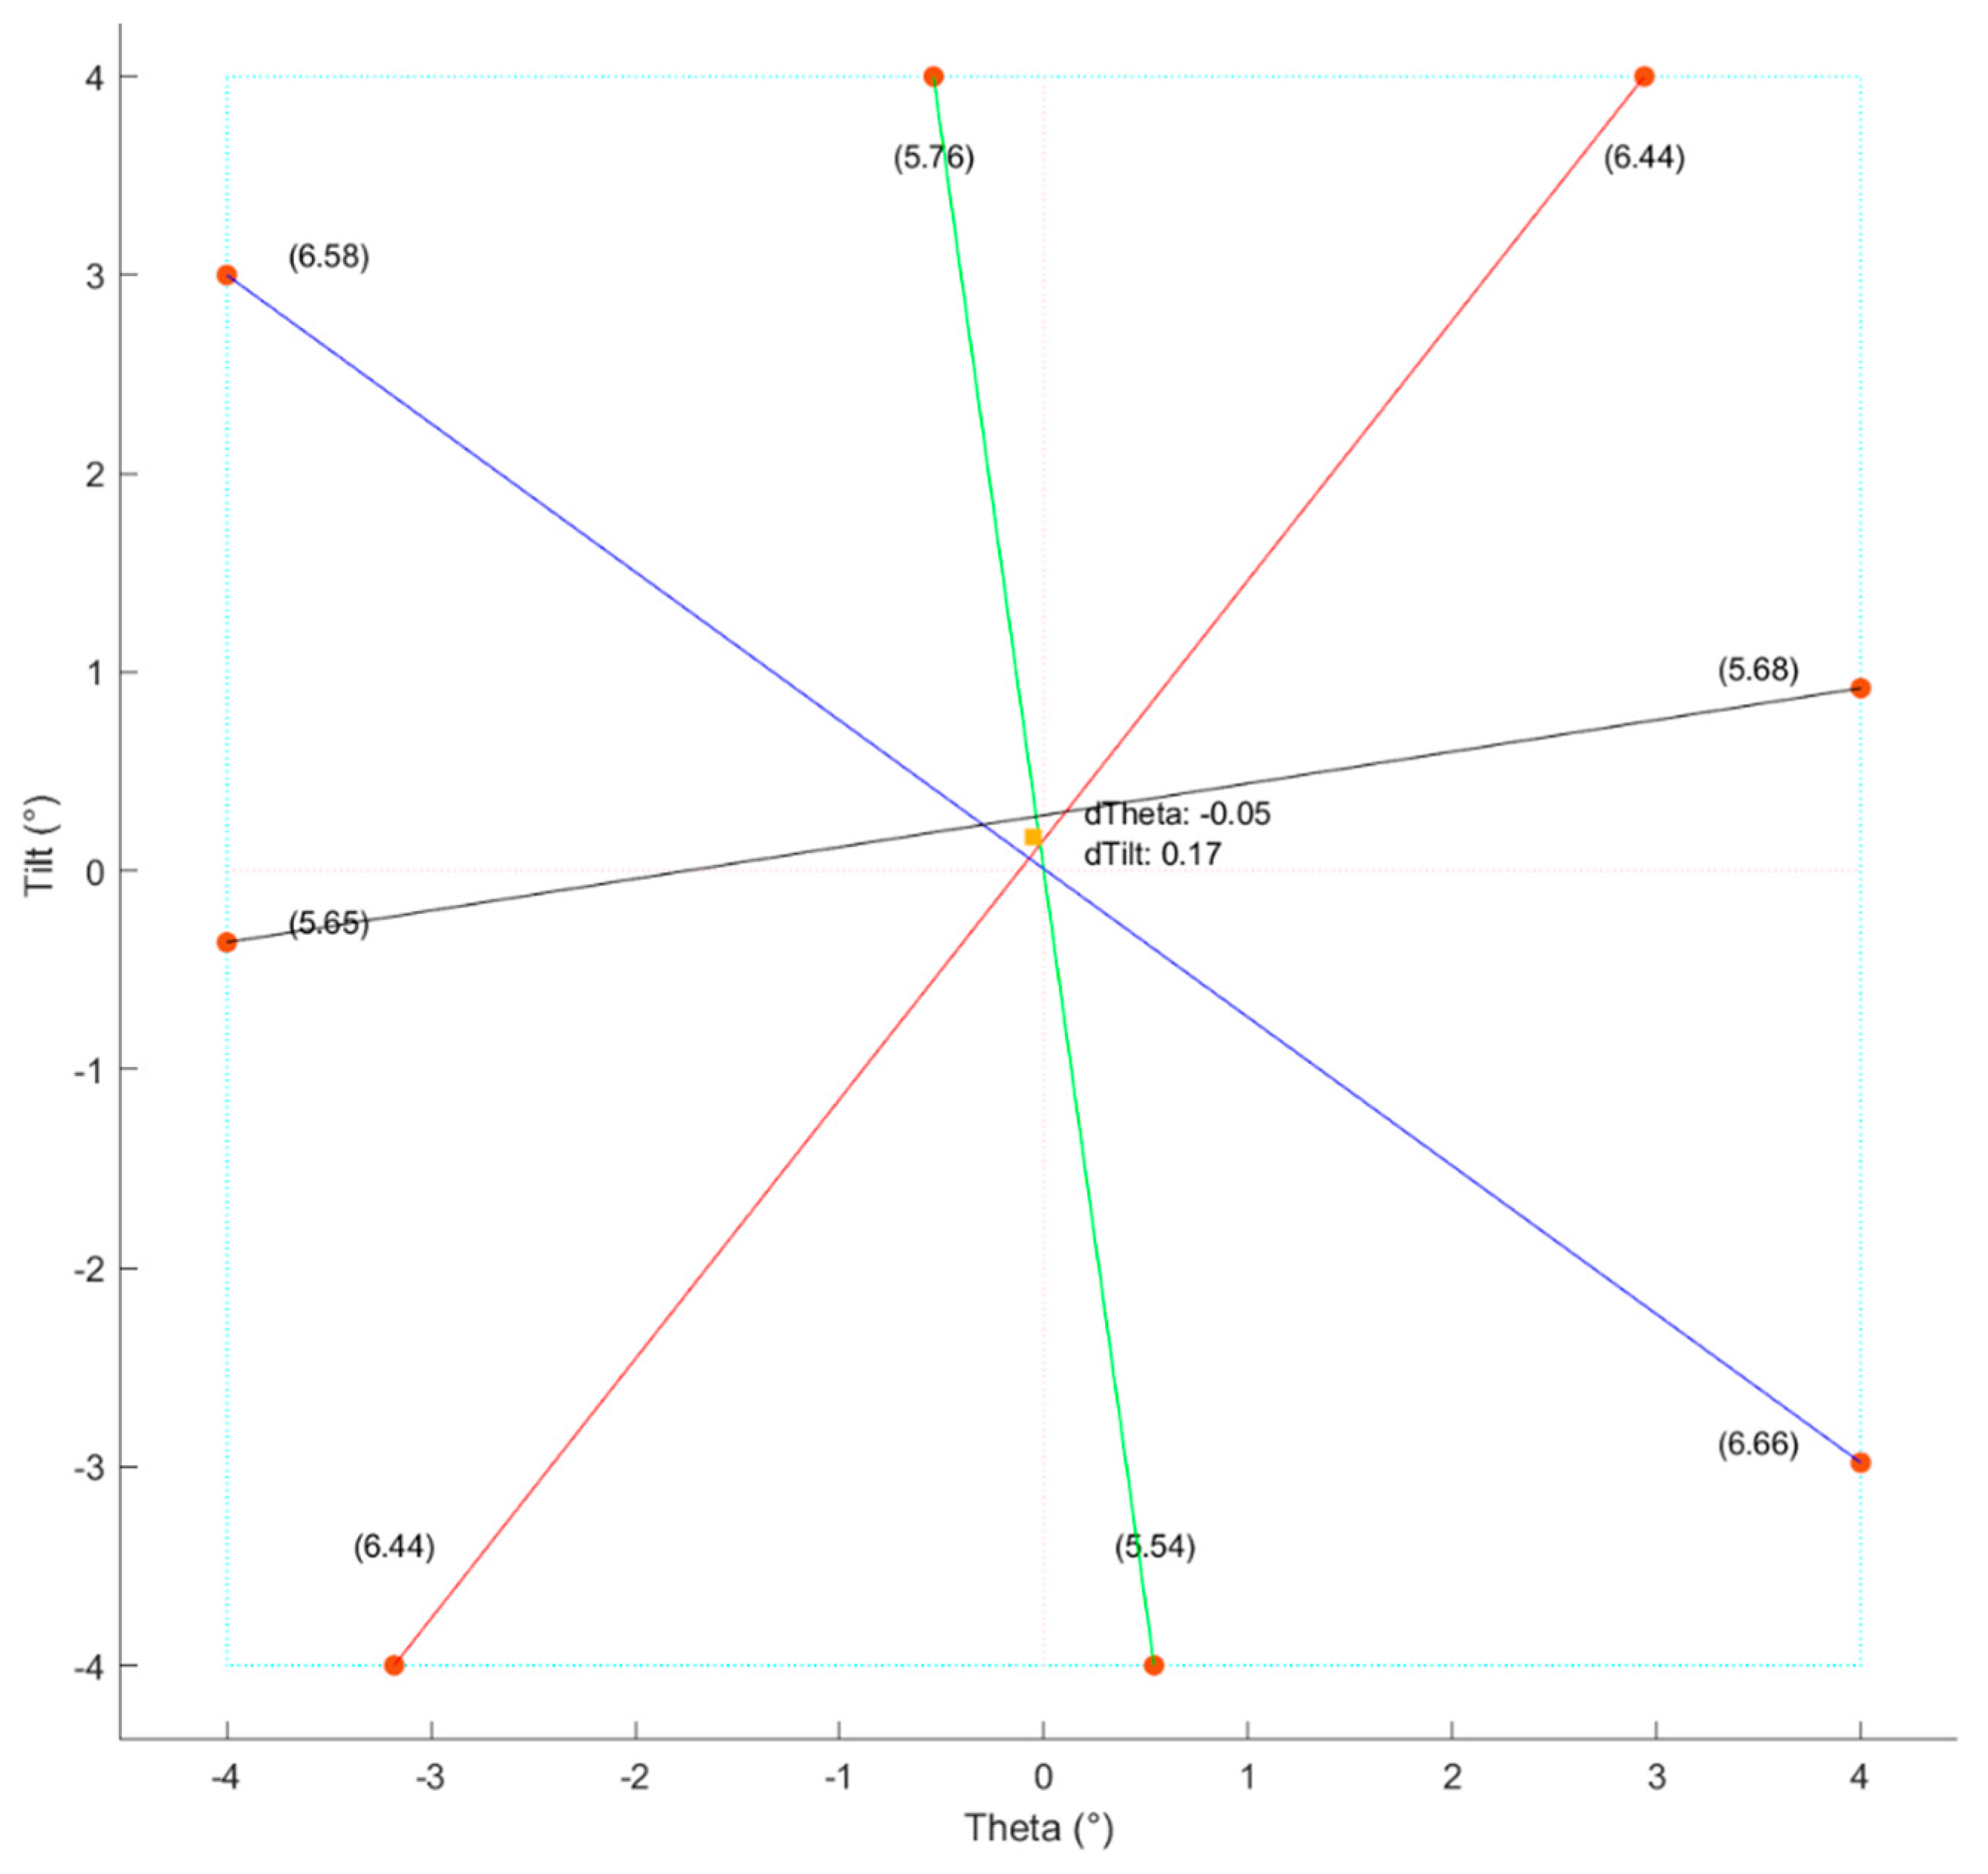
  • Determining planar axes rotation and getting coordinates of the axial axis (offset).
  • Generating control configuration (BTC files) for fine measurement.
These outputs help defining fine channeling setup and performing more precise evaluation of the channel spectra including parameters calculation and resulting interpretation (Figure 8).

3.2. RBS/C Measurement

Figure 9 shows a program algorithm for the automated RBS/C measurements with the data flows. First, generated BTC files are imported into ARGUS containing the setting of the goniometer’s step displacements or ion beam parameters. It is followed by the coarse or fine measuring itself enabled through MPANT software as subroutine triggered by ARGUS. Acquired data has to be extracted from the files and separately stored into different types of data files to be processed by our MATLAB application as the inputs for coarse or fine analysis and evaluation.

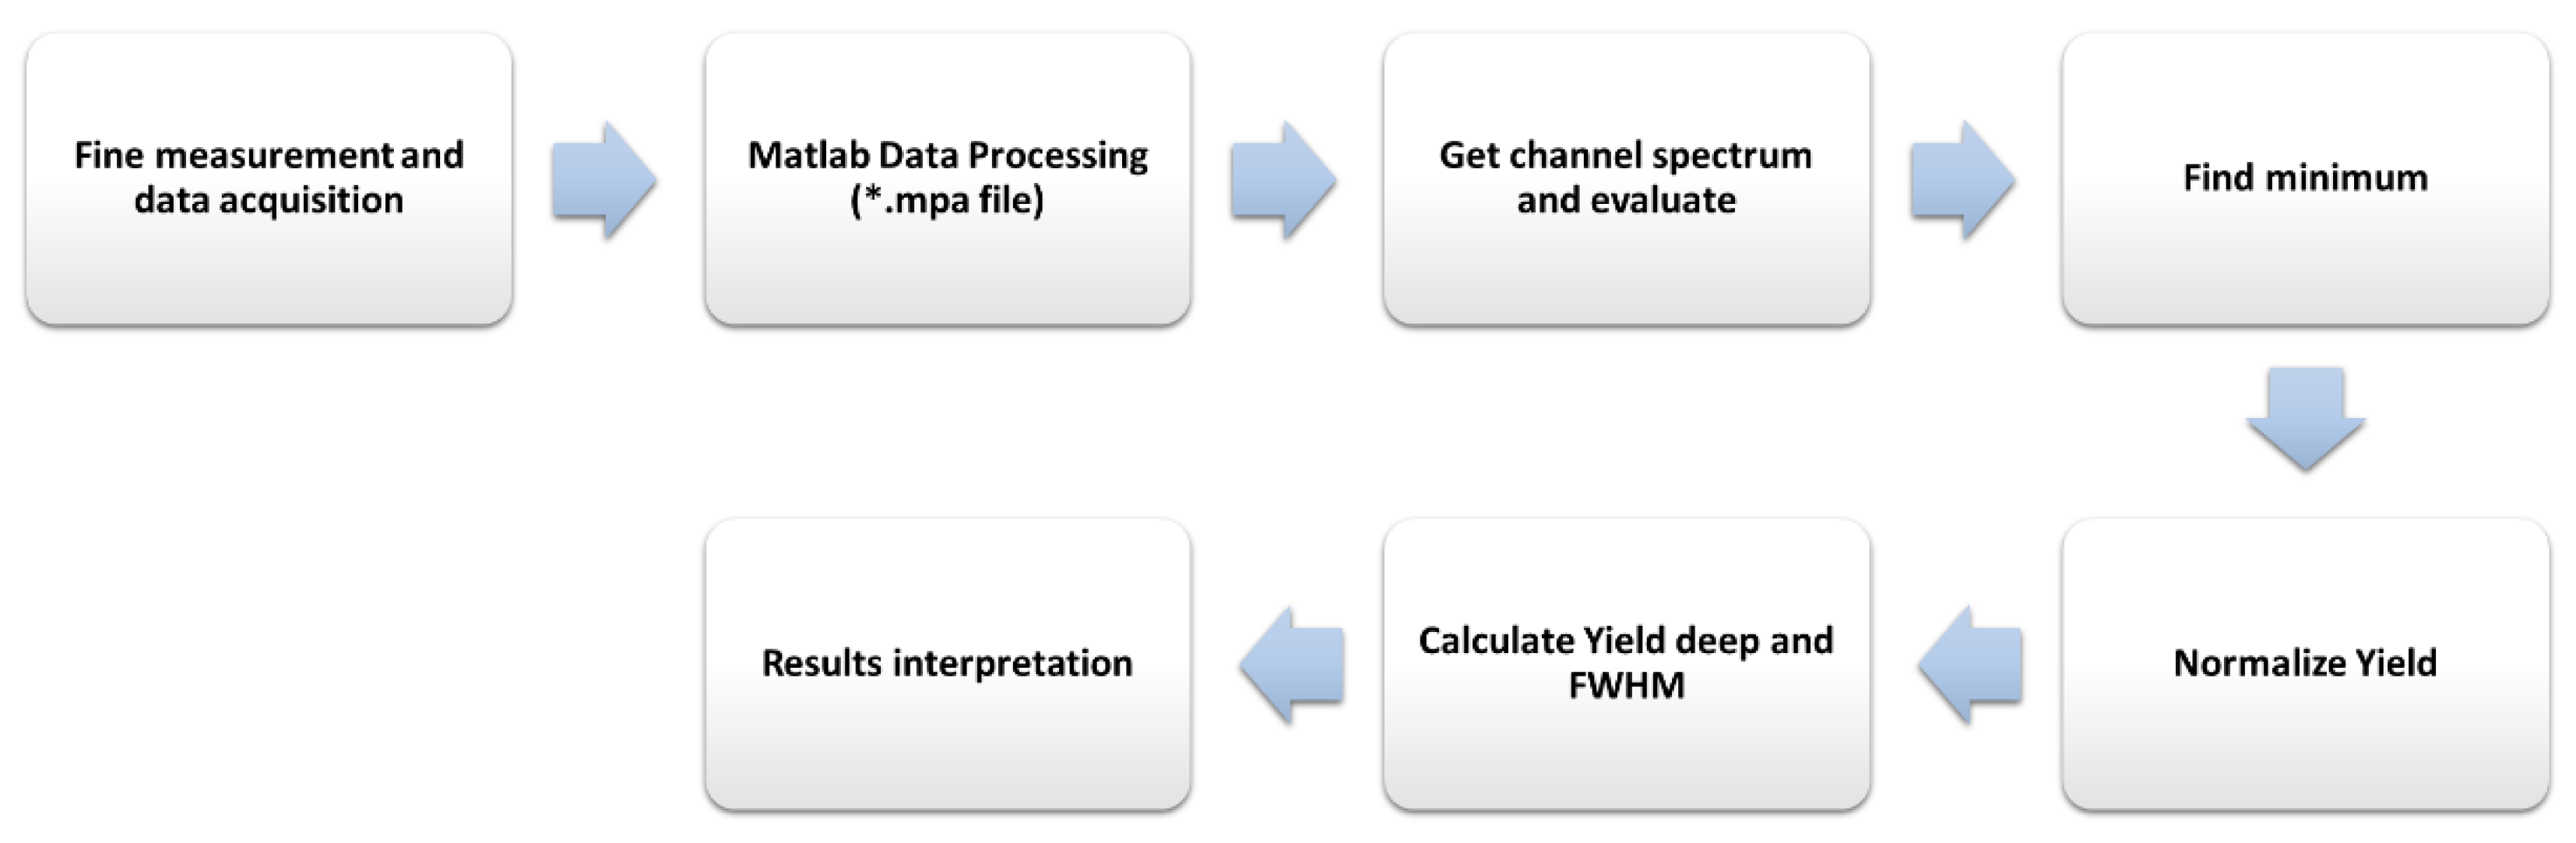
3.3. Coarse and Fine Evaluation

Since the acquired data are processed in the application, coarse or fine RBS/C evaluation modes of algorithm (Figure 10) are reflecting the measurement procedure (Section 2.1) and with regard to the main goals—to set a straightforward way for efficient channeling spectra analysis and evaluation. The researcher can choose to observe the particular spectrum or begin the evaluation from the measured files/spectra with the several tools and features e.g., fit the data to locate precisely the minima or minima 3D viewer for better intersections calculation, automatic calculations of complementary or primary results like the offsets calculations, determination of FWHM etc.

3.4. Implemented Features for Automated Measurement and Analysis

Several functions and tools have to be implemented to perform all steps of sample measurements and analysis for proper and faster RBS/C evaluation as designed and requested by the researchers.

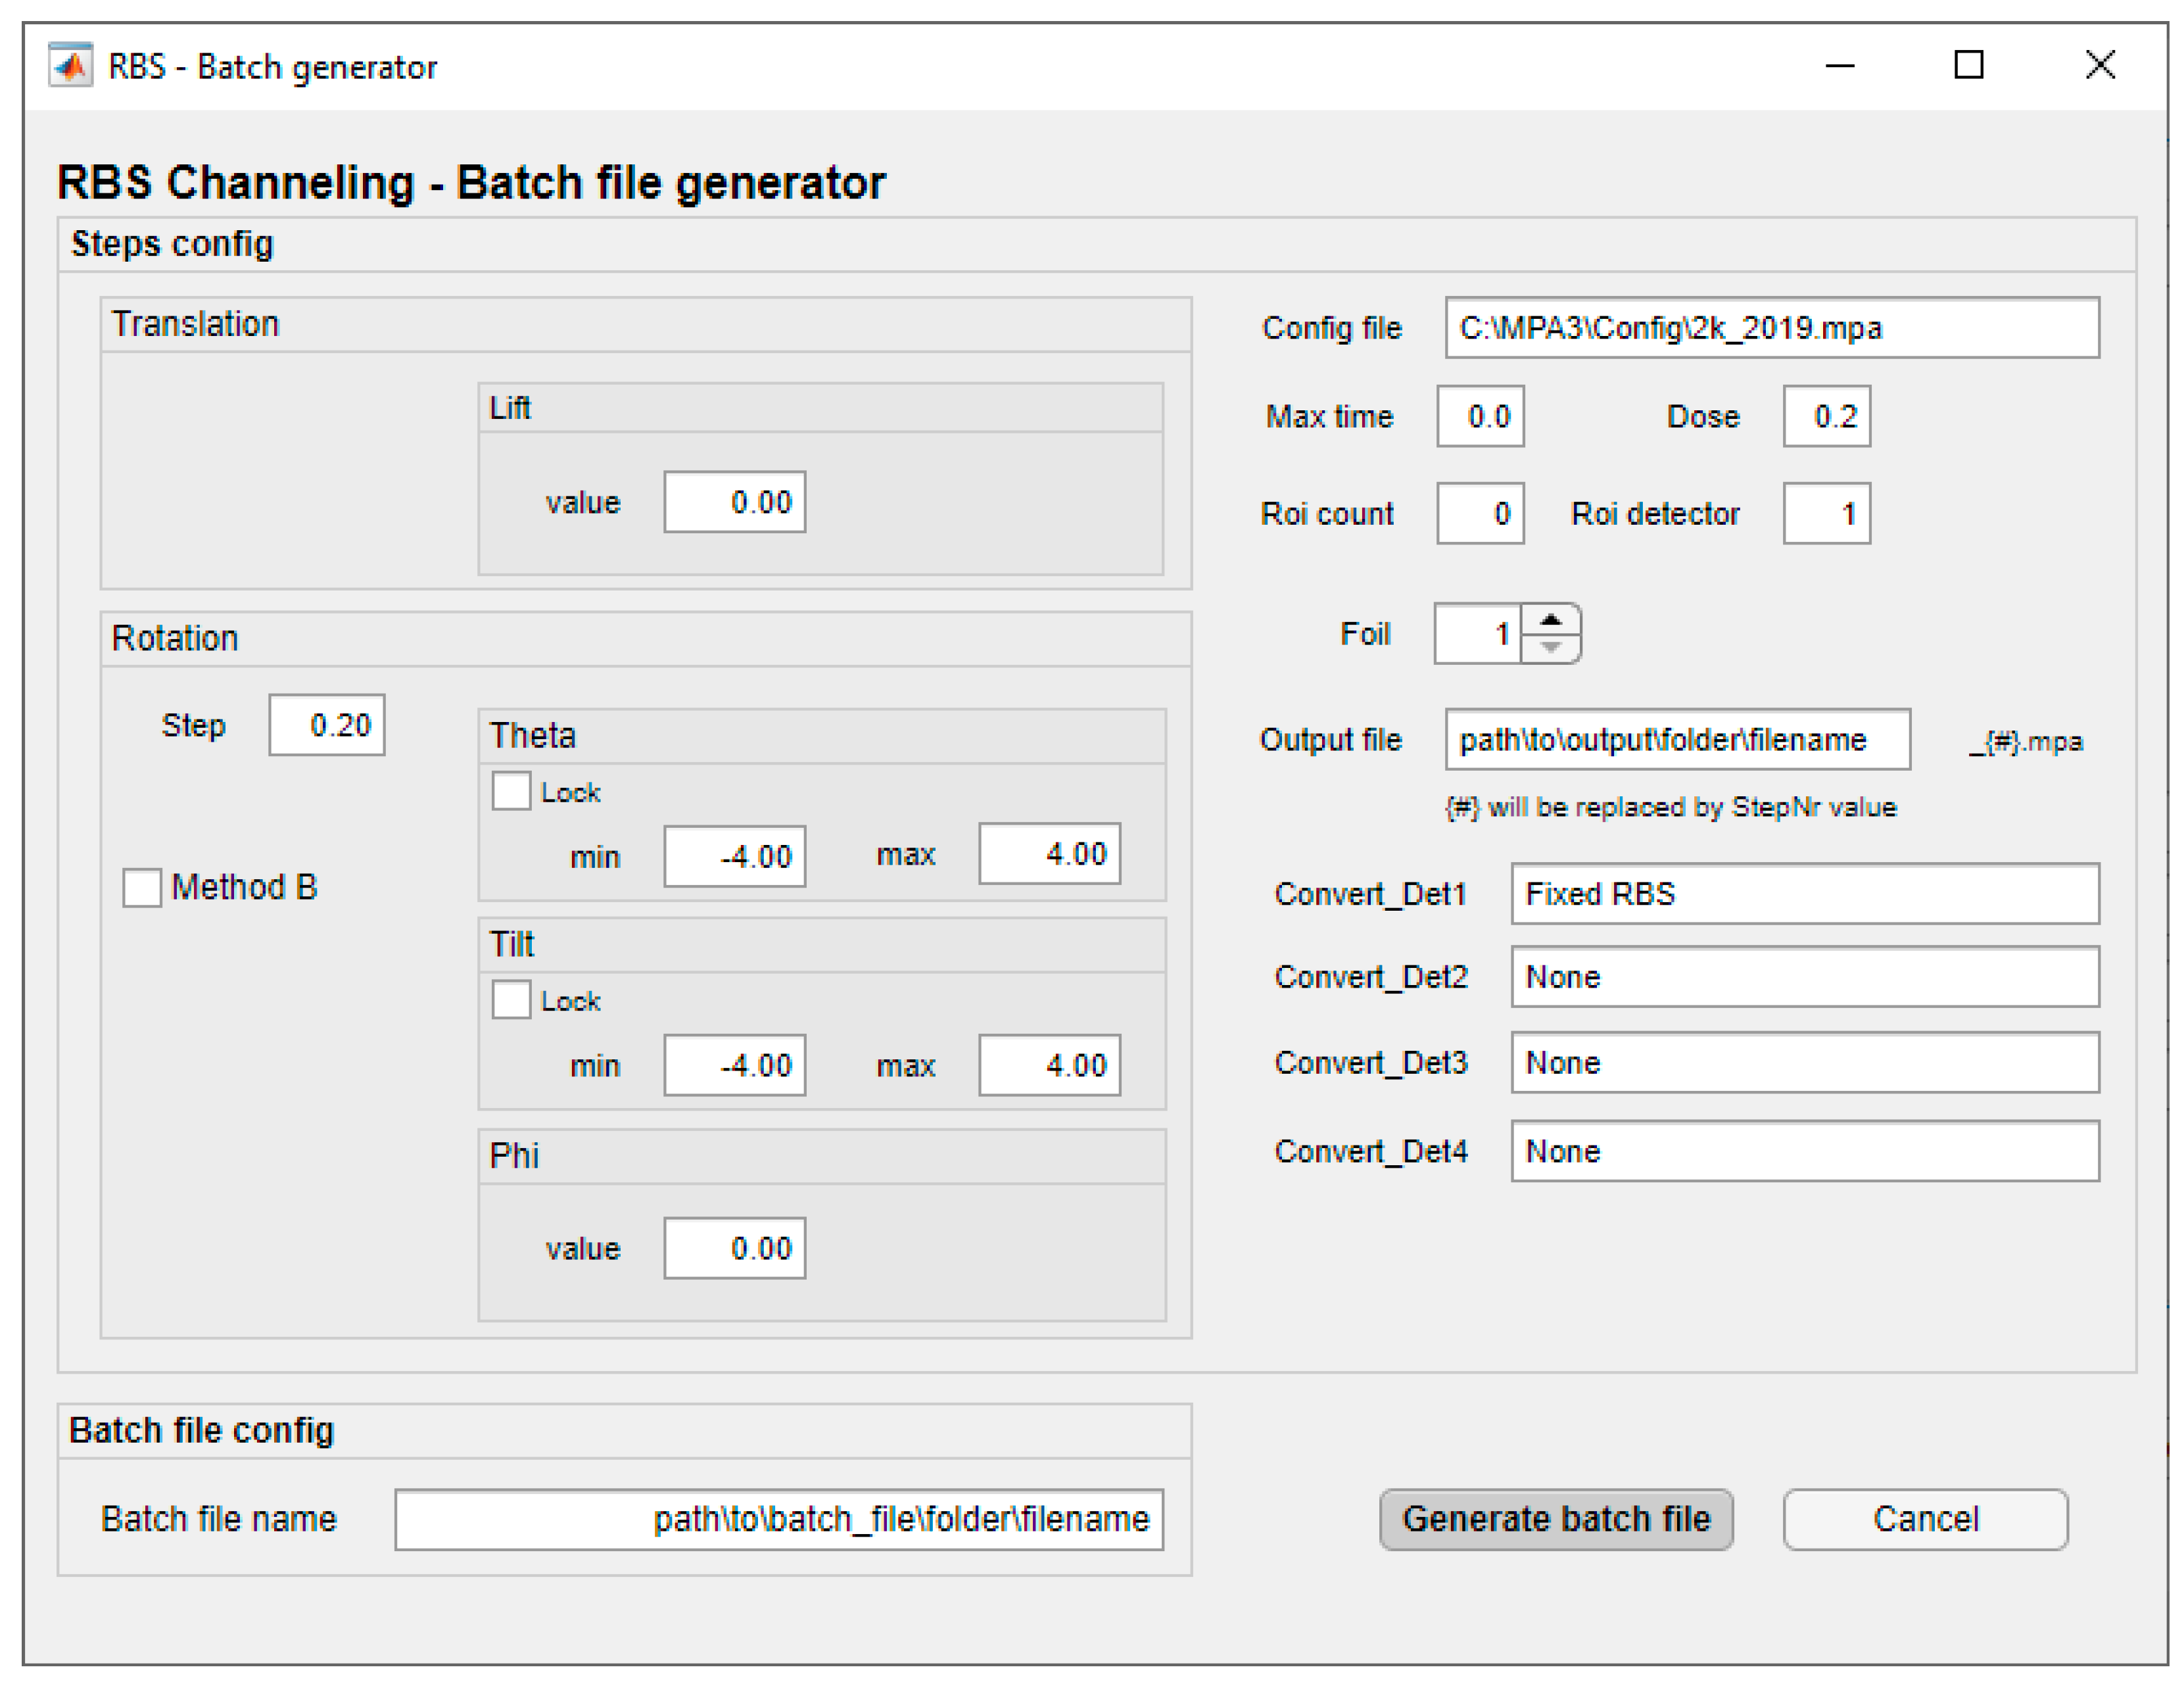
3.4.1. Batch File Generator (BFG)

Generating a batch file makes process workflow more effective due to hundreds of steps processed in a very short time. The operator can define parameters e.g., Theta and Tilt angles (horizontal and vertical) or a step size. The application generates all positions according to the selected mode and saves them into the batch file imported into Argus. BFG generates steps with constant values of steps parameters and define variable values for: StepNr, ThetaPos, TiltPos, OutputFile (Figure 11), where StepNr is a unique value identifying step, ThetaPos horizontal angle and TiltPos vertical angle. The output file contains measured data for every single step and is generated during a measurement. The batch file is used for measurement as well as analysis.
There are two alternatives implemented for steps generation (Figure 12):
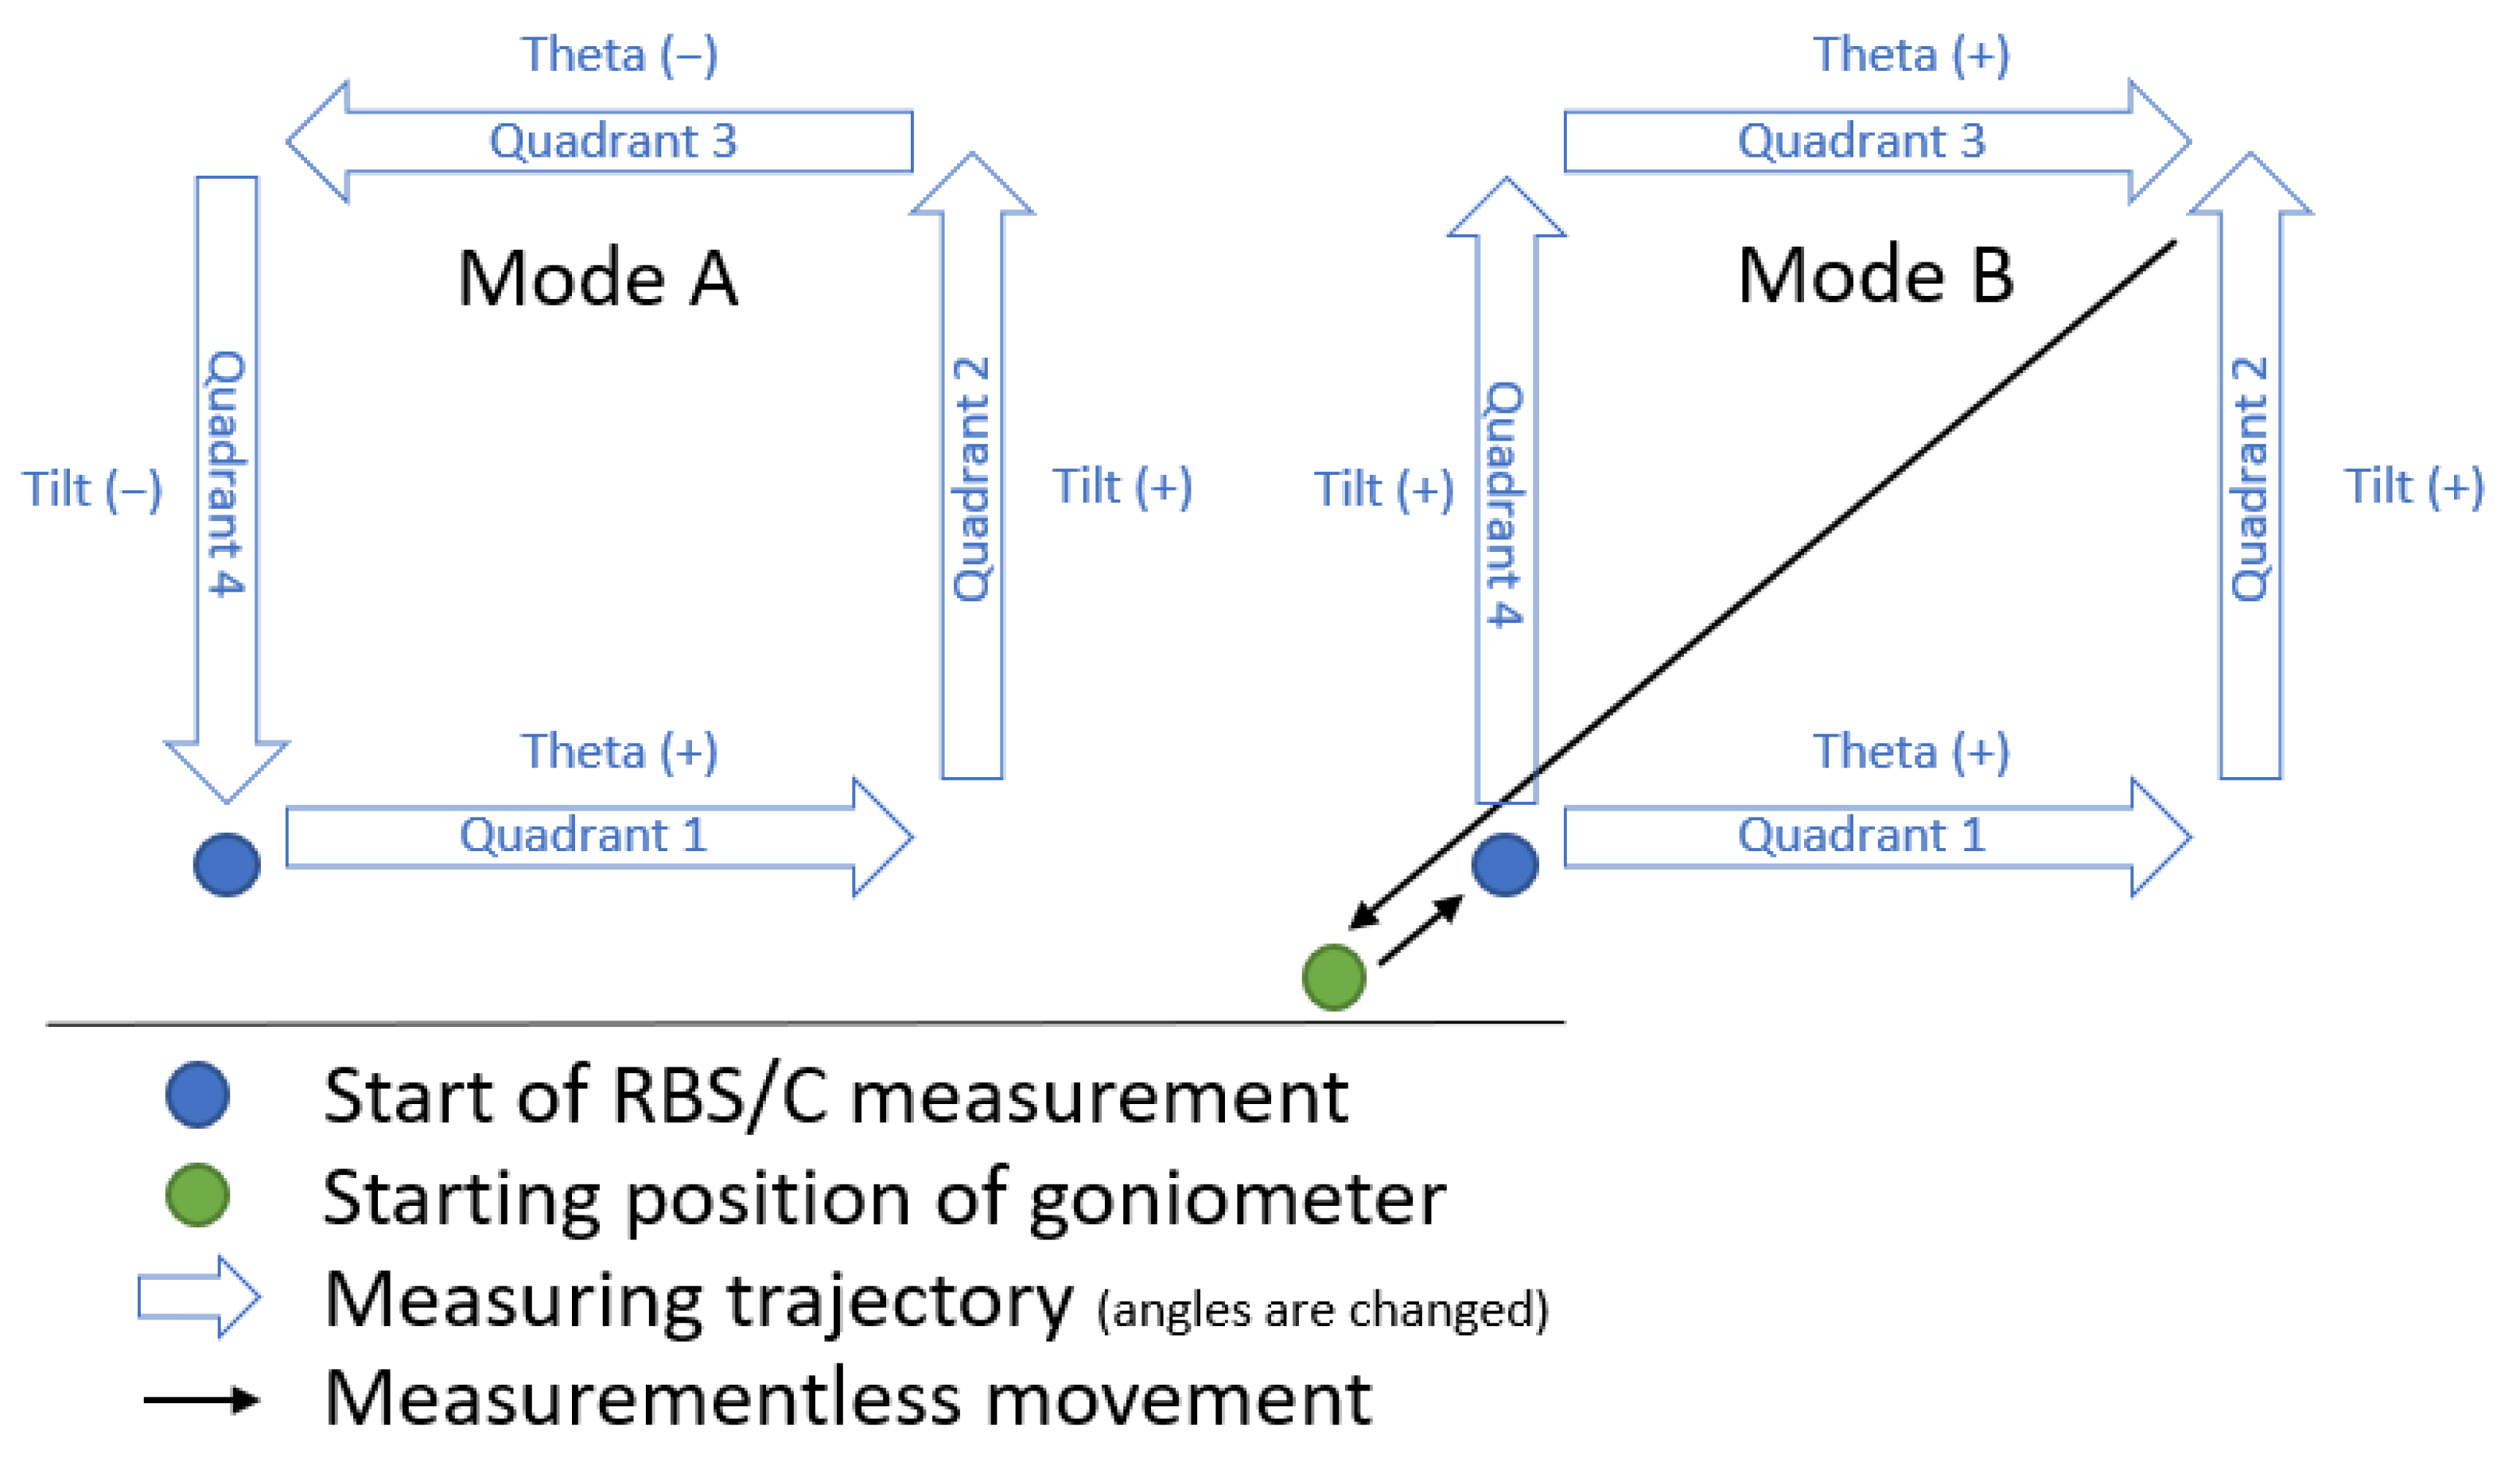
  • mode A; The measurement starts in the first step by increasing the theta angle (quadrant 1). When the angle reaches its maximum, increasing of the tilt angle is performed (quadrant 2). Then, the theta angle is decreasing (quadrant 3) down to its minimum. The last movement is performed in quadrant 4, when the tilt angle is decreasing down to its minimum.
  • mode B; Before the measurement starts, the goniometer is moved into the starting position and in the step after that into the first measuring position. The measurement is performed from the lowest to the highest angle incrementally.
Both of the modes were tested and evaluated during the experiments to eliminate the deviation caused by mechanical backslash of the gears of the stepper motors and for the highest measurement accuracy. The comparison of both modes is summarized in Section 4. One direction goniometer planar displacement of goniometer represents 1 quadrant, so finally there are 4 quadrants of measured values.

3.4.2. Load and Convert Data Function

The function separates and converts measured data files (* mpa) into structured files (* dat) and moves them into the project’s folder, where the created subdirectory contains * btc file and the * dat files. Measured spectra files may be analyzed separately and the researcher can set a region of interest (ROI). Figure 13 displays a single measurement from the experiment with particular parameter settings including axis positions or dose limits listed in the Table 2. In our case the ROI was determined by researchers between channels 280 and 360 for the experiment.

3.4.3. Analysis Features and Evaluation Tools Demonstrated in Experiment: 4He+ Beam Directed on a Si (100)

The application was examined on our Tandetron setup reflecting stepping modes of the goniometer in each of the four quadrants (resulting from Figure 12). First, in coarse mode, the researcher can display processed and fitted data of all four quadrants (Figure 14) together with automatic identification of minima localization per each quadrant. Standard MATLAB function was used to fit the model to the data by spline interpolation as a selected fit type model. In our experiment the minimal value of the spline is taken as the minimum, but there is an option to choose measured values as well as the input for further processing and intersections calculation.
Another implemented feature is a 3D rotating view showing all the processed quadrants data in a complex plot with calculated local minima values (Figure 15). It gives the researcher better possibilities to reorient and analyze the fitted values or to set a ROI. The 3D plot may show local minima values to help determine planes.
Subsequent to localizing the minima, the projection of the planar axes is being realized (Figure 16). The tool allows to choose measured points to work with, thus create/update planar axes or to adjust the parameters for a fine measuring. Each planar axis can be visualized in a different color and a line style. Based on this, the script finds the planar axes rotation and the major axis offset position. Then, another batch file can be created.
Outcome of the fine data evaluation can be shown in 2D plot using gathered or fitted data (Figure 17). The researcher can choose a reference level and based on that a normalized (Yield values are divided by referenced Yield) angular plot will be shown with the calculated output parameters χmin marked as Yieldmin (presents a minimum decrease value) and angular width. The angular width value was deducted as the full width at half maximum (FWHM) of the dip, where the half maximum ( χ HM ) is calculated as follows:
χ HM = 1 χ min 2 + χ min

4. Results and Discussion

The functionality of the presented software application was verified by RBS/C measurement of the Si (100) crystal. The focused beam of helium ions interacted with the Si sample mounted on the goniometer in the vacuum chamber of the ion beam analysis end-station. Two-stepping modes were used to obtain the coarse and fine channeling measurement. We determined the initial offset position based on coarse measurement, that allows the crystal sample alignment. By using the stepping mode B of the goniometer, the major axis offset was found to be dTheta = −0.05° and dTilt = 0.17° (Figure 16). Thereafter, accurate and detailed data were acquired from the fine channeling measurement.
All of the forementioned energy and angular spectra present data from this test measurement. In case of coarse measurement backscattering counts were collected every 0.2° across intervals from −4.0° up to +4.0° in the theta plane. The use of two stepping modes (Figure 12) revealed the mechanical backslash of the goniometer in the mode A and the direction of Theta 0.2° and Tilt < 0.02°. This systematic error caused by backslash in the direction of Theta was eliminated by the mode B as the following results demonstrate. To compare both of the implemented stepping modes of the goniometer (Figure 12):
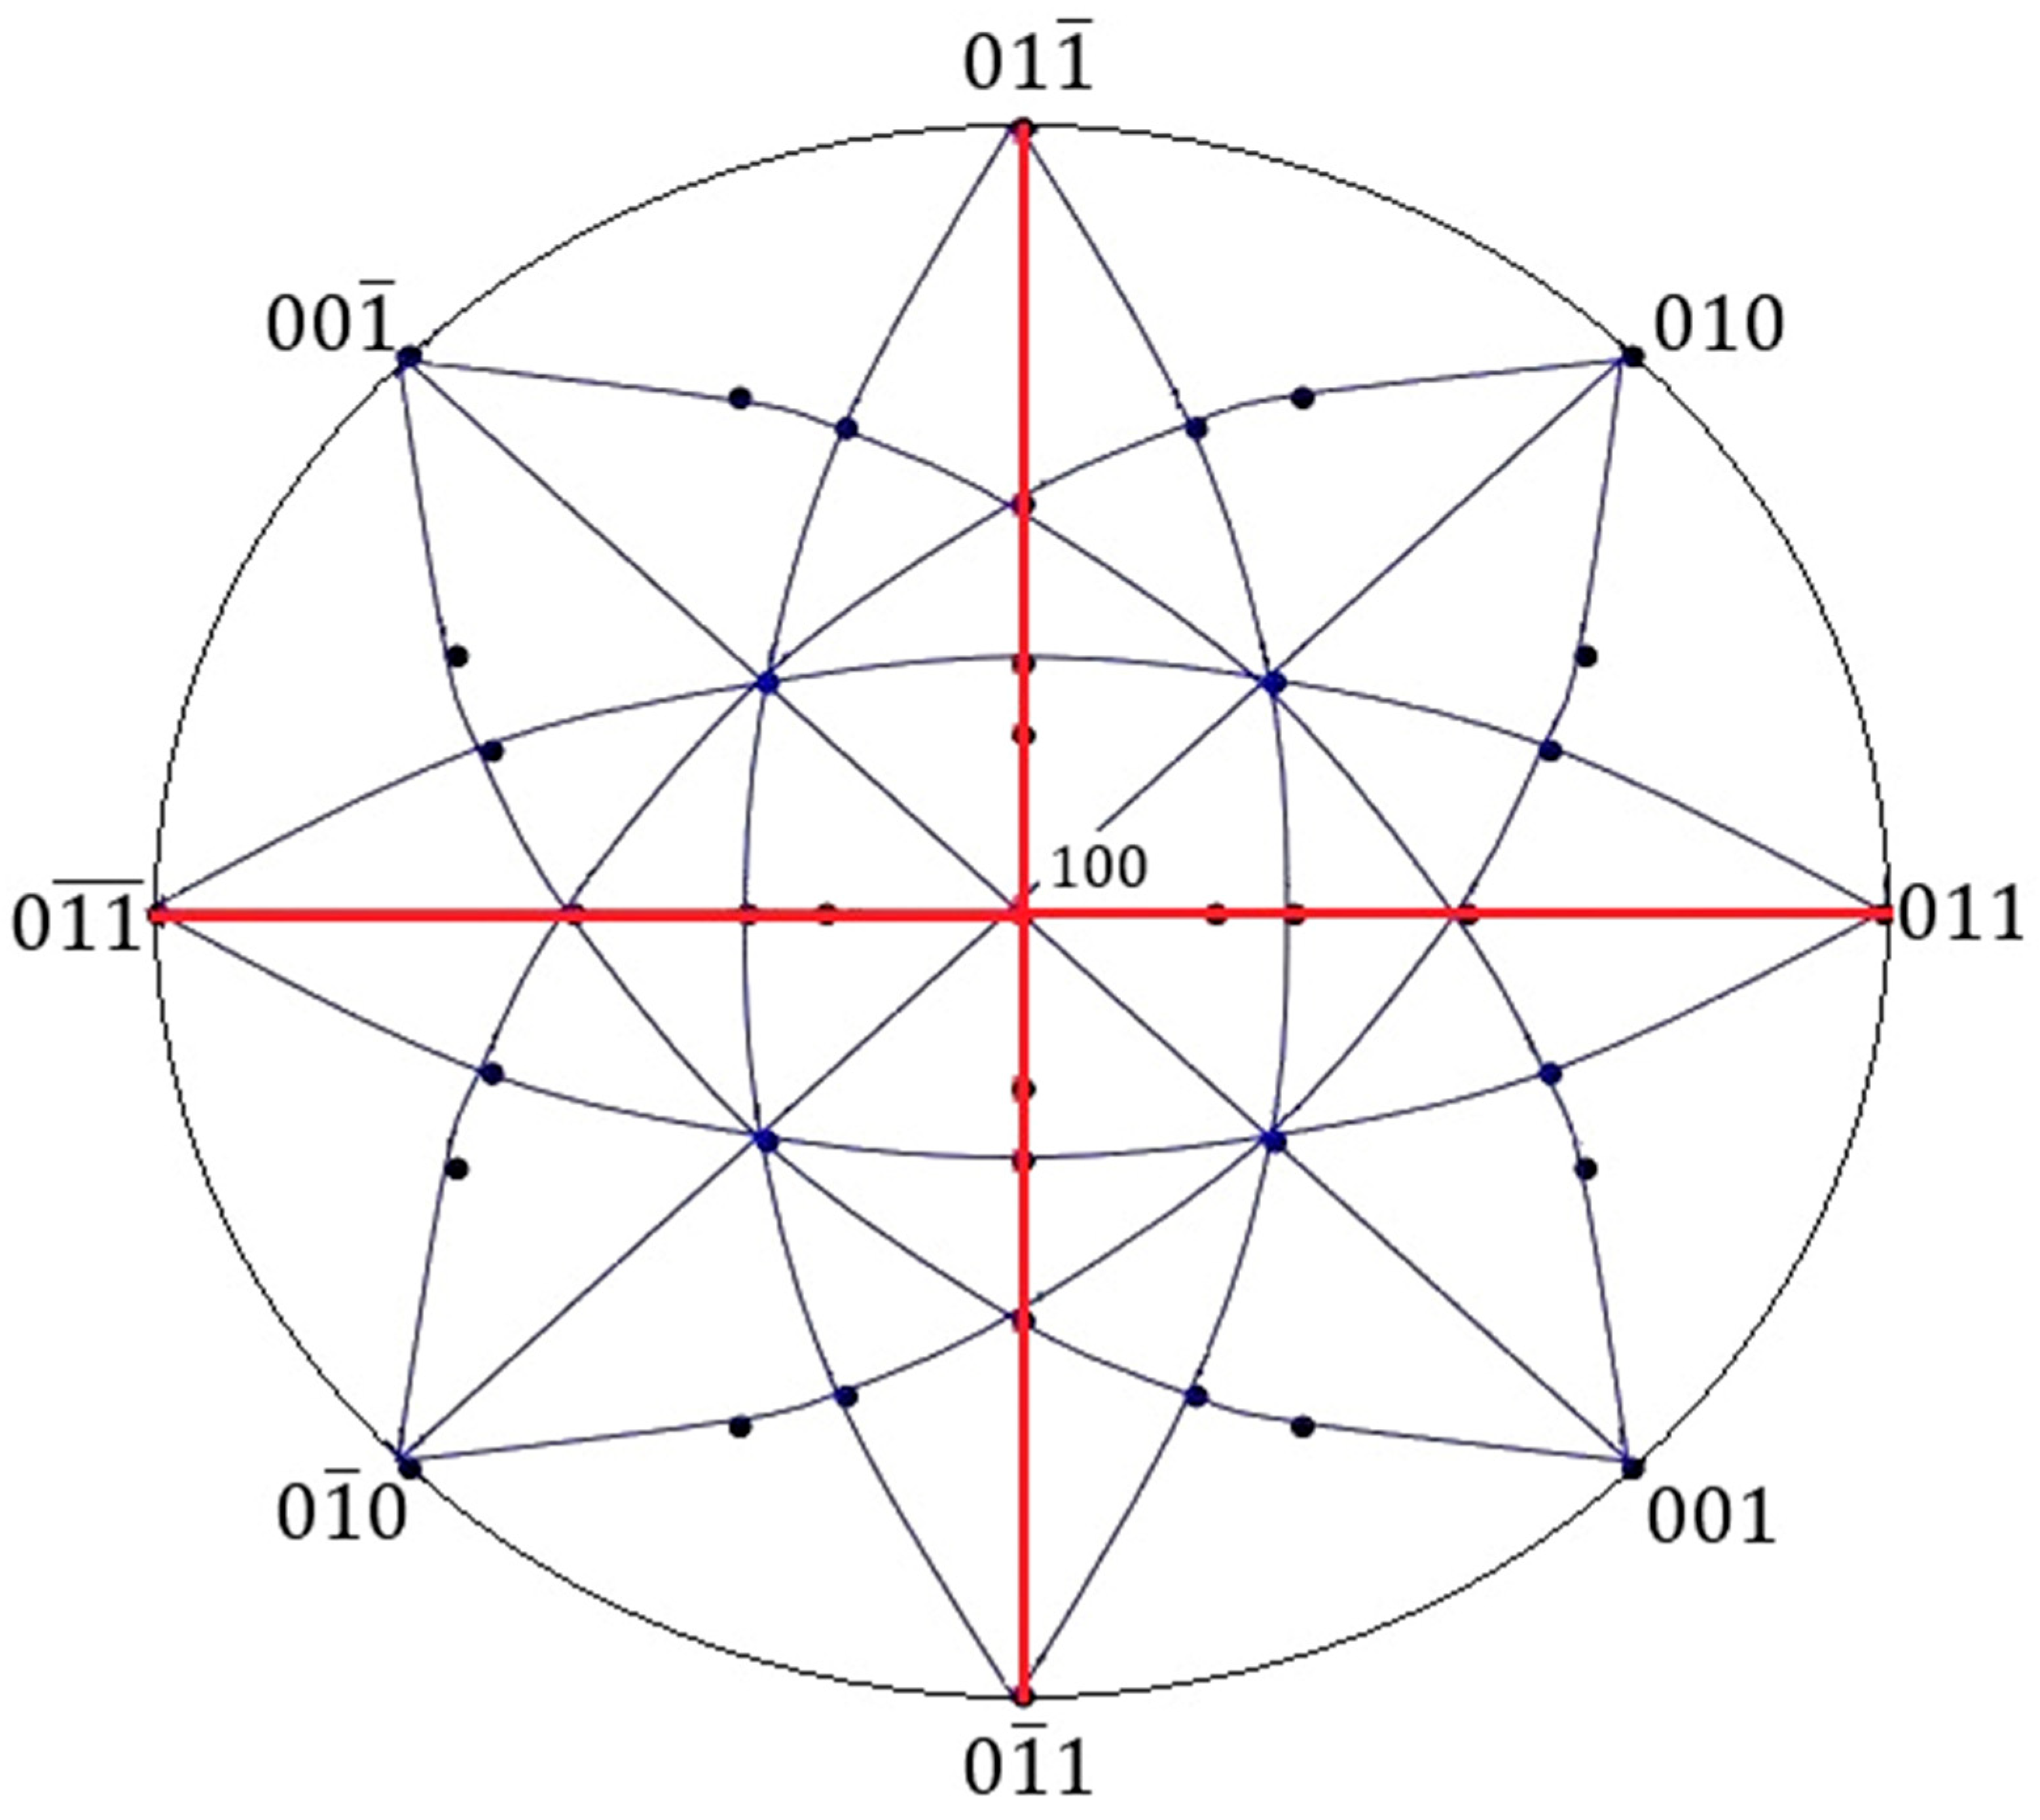
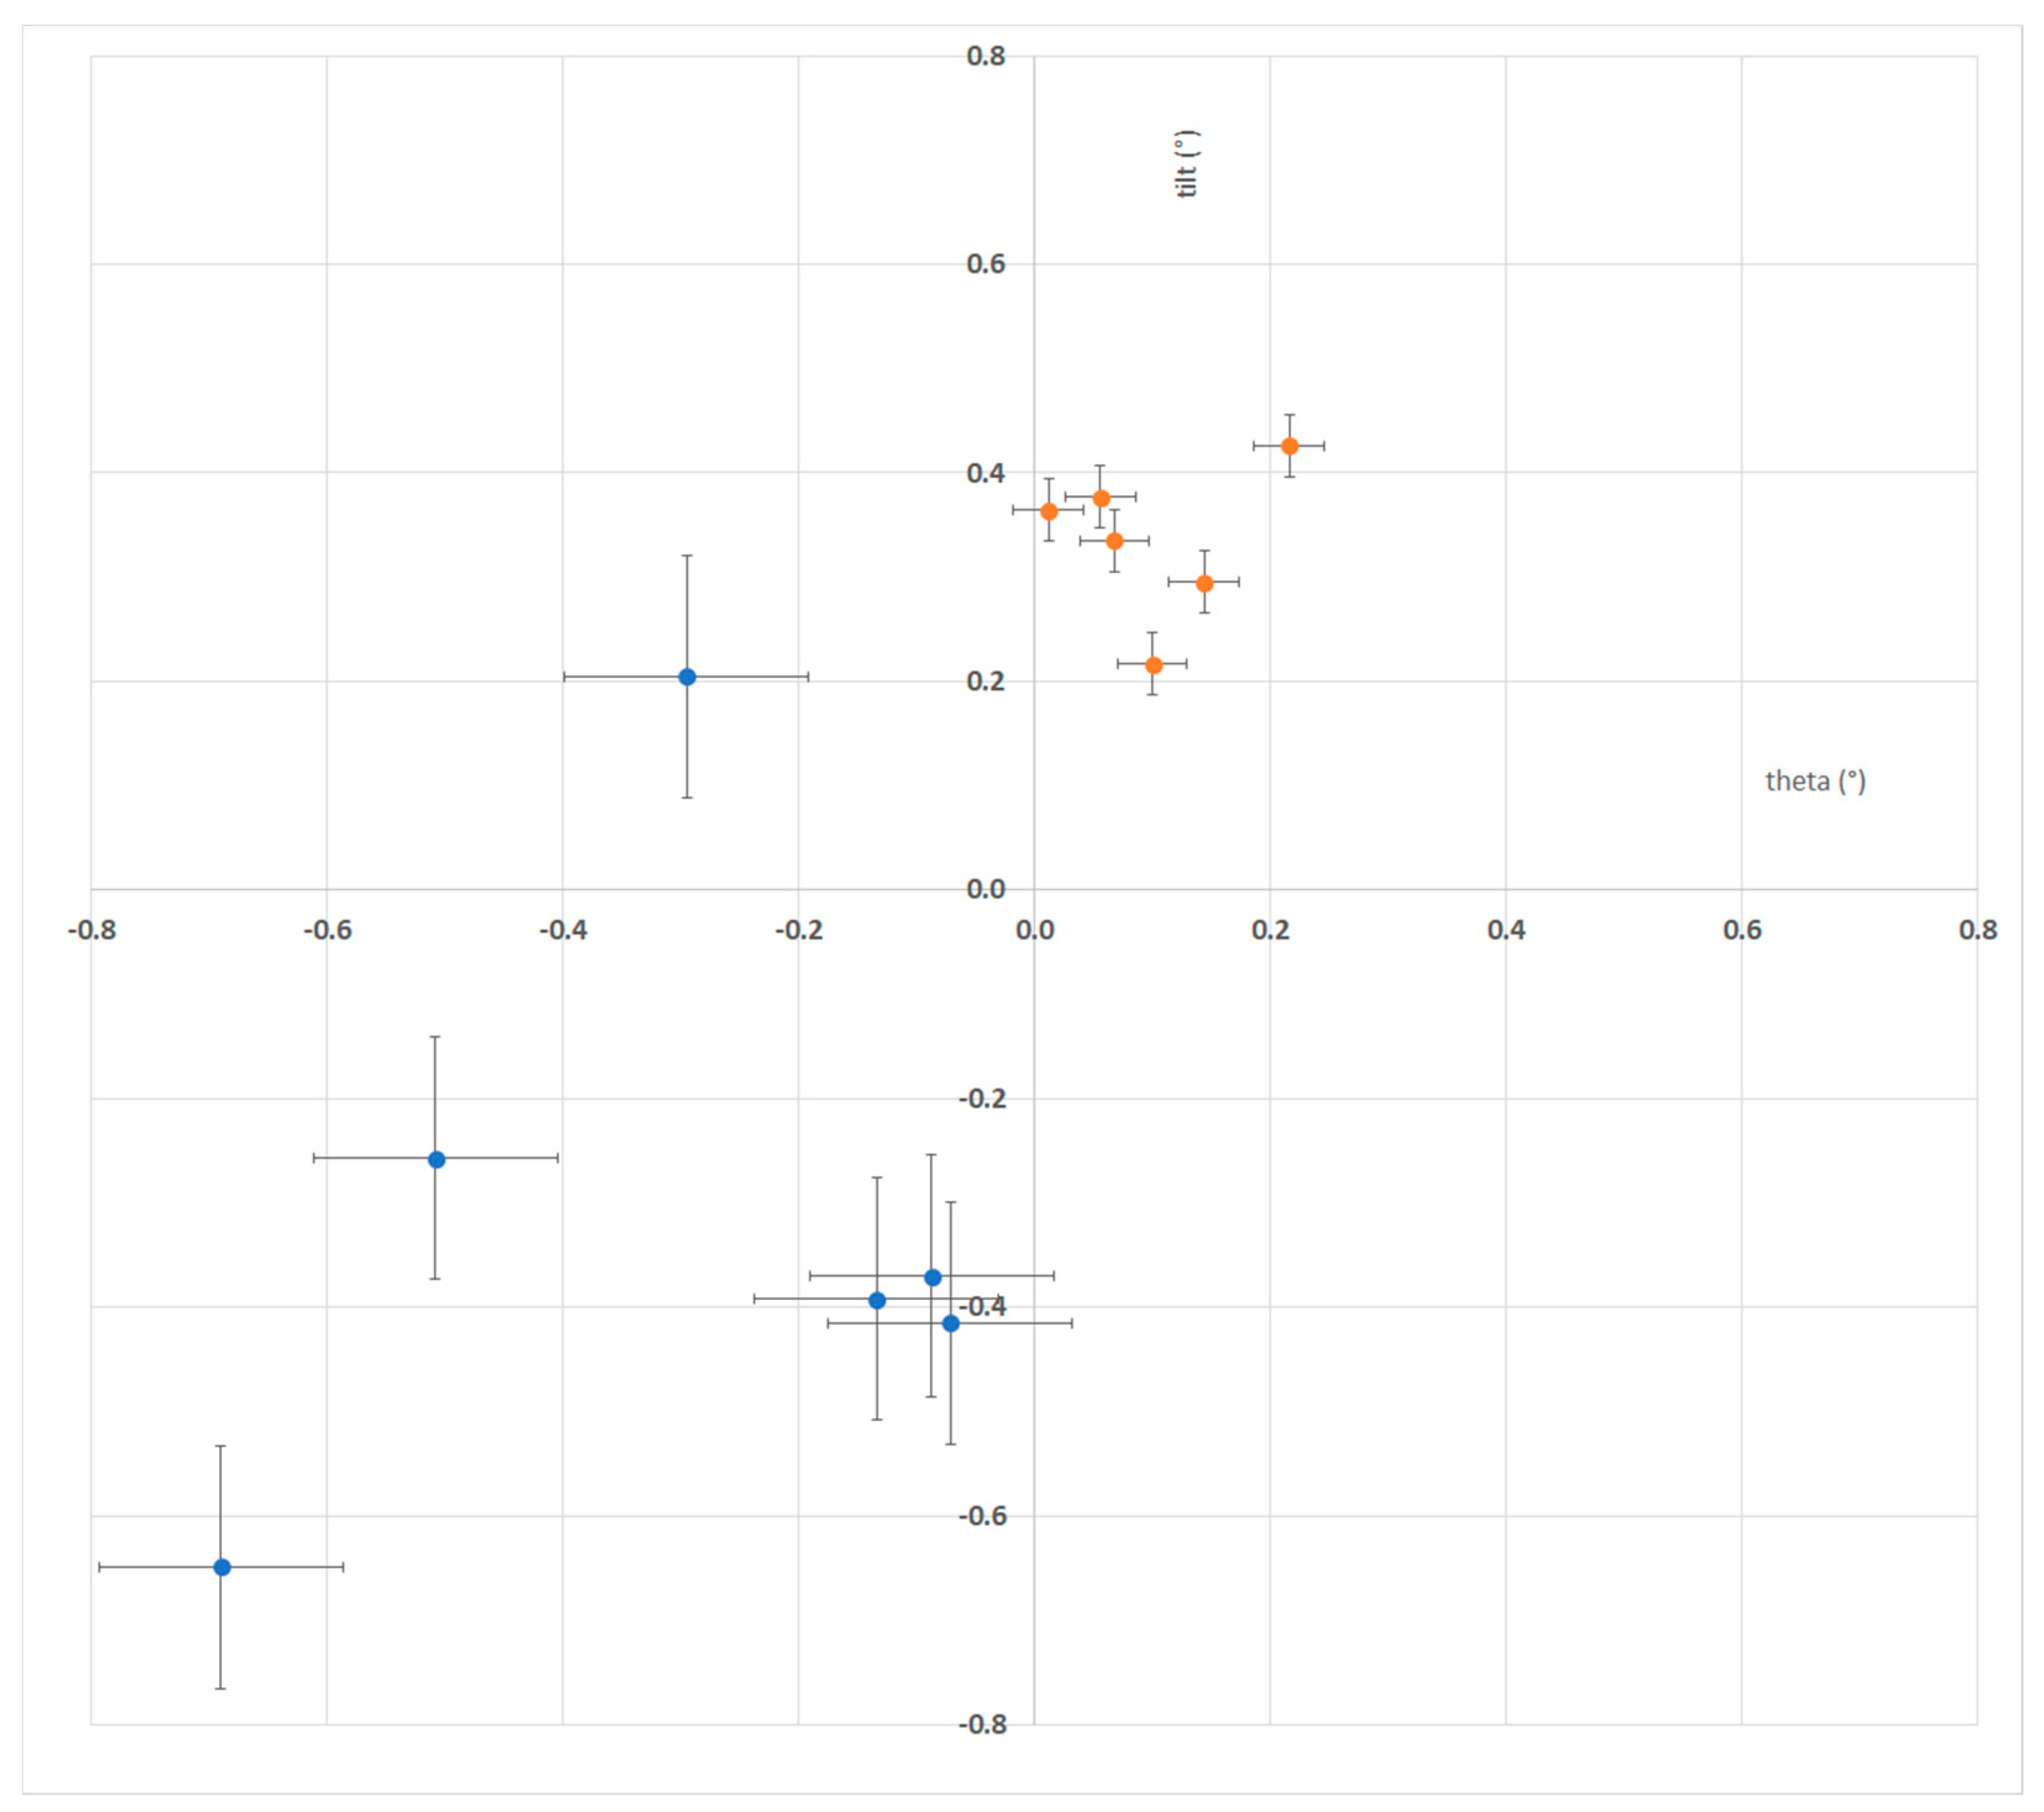
  • In Figure 18 there are scattered intersections of planar axes (calculated based on the intersection positions of main axes of the crystallographic planes displayed in Figure 16 and their distance from the origin of coordinate system), where we can see the dispersion of points for both modes of generating steps.
  • We calculated the dispersion for the intersection points of planes as it is shown in Table 3.
The result confirms our assumption, that the mode B provided over 3 times more accurate measurement.
After crystal alignment, angular measurement through the (100) main axis was done. Measured planes and the main axes of crystal (Figure 16) are consistent with stereographic projection for Si (100) in [19] and expected as shown in Figure 4. Subsequently, the channel (angular) width of 0.90 ± 0.07° and the minimum dip (χmin = 0.32 ± 0.03) was determined from the normalized angular plot (Figure 17). Designed application automates numerous measurements and automatically sets the position of the goniometer, the functionality of which we verified on the experiment and sample.

5. Conclusions

In summary, the automated software concept for RBS/C implemented in MathWorks MATLAB is extending the capability of Tandetron accelerators and its control system ARGUS. Along with facilitating the experiments, the ion beam analysis is thus more complex and sophisticated. The developed applications efficiency in significantly reducing measurement worksteps and fast evaluation was demonstrated and verified by the experimental results in our Tandetron setup. We determined the requested parameters (channel minima, channel angular width, major crystalline axis offset etc.), so the researchers might analyze the crystalline quality of the lattice, i.e., lattice disorder, substitutional or interstitial atom impurities present in the lattice etc. [20]. The measured results and specified parameters meet the expected assumptions and RBS/C application proves to be a powerful tool for in situ ion beam analysis running over ARGUS. Besides this, we compared 2 modes to analyze possible goniometer backslash, which was confirmed and thus the influence of unexpected inaccuracy on the calculations and results was reduced. From our experience, we recommend utilizing mode B for goniometer’s stepping during the measurement. In the future, we would like to implement further improvements. It seems reasonable to think about extending the graphical representation of crystallographic planes in 2D directly in the application or use it with the Monte Carlo simulations of ion channeling in crystals [21]. Finally, the proposed and implemented solution is ready-to-use [22] for any Tandetron based ion beam facility with ARGUS control software of accelerator.

Author Contributions

Conceptualization, D.H., M.K., G.G., R.R. and M.S.; methodology, R.R., M.S., D.H. and M.K.; software, D.H., M.S., P.B., G.G. and M.K.; validation, D.V., P.B., D.H. and M.S.; formal analysis, D.V., R.R. and M.S.; investigation, D.V., R.R., D.H., and G.G.; resources, D.H., M.K., D.V., R.R. and G.G.; data curation, D.H., G.G. and M.S.; writing—original draft preparation, M.S., D.H., R.R. and D.V.; writing—review and editing, G.G., D.H., P.B. and M.S.; visualization, D.H. and R.R.; supervision, D.H. and M.S.; project administration, G.G., D.H., P.B., and M.S.; funding acquisition, R.R. and M.S. All authors have read and agreed to the published version of the manuscript.

Funding

This research was funded by the Scientific Grant Agency of the Ministry of Education, Science, Research and Sport of the Slovak Republic and the Slovak Academy of Sciences, grant number VEGA 1/0418/18: “Time of Flight (ToF) system for Elastic Recoil Detection Analysis (ERDA) based on digital nuclear electronics” and by the European Regional Development Fund, Operational Program Research and Innovation, project „Scientific and Research Centre of Excellence SlovakION for Material and Interdisciplinary Research“, No. ITMS2014+: 313011W085.

Institutional Review Board Statement

Not applicable.

Informed Consent Statement

Not applicable.

Data Availability Statement

Data available in a publicly accessible repository that does not issue DOIs. Publicly available datasets were analyzed in this study. This data can be found here: [22].

Acknowledgments

We would like to thank Jozef Dobrovodsky for many enlightening discussions on the RBS/C measurement and evaluation.

Conflicts of Interest

The authors declare no conflict of interest.

References

  1. Chu, W.-K.; Mayer, J.W.; Nicolet, M.A. Backscattering Spectrometry; Academic Press: New York, NY, USA, 1978. [Google Scholar]
  2. Feldman, L.C.; Mayer, J.W.; Picraux, S.T.A. Materials Analysis by Ion Channeling: Submicron Crystallography; Academic Press: Cambridge, MA, USA, 1982. [Google Scholar]
  3. Wijesundera, D.; Ma, K.; Wang, X.; Liu, B.; Liu, J.R.; Chu, W.K. A geometric procedure for improved Rutherford backscattering channeling analysis of materials. Nucl. Instrum. Methods Phys. Res. Sect. B Beam Interact. Mater. At. 2009, 267, 1948–1951. [Google Scholar] [CrossRef]
  4. Motapothula, M.R.; Breese, M.B. A study of small impact parameter ion channeling effects in thin crystals. Eur. Phys. J. B 2017, 91, 1–12. [Google Scholar] [CrossRef] [Green Version]
  5. Yamamoto, Y. Automatic Beam Alignment for Channeling Measurements in Rutherford Backscattering Spectrometry; North-Holland Publishing Company: Tokyo, Japan, 1981; pp. 171–176. [Google Scholar]
  6. Podaru, N.C.; Klein, M.; Hoef, F.; Mous, D.J.W. Versatile 500 kV air-insulated medium current ion implanter. In Proceedings of the 24th International Conference on the Application of Accelerators in Research and Industry (CAARI 2016), Fort Worth, TX, USA, 30 October–4 November 2016; pp. 68–69. [Google Scholar]
  7. Noga, P.; Dobrovodsky, J.; Vana, D.; Beno, M.; Zavacka, A.; Muska, M.; Halgas, R.; Minarik, S.; Riedlmajer, R. A new ion-beam laboratory for materials research at the Slovak University of Technology. Nucl. Instrum. Methods Phys. Res. Sect. B Beam Interact. Mater. At. 2017, 409, 264–267. [Google Scholar] [CrossRef]
  8. He, J.; Lee, J.; Li, M.; Wang, Z.; Liu, C.; Fu, D. Computerized Control and Operation of Rutherford Backscattering/Channeling for an in situ Ion Beam System and Its Application for Measurement of Si(001) and ZnO(001). Chin. Phys. Lett. 2011, 28, 012901. [Google Scholar] [CrossRef]
  9. Rauhala, E.; Barradas, N.P.; Fazinic, S.; Mayer, M.; Szilágyi, E.; Thompson, M. Status of ion beam data analysis and simulation software. Nucl. Instrum. Methods Phys. Res. Sect. B Beam Interact. Mater. At. 2006, 244, 436–456. [Google Scholar] [CrossRef] [Green Version]
  10. David-Bosne, E.; Wahl, U.; Correia, J.; Lima, T.; Pereira, A.V.A.L. A generalized fitting tool for analysis of two-dimensional channeling patterns. Nucl. Instrum. Methods Phys. Res. Sect. B Beam Interact. Mater. At. 2020, 462, 102–112. [Google Scholar] [CrossRef]
  11. Zhang, S.; Nordlund, K.; Djurabekova, F.; Zhang, Y.; Velisa, G.; Wang, T.S. Simulation of Rutherford backscattering spectrometry from arbitrary atom structures. Phys. Rev. E 2016, 12, 043319. [Google Scholar] [CrossRef] [PubMed] [Green Version]
  12. Stremy, M.; Cuninka, P.; Noga, P. Encouraging scientific thinking and fostering scientific careers in the environment of the Slovak University of Technology in Bratislava. In Proceedings of the 15th IEEE International Conference on Emerging eLearning Technologies and Applications (ICETA), Starý Smokovec, Slovakia, 26–27 October 2017; pp. 445–450. [Google Scholar]
  13. Burducea, I.; Straticiuc, M.; Ghiță, D.G.; Moșu, D.V.; Călinescu, C.I.; Podaru, N.C. A new ion beam facility based on a 3 MV Tandetron™ at IFIN-HH, Romania. Nucl. Instrum. Methods Phys. Res. Sect. B Beam Interact. Mater. At. 2015, 359, 12–19. [Google Scholar] [CrossRef]
  14. High Voltage Engineering, (H. V. E. E. B.V.) Operating manual for ARGUS Accelerator System Control. A-4-35-000-ARGUS, rev. 1.0, Amersfoort 2015. Available online: www.highvolteng.com (accessed on 11 March 2021).
  15. Biri, S.; Vajda, I.K.; Hajdu, P.; Rácz, R.; Csík, A.K.Z.; Perduk, Z.; Rajta, F.K.A.I. The Atomki Accelerator Centre. Eur. Phys. J. Plus 2021, 137, 247. [Google Scholar] [CrossRef]
  16. Han, J.; An, Z.; Zheng, G.; Bai, F.; Li, Z.; Wang, P.; Liao, X.; Liu, M.; Chen, S.; Zhang, M.S.A.J. An ion beam facility based on a 3 MV tandetron accelerator in Sichuan University, China. Nucl. Instrum. Methods Phys. Res. Sect. B Beam Interact. Mater. At. 2018, 418, 68–73. [Google Scholar] [CrossRef]
  17. Gurbich, A.F.; Bokhovko, M.V. Calibration of 3 MV Tandetron™ accelerator over nominal energy range. Nucl. Instrum. Methods Phys. Res. Sect. B Beam Interact. Mater. At. 2019, 459, 81–83. [Google Scholar] [CrossRef]
  18. Create Standalone Application from MATLAB—MATLAB & Simulink. MathWorks. Available online: https://www.mathworks.com/help/compiler/create-and-install-a-standalone-application-from-matlab-code.html (accessed on 11 March 2021).
  19. Tilli, M.; Motooka, T.; Airaksinen, V.; Franssila, S.; Paulasto-Krockel, M.; Lindroos, V. Handbook of Silicon Based MEMS Materials and Technologies, 2nd ed.; Elsevier: Amsterdam, The Netherlands, 2015; ISBN 978-0-323-29965-7. [Google Scholar]
  20. Malovcova, V.; Bezak, P.; Dobrovodsky, J. Rutherford Backscattering Spectrometry system in channeling regime. In Book of Abstracts of the 27th Joint Seminar, Proceedings of the Development of Materials Science in Research and Education (DMS-RE 2017), Kezmarske Zlaby, Slovakia, 4–8 September 2017, 1st ed.; Slovak Society for Industrial Chemistry: Bratislava, Slovakia, 2017; p. 30. [Google Scholar]
  21. Jozwik, P.; Nowicki, L.; Ratajczak, R.; Stonert, A.; Mieszczynski, C.; Turos, A.; Morawiec, K.; Alves, K.L.A.E. Monte Carlo simulations of ion channeling in crystals containing dislocations and randomly displaced atoms. J. Appl. Phys. 2019, 126, 195107. [Google Scholar] [CrossRef]
  22. Horvath, D.; Stremy, M.; Bezak, P. RBS/C for Tandetron Accelerators with ARGUS Control Software, MATLAB Central File Exchange. 2021. Available online: https://www.mathworks.com/matlabcentral/fileexchange/90087 (accessed on 9 April 2021).
Figure 1. Layout of the 6 MV tandem accelerator: (1) Ion sources; (2) Mass analyzing magnet; (3) Focusing system in front of the accelerator; (4) Tandem accelerator tank; (5) Quadrupole triplet lens; (6) Switching magnet; (7) Modification chamber; (8) Ion beam analysis end-station.
Applsci 11 03817 g001
Figure 2. Tandetron control system architecture.
Applsci 11 03817 g002
Figure 3. ARGUS and MPANT software and a control overview of the Tandetron technology.
Applsci 11 03817 g003
Figure 4. Stereographic projection of the (100)-oriented Si crystal.
Applsci 11 03817 g004
Figure 5. Principle arrangement of the 4D goniometer.
Applsci 11 03817 g005
Figure 6. Software architecture of designed system with MATLAB application.
Applsci 11 03817 g006
Figure 7. Coarse RBS/C methodology.
Applsci 11 03817 g007
Figure 8. Fine RBS/C methodology.
Applsci 11 03817 g008
Figure 9. Designed measurement algorithm and data flows.
Applsci 11 03817 g009
Figure 10. Designed Coarse and Fine RBS/C evaluation algorithm.
Applsci 11 03817 g010
Figure 11. Batch file generator window.
Applsci 11 03817 g011
Figure 12. Goniometer and steps generation modes.
Applsci 11 03817 g012
Figure 13. RBS measured spectrum of Si (100), dose 0.5 µC.
Applsci 11 03817 g013
Figure 14. Local minima in each of fourth quadrants with the yield given by the sum over the ROI.
Applsci 11 03817 g014
Figure 15. Coarse measurement results.
Applsci 11 03817 g015
Figure 16. Visualization of measured planes and the main axes of crystal.
Applsci 11 03817 g016
Figure 17. Normalized yield of a fine measurement with measured and calculated values. The channeling dip features a reduction in ROI counts by a factor 0.32 with a FWHM width of 0.90°.
Applsci 11 03817 g017
Figure 18. Points of intersections of planar axes measured by both mode A (blue points) and B (red points).
Applsci 11 03817 g018
Table 1. Notations.
Table 1. Notations.
Axis of RotationNotation in ArgusNotation in MATLAB
X-Rotation (tilt-horizontal)tiltPos = X-TiltTilt
Y-Rotation (azimuthal)thetaPos = thetaTheta
Z-Rotation (incoming beam)PhiPos = phiPhi
Table 2. Step #11 parameters.
ParameterValueDescription
StepNr11Step identifier
PhiPos0.00Sample holder rotation
ThetaPos−2.20Horizontal axe
TiltPos−4.00Vertical axe
LiftPos0.00Sample holder vertical shift
FoilPos1Foil identifier (for detector R2)
ConfigFile…/config.mpaConfiguration file for a multichannel analyzer
MaxTime0Time limitA measurement stops if one of these values is reached. Zero is ignored.
Dose0.20Dose limit (µC)
RoiCounts0Integral limit
RoiDetector1Detector identifier
OutputFile…/data_11.mpaA file, where measured spectrum is saved.
Convert_Det1Fixed RBSDefine, which detector is used to measure a spectrum under the specific Det.
Convert_Det2None
Convert_Det3None
Convert_Det4None
Table 3. Centroid and dispersion of planes intersections.
ModeDispersion
Theta AnglesTilt Angles
mode A0.253 ± 0.1030.284 ± 0.116
mode B0.072 ± 0.0290.073 ± 0.030
Publisher’s Note: MDPI stays neutral with regard to jurisdictional claims in published maps and institutional affiliations.

