Abstract
This work aims to study the relationship between the compression resistance and velocity from ultrasonic pulses in samples of mortars with 25% of pozzolanic content. Pozzolanic cement is a low-priced sustainable material that can reduce costs and CO2 emissions that are produced in the manufacturing of cement from the calcination of calcium carbonate. Using ultrasonic pulse velocity (UPV) to estimate the compressive resistance of mortars with pozzolanic content reduces costs when evaluating the quality of structures built with this material since it is not required to perform an unconfined compression test. The objective of this study is to establish a correlation in order to estimate the compression resistance of this material from its ultrasonic pulse velocity. For this purpose, we studied a total of 16 cement samples, including those with additions of pozzolanic content with different compositions and a sample without any additions. The results obtained show the mentioned correlation, which establishes a basis for research with a higher number of samples to ascertain if it holds true at greater curing ages.
1. Introduction
The construction industry currently confronts significant challenges, such as the growth of increasingly populated cities, the rise in pollution levels in urban centers, and the need to guarantee housing for the population. These challenges require a transformation to allow for the use of sustainable construction materials at an optimum cost while fulfilling the established quality criteria.
Cement is the main component of mortar and concrete, which are among the most widely used materials in construction. It is estimated that cement manufacturers are responsible for 7% of annual CO2 emissions. Using supplementary cementitious materials (SCMs) in the manufacturing of cement, such as pozzolanic materials, could significantly reduce these emissions as well as costs due to their low price. This article studies the most representative pozzolanic materials from a geological perspective of the different deposits existing in the north-eastern part of Cuba. In Cuba, there are difficulties with supply and access to building materials. Mortars with pozzolanic additions from local deposits could provide an economical and sustainable option.
Another great challenge for the industry is to analyze the quality of the structures once they have been built. Destructive testing, which is time-consuming and expensive, is traditionally used to verify that there is no damage to the infrastructure. Non-destructive testing (NDT) can evaluate the quality without altering the original attributes or damaging the material.
Non-destructive testing includes techniques based on ultrasound (UT). These techniques have a wide range of applications in the characterization and evaluation of materials [1] in different sectors, such as the aerospace industry, manufacturing industries, and civil works and infrastructures [2].
One of the applications of ultrasound testing is the evaluation of the compressive strength of mortars and concrete based on ultrasonic pulses velocity (UPV). UPV tests are an easily applied non-destructive method for calculating of the speed of propagation of ultrasonic waves. These values can be correlated with the compressive strength of the mortars and concrete as measured with direct compression tests. In general, the compressive strength and the velocity measured have a correlation, where an increase in velocity results in high values of compressive strength [3].
Many factors influence the models established to predict the compressive strength of concrete from UPV. Some of these factors include the nature of the cement, the influence of aggregate size, the water–cement ratio, and the use of active admixtures [4]. For example, Abo-Qudais [5] indicated that the UPV decreases with the increase of the water–cement ratio and increases with an increasing aggregate size. Güçlüer K. [6] found that increasing the surface roughness of the aggregates led to an increase in the compressive strength of concrete and the speed of the ultrasonic pulses.
Another factor to consider is the influence of the concrete mesostructure on wave propagation. Recent research [7] has shown that the complex heterogeneous mesostructure of a concrete slab affects the displacements associated with wave motion, leading to inaccuracies in the wave propagation model. The discrepancy between the actual and theoretical values increases with the proportion of the aggregates and the particle size of the aggregates.
Research has been carried out to determine the relationship between compressive strength and UPV in different materials derived from cement. Benaicha et al. [8] showed that ultrasonic speed can be used to study the quality of concrete reinforced with steel fibres and is an effective way of evaluating the level of consolidation during and after the curing period. Stawiski and Kania [9] analyzed the ultrasonic test methodology to determine the conversion factor for compressive strength in samples of various dimensions. Alexandre Bogas et al. [3] studied concretes with different types of aggregates, achieving a simplified expression to estimate the compressive strength from UPV that was not affected by the kind of concrete and its composition. Nash’t et al. [10] investigated whether it is possible to obtain a relationship between compression resistance and ultrasonic speed in concrete samples where the design characteristics are unknown.
The relationship between the ultrasonic pulse velocity and the elastic characteristics of the material are, according to the following equation:
where c is speed of propagation, E is Young’s modulus, e is the material density and μ is the Poisson coefficient.
Since there is a correlation between Young’s modulus of a material and its resistance to compression, there will also be a correlation between this resistance and UPV, if the rest of the magnitudes involved are assumed to be invariable [11].
Many researchers like Kheder [12], Nash’t et al. [10], Hamid et al. [13] and Omer et al. [14] have shown that the relationship between compressive strength and pulse rate can be estimated by the following exponential relationship:
where Fc is the compressive strength (MPa), UPV is the ultrasonic pulse rate (km/s), and A and B are empirical constants.
However, few studies have been conducted on the relationship between UPV and compressive strength in cement, mortars, or pozzolanic concrete. Madandoust and Mousavi [15] designed fifteen mixtures of concrete with different metakaolin contents and water–binder ratios (W–B). The hardened properties were tested for compressive strength and ultrasonic pulse rate (UPV), among other tests, and it was determined that compressive strength can be predicted based on UPV using multiple regression analysis. Rao et al. [16] studied a roller-compacted concrete pavement (RCCP) material with different Class F fly ash content as a mineral admixture with different sands as fine aggregate, all tested at different curing ages. Through the results of UPV testing and compressive strength, he proposed the following relationship between both parameters:
The use of natural additions with different chemical compositions alters the behavior of the mixtures produced compared to materials without additions, with this behavior being more significant at greater curing ages, as can be seen in the study of Ranjbar et al. [17], who studied self-compacted concrete with natural zeolite.
There is no consensus or unified formula for using UPV to predict compressive strength, despite the great benefits this would provide, since many factors influence the correlation between UPV and traditional compression tests. Furthermore, when we aim to apply this prediction technique to mortars or concrete with natural additions, such as pozzolans, we find little literature on the subject.
This research aims to study the correlation between UPV and resistance to compression in mortar samples with natural pozzolanic additions to examine whether this methodology can be applied to these materials and thus initiate a line of research to determine if a unified formula can be developed to calculate compressive strength for mortars with these additions. The aim of this manuscript is not to suggest a generalized correlation applicable to other materials, but to obtain results for the most significant pozzolanic materials within the deposits shown to have the most appropriate physicomechanical properties for use in high-strength mortars.
With the implementation of this methodology, it is possible to reduce the cost of quality inspections, making them accessible to the entire population.
2. Materials and Methods
To carry out the research, 160 × 40 × 40 mm prismatic specimens of mortars were tested, consisting of 400 g of a 75% mixture of cement type II 42.5 R and 25% of different materials with pozzolanic characteristics, 225 g of filtered water (0.56 w/c), and 1350 g of standard CEN (European Committee for Standardization) sand. In addition, a test specimen made from the reference cement was tested (400 g of cement type II 42.5R, 1350 g of standard CEN sand, and 225 g of filtered water).
The pozzolanic specimens were composed using eleven natural materials. Four of the materials were natural mordenite from a deposit located in Almeria, Spain. The other seven were different materials of volcanic origin coming from different deposits in the north-eastern area of Cuba. Table 1 shows the list of pozzolanic samples used in this investigation.

Table 1.
Name, nature, and origin of pozzolanic additions used.
The preparation of the mortar specimens was carried out according to the European Standard [18]. The preparation of the specimens started with a grinding process using two jaw crushers and a disc mill until a Blaine specific surface area of 4000 ± 200 cm2/g was obtained to match the specific surface of the cement used. Once the samples were the right size, 100 g of each sample was mixed with 300 g of cement to obtain the ratio of 75–25 cement–pozzolan. The mortar was mixed with an Ibertest mixer. First, 225 g of water was poured into the receptacle and the cement–pozzolana mixture was added. While the mixer was running, sand was added regularly. When the mortar was fixed, three samples (A-B-C) of each mixture were molded and then compacted using a Suzpecar compactor. Finally, the specimens were covered and placed in the wet chamber for 24 h, after which the specimens were unmolded and quickly immersed in water at 20.0 ± 1.0 °C in the curing tanks until they were tested. A total of 48 mortar specimens were made, 45 from type II 42.5 R cement with 25% additions from 11 different pozzolanic samples (specimens A-B-C from 1 to 15) and three made from type II 42.5 R cement without additions (test tubes 16 A-B-C).
A CONTROLS-UPV E48, together with Ultraschall-Gel Sauerland as a contact gel, determined the propagation time of the ultrasonic waves, as shown in the Figure 1.
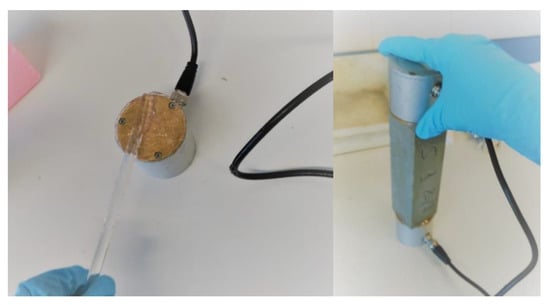
Figure 1.
Measurement of the propagation time of the ultrasonic waves through the specimen.
The determination of the propagation time and ultrasonic pulse velocity was carried out following the European Standard [19]. UPV was calculated according to the equation:
UPV (km/s) = distance (km)/time (s)
To obtain the compressive strength of the specimens, an ELE/SDE compression press was used, along with an Ibertest compression device with a uniform load increase of 2400 ± 200 N/s, during the whole application time until breakage, following the indications of the European Standard [16].
We started with the bending resistance test, as indicated in the standard, to obtain the semi-prisms that would be tested in the compression test. Each semi-prism of the specimens was placed in the test cell of the compression press, which applied an incremental force until the specimen broke.
For the analysis of the results, a statistical study was carried out. The trend curve that best fits the results was obtained from an exponential and lineal regression analysis by the method of least squares using the Excel program. Absolute and relative errors were calculated, and the upper and lower limits of reliability established based on a confidence interval.
3. Results
A total of 48 prismatic mortar specimens were tested in the laboratory. The ultrasonic pulse velocity and compressive strength of each were obtained, which are shown in Table S1 (supplementary material). Table 2 shows the average value of compressive strength for each specimen, the measurement of the propagation time, and the ultrasonic pulse velocity.
Table 2.
Results obtained for specimens prepared with the mixtures in the compression resistance and ultrasonic pulse velocity tests.
From the statistical analysis of exponential regression of the results, the equation to determine the trend of the data obtained, with a determination coefficient (R2) of 0.8921, is as follows:
Based on the expression determined in this study and on the experimental data, an upper and lower limit of reliability was calculated considering a 95% confidence level.
Figure 2 shows the results obtained, the exponential trend, and the calculated limits.
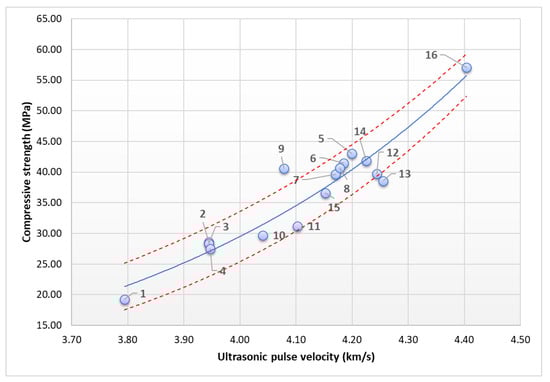
Figure 2.
Presentation of the results of the compressive strength test concerning the calculated ultrasonic pulse velocity. The blue line represents the exponential trend of the values, and the red dashed lines represent the limits set with 95% confidence.
The estimated compressive strength is calculated by the exponential regression for the UPV values obtained, as shown in Equation (5). In addition, the relative and absolute errors between the real and calculated values were obtained and shown in Table 3.
Table 3.
Results obtained for the statistical analysis of exponential regression.
The 95% confidence limits can be used to preliminarily estimate the compressive strength of mortars, quickly and inexpensively, from a UPV measurement. Therefore, if we were to obtain a UPV of 4.15 km/s, we would know with 95% confidence that the compressive strength value was 33.35–41.39 MPa.
The absolute and relative errors of the results obtained by exponential regression were also calculated based on the values of the compressive strength test, ranging from 0.21 to 7.23 and from 0.51 to 17.81%, respectively. These errors represent an acceptable approximation for an estimate, for example, in a standard quality study.
However, sometimes greater accuracy is required when performing an analysis of the physical properties of mortars. Therefore, the trend in four of the study samples from the same deposit was further tested to see if the correlation remained reliable, as the chemical composition would be almost the same.
The results obtained from the natural mordenite from the San Jose-Los Escullos site were isolated following the same process mentioned before. The equation determined from the statistical analysis of exponential regression of the results, with a determination coefficient (R2) of 0.9801, is as follows:
The upper and lower reliability limits with a 95% confidence level were:
The graphic representation of these results is shown in Figure 3.
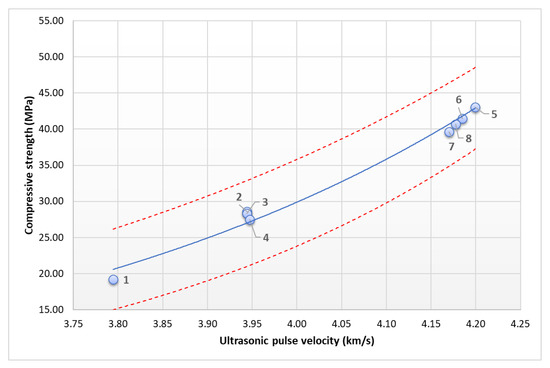
Figure 3.
Presentation of the results of the compressive strength test concerning the calculated ultrasonic pulse velocity of the natural mordenite. The blue line represents the exponential trend of the values, and the red dashed lines represent the limits set with 95% confidence.
In this estimation, if we were to obtain a UPV of 4.15 km/s, we would know with 95% confidence that the compressive strength value was between 33.39–44.97 MPa. The absolute and relative errors ranged from 0.20 to 1.6 and from 0.47 to 6.98%, respectively.
For this second exponential regression, a higher R2 was obtained, which means that the regression is better adjusted to the real data. In addition, both absolute and relative errors were lower than those obtained in the first regression. This may be because the samples were composed of natural materials from the same deposit that have a similar chemical composition. However, the size of the samples, which was smaller than in the previous case, can affect the trend.
The same procedure followed for the exponential regression was repeated to study the possible linear trend of the results. The equation determined from the statistical analysis of exponential regression of the results, with a determination coefficient (R2) of 0.873, is as follows:
The upper and lower reliability limits with a 95% confidence level were:
The graphic representation of these results is shown in Figure 4.
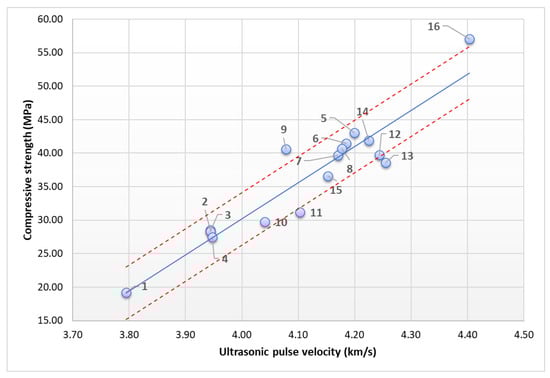
Figure 4.
Presentation of the results of the compressive strength test concerning the calculated Ultrasonic Pulse Velocity of the natural mordenite. The blue dashed line represents the lineal trend of the values, and the red dashed lines represent the limits set with 95% confidence.
In this estimation, if we were to obtain a UPV of 4.15 km/s, we would know with 95% confidence that the compressive strength value was between 34.27–42.32 MPa.
Table 4 shows the results of the estimated compressive strength calculated by Equation (11) for the UPV values obtained. In addition, the relative and absolute errors between the real and calculated values were obtained.
Table 4.
Results obtained for the statistical analysis of lineal regression.
The absolute and relative errors of the results obtained by lineal regression vary from 0.09 to 6.17 and from 0.34 to 15.21%, respectively. These errors represent an acceptable approximation for an estimate, for example, in a standard quality study.
The errors obtained in linear regression were inferior to those of exponential regression. However, the coefficient of determination of the linear regression was lower, which indicated a worse adjustment of the trend.
It is known that mortars made with pozzolanic cement acquire an increased resistance at greater curing ages compared to mortars without additions [20], so it is expected that at greater ages the estimate obtained with the linear regression would provide compression resistance values below the real ones.
4. Discussion
The article shows the results of the study of the velocity of ultrasonic waves in mortars composed of cement and pozzolanic additions. The velocity of ultrasonic waves was compared with the results of compression resistance tests from samples containing 25% pozzolanic additions.
The tests took place during the curing ages of 7 and 28 days. As was expected, both the compression resistance and the velocity of ultrasonic waves increased with the age. This shows an upward trend in the curve.
A correlation between the results of the UPV and compression tests can be observed. This correlation is studied through a statistical analysis using linear and exponential regressions through the method of least squares.
After study of the results with the linear and exponential regressions, the exponential regression was found to be more adequate, as it gives a higher coefficient of determination, meaning that it gives a more precise adjustment. This trend also matched the trend of the compression resistance of the pozzolanic mortars, which increased exponentially with the curing age.
We consider it possible to predict the compression resistance from the UPV values in mortars of pozzolanic cement since there is a strong correlation amongst the values obtained in both tests. Nevertheless, the results are not conclusive. This work establishes the basis to perform research with a higher number of samples and greater curing ages to confirm the existence of the exponential relationship between compression resistance and ultrasonic pulse velocity. Factors such as the uncertainty associated with the tests or the heterogeneity between the study samples should be included in future research to determine more precisely the formula that relates the UPV to the compressive strength of these materials.
Supplementary Materials
The following are available online at https://www.mdpi.com/article/10.3390/app11093747/s1, Table S1: Ultrasonic Pulse Velocity and compressive strength results of all tested specimens.
Author Contributions
Conceptualization, L.P., D.A.M. and J.L.C.; methodology, L.P.; software, L.P.; validation, D.A.M. and J.L.C.; formal analysis, L.P., D.A.M., and J.L.C.; investigation, L.P., D.A.M. and J.L.C.; resources, D.A.M. and J.L.C.; data curation, L.P., and D.A.M.; writing—original draft preparation, L.P., and J.L.C.; writing—review and editing, L.P., D.A.M. and J.L.C.; visualization, D.A.M., and J.L.C.; supervision, D.A.M., and J.L.C.; project administration, D.A.M., and J.L.C.; funding acquisition, D.A.M. and J.L.C. All authors have read and agreed to the published version of the manuscript.
Funding
This research received no external funding.
Institutional Review Board Statement
Not applicable.
Informed Consent Statement
Not applicable.
Acknowledgments
The authors acknowledge LOEMCO (Laboratorio Oficial para Ensayos de Materiales de Construcción) for their support in the testing.
Conflicts of Interest
The authors declare no conflict of interest. The funders had no role in the design of the study; in the collection, analyses, or interpretation of data; in the writing of the manuscript; or in the decision to publish the results.
References
- Taheri, H.; Shoaib, M.R.B.M.; Koester, L.W.; Bigelow, T.A.; Collins, P.C.; Bond, L.J. Powder-based additive manufacturing-a review of types of defects, generation mechanisms, detection, property evaluation and metrology. Int. J. Addit. Subtractive Mater. Manuf. 2017, 1, 172–209. [Google Scholar] [CrossRef]
- Dwivedi, S.K.; Vishwakarma, M.; Soni, A. Advances and researches on non destructive testing: A review. Mater. Today Proc. 2018, 5, 3690–3698. [Google Scholar] [CrossRef]
- Bogas, J.A.; Gomes, M.G.; Gomes, A. Compressive strength evaluation of structural lightweight concrete by non-destructive ultrasonic pulse velocity method. Ultrasonics 2013, 53, 962–972. [Google Scholar] [CrossRef]
- Carcaño, R.G.S.; Moreno, E.I.; Pak, W.R.C. Predicción de la resistencia del concreto con base en la velocidad de pulso ultrasónico y un índice de calidad de los agregados. Ingeniería 2004, 8, 41–52. [Google Scholar]
- Abo-Qudais, S.A. Effect of concrete mixing parameters on propagation of ultrasonic waves. Constr. Build. Mater. 2005, 19, 257–263. [Google Scholar] [CrossRef]
- Güçlüer, K. Investigation of the effects of aggregate textural properties on compressive strength (CS) and ultrasonic pulse velocity (UPV) of concrete. J. Build. Eng. 2020, 27, 100949. [Google Scholar] [CrossRef]
- Zima, B.; Kędra, R. Numerical Study of Concrete Mesostructure Effect on Lamb Wave Propagation. Materials 2020, 13, 2570. [Google Scholar] [CrossRef] [PubMed]
- Benaicha, M.; Jalbaud, O.; Alaoui, A.H.; Burtschell, Y. Correlation between the mechanical behavior and the ultrasonic velocity of fiber-reinforced concrete. Constr. Build. Mater. 2015, 101, 702–709. [Google Scholar] [CrossRef]
- Bohdan, S.; Tomasz, K. Determination of the influence of cylindrical samples dimensions on the evaluation of concrete and wall mortar strength using ultrasound method. Procedia Eng. 2013, 57, 1078–1085. [Google Scholar] [CrossRef]
- Nash’t, I.H.; A’bour, S.H.; Sadoon, A.A. Finding an unified relationship between crushing strength of concrete and non-destructive tests. In Proceedings of the 3rd MENDT—Middle East Nondestructive Testing Conference & Exhibition, Bahrain, Manama, 27–30 November 2005; pp. 27–30. [Google Scholar]
- Guerrero, A.G. Comportamiento de sólidos heterogéneos (hormigón) frente a solicitaciones ultrasónicas. Inf. Construcción 1981, 33, 43–54. [Google Scholar] [CrossRef][Green Version]
- Kheder, G.F. A two stage procedure for assessment of in situ concrete strength using combined non-destructive testing. Mater. Struct. 1999, 32, 410. [Google Scholar] [CrossRef]
- Hamid, R.; Yusof, K.M.; Zain, M.F.M. A combined ultrasound method applied to high performance concrete with silica fume. Constr. Build. Mater. 2010, 24, 94–98. [Google Scholar] [CrossRef]
- Omer, S.A.; Demirboga, R.; Khushefati, W.H. Relationship between compressive strength and UPV of GGBFS based geopolymer mortars exposed to elevated temperatures. Constr. Build. Mater. 2015, 94, 189–195. [Google Scholar] [CrossRef]
- Madandoust, R.; Mousavi, S.Y. Fresh and hardened properties of self-compacting concrete containing metakaolin. Constr. Build. Mater. 2012, 35, 752–760. [Google Scholar] [CrossRef]
- Rao, S.K.; Sravana, P.; Rao, T. Chandrasekhara. Experimental studies in Ultrasonic Pulse Velocity of roller compacted concrete pavement containing fly ash and M-sand. Int. J. Pavement Res. Technol. 2016, 9, 289–301. [Google Scholar] [CrossRef]
- Ranjbar, M.M.; Madandoust, R.; Mousavi, S.Y.; Yosefi, S. Effects of natural zeolite on the fresh and hardened properties of self-compacted concrete. Constr. Build. Mater. 2013, 47, 806–813. [Google Scholar] [CrossRef]
- UNE-EN 196-1. Methods of Testing Cements—Part. 1: Determination of Mechanical Resistance; The European Committee for Standardization: Brussels, Belgium, 2018. [Google Scholar]
- UNE-EN ISO 16810. Non-Destructive Testing—Ultrasonic Testing—General Principles; The European Committee for Standardization: Brussels, Belgium, 2014. [Google Scholar]
- Rivera, R.A.; Sanjuán, M.Á.; Martín, D.A. Granulated Blast-Furnace Slag and Coal Fly Ash Ternary Portland Cements Optimization. Sustainability 2020, 12, 5783. [Google Scholar] [CrossRef]
Publisher’s Note: MDPI stays neutral with regard to jurisdictional claims in published maps and institutional affiliations. |
© 2021 by the authors. Licensee MDPI, Basel, Switzerland. This article is an open access article distributed under the terms and conditions of the Creative Commons Attribution (CC BY) license (https://creativecommons.org/licenses/by/4.0/).