Abstract
This paper describes the assessment of radiofrequency (RF) electromagnetic field (EMF) exposure from fifth generation (5G) new radio (NR) base stations in a commercial NR network in Bern, Switzerland. During the measurement campaign, four base station sites were investigated and the exposure induced by the NR massive multiple-input-multiple-output (MaMIMO) antennas was assessed at 22 positions, at distances from the base station between 30 m and 410 m. The NR base stations operated at 3.6 GHz and used codebook-based beamforming. While the actual field levels without inducing downlink traffic were very low (<0.05 V/m) due to a low traffic load and low antenna input powers of up to 8 W, setting up a maximum downlink traffic stream towards user equipment resulted in a time-averaged exposure level of up to 0.4 V/m, whereas the maximum extrapolated exposure level reached 0.6 V/m. Extrapolated to an antenna input power of 200 W, values of 4.3 V/m and 4.9 V/m, respectively, were obtained, which amount to 0.5–0.6% of the reference level recommended by the International Commission on Non-Ionizing Radiation Protection (ICNIRP). In Bern, it was found that the impact of the NR network on the total environmental RF exposure was very limited; with maximum downlink, it contributed 2% on average. Finally, it was also concluded that extrapolation to the maximum exposure level can be done without prior knowledge of the radiation patterns, directly based on the measurement of the Physical Downlink Shared Channel (PDSCH) resource elements.
1. Introduction
Numerous studies have already been conducted regarding the everyday exposure to environmental radiofrequency (RF) electromagnetic fields (EMF) [1]. However, the advent of the fifth generation (5G) of wireless communications technologies, including the new radio (NR) radio access technology [2] and the widespread use of massive multiple-input-multiple-output (MaMIMO) and advanced antenna systems (AAS) as well as the opening up of new frequency bands, brings about questions from the general public on their additional contributions to the environmental RF exposure. Therefore, accurate characterization of the impact of the ongoing roll-out of 5G NR networks on our exposure to RF-EMF is essential, in particular for the communication of scientific [3,4,5] and legislative bodies [6] to the general public.
Several studies on the experimental assessment of the exposure due to NR base stations have been published in the past few years [7,8,9,10,11,12,13,14,15]. Furthermore, in [16], drive-test measurements in three NR networks operating in the 3.6 GHz band were performed, collecting samples of the transmit power (Tx) and of the synchronization signal reference signal received power (SS-RSRP) received by a mobile device, while millions of Tx power samples from user equipment were also recorded in two commercial NR networks in [17].
However, comprehensive data on the impact of a 5G NR network on the environmental RF-EMF exposure are still lacking. This study fills that gap by gathering both time-averaged and (extrapolated) maximum exposure levels, using the in situ measurement methodology for 5G NR MaMIMO base station exposure described in [13], in a commercial 5G NR network in Bern, Switzerland.
In short, the contributions of this paper are (a) the first assessment of RF-EMF exposure in a commercial NR network, (b) a range of time-averaged and maximum exposure values in a commercial NR network, extrapolated to maximum antenna input powers, and (c) an extrapolation method for which no information is needed from the operator, validated with the actual antenna radiation patterns.
2. Materials and Methods
2.1. Commercial 5G NR Network
This study was conducted in the Swisscom commercial 5G NR network in Bern, Switzerland, in July 2020. Four sites with Ericsson AIR 6488 NR MaMIMO base stations (BSs), representative of the network, were investigated. For each site, the BS antenna specifications were provided by the network operator.
The NR radios operated in the n78 band (3300–3800 MHz), which is part of Frequency Range 1 (FR1). The peak input powers of the BS antennas ranged from 1.6 W to 8.1 W (32.1–39.1 dBm). These powers are considerably lower than the BS radio product’s maximum rated power of 200 W, due to the restrictive EMF limits applicable in Switzerland. The BSs were further characterized by codebook-based beamforming configured with eight channel status information reference signal (CSI-RS) ports, with azimuthal beam steering.
Furthermore, an Oppo Reno4 Pro 5G mobile phone with 5G NR capability (further denoted as ‘UE’ (user equipment)) was used. With the iPerf3 tool (https://iperf.fr/, accessed on 15 April 2021), a downlink stream was set up using the User Datagram Protocol (UDP) from the BS to the UE at—in theory—100% capacity of Physical Downlink Shared Channel (PDSCH) resource usage.
2.2. Measurement Positions
In total, 22 measurement positions were selected, 20 of which were at ground level in line-of-sight (LOS) of an NR BS, and two of which were on the roof of a building (both in LOS) at a height of 19 m above ground level (excluding the 1.5 m height of the measurement antenna). Since the BS configurations in the considered network were limited to azimuthal beam steering, the measurement probe and the UE were positioned along the same line with respect to the BS, under the assumption that this would direct the PDSCH beam towards the measurement probe while servicing the UE. The separation distance between the UE and the probe ranged from 10 m to 172 m (on average, 53 m).
2.3. Measurement Method
The measurement method for the assessment of 5G NR base station exposure was described in detail in [13]. A short summary is given below:
- Step 1 ‘Spectrum overview’—A spectrum overview measurement in the frequency range between 700 MHz and 6 GHz to identify the RF environment in general and the NR signals in particular at the measurement site.
- Step 2 ‘Identification of the Synchronization Signal Block (SSB) (or Synchronization Signal (SS) burst)’—For each present NR signal, an in-band measurement to detect the bandwidth (and therefore the numerology or subcarrier spacing (SCS)) and frequency position () of the channel’s SSB or SS burst, as well as the channel bandwidth.
- Step 3 ‘Assessment of the electric-field level per resource element (RE) of the (dominant) SSB and PDSCH’—For each present NR signal, a measurement of the electric-field strength per resource element of the (dominant) SSB (of the SS burst) as well as of the PDSCH was taken.
- Step 4 ‘Assessment of the time-averaged electric-field level’—For each present NR signal, the time-averaged electric-field strength over the channel bandwidth was measured. The applicable averaging time is specified by the exposure standards (e.g., 6 min or 30 min for localized and whole-body exposure, respectively, according to [3]). However, for convenience, in this work, an averaging time in the order of 30 s was used since it was found that this provided an accurate estimate of exposure when time-averaged over 6 min or 30 min. Time averaging over periods different than what was given by the relevant exposure standards can be used provided that this results in a reliable estimate of exposure [3,18].
- Step 5 ‘Post-processing’—Post-processing of data and calculation of the maximum theoretical electric-field level , using eitherwith
- the maximum number of resource blocks used in the channel bandwidth (depends on the bandwidth and the numerology),
- the electric-field level per RE in the dominant SSB of the SS burst, i.e., the SS beam with the highest gain in the direction of the evaluation point (hence resulting in the maximum ),
- the (maximum) gain of the PDSCH-allocated resources transmitted by the BS radio in the direction of the evaluation point,
- the gain of the SS beam in the direction of the evaluation point,
or
Equation (1) represents the theoretical extrapolation, useful when only can be measured and the antenna patterns of the SSB and PDSCH signals have been provided to calculate the factor at the point of evaluation. Equation (2), on the other hand, is the experimental extrapolation and is based on the direct measurement of at the point of evaluation.
2.4. Measurement Setup
The measurement setup used to characterize the RF exposure from NR base stations consisted of a Rohde and Schwarz FSV spectrum and signal analyzer (FSV30) connected to a tri-axial Satimo INSITE Free electric-field probe (with a nominal frequency range of 2 GHz to 6 GHz and a dynamic range of 5 mV/m to 200 V/m; Figure 1) and a laptop with Matlab software to control the measurement equipment. The R&S FSV30 came with an optional R&S FSV-K14 to use in ‘spectrogram mode’ in order to store a high number of measurement traces (up to 20,000 for the R&S FSV-30) and exporting them with a minimal blind time between traces. The expanded measurement uncertainty of this setup is ±3 dB [19,20], and the measurement settings for each step can be found in [13].
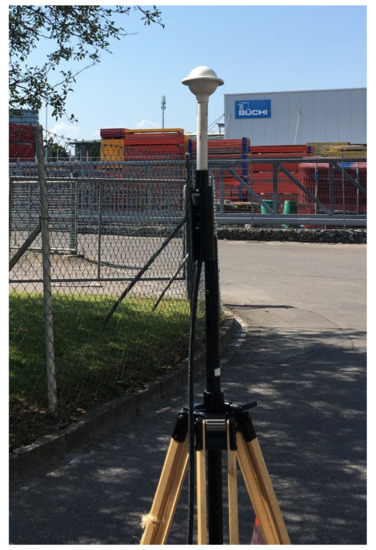
Figure 1.
Tri-axial Satimo INSITE Free electric-field probe (at a height of 1.5 m) in line-of-sight of a fifth generation new radio base station in Bern, Switzerland.
In addition, the contributions of other frequency bands used by wireless telecommunications, present at the measurement sites, to the RF exposure were characterized using a Narda SRM-3006 field strength analyzer with a three-axis electric-field antenna of type Narda 3502/01 (frequency range: 420 MHz–6 GHz; dynamic range: 0.14 mV/m–160 V/m). The measurement uncertainty of this setup is also ±3 dB. For this type of measurement, a frequency range of 600 MHz to 4 GHz, a resolution bandwidth (RBW) of 300 kHz, and an averaging time of 6 min were selected. The sweep time (SWT; i.e., the duration of a single measurement trace) of the SRM cannot be configured and amounted here to 1104 ms. Finally, it should be noted that the SRM measurements were performed simultaneously with the FSV spectrum analyzer measurements detailed above, but at other positions assumed to lie within the same PDSCH beam. The average distance between the simultaneous measurement positions was 18.5 m (range: 1.6–64.0 m).
3. Results
3.1. Characterization of the 5G NR Signal
The spectrum overview measurements performed once at each site showed similar RF environments. RF signals were detected in the following telecommunications bands: 800 MHz (Long Term Evolution, LTE), 900 MHz (Global System for Mobile Communications (GSM) and LTE), 1800 MHz (LTE), 2100 MHz (Universal Mobile Telecommunications System, UMTS), 2400 MHz (Wireless Fidelity, Wi-Fi), 2600 MHz (LTE), and 3500 MHz (NR), the latter of which contained the 5G NR signals to be evaluated. The other bands were accurately characterized using the SRM-3006 analyzer (Table 1).

Table 1.
Minimum and maximum average electric-field levels () measured for various frequency bands used for wireless telecommunications, as well as the average contribution of these bands to the total environmental RF-EMF exposure.
A closer look at the 100 MHz-wide signal around 3.6 GHz (Figure 2) revealed [13] the position of the SSB at the start of the channel bandwidth (Figure 3), namely at = 3604.8 MHz (with corresponding global synchronization channel number (GSCN) of 7919). Furthermore, its width of ∼7 MHz indicated an SCS of 30 kHz (Figure 3). This was checked and observed at each of the investigated sites.
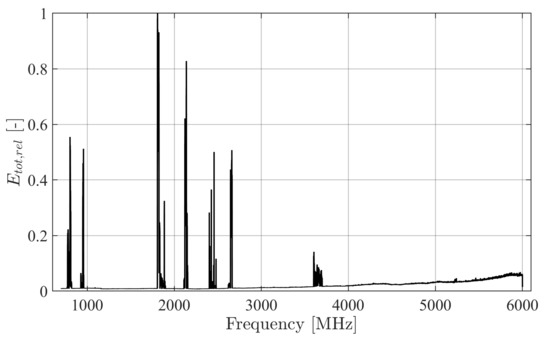
Figure 2.
Spectrum overview between 700 MHz and 6 GHz at one of the investigated sites with a fifth generation (5G) new radio (NR) base station. Here, the total electric-field level (i.e., the vector sum of the three orthogonal components) was normalized to the maximum. Besides the NR signal around 3.6 GHz, other radiofrequency (RF) signals were observed in the telecommunications bands at 800, 900, 1800, 2100, 2400, and 2600 MHz. Similar results were obtained at the three other sites.
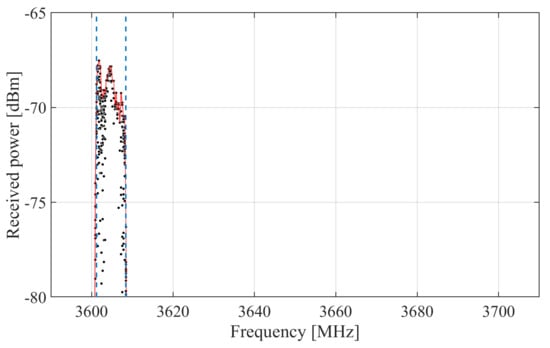
Figure 3.
Samples (black dots, with the envelope indicated by a red dotted line) measured with the FSV spectrum analyzer along one electric-field component that are a part of a four-symbol long signal, i.e., the length of a synchronization signal block (SSB). This way, the frequency position and subcarrier spacing (SCS) of the SSB can be deduced: in this case, the SSB has a center frequency 3604.8 MHz and has an apparent width of 7 MHz (delineated by the two blue dashed lines), indicating an SCS of 30 kHz.
3.2. Maximum Exposure
3.2.1. Electric-Field Strength per Resource Element
To determine the electric-field strength per RE allocated to SSB () and PDSCH (), zero-span measurements were performed with the FSV at the SSB’s center frequency of 3604.8 MHz (Figure 3) with a resolution bandwidth of 1 MHz. At an SCS of 30 kHz (as determined in the previous section), the average power received per subcarrier, , can be calculated from the measurement samples using
Whereas for the SSB symbols, the average power per resource element is equal to , as all subcarriers within the measured bandwidth were allocated to the SSB at these time instances, in the case of PDSCH, , since the actual allocation is unknown.
Each successive trace of roughly 1 s measured by the FSV was post-processed such that the samples were aligned with the 5G NR frame structure and stacked per SSB period of 20 ms (‘waterfall diagram’ [13]). This post-processing step, which is illustrated in Figure 4, enables one to distinguish between the SSB (which is four Orthogonal Frequency Duplexing Multiplexing (OFDM) symbols long) and the PDSCH resources. In this case, there was only one cell-wide SSB, i.e., the narrow band with a length of four symbols within the first of two slots of the first subframe ‘0’ (on the far left of Figure 4). The PDSCH-allocated symbols, on the other hand, form multiple thicker bands each consisting of four successive slots, with 10 (in the case of a special ‘S’ slot) or 14 symbols (a normal downlink ‘D’ slot). The varying color and sometimes gaps in Figure 4 further illustrate the varying allocation of PDSCH resources within the measured bandwidth. Furthermore, from Figure 4 the TDD pattern ‘DDDSU’ can be observed (where an ‘S’-slot contains 10 downlink symbols) and a TDD factor of 0.74 is obtained.
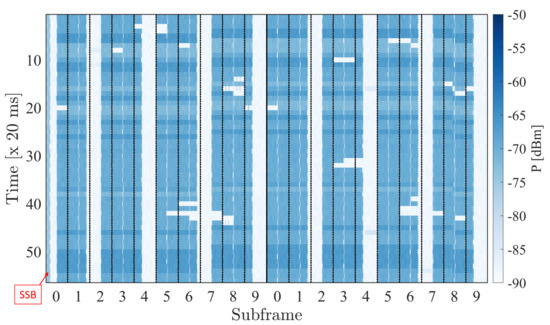
Figure 4.
‘Waterfall diagram’ plot [13] of a zero-span trace of 1.1 s (55 × 20 ms) measured with the FSV setup in a 1 MHz-bandwidth around the SSB center frequency. Successive pairs of NR frames (i.e., 2 × 10 ms, with each frame containing 20 slots (two per subframe) of 14 Orthogonal Frequency Duplexing Multiplexing (OFDM) symbols) are stacked on top of each-other. The four-symbol long SSB is visible on the left. The other bands show a clear DDDSU pattern, with three downlink (D) slots, one special (S) slot (which contains 10 downlink symbols), and one (empty) uplink (U) slot.
For each field component k (), was determined as the median of the identified SSB samples, whereas required an additional post-processing step: for each PDSCH slot (identified using the aforementioned ‘waterfall’ method [13]) the median power of the slot’s symbols was retained, after which the highest Gaussian was determined in the distribution of these median powers [13]—using the findpeaks command in Matlab. The electric-field values per RE and per component were obtained using the antenna factor (AF) and cable losses of the measurement equipment and the vector sum of the components then resulted in the total [13]. Figure 5 shows the two resulting for each measurement position. For PDSCH resources, the highest was 0.012 V/m, for SSB resources 0.008 V/m. The difference in (assumed due to the difference in antenna gain) was generally about 4 dB, in particular in LOS and within the BS radio scanning range. Outside the scanning range, there was more variation, ranging between 1 dB and 8 dB. The values were the lowest at the two NLOS positions, one within and one outside the scanning range, with differences of 0.5 and 2.8 dB, respectively. However, in NLOS, the measured signals were very close to the noise level, which resulted in a higher uncertainty.
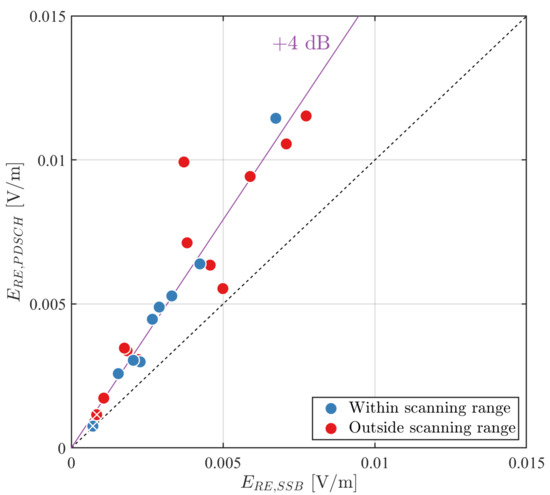
Figure 5.
Scatterplot of the electric-field strength per resource element for the Physical Downlink Shared Channel (PDSCH) signals versus the of the SSB signals at each measurement location. The locations were grouped by their relative position to the NR base station: within (blue dots) or outside its scanning range (red dots). Markers with a white X depict positions in non-line-of-sight. The purple line depicts a +4 dB difference between and .
3.2.2. Extrapolation to the Maximum Electric-Field Strength
The maximum theoretical electric-field strength was then extrapolated both from using Equation (1), with the factor based on antenna patterns provided by the base station manufacturer, and from using Equation (2). In addition, = 273 (as the NR channel bandwidth was 100 MHz and the SCS 30 kHz) and = 0.74 (Figure 4). A comparison of the two extrapolation methods is shown in Figure 6.
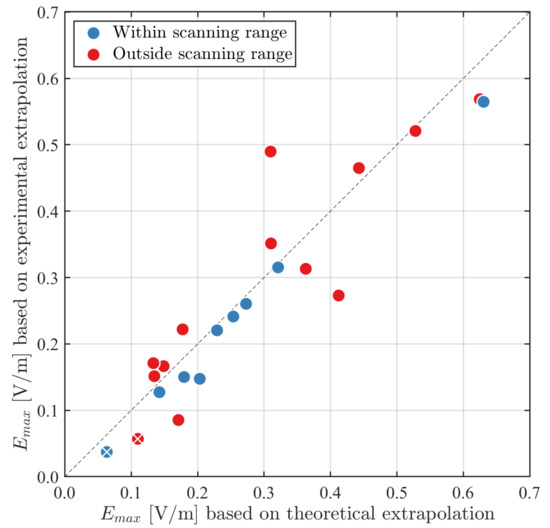
Figure 6.
Scatterplot of the maximum electric-field strength , using the experimental extrapolation—based on the direct measurement of (Equation (2))—versus the theoretical extrapolation—based on the difference in antenna gain, derived from the antenna patterns (Equation (1)). The locations were grouped by their relative position to the NR base station: within (blue dots) or outside its scanning range (red dots). Markers with a white X depict positions in non-line-of-sight.
The agreement in was usually very good, particularly within the BS scanning range (Figure 6). In fact, the absolute relative error between the two extrapolation methods was just 1.4 dB and the correlation coefficient was 0.92. For positions within the scanning range of the BS, these values even improved to 0.9 dB and 0.99.
Furthermore, the extrapolated maximum field levels ranged between 0.1 V/m and 0.6 V/m in LOS of the BS (Figure 6), which amount to less than 0.01% of the ICNIRP reference level [3] (in the far-field region, a power density S of 10 W/m is equivalent to an electric-field strength E of 61 V/m). In NLOS, on the other hand, the maximum field levels were extremely low (∼0.1 V/m).
3.3. Average Exposure
At each position, the time-averaged electric-field strength was measured both without an active UE (i.e., the actual exposure case) and when maximizing the downlink stream (in theory up to 100%) to the UE (i.e., the maximum exposure). As the signals were relatively stable, an averaging time of 30 s per electric-field component was chosen. The resulting ranges of are shown in Figure 7. Without inducing traffic at the measurement location, was very low; the maximum was only 0.05 V/m. Furthermore, in NLOS, the electric-field level did not increase much when inducing 100% downlink traffic, whereas in LOS, the field levels increased by 13 to 43 dB (on average 28 dB), and a maximum of 0.5 V/m was found, while the average was 0.3 V/m.
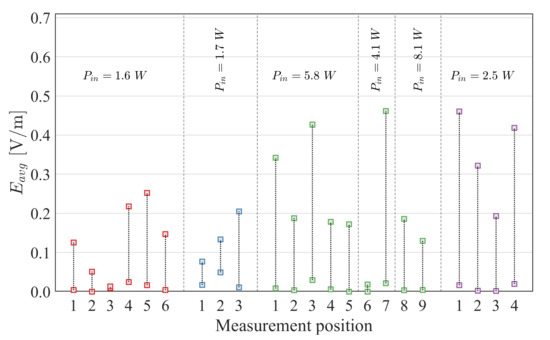
Figure 7.
Range of average electric-field strengths measured at each measurement position. The antenna input power is also given. Two positions were in non-line-of-sight: the 3rd at the first site (red), and the 6th at the third site (green).
In Figure 8, the values were normalized to an antenna input power of 1 W and shown as a function of the horizontal distance to the NR base station. The normalized maximum was observed at a distance of approximately 190 m—outside of the scanning range—although large variations were observed at this distance.
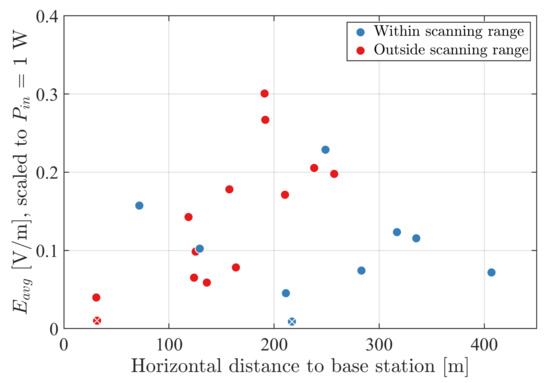
Figure 8.
Average electric-field strength , measured during 100% downlink traffic directed towards the user equipment (UE), normalized to an antenna input power of 1 W, as a function of the horizontal distance to the NR base station. The locations were grouped by their relative position to the NR base station: within (blue dots) or outside its scanning range (red dots). Markers with a white X depict positions in non-line-of-sight.
Finally, the values measured by the FSV during 100% downlink were compared to the (experimentally) extrapolated values based on and Equation (2) (Figure 9). The extrapolated values were higher overall, but the deviation was limited to a maximum of 3.5 dB in LOS, whereas the differences at the two positions in NLOS were much higher (up to 9 dB), which may be due to the uncertainty of the measurements close to the measurement setup’s noise level.
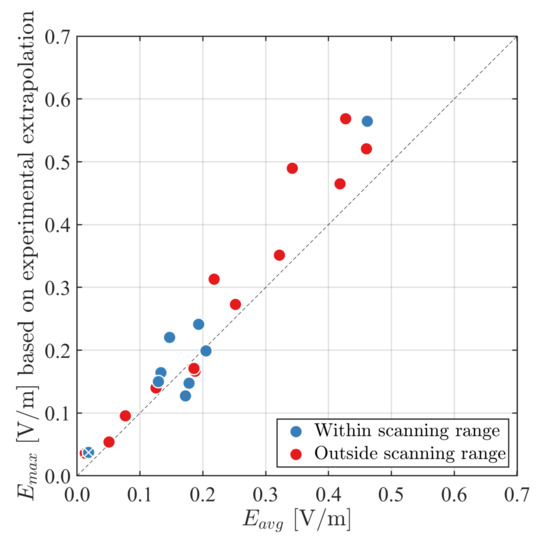
Figure 9.
Scatterplot of the maximum electric-field strength , extrapolated using Equation (2) and based on the field strength per resource element of the PDSCH, versus the maximum time-averaged electric-field strength , measured during 100% downlink traffic directed towards the UE. The locations were grouped by their relative position to the NR base station: within (blue dots) or outside its scanning range (red dots). Markers with a white X depict positions in non-line-of-sight.
3.4. Impact of the NR Network on the Environmental RF-EMF Exposure
As shown in the previous section, the exposure levels induced by the commercial NR network are low in comparison to the ICNIRP reference level at the considered frequency for the general public of 10 W/m (equivalent to 61 V/m in the far-field region) [3]. However, to assess the impact of the NR network on the existing environmental RF-EMF exposure caused by wireless telecommunications networks, additional SRM measurements were conducted at 15 positions to assess the contributions of the different frequency bands used by these networks.
Without any induced downlink traffic—assuming the presence of 5G NR users on the network was negligible—the contribution of the commercial NR network to the environmental exposure was negligible (Table 1, values are in agreement with Figure 7) as was expected from a technology with such sparse broadcast signaling [2] and possibly PDSCH signals beamsteered towards other users. Nonetheless, even with 100% downlink traffic at the evaluation point, which is the extreme case, the additional exposure remained limited: with a maximum value of 0.4 V/m—also in agreement with Figure 7—the largest contribution of the 3.5 GHz band was only 9.5% of the total field; and the average contribution of the NR network was just 2% (Table 1).
4. Discussion
In this study, the environmental radiofrequency (RF) electromagnetic field (EMF) exposure was evaluated in a commercial fifth generation (5G) new radio (NR) network in and around Bern, Switzerland. To this end, the time-averaged actual () and extrapolated maximum electric-field levels () attributed to an NR signal were assessed at 22 positions in the vicinity of four NR base stations, using the methods described in [13]. At each site, the specifications of the NR channel (bandwidth of 100 MHz) and its ‘always-on’ broadcast signal (the synchronization signal block (SSB), with center frequency 3604.8 MHz and subcarrier spacing 30 kHz) were identified. Then, the electric-field strengths per resource element () allocated to either the SSB or the physical downlink shared channel (PDSCH, the downlink traffic signals) were measured, after which they were both extrapolated to —using for the antenna patterns provided by the radio equipment manufacturer (Equation (1))—considering the worst-case scenario of a continuously full PDSCH-allocated channel bandwidth (i.e., ‘100% downlink’), and also taking into account the experimentally derived time division duplex (TDD) factor of 0.74. Finally, the values were compared to the values that were measured while inducing a 100% downlink traffic stream to a user equipment (UE) using the iPerf3 application.
Without inducing any downlink traffic, the actual exposure levels were very low, with a maximum of just 0.05 V/m (Figure 7), and the contribution to the environmental RF exposure was small (Table 1). A similar value of 5 W/m or 0.04 V/m for the exposure to the SSB was found in [16]. When a maximum downlink load was generated towards a UE on the same line as the measurement probe with respect to an NR base station, increased to maximally 0.4 V/m, which still only contributed 9.5% to the total environmental RF exposure as measured at the four investigated sites (Table 1). Furthermore, the highest extrapolated maximum field level observed in the network was 0.6 V/m. Finally, the highest normalized (to an antenna input power of 1 W) was found at a distance of 190 m from an NR base station, although there was a large variation between field levels at about this distance.
Despite some differences in the measurement settings and measurement positions, the exposure levels measured with the SRM-3006 and FSV spectrum analyzer were in good agreement.
It is important to note that the reported values are specifically true for the Swisscom commercial 5G NR network in Bern, Switzerland, as it was at the time of the measurements (July 2020). The MaMIMO base stations were characterized by codebook-based beamforming configured with eight CSI-RS ports (with only azimuthal beam steering) and limited input powers (in fact, the maximum was 8.1 W) due to the restrictive exposure limits that apply in Switzerland. In commercial NR networks in other areas or countries, may very well be much higher. Extrapolating the electric-field levels measured in this study to a common maximum of 200 W, maximum and (based on Equation (1)) values of respectively 4.3 V/m (0.05 W/m) and 4.9 V/m (0.06 W/m) were obtained, i.e., exposure levels 150–200 times below the ICNIRP reference level of 10 W/m (61 V/m) at 3.5 GHz [3].
When inducing 100% downlink traffic transmission, and were generally in good agreement (Figure 9). However, because the iPerf3 application could not guarantee a constant allocation of 100% to the PDSCH resources (Figure 4), was almost always higher and thus the more conservative metric.
Furthermore, a good agreement was found between the theoretical extrapolation of to using ratio of the radiation patterns of the PDSCH and SSB beams (Equation (1)) and the experimentally determined based on the direct measurement of (Figure 6). Therefore, extrapolation to the maximum exposure level can be done without prior knowledge of the radiation patterns—knowledge of , the subcarrier spacing, the channel bandwidth, and the TDD factor are, in fact, sufficient to estimate .
However, outside the scanning range of the BS radio and/or in non-line-of-sight (NLOS), the following factors need to be considered: First, in a complex environment characterized by multiple reflections, the selected beam that maximizes the field strength at the measurement location might not correspond to the direct beam obtained assuming LOS. Second, multi-layer transmissions (i.e., different PDSCH beams transmitted in different directions, using reflections/diffractions to reach the UE) might result in a different measured compared to the more invariable (since the SSB beams are fixed) than expected from the radiation patterns. And finally, the accuracy of the radiation patterns at angular directions outside the scanning range, characterized by gain values well below the peak, is likely also characterized by a larger uncertainty. Therefore, in locations in NLOS or outside the scanning range of the BS radio, the experimental extrapolation to is likely to provide a more accurate evaluation of the worst-case exposure, as it is based on actual measurements.
In addition, the influence of SSBs that were simultaneously transmitted by the other sector antennas, or even from other sites, on the measurement of was assumed to be negligible. However, the slightly higher values obtained from the theoretical extrapolation (Figure 6) may be caused by these additional contributions to . This could be confirmed using a dedicated 5G NR decoder that can measure directly the receiver power per RE of the particular SSB.
Finally, when the objective of the assessment is to measure the maximum actual transmit power, the values obtained using the methods described in this paper and in [13] (i.e., the theoretical maximum) shall be scaled with the relevant power reduction factor as described by the working draft of the International Electrotechnical Commission standard IEC 62232 [8,9,15].
5. Conclusions
To the authors’ knowledge, this study provides the first assessment of the range of actual and maximum exposure levels in a 5G NR commercial network. It was found that the impact of the investigated network on the total environmental RF-EMF exposure was small, only a few percent of the total RF-EMF exposure even in the case of 100% induced traffic. Moreover, an extrapolation method was demonstrated for which no prior information from the network provider or radio equipment manufacturer is necessary, validated using the actual antenna radiation patterns.
In the (near) future, as 5G technologies evolves (e.g., when introducing reciprocity-based beamforming and other advanced MaMIMO techniques), some aspects of the presented methodology, such as the position of the UE relative to the base station and measurement probe, the averaging time to assess , and the use of the UE to stimulate the maximum exposure scenario may also have to be amended. In addition, we are confident that the described procedure is valid also at frequencies in Frequency Range 2 (FR2), above 24 GHz (‘mmWaves’), provided that the measurement settings are adjusted to account for wider channel bandwidths as well as larger SCS. However, a comprehensive in situ validation study remains essential.
Author Contributions
Conceptualization, S.A., D.C., C.T., and W.J.; methodology, S.A., D.C., and L.V.; formal analysis, S.A.; investigation, S.A., K.D., and M.V.d.B.; data curation, S.A.; writing—original draft preparation, S.A.; writing—review and editing, all; visualization, S.A.; supervision, D.C., L.M., C.T., and W.J.; project administration, D.C., C.T., and W.J.; funding acquisition, D.C., C.T., and W.J. All authors have read and agreed to the published version of the manuscript.
Funding
This work was supported by the Mobile & Wireless Forum (MWF). The work of S. Aerts was supported by the Flemish Research Foundation (Fonds Wetenschappelijk Onderzoek, FWO) and the Special Research Fund (Bijzonder Onderzoeksfonds, BOF).
Acknowledgments
The authors would like to thank Peter Fritschi, Erwin Mülhauser, Benedikt Langenbach, Andreas Albrecht, Andreas Müller and Cedar Urwyler (Swisscom), Hugo Lehmann (now METAS), and Massimo Giovacchini, Ivan Primorac, and Luca Peruffo (Ericsson Switzerland) for their on- and off-site support.
Conflicts of Interest
The authors declare no conflict of interest. The funders had no role in the design of the study; in the collection, analyses, or interpretation of data; in the writing of the manuscript, or in the decision to publish the results.
Abbreviations
The following abbreviations are used in this manuscript:
| 5G | Fifth Generation |
| AAS | Advanced Antenna Systems |
| BS | base station |
| DL | downlink |
| EMF | electromagnetic fields |
| FR | Frequency Range |
| G | Gain |
| GSCN | Global Synchronization Channel Number |
| GSM | Global System for Mobile Communications |
| ICNIRP | International Commission on Non-Ionizing Radiation Protection |
| IEC | International Electrotechnical Commission |
| LOS | line-of-sight |
| LTE | Long-Term Evolution |
| MaMIMO | Massive MIMO |
| MIMO | Multiple-Input-Multiple-Output |
| NLOS | non-line-of-sight |
| NR | New Radio |
| OFDM | Orthogonal Frequency Duplexing Multiplexing |
| PDSCH | Physical Downlink Shared Channel |
| RB | Resource Block |
| RBW | resolution bandwidth |
| RE | resource element |
| RF | radiofrequency |
| SCS | subcarrier spacing |
| SS | Synchronization Signal |
| SSB | SS Block |
| SWT | sweep time |
| TDD | time division duplexing |
| UDP | User Datagram Protocol |
| UE | user equipment |
| UL | uplink |
| UMTS | Universal Mobile Telecommunications System |
| WHO | World Health Organization |
| Wi-Fi | Wireless Fidelity |
References
- International Agency for Research on Cancer (IARC). Non-ionizing Radiation, Part 2: Radiofrequency Electromagnetic Fields. In IARC Monographs on the Evaluation of Carcinogenic Risks to Humans; IARC: Lyon, France, 2013; Volume 102. [Google Scholar]
- 3rd Generation Partnership Project (3GPP), Technical Specifications (TS) Series 38. Available online: https://www.3gpp.org/DynaReport/38-series.htm (accessed on 15 April 2021).
- International Commission on Non-ionizing Radiation Protection (ICNIRP). Guidelines for limiting exposure to electromagnetic fields (100 kHz to 300 GHz). Health Phys. 2020, 118, 483–524. [Google Scholar] [CrossRef] [PubMed]
- IEEE Standard for Safety Levels with Respect to Human Exposure to Electric, Magnetic, and Electromagnetic Fields; IEEE Std C95.1-2019; IEEE: Piscataway, NJ, USA, 2019.
- Evaluating Compliance with FCC Guidelines for Human Exposure to Radiofrequency Electromagnetic Fields, Federal Communication Commission (FCC), OET Bulletin 65, Edition 97-01; Federal Communications Commission, Office of Engineering & Technology: Washington, DC, USA, 1997.
- 1999/519/EC: Council Recommendation of 12 July 1999 on the Limitation of Exposure of the General Public to Electromagnetic Fields (0 Hz to 300 GHz). Available online: https://eur-lex.europa.eu/LexUriServ/LexUriServ.do?uri=OJ:L:1999:199:0059:0070:EN:PDF (accessed on 15 April 2021).
- Degirmenci, E.; Thors, B.; Törnevik, C. Assessment of compliance with RF EMF exposure limits: Approximate methods for radio base station products utilizing array antennas with beam-forming capabilities. IEEE Trans. Electromagn. Compat. 2016, 58, 1110–1117. [Google Scholar] [CrossRef]
- Thors, B.; Furuskär, A.; Colombi, D.; Törnevik, C. Time-averaged realistic maximum power levels for the assessment of radio frequency exposure for 5G radio base stations using Massive MIMO. IEEE Access 2017, 5, 19711–19719. [Google Scholar] [CrossRef]
- Baracca, P.; Weber, A.; Wild, T.; Grangeat, C. A statistical approach for RF exposure compliance boundary assessment in Massive MIMO systems. In Proceedings of the 22nd International ITG Workshop Smart Antennas (WSA), Bochum, Germany, 14–16 March 2018; pp. 1–6. [Google Scholar]
- Persia, S.; Carciofi, C.; D’Elia, S.; Suman, R. EMF evaluations for future networks based on Massive MIMO. In Proceedings of the 2018 IEEE 29th Annual International Symposium on Personal, Indoor and Mobile Radio Communications (PIMRC), Bologna, Italy, 9–12 September 2018; pp. 1197–1202. [Google Scholar]
- Pawlak, R.; Krawiec, P.; Zurek, J. On measuring electromagnetic fields in 5G technology. IEEE Access 2019, 7, 29826–29835. [Google Scholar] [CrossRef]
- Keller, H. On the assessment of human exposure to electromagnetic fields transmitted by 5G NR base stations. Health Phys. 2019, 117, 541–545. [Google Scholar] [CrossRef] [PubMed]
- Aerts, S.; Verloock, L.; den Bossche, M.V.; Colombi, D.; Martens, L.; Törnevik, C.; Joseph, W. In-situ measurement methodology for the assessment of 5G NR massive MIMO base station exposure at sub-6 GHz frequencies. IEEE Access 2019, 7, 184658–184667. [Google Scholar] [CrossRef]
- Adda, S.; Aureli, T.; D’elia, S.; Franci, D.; Grillo, E.; Migliore, M.D.; Pavoncello, S.; Schettino, F.; Suman, R. A Theoretical and Experimental Investigation on the Measurement of the Electromagnetic Field Level Radiated by 5G Base Stations. IEEE Access 2020, 8, 101448–101463. [Google Scholar] [CrossRef]
- Shikhantsov, S.; Thielens, A.; Aerts, S.; Verloock, L.; Torfs, G.; Martens, L.; Demeester, P.; Joseph, W. Ray-tracing-based numerical assessment of the spatiotemporal duty cycle of 5G massive MIMO in an outdoor urban environment. Appli. Sci. 2020, 10, 7631. [Google Scholar] [CrossRef]
- Lee, A.-K.; Jeon, S.-B.; Choi, H.-D. EMF Levels in 5G New Radio Environment in Seoul, Korea. IEEE Access 2021, 9, 19716–19722. [Google Scholar] [CrossRef]
- Joshi, P.; Ghasemifard, F.; Colombi, D.; Törnevik, C. Actual Output Power Levels of User Equipment in 5G Commercial Networks and Implications on Realistic RF EMF Exposure Assessment. IEEE Access 2020, 8, 204068–204075. [Google Scholar] [CrossRef]
- Verloock, L.; Joseph, W.; Vermeeren, G.; Martens, L. Procedure for assessment of general public exposure from WLAN in offices and in wireless sensor network testbed. Health Phys. 2010, 98, 628–638. [Google Scholar] [CrossRef] [PubMed]
- Basic Standard for the In-Situ Measurement of Electromagnetic Field Strength Related to Human Exposure in the Vicinity of Base Stations; CENELEC EN 50492:2008+A1:2014; CENELEC: Brussels, Belgium, 2014.
- Joseph, W.; Verloock, L.; Goeminne, F.; Vermeeren, G.; Martens, L. In situ LTE exposure of the general public: Characterization and extrapolation. Bioelectromagnetics 2012, 33, 466–475. [Google Scholar] [CrossRef] [PubMed]
Publisher’s Note: MDPI stays neutral with regard to jurisdictional claims in published maps and institutional affiliations. |
© 2021 by the authors. Licensee MDPI, Basel, Switzerland. This article is an open access article distributed under the terms and conditions of the Creative Commons Attribution (CC BY) license (https://creativecommons.org/licenses/by/4.0/).