Abstract
In order to find out the influence of subgrade frost heave on the deformation of track structure and track irregularity of high-speed railways, a nonlinear damage finite element model for China Railway Track System III (CRTSIII) slab track subgrade was established based on the constitutive theory of concrete plastic damage. The analysis of track structure deformation under different subgrade frost heave conditions was focused on, and amplitude the limit of subgrade frost heave was put forward according to the characteristics of interlayer seams. This work is expected to provide guidance for design and construction. Subgrade frost heave was found to cause cosine-type irregularities of rails and the interlayer seams in the track structure, and the displacement in lower foundation mapping to rail surfaces increased. When frost heave occured in the middle part of the track slab, it caused the greatest amount of track irregularity, resulting in a longer and higher seam. Along with the increase in frost heave amplitude, the length of the seam increased linearly whilst its height increased nonlinearly. When the frost heave amplitude reached 35 mm, cracks appeared along the transverse direction of the upper concrete surface on the base plate due to plastic damage; consequently, the base plate started to bend, which reduced interlayer seams. Based on the critical value of track structures’ interlayer seams under different frost heave conditions, four control limits of subgrade frost heave at different levels of frost heave amplitude/wavelength were obtained.
1. Introduction
Frozen soil regions are widely distributed throughout the world and are found in places such as Russia, Canada, China, Alaska, and Japan [1,2,3]. Permafrost and seasonal frozen soil cover about 21.5% and 53.5% of China’s land area [4], respectively. The soil mass of subgrade in frozen soil regions expands due to water freezing under low temperature loads; this is referred to as subgrade frost heave, which leads to the deviation of the design elevation of subgrade surfaces and affects the safety of high-speed railway train operations [5]. In recent years, increasing high-speed railways have been established in the frozen soil regions of China, and the operation mileage has exceeded 3000 km [6]. In addition, there are plans such as the Belt and Road Initiative plan to build high-speed railways from China to Moscow and the rest of Europe, with a total length of more than 15,000 km [7,8,9], as shown in Figure 1. CRTSIII slab track will be used as the main track structure in these projects, which will pass through alpine regions where the average temperature in the coldest month in China is less than −10 °C, or the average daily temperature is not higher than 5 °C for more than 145 days. Frost heave in the soil mass is inevitable in these places. Excessive displacement caused by subgrade frost heave will cause the uneven displacement of slab track structures and could even lead to crack failure in the concrete [10]. A field survey of the Harbin–Dalian high-speed railway showed that the slab track concrete had broken away in some sections, as shown in Figure 1, which could in turn seriously affect the slab track’s service performance. It is therefore necessary to pave and maintain the slab track in severely cold regions in order to study the deformation and seams in the track structure of high-speed railways under subgrade frost heave and put forward control limits for subgrade frost heave displacements in frozen soil regions.
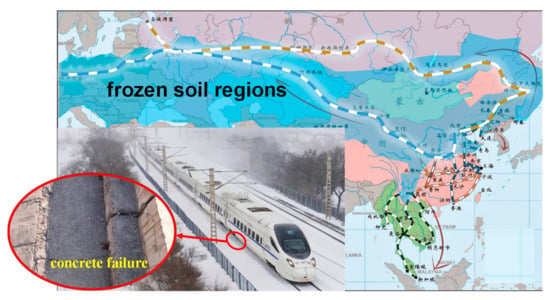
Figure 1.
Distribution of high-speed railway in frozen soil regions.
Presently, most research on the subgrade frost heave displacement of high-speed railways has focused on the influential factors of frost heave formation and its developmental process [11,12,13]. A number of measures to reduce frost heave displacement, such as improving soil properties, temperature control and drainage, have been put forward [14,15,16,17,18]. Further, research on the influence of subgrade deformation on track structure has mainly analyzed subgrade settlement. For instance, Dahlberg [19] and Li [20] studied the deformation law of ballasted track under subgrade settlement using the finite element method. Wang et al. predicted the long-term settlement of the track in transition zones and researched this dynamic behavior [21,22]. Based on the discrete element method, Fu et al. [23] discussed the influence of train load on track surface deformation during the settlement of ballasted track subgrade. Cai et al. [24] investigated the relationship between different conditions of subgrade settlement and track irregularities by establishing double-block slab track on subgrade. Chen et al. [25] explored the settlement limits of subgrade based on the bending moment of longitudinally connected slab track. Guo et al. [26] used Winkler’s foundation composite beam theory and calculated the track surface geometric deformation law of unit plates and longitudinal connected slab track under different types of subgrade settlement. Based on the theory of vehicle–track coupling dynamics and using the finite element method, Gao et al. [27] established an explicit dynamic analysis model for vehicle–slab track subgrade in the frost heaving area and researched the influence of frost heave amplitude and wavelength on the dynamic response of the vehicle track. Zhao et al. [28] revealed the deformation characteristics of unit slab track under subgrade settlement and also analyzed the influence of structural thickness and bonding mode on track irregularity. Tong et al. [29] proposed a double-strain criterion of slab track for frost heave crack propagation and investigated factors involved in frost heave crack propagation. Cui et al. [30] analyzed the effects of differential subgrade settlement on the damage distribution and mechanical properties of the slab track by establishing a three-dimensional damage model. Park et al. [31] considered the deformation of the subgrade in transition zones and built a numerical analysis model to identify the dynamic response of the train. From the literature review, it is noted that most research has focused on the influence of subgrade settlement on the mechanical characteristics of slab track. However, so far, few studies have been undertaken on the effects of frost heave displacement on track structure [6,16,32], and no control limits referring to the subgrade frost heave have not been proposed.
Meanwhile, subgrade frost heave causes track damage, leading to changes in track material parameters. The material parameters of the slab track have a significant effect on the dynamic response of the vehicle [33] and the impact load has a huge influence on the track [34,35,36]. When the cooperative deformation of the rail surface caused by the uneven displacement of subgrade frost heave is not controlled, track irregularity will amplify the dynamic response of the train–track system, resulting in an increase in the track’s deterioration rate, passenger discomfort and derailment risk [37,38,39,40]. In this study, combined with the concrete plastic damage constitutive theory, a nonlinear damage analysis model of CRTSIII slab track subgrade frost heave was established using the finite element method. Then, the mapping relationship between different frost heave displacements and track irregularities was analyzed. Moreover, according to the interlayer seam relationship of the track structure, a control limit for subgrade frost heave displacement at the millimeter level was proposed. Compared to other existing linear elastic models, the established model takes into account the influence of the concrete plastic material, as well as the pre-stressed and common reinforcements of track structure. This reduces the deviations of simulated results from the real full-scale track structure, i.e., it increases the accuracy of the results. It is expected that this study may provide theoretical guidance for the maintenance of CRTSIII slab tracks in cold areas.
2. Plastic Damage Analysis Model of Slab Tracks
The CRTSIII slab track is composed of rails, a fastener system, the track slab, self-compacting concrete, the base plate and subgrade from top to bottom [41]. As shown in Figure 2, the CRTSIII slab track adopts a unit block structure in a subgrade section, where each base plate corresponds to two P5600 track slabs. The track slab and self-compacting concrete are connected by door-type reinforcements. The self-compacting concrete and base plate are limited by the occlusion between the limit convex platform and the groove. The size of the groove is 1.0 m × 0.7 m × 0.1 m (length × width × height). There is a 20 mm expansion joint between the base plates.
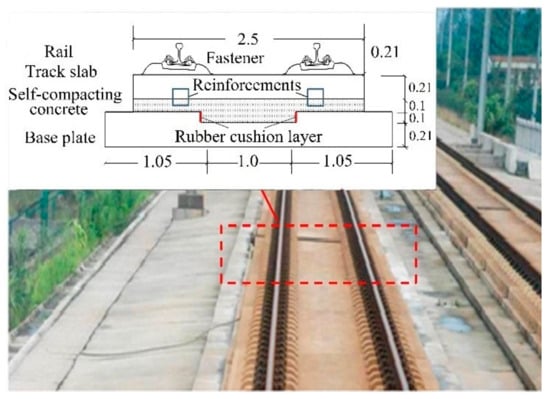
Figure 2.
China Railway Track System (CRTS III) slab track (unit: m).
2.1. Plastic Damage Constitutive Relationship of Slab Track Concrete
In order to simulate the process of material damage under an external load, the concrete plastic damage constitutive relationship was deduced, after which a foundation for the research of damage characteristics of the CRTSIII slab track structure could be created. Referring to The Code for Design of Concrete Structures [42], the stress–strain curve equations of concrete under uniaxial tension and compression are as follows:
where αt and αc are parameter values of a downward-facing section of the concrete stress–strain curve under uniaxial tension and compression, respectively; ftr and fcr are representative values of concrete strength under uniaxial tension and compression, respectively; εtr and εcr are the peak strain of tensile and compressive strength, respectively; dt and dc are the damage evolution parameters of concrete under uniaxial tension and compression, respectively; εp and εz are plastic strain and residual stress, respectively; and εin and εck are inelastic strain and cracking strain, respectively.
By combining Equations (1)–(6), the tension–compression constitutive stress–strain relationship of concrete is obtained. We used C40 concrete as an example; its material parameters are shown in Table 1 and Figure 3.

Table 1.
Relevant parameters of C40 concrete.
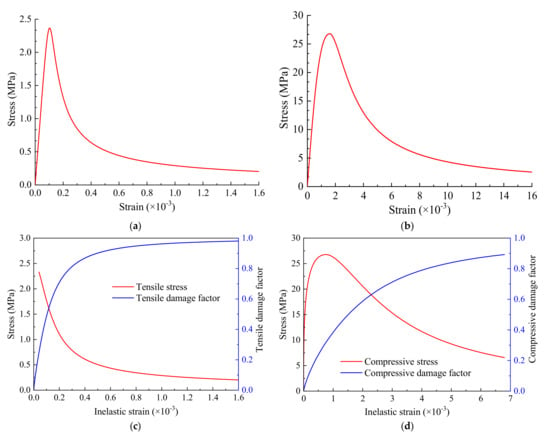
Figure 3.
Material parameters of C40 concrete. (a) Tensile stress-strain curve; (b) compression stress-strain curve; (c) tensile stress/damage factor-inelastic strain; (d) compressive stress/damage factor-inelastic strain.
Based on the concrete stress–strain curve and the concrete plastic damage model, concrete damaged plasticity (CDP), the failure mechanisms of concrete materials are mainly tensile cracking and compression failure. The stiffness degradation phenomenon of concrete materials can be described by inputting four sets of correspondence data of tensile and compressive stress–inelastic strain of materials (σ-εin, σ-εck) and damage factor–inelastic strain (dce-εin, dt-εck). According to the conversion formula of the constitutive relationship in reference [43], given the total strain ε, the data of σ-εin and dce-εin can be calculated by Equations (4), (7), (8) (9) and (10); the data of σ-εck and dt-εck can be calculated by Equations (1), (2) and (11). The curve of C40 concrete parameters in the plastic damage model can be obtained as shown in Figure 3.
2.2. Finite Element Model of Slab Track
2.2.1. Geometric Model
The beam body finite element theoretical analysis model can accurately reflect the stress and deformation of the slab track structure [44,45,46]. Therefore, the finite element software ABAQUS [47] has been used in this study. Based on the plastic damage constitutive relationship of concrete, a nonlinear analysis model of 200 m of CRTSIII slab track on subgrade is established, as shown in Figure 4. The dimensions of the geometric model adopt the actual size of the structure. The dimensions of the track slab are 5600 mm × 2500 mm × 210 mm (length × width × height). The dimensions of the self-compacting concrete are 5600 mm × 2500 mm × 100 mm (length × width × height). The dimensions of the base plate are 5600 mm × 2500 mm × 210 mm (length × width × height). The dimensions of the groove are 1000 mm × 700 mm × 100 mm (length × width × height). There is also a 20 mm expansion joint between the base plates.
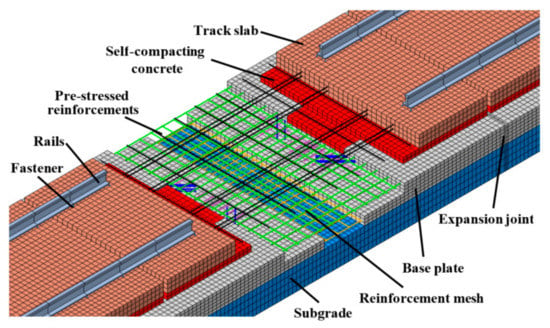
Figure 4.
Finite element model of CRTSIII slab track on subgrade.
The model contains 157,652 solid elements and 215,572 nodes. In order to simulate functional characteristics and the interaction relationships of each structural layer of slab track, the reduced integration element C3D8R [47], with eight nodes, is adopted to simulate the slab track main structure. The fasteners are simulated by the spring element with a spacing of 0.63 m, and the pre-stressed reinforcements are arranged on the track slab. The pre-stressed reinforcements layer consists of 12 transverse and 8 longitudinal bars with a diameter of 13 mm, as shown in the black line in Figure 4. The pre-stressed force is simulated by a cooling method (the tension force of single longitudinal and transverse pre-stressed reinforcements is 122 kN and 127 kN, and the corresponding cooling range is 370.9 °C and 386.1 °C, respectively). The upper and lower layers of the base plate are equipped with CRB550 cold-rolled ribbed reinforcement mesh, reinforced reinforcements are arranged at the bottom of the groove, and anti-crack reinforcements (diameter: 12 mm; length of a single piece: 700 mm; 16 pieces are arranged around a groove, as shown in the blue lines in Figure 4) are arranged around it. The door-type reinforcement plays the role of connecting the track slab and self-compacting concrete, as shown in Figure 5. Forty groups of portal reinforcements are arranged on the track slab. As shown in Figure 5b, the dotted line is the dividing line, the part above the dotted line is anchored on the track slab, and the part below the dotted line is anchored on the self-compacting concrete. All reinforcements are embedded into the track structure. According to [48], the thickness of the subgrade surface layer is 40 cm.

Figure 5.
Schematic diagram of door-type reinforcements. (a) Schematic diagram of space location; (b) size of rebar (unit: mm).
The material of the expansion joint of the base plate is easier to damage compared to the reinforced concrete of the base plate itself under an external load. Therefore, this study analyzed the unfavorable conditions that cause the base plate’s expansion joint to break.
2.2.2. Contact Relationship and Boundary Conditions
The rotation degree of freedom of the spring is restrained to simulate the fastener pad function. For the connection effect of door-type reinforcements between track slab and self-compacting concrete, binding contact is adopted between the two layers. A contact element [49] is adopted to simulate the geotextile isolation layer and elastic rubber cushion. The geotextile is paved between the self-compacting concrete and concrete base plate, and a rubber cushion layer surrounds the convex platform. In practice, the bonding force between the slab track and subgrade will be greatly weakened or even disappear after long-term operation, so the contact element which only considers the tangential friction and vertical pressure between layers, but neglects the adhesive behavior [48,50], has been adopted during out analysis to simulate the adverse conditions. In this circumstance, the deformation of track structure and interlayer seams is easier to produce and develop. Considering the longitudinal characteristics of the structure, symmetrical constraints are adopted at both ends of the rail, base plate and subgrade. Additionally, the degrees of freedom in three directions of the subgrade’s underside have been completely fixed.
2.2.3. Material Properties and Load Conditions

Table 2.
Track structure material properties.
The load condition has a significant influence on the track’s force and deformation [34]. In this study, the object is the track irregularity and damage caused by the subgrade frost heave. The effect of the train load will be investigated in subsequent studies. In order to reveal the influence of subgrade frost heave on track irregularities and damage, the gravity of the track is the main load. Gravity acceleration is applied to the track and foundation. We performed static analysis to research the irregularity and damage of the track under gravity load.
Subgrade frost heave as a form of load is applied to the subgrade surface. We utilized the node displacement load in the finite element software to produce different frost heave loads. In this study, subgrade frost heave load includes two parameters: frost heave wavelength and frost heave amplitude.
2.3. Model Validation
The accuracy of the CDP model is the key to this study. In order to validate the CDP model, according to the validation process in [30], the damage modes of standard concrete specimens (0.15 m × 0.15 m) and the calculation of the stress-strain curves are carried out. The damage nephograms and the stress-strain curves of concrete specimens are shown in Figure 6. The results show that the failure mode of the simulation model is consistent with the one in reality, and the stress–strain curve of the simulation is in good accordance with the theoretical result, which indicates that the CDP parameters of the track structure are reasonable.
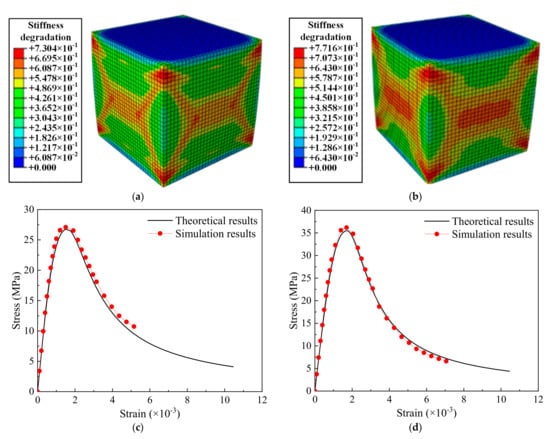
Figure 6.
Diagram of concrete specimen failure modes. (a) Failure mode of C40 concrete specimen; (b) failure mode of C60 concrete specimen; (c) simulation and theoretical results of C40 concrete; (d) simulation and theoretical results of C60 concrete.
3. Mapping the Relationship of Track Irregularity under Frost Heave
3.1. Effect of Frost Heave Position
The track irregularity caused by foundation displacement is usually considered as a cosine curve [52]. Based on the track irregularity test data [39] in the subgrade frost heave zone of the Harbin–Dalian high-speed railway in February 2013, the cosine function is adopted to simulate the subgrade frost heave displacement. The frost heave action positions are singular in this study. Using the displacement module [47] of the ABAQUS software, the displacement function is applied to the nodes on the surface of the subgrade bed, which is a cosine function fitting the displacements of subgrade frost heave as shown in Figure 7a. The analysis type of the model is static analysis.
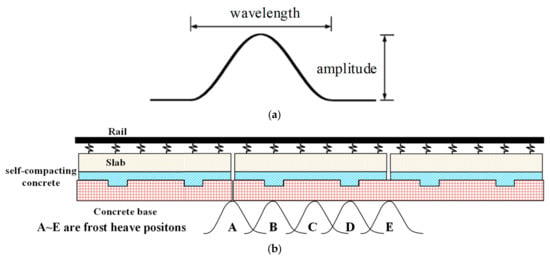
Figure 7.
Frost heave type and positions. (a) Cosine-type displacement curve of subgrade frost heave; (b) frost heave action positions.
Considering the cosine-type displacement curve of subgrade frost heave with a frost heave amplitude of 10 mm and a wavelength of 10 m, the effect of frost heave on the structure and mechanical properties at different positions of the base plate has been analyzed. Specifically, A is located at the seam of the base plate, B and D are at 1/4 and 3/4 of the track slab, C is at the middle of the track slab and E is at the middle of the base plate, as shown in Figure 7b.
As shown in Figure 8, subgrade frost heave affects the deformation of its upper structure. Due to the greater rigidity of the CRTSIII slab track, a certain deformation deviation appears between the rail and subgrade. The rail’s deformation is asymmetrical compared to the cosine curve, and the deformation amplitude from the subgrade mapped to the rail increases. In order to clarify the influence of subgrade frost heave on track irregularity, the ratio of peak value of rail displacement to the corresponding frost heave amplitude under frost heave displacement is defined as the amplitude transfer ratio.
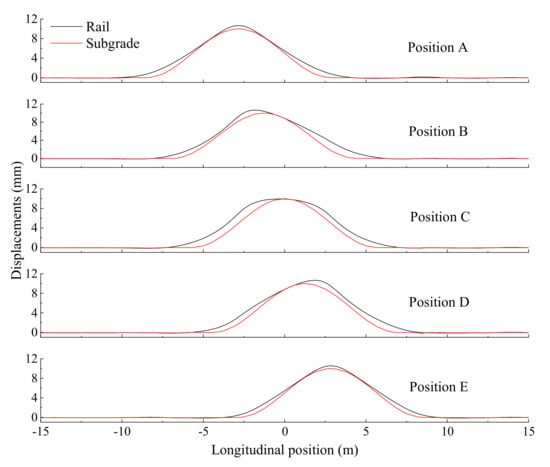
Figure 8.
Rail’s deformation in different positions.
As shown in Figure 9, when frost heave occurs at position C (in the middle of the track slab), the amplitude transfer ratio is less than 1.0. Due to the large rigidity of pre-stressed track slab, the structural deformation is basically consistent with the frost heave curve, and no asymmetry occurs in the longitudinal direction, thereby weakening the rail’s upward deformation trend. When frost heave occurs at other positions, the amplitude transfer ratio is almost the same, which is around at 1.06. In order to reflect the variation trends of track irregularities, the first-order derivation of the rail deformation curve along the longitudinal direction has been carried out to reflect the track irregularity change rate, as shown in Equation (12).
where α is the track irregularity change rate, y is the rail’s deformation amplitude under frost heave (mm), and x is the longitudinal position coordinate of railway line (mm). The track irregularity change rate under different frost heave positions has been obtained, as shown in Figure 10.
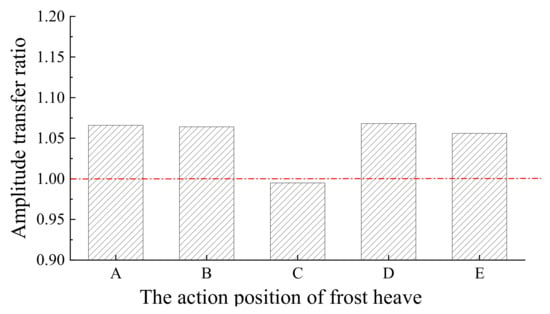
Figure 9.
Amplitude transfer ratio at different positions.
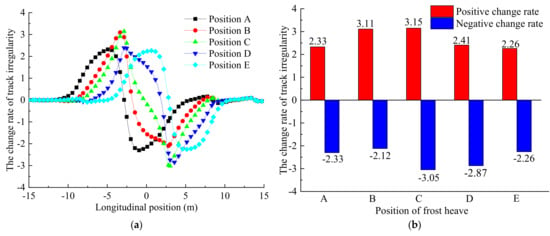
Figure 10.
Change rate of track irregularity at different positions. (a) Distributed along the route; (b) maximum change rate of track irregularity.
As shown in Figure 10, when frost heave occurs at positions A and E, the rail’s deformation curve is completely symmetrical, and the maximum positive and negative change rates of the track irregularities are (±2.33) and (±2.26), respectively. When frost heave occurs at positions B and D, the rail’s deformation curve is not symmetrical; similarly, the positive and negative change rates of the track irregularities are quite different. This is because the track slab’s end warps under the action of frost heave, which leads to the rail’s asymmetric deformation. When subgrade frost heave occurs at position C, the change rate of the track irregularity is 3.15, which is the highest rate when compared with other positions. In other words, the rail’s smoothness is in the worst possible condition, and therefore more attention should be paid to this issue.
3.2. The Influence of Frost Heave Parameters
According to field investigations of subgrade frost heave displacements in frozen soil regions [53], it has been found that the frost heave amplitude of existing high-speed railway subgrade mainly ranges from 15 to 25 mm (and up to 40 mm in particular sections), and the frost heave wavelength is generally lower than 40 m. Consequently, these frost heave parameters (a frost heave amplitude of 0–40 mm and wavelength of 0–40 m) have been analyzed in this paper.
Given that the change rate of track irregularities reaches its maximum in the middle part of the track slab (position C), the influence of position C subgrade frost heave parameters on track irregularity has been studied. When the frost heave wavelength is set at 10 m, the effect caused by amplitudes 5 mm, 20 mm and 40 mm are analyzed. When the frost heave amplitude is set at 10 mm, the effect caused by wavelengths 5 m, 20 m and 40 m are analyzed.
As shown in Figure 11a, when the frost heave amplitude is small, the rail’s deformation curve is basically symmetrical. Moreover, the rail’s deformation amplitude is basically consistent with the frost heave amplitude. When the frost heave amplitude increases, the rail’s deformation increases accordingly. As shown in Figure 11b, when the frost heave wavelength is 40 m, the rail’s deformation curve is basically symmetrical. When the frost heave wavelength decreases, the rail’s deformation curve gradually becomes asymmetrical. When frost heave parameters increase, the range of non-uniform rail deformations gradually increases.
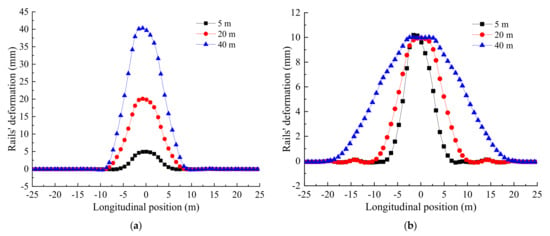
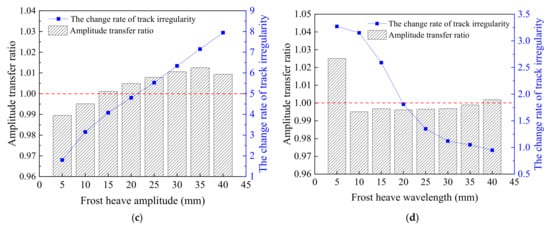
Figure 11.
The rail’s deformation and amplitude transfer ratio under different frost heave parameters. (a) The rail’s deformation under different amplitudes; (b) the rail’s deformation under different wavelengths; (c) amplitude transfer ratio under different amplitudes; (d) amplitude transfer ratio under different wavelengths.
As shown in Figure 11c, when the frost heave amplitude is small, the track slab’s deformation is relatively small, which does not jack up the rails; as a result, the amplitude transfer ratio is less than 1.0. When the frost heave amplitude increases, both the rail’s deformation and amplitude transfer ratio increase. The track irregularity’s change rate increases linearly along with the increase of frost heave amplitude. When the frost heave amplitude is 5 mm, the track irregularity’s change rate is only 1.8; when the frost heave amplitude is 40 mm, the track irregularity’s change rate increases to 7.94, an increase of approximately 4.4 times. As shown in Figure 11d, when the frost heave wavelength is short, the track slab’s warping deformation is obvious, the rail’s deformation amplitude is greater than the frost heave amplitude, and the amplitude transfer ratio is greater than 1.0; when the frost heave wavelength exceeds 10 m, the amplitude transfer ratio remains almost unchanged. The track irregularity’s change rate decreases with the increase in frost heave wavelength, and the curve slope first increases and then decreases. When the frost heave wavelength is 5 m, the track irregularity’s change rate is 3.27, and when the wavelength is 40 m, it is 0.95, a reduction of approximately 3.4 times. Both frost heave amplitude and wavelength lead to changes in the track irregularity rate, which in turn affect the rail’s smoothness. The greater the frost heave amplitude and the shorter the frost heave wavelength, the greater changes in the track irregularity rate.
4. Laws of Track Interlayer Seams under Subgrade Frost Heave
Referring to the Maintenance Rules for Ballastless Track of High-Speed Railway (Trial) [54], when the height of the track structure interlayer seams reaches 1.0 mm and no repairs are done in time, these seams will cause adverse effects on the track structure’s service performance and the vehicle’s operation. Taking a frost heave amplitude of 10 mm and frost heave wavelength of 10 m as examples, the distribution law of the interlayer seams between the self-compacting concrete and base plate under different frost heave positions has been analyzed. The seam length is the longitudinal length of the area where the seam height exceeds 1.0 mm, as shown in Table 3.

Table 3.
The height and length of seams under different frost heave positions.
As shown in Table 3, when frost heave occurs in the middle of the track slab, compared with other positions, the seam length and maximum height between the self-compacting concrete and the base plate are greater, reaching 1.42 m and 3.18 mm, respectively. The seam length and maximum height between the base plate and subgrade reach 3.32 mm and 4.10 m, respectively. It was therefore observed that the track slab’s middle section is located in a disadvantageous position regarding frost heave, which is why variations in track structure seams under subgrade frost heave have been analyzed in this study.
4.1. Seams between the Self-Compacting Concrete and Base Plate
When studying the law of the seams between the self-compacting concrete and base plate, considering that a frost heave wavelength of 10 m is relatively common in severely cold areas and has a great influence on the mechanical characteristics of the slab track [39,54], the frost heave wavelength is set at 10 m. As shown in Figure 12a, when the frost heave amplitude is small due to the track slab’s warping deformation, the seams between the self-compacting concrete and base plate only occur at the end of the track slab; yet when the frost heave amplitude increases, the warping deformation becomes obvious. When the frost heave amplitude is 40 mm, the seam range and height greatly increase. In order to study the seam development process, the distribution cloud with a seam height greater than 1.0 mm under different frost heave amplitudes is extracted, as shown in Figure 12b. When the frost heave amplitude is small, the seam only exists at the end of the slab. When the frost heave amplitude increases, the seam range also increases, which is consistent with the results shown in Figure 12a. When the frost heave amplitude is 12.42 mm, the seam range extends from one slab to two slabs. When the frost heave amplitude reaches 18.92 mm, these seams appear below the three slabs, and the range reaches about 1.5 slabs. When the frost heave amplitude reaches 27.60 mm, the lower section of a slab is almost completely void. When the frost heave amplitude is 40 mm, the seam range can reach a length of 2.5 slabs.
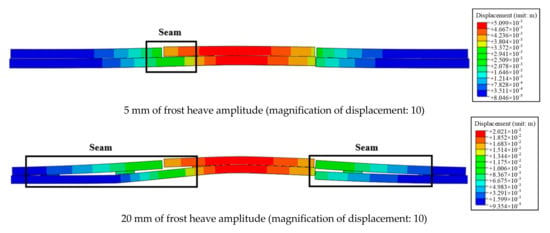
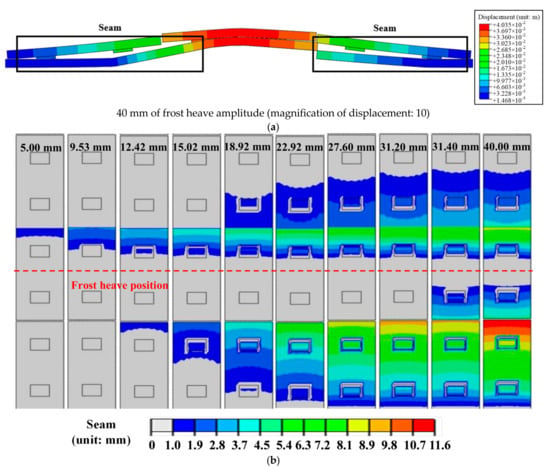
Figure 12.
Seams between the self-compacting concrete and base plate under different amplitudes of frost heave displacements. (a) Deformation law of track structure; (b) development law of seams.
From Figure 13a, when the frost heave wavelength is 10 m, the seam height and length increase linearly with increases in frost heave amplitude. When frost heave amplitude increases from 5 mm to 40 mm, the seam height and length increase by 7.64 times and 22.10 times, respectively. This means that the effects of frost heave are rather obvious. As shown in Figure 13b, when the frost heave amplitude is 10 mm, the frost heave wavelength increases from 5 m to 10 m. The seam height is reduced to 3.18 mm from 5.53 mm, and the seam length decreases from 6.77 m to 1.42 m, resulting in reduction ratios of 43.4% and 79.0%, respectively. When the frost heave wavelength increases from 35 m to 40 m, the seam height is reduced from 0.77 mm to 0.69 mm, and the seam length remains unchanged. That is, as the frost heave wavelength gradually increases, both the height and length of the seam decreases, and the reduction range is gradually reduced. In addition, when the frost heave wavelength reaches 28 m, the maximum height of the seam is 1.0 mm; that is, the seam height gradually decreases in response to the increase in wavelength. There is an indication that when the frost heave wavelength exceeds 28 m, no seam changes occur.
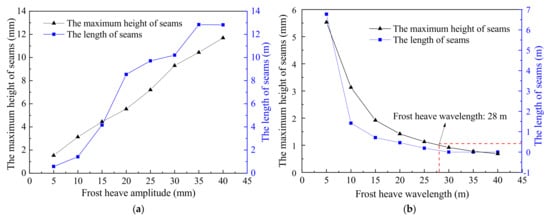
Figure 13.
The height and length of seams between self-compacting concrete and the base plate under different frost heave parameters. (a) The height and length under different amplitudes; (b) the height and length under different wavelengths.
4.2. Seams between the Base Plate and Subgrade
As shown in Figure 14a, the seams mainly appear at the starting positions of frost heave and the expansion joint, and the seam values at the three positions gradually increase as the frost heave amplitude increases. As shown in Figure 14b, when the frost heave amplitude gradually increases from 0 to 30 mm, the seam height increases linearly and the seam length increases nonlinearly. The decreased increment in seam length is caused by the concrete’s plastic damage. This is especially apparent when the frost heave reaches 35 mm, as the plastic damage caused by the base plate is serious due to the tensile stress. That is to say, when the equivalent plastic strain accumulates to a certain value, the concrete located on the surface of the base plate is crushed on a large scale. Additionally, cracks appear along the transverse direction, which leads to the phenomenon of “bending” as shown in Figure 14c. It creates smaller seams between the end of the base plate and the surface of the subgrade. When the frost heave amplitude exceeds 30 mm, the maximum seam height appears at the frost heave’s starting position. When the frost heave reaches 40 mm, the seam length and maximum height increase correspondingly.
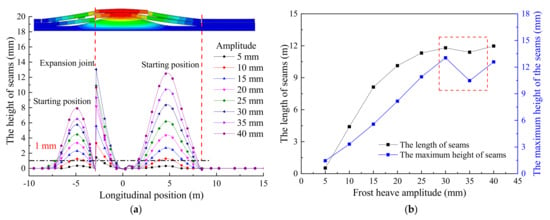
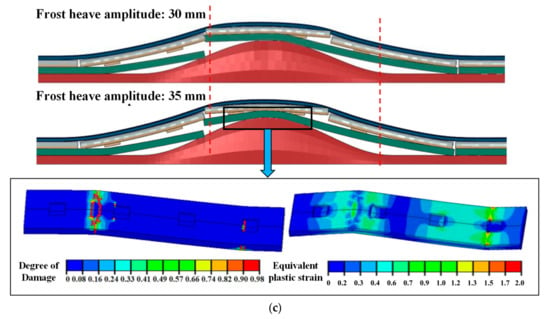
Figure 14.
Laws of interlayer seams under different frost heave amplitudes. (a) Variation of seams’ height longitudinally; (b) variation of the seams’ length and height; (c) base plate deformation before and after plastic state.
As shown in Figure 15, both the height and length of the seams decrease nonlinearly with increases in frost heave wavelength, and then the two values tend to stabilize gradually. When the frost heave wavelength reaches 19.24 m, the maximum seam height is 1.0 mm; as a result, the height of the seam decreases. In other words, when the frost heave wavelength is greater than 19.24 m, it may be considered that there are no seams.
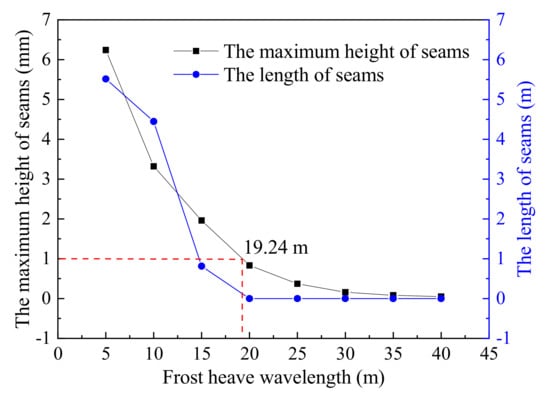
Figure 15.
The length and height of seams.
5. Discussion on the Limits of the Subgrade’s Frost Heave Control
5.1. Influence of Load Condition on the Seams
Subgrade frost heave is the main load condition analyzed in this study, which directly affects the generation and development of seams. Wavelength and amplitude are the two main parameters of subgrade frost heave and their influence on seams is discussed.
Combined with the relevant standards of irregularity management for the slab track of high-speed railways in maintenance rules and the results shown in Section 3, it can be asserted that the amplitude transfer ratio of subgrade frost heave is greater than 1.0. That is, the tolerated deviation management value of subgrade frost heave is stricter than the requirement concerning track irregularity. Because of the various influential factors in the field, one must consider a certain safe coefficient and use an amplitude transfer ratio of 1.1 to get the management value of subgrade frost heave’s tolerated deviation, as shown in Table 4.

Table 4.
Admissible deviation management value of frost heave amplitudes.
As shown in Figure 16a,b, the seam peak values between the different interlayer structures are concluded under different subgrade frost heave amplitudes (0–40 mm) and frost heave wavelengths (0–40 m). The compound effects of subgrade frost heave displacements on interlayer seams can be obtained. When the frost heave wavelength is small and frost heave amplitude increases, the seam values also increase rapidly; that is, large seams occur easily. Similarly, when the wavelength increases (especially when it reaches 30 m), the seam growth rate shows a sharp decreasing trend. Therefore, it is necessary to pay more attention to these seams under short-wave frost heave. Referring to Figure 16b, it can be seen that the seam value decreases due to the plastic damage of concrete.
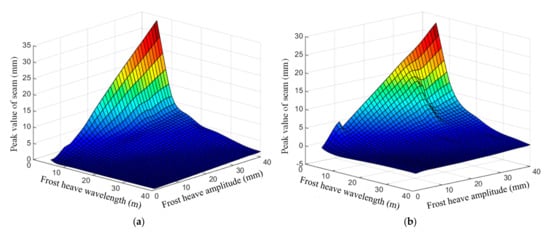
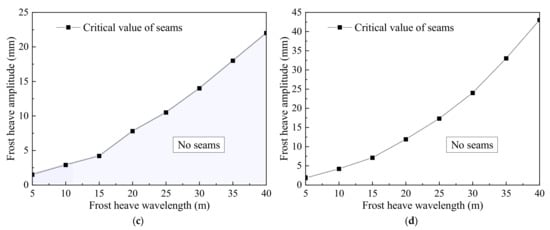
Figure 16.
The peak and critical value of seams under different frost heave conditions. (a) Peak value between the self-compacting concrete and base plate; (b) peak value between the base plate and the subgrade’s surface layer; (c) critical value between the self-compacting concrete and base plate; (d) critical value between the base plate and the subgrade’s surface layer.
By analyzing the portion of the seams within 1.0 mm in Figure 16a,b, the critical value of the seams under different frost heave amplitudes and wavelengths were obtained and shown in the purple region in Figure 16c,d, in which all track layers have strong follow-up capability; thus, it may be considered that they have no seams. Referring to Figure 16d, the variation law of the frost heave critical value between the base plate and subgrade is almost the same as Figure 16c; however, when the frost heave wavelength is the same, the critical frost heave amplitude is significantly greater than the critical value in Figure 16c. When the frost heave wavelength is 10 m, the critical frost heave amplitude is 4.2 mm, which is about 1.45 times the critical value of the self-compacting concrete and base plate; when the frost heave wavelength is 30 m, the critical frost heave amplitude is 24 mm, which is about 1.71 times that of the self-compacting concrete and base plate.
5.2. Limit of Frost Heave Displacement Control of the Subgrade
The tolerated deviation management value of subgrade frost heave, the critical values of seams between the self-compacting concrete and base plate, and the critical values of seams between the base plate and subgrade are summarized and analyzed. Finally, the control limit of subgrade frost heave based on static results is obtained, as shown in Figure 17. The critical values of seams between the base plate and subgrade are smaller than those between the self-compacting concrete and base plate under different frost heaves. Additionally, the difference between the control limit increases in response to the increase in the frost heave wavelength. It can be concluded that the critical values of the seams between the self-compacting concrete and base plate are taken as the main control index of the subgrade frost heave.
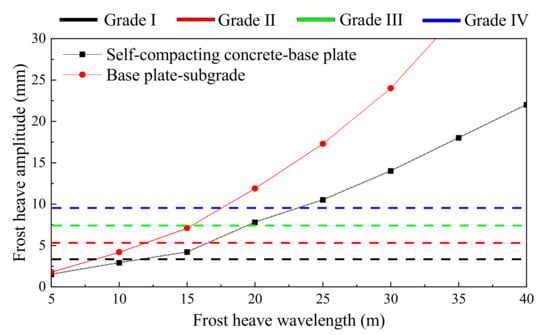
Figure 17.
Control limit of subgrade frost heave based on static results.
When the subgrade frost heave amplitude reaches the tolerated deviation management value of the regular maintenance standard (Grade I), the corresponding subgrade frost heave wavelength limit is 12 m. This means that as long as the frost heave wavelength exceeds 12 m, no seams will occur in the Grade I standard. The comfortable limit (Grade II) corresponds to a wavelength limit of 16 m. The temporary repair standard (Grade III) corresponds to a wavelength limit of 19 m, and the speed limit standard (Grade IV) corresponds to a wavelength limit of 23 m. In addition, when the frost heave wavelength is less than 12 m, and the slab track irregularity standard of the high-speed railway (i.e., the subgrade frost heave tolerated deviation management value) is satisfied, the phenomenon of seam heights greater than 1.0 mm between the self-compacting concrete and the base plates may still occur. Therefore, it is necessary to pay attention to the state of the track structure when small wavelength frost heave occurs in the field.
6. Conclusions
By establishing a nonlinear finite element model of CRTSIII slab track, the deformation characteristics of slab track under subgrade frost heave were studied. Further, a millimeter-level control limit of subgrade frost heave was proposed based on the relevant standards of high-speed railway slab track irregularity management. The following conclusions are drawn:
- (1)
- The frost heave displacements of subgrade affects the deformation of its superstructure, leading in turn to cosine track irregularities. Because of the great stiffness of slab track, the amplitude transfer ratio will be greater than 1.0; that is, the deformation mapped to the rail surface will increase.
- (2)
- When subgrade frost heave occurs in the middle of the track slab, the track irregularity’s change rate reaches the maximum value of 3.15, indicating the worst level of track irregularity. The track irregularity’s change rate increases linearly in response to the increase in frost heave but decreases nonlinearly in response to the increase in frost heave wavelength.
- (3)
- The frost heave displacements of subgrade leads to the occurrence of interlayer seams between the track structures. Similarly, seam height and length are larger when frost heave acts on the middle section of the track slab. When the frost heave amplitude increases and the frost heave wavelength decreases, the seam length and height also increase. Finally, when the frost heave wavelength exceeds 28 m, it can be considered as having no seams between the self-compacting concrete and base plate.
- (4)
- When the frost heave amplitude increases, the seam height increases linearly whilst the seam length increases nonlinearly due to plastic damage of the concrete. In particular, when the frost heave amplitude reaches 35 mm, the concrete on the surface of the base plate produces plastic damage and cracks along the transverse direction, leading to a “bending” phenomenon.
- (5)
- Based on the relevant standards of slab track irregularity management, the critical values of interlayer seams between the self-compacting concrete and base plate have been selected as the main control indices of subgrade frost heave. Four corresponding wavelength limits (Grades I–IV) are 12 m, 16 m, 19 m and 23 m, respectively.
- (6)
- The contribution of this paper is to reveal the deformation transfer law of slab track and subgrade frost heave in a complex environment, to elucidate the occurrence and development law of interlayer seams and to obtain the four-level control limit value of subgrade frost heave. In practice, once the limit value is exceeded, maintenance workers can promptly carry out remedial work to prevent further deterioration of the track. The limit value of subgrade frost heave control proposed can provide references for new technologies in the design and construction of high-speed railway; it can also strengthen monitoring and timely maintenance during operation.
Author Contributions
Conceptualization, X.C.; software, Q.Z. and Y.Z.; validation, Y.Z. and Q.W.; investigation, Y.Z.; writing—original draft preparation, B.L.; writing—review and editing, Q.Z., Q.W. and A.L.; supervision, G.Y.; project administration, X.C. All authors have read and agreed to the published version of the manuscript.
Funding
This research was funded by the National Natural Science Foundation of China (No. 51778050), the Project of Beijing Municipal Science & Technology Commission (Z191100002519010) and the Science & Technology Research and Development Project of China State Railway Group Corporation (No. P2019G029).
Institutional Review Board Statement
Not applicable.
Informed Consent Statement
Not applicable.
Conflicts of Interest
The authors declare no conflict of interest. The funders had no role in the design of the study; in the collection, analyses, or interpretation of data; in the writing of the manuscript, or in the decision to publish the results.
References
- Tai, B.; Liu, J.; Wang, T.; Tian, Y.; Fang, J. Thermal Characteristics and Declining Permafrost Table beneath Three Cooling Embankments in Warm Permafrost Regions. Appl. Therm. Eng. 2017, 123, 435–447. [Google Scholar] [CrossRef]
- Andersland, O.B.; Ladanyi, B. Frozen Ground Engineering, 2nd ed.; John Wiley & Sons: Hoboken, NJ, USA, 2003. [Google Scholar]
- Akagawa, S.; Hori, M. Frost Heaving in Ballast Railway Tracks. Sci. Cold Arid. Reg. 2015, 7, 632–636. [Google Scholar] [CrossRef]
- Tai, B.; Liu, J.; Yue, Z.; Liu, J.; Tian, Y.; Wang, T. Effect of Sunny-Shady Slopes and Strike on Thermal Regime of Subgrade along a High-Speed Railway in Cold Regions, China. Eng. Geol. 2017, 232, 182–191. [Google Scholar] [CrossRef]
- Xu, X.; Wang, J.; Zhang, L. Physic of Frozen Soil, 2nd ed.; Science Press: Beijing, China, 2010. [Google Scholar]
- Yang, G.; Gao, L.; Liu, X.; Zhao, W. Research on Division Standard of Subgrade Frost Heaving for CRTS III Slab Track Based on Dynamic Analysis. J. China Railw. Soc. 2017, 39, 110–117. [Google Scholar]
- Lukin, A. Mackinder Revisited: Will China Establish Eurasian Empire 3.0. The Diplomat, 7 February 2015. [Google Scholar]
- Islam, D.; Zunder, T.; Jackson, R.; Nesterova, N.; Burgess, A. The Potential of Alternative Rail Freight Transport Corridors between Central Europe and China. Transp. Probl. 2013, 8, 45–57. [Google Scholar]
- Arase, D. China’s Two Silk Roads Initiative: What It Means for Southeast Asia. Southeast Asian Aff. 2015, 2015, 25–45. [Google Scholar]
- Zhao, G.; Zhao, L.; Zhang, L. Mechanical Characteristics of Ballastless Track under Subgrade Frost Heaving in High-Speed Railway. J. Railw. Eng. Soc. 2017, 34, 53–61. [Google Scholar]
- Ma, W.; Feng, G.; Wu, Q.; Wu, J. Analyses of Temperature Fields under the Embankment with Crushed-Rock Structures along the Qinghai–Tibet Railway. Cold Reg. Sci. Technol. 2008, 53, 259–270. [Google Scholar] [CrossRef]
- Zhao, H.; Wu, Z.; Li, Z. Experimental Study on Frost Heave of Silty Clay in Seasonally Frost Soil Regions. Procedia Eng. 2012, 28, 282–286. [Google Scholar] [CrossRef][Green Version]
- Tester, R.; Gaskin, P. Effect of Fines Content on Frost Heave. Can. Geotech. J. 1996, 33, 678–680. [Google Scholar] [CrossRef]
- Hu, X.; Wu, Y.; Li, X. A Field Study on the Freezing Characteristics of Freeze-Sealing Pipe Roof Used in Ultra-Shallow Buried Tunnel. Appl. Sci. 2019, 9, 1532. [Google Scholar] [CrossRef]
- Tai, B.; Liu, J.; Wang, T.; Shen, Y.; Li, X. Numerical Modelling of Anti-Frost Heave Measures of High-Speed Railway Subgrade in Cold Regions. Cold Reg. Sci. Technol. 2017, 141, 28–35. [Google Scholar] [CrossRef]
- Ma, W.; Cheng, G. Preliminary study on technology of cooling foundation in permafrost regions. J. Glaciol. Geocryol. 2002, 24, 579–587. [Google Scholar]
- Cheng, G.; Sun, Z.; Niu, F. Application of the Roadbed Cooling Approach in Qinghai–Tibet Railway Engineering. Cold Reg. Sci. Technol. 2008, 53, 241–258. [Google Scholar] [CrossRef]
- Sañudo, R.; Miranda, M.; García, C.; García-Sanchez, D. Drainage in Railways. Constr. Build. Mater. 2019, 210, 391–412. [Google Scholar] [CrossRef]
- Dahlberg, T. Some Railroad Settlement Models—A Critical Review. Proc. Inst. Mech. Eng. Part F J. Rail Rapid Transit 2001, 215, 289–300. [Google Scholar] [CrossRef]
- Li, X.; Nielsen, J.C.; Pålsson, B.A. Simulation of Track Settlement in Railway Turnouts. Veh. Syst. Dyn. 2014, 52, 421–439. [Google Scholar] [CrossRef]
- Wang, H.; Markine, V. Dynamic Behaviour of the Track in Transitions Zones Considering the Differential Settlement. J. Sound. Vib. 2019, 459, 114863. [Google Scholar] [CrossRef]
- Wang, H.; Markine, V. Modelling of the Long-Term Behaviour of Transition Zones: Prediction of Track Settlement. Eng. Struct. 2018, 156, 294–304. [Google Scholar] [CrossRef]
- Fu, L.; Gong, Q.; Zhou, S.; Zou, C.; Xiao, J. Relationships between Ballasted Track Settlement and Differential Subgrade Settlement under Train Load. J. Vib. Shock 2013, 32, 23–28, 39. [Google Scholar] [CrossRef]
- Cai, X.; Liu, W.; Wang, P.; Ning, X. Effect of Land Subsidence on Regularity of Double-Block Ballastless Track. Eng. Mech. 2014, 31, 160–165. [Google Scholar]
- Chen, P.; Gao, L.; Ma, M. Limited Value of Subgrade Settlement and Its Influence on Mechanical Characteristics of Ballastless Track in High-Speed Railway. Munic. Traffic Eng. Des. 2008, 5, 63–66. [Google Scholar]
- Guo, Y.; Gao, J.; Sun, Y.; Zhai, W. Mapping Relationship between Rail Deflection of Slab Track and Subgrade Settlement. J. Southwest Jiaotong Univ. 2017, 52, 1139–1147, 1215. [Google Scholar]
- Gao, L.; Zhao, W.; Hou, B.; Zhong, Y. Analysis of Influencing Mechanism of Subgrade Frost Heave on Vehicle-Track Dynamic System. Appl. Sci. 2020, 10, 8097. [Google Scholar] [CrossRef]
- Zhao, L.; Cai, X.; Qu, C. Influence of Land Subsidence on the Regularity of the Ballastless Track with Unit Slabs. Railw. Stand. Des. 2013, 10, 15–18. [Google Scholar] [CrossRef]
- Tong, F.; Gao, L.; Cai, X.; Zhong, Y.; Zhao, W.; Huang, Y. Experimental and Theoretical Determination of the Frost-Heave Cracking Law and the Crack Propagation Criterion of Slab Track with Water in the Crack. Appl. Sci. 2019, 9, 4592. [Google Scholar] [CrossRef]
- Cui, X.; Ling, X. Effects of Differential Subgrade Settlement on Damage Distribution and Mechanical Properties of CRTS II Slab Track. Constr. Build. Mater. 2021, 271, 121821. [Google Scholar] [CrossRef]
- Park, S.; Kim, J.Y.; Kim, J.; Lee, S.; Cho, K.-H. Analysis of Dynamic Characteristics of Deformed Concrete Slab Track on Transition Zone in High-Speed Train Line According to Train Speeds. Appl. Sci. 2020, 10, 7174. [Google Scholar] [CrossRef]
- Cai, X.; Liang, Y.; Tan, S.; Shen, Y. Deformation and Seam Characteristics Analysis of CRTS I Slab Ballastless Track in Subgrade Frost Heaving Zone. J. Beijing Jiaotong Univ. 2017, 41, 7–13. [Google Scholar]
- Li, T.; Su, Q.; Kaewunruen, S. Influences of Dynamic Material Properties of Slab Track Components on the Train-Track Vibration Interactions. Eng. Fail. Anal. 2020, 115, 104633. [Google Scholar] [CrossRef]
- Remennikov, A.M.; Kaewunruen, S. A Review of Loading Conditions for Railway Track Structures Due to Train and Track Vertical Interaction. Struct. Control. Health 2008, 15, 207–234. [Google Scholar] [CrossRef]
- Kaewunruen, S.; Remennikov, A.M. Impact Capacity of Railway Prestressed Concrete Sleepers. Eng. Fail. Anal. 2009, 16, 1520–1532. [Google Scholar] [CrossRef]
- Kaewunruen, S.; Remennikov, A.M. Experiments into Impact Behaviour of Railway Prestressed Concrete Sleepers. Eng. Fail. Anal. 2011, 18, 2305–2315. [Google Scholar] [CrossRef]
- FORD, R. Differential Ballast Settlement, and Consequent Undulations in Track, Caused by Vehicle-Track Interaction. Veh. Syst. Dyn. 1995, 24, 222–233. [Google Scholar] [CrossRef]
- Paixão, A.; Fortunato, E.; Calçada, R. The Effect of Differential Settlements on the Dynamic Response of the Train–Track System: A Numerical Study. Eng. Struct. 2015, 88, 216–224. [Google Scholar] [CrossRef]
- Cai, X.; Liang, Y.; Xin, T.; Ma, C.; Wang, H. Assessing the Effects of Subgrade Frost Heave on Vehicle Dynamic Behaviors on High-Speed Railway. Cold Reg. Sci. Technol. 2019, 158, 95–105. [Google Scholar] [CrossRef]
- Guo, Y.; Zhai, W. Long-Term Prediction of Track Geometry Degradation in High-Speed Vehicle–Ballastless Track System Due to Differential Subgrade Settlement. Soil Dyn. Earthq. Eng. 2018, 113, 1–11. [Google Scholar] [CrossRef]
- Wang, P.; Gao, L.; Zhao, L.; Qu, C. Study on Setting Method of Position-Limitation Recess of CRTSIII Slab Track on Subgrade. Eng. Mech. 2014, 31, 110–116. [Google Scholar]
- Ministry of Housing and Urban-Rural Development of the People’s Republic of China. Code for Design of Concrete Structures; GB/50010-2010; China Architecture & Building Press: Beijing, China, 2010. [Google Scholar]
- Ren, X.; Li, J. Calculation of Concrete Damage and Plastic Deformation. Build. Struct. 2015, 45, 29–31+74. [Google Scholar] [CrossRef]
- Ren, J.; Li, X.; Yang, R.; Wang, P.; Xie, P. Criteria for Repairing Damages of CA Mortar for Prefabricated Framework-Type Slab Track. Constr. Build. Mater. 2016, 110, 300–311. [Google Scholar] [CrossRef]
- Zhang, Y.; Wu, K.; Gao, L.; Yan, S.; Cai, X. Study on the Interlayer Debonding and Its Effects on the Mechanical Properties of CRTS II Slab Track Based on Viscoelastic Theory. Constr. Build. Mater. 2019, 224, 387–407. [Google Scholar] [CrossRef]
- Sun, L.; Duan, Y.; Gao, P. Comparison of Structural Analysis Models for Slab Ballastless Track in High-Speed Railway. J. Southeast Univ. Nat. Sci. Ed. 2013, 43, 938–943. [Google Scholar]
- Dassault Systèmes. Abaqus 6.13 (Abaqus/CAE User’s Guide); Simulia: Providence, RI, USA, 2013. [Google Scholar]
- National Railway Administration of People’s Republic of China. Code for Design of High Speed Railway; TB10621-2014; China Railway Publishing House: Beijing, China, 2014.
- Cai, X.; Luo, B.; Zhong, Y.; Zhang, Y.; Hou, B. Arching Mechanism of the Slab Joints in CRTSII Slab Track under High Temperature Conditions. Eng. Fail. Anal. 2019, 98, 95–108. [Google Scholar] [CrossRef]
- Zhu, S.; Cai, C. Stress Intensity Factors Evaluation for Through-Transverse Crack in Slab Track System under Vehicle Dynamic Load. Eng. Fail. Anal. 2014, 46, 219–237. [Google Scholar] [CrossRef]
- Sun, L.; Duan, Y.; Yang, X. Static Response Analysis of CRTSIII Ballastless Track Structure. J. Railw. Eng. Soc. 2013, 11, 32–39. [Google Scholar]
- Liu, J.; Yao, H.L.; Chen, P.; Lu, Z. Dynamic Response of Subgrade under Action of Vehicle Load Considering Pavement Material Roughness. Mater. Res. Innov. 2014, 18, S2–S966. [Google Scholar] [CrossRef]
- Zhao, G. Study on Management Standard of Frost Heaving of Ballastless Track Subgrade on High-Speed Railway in Severe Cold Regions. J. China Railw. Soc. 2016, 38, 1–8. [Google Scholar]
- Ministry of Railways of the People’s Republic of China. Maintenance Rules for Slab Track of High-Speed Railway (Trial); TG/GW115-2012; China Railway Publishing House: Beijing, China, 2012.
Publisher’s Note: MDPI stays neutral with regard to jurisdictional claims in published maps and institutional affiliations. |
© 2021 by the authors. Licensee MDPI, Basel, Switzerland. This article is an open access article distributed under the terms and conditions of the Creative Commons Attribution (CC BY) license (https://creativecommons.org/licenses/by/4.0/).