A Novel Index to Detect Vegetation in Urban Areas Using UAV-Based Multispectral Images
Abstract
1. Introduction
2. Materials
2.1. Research Process
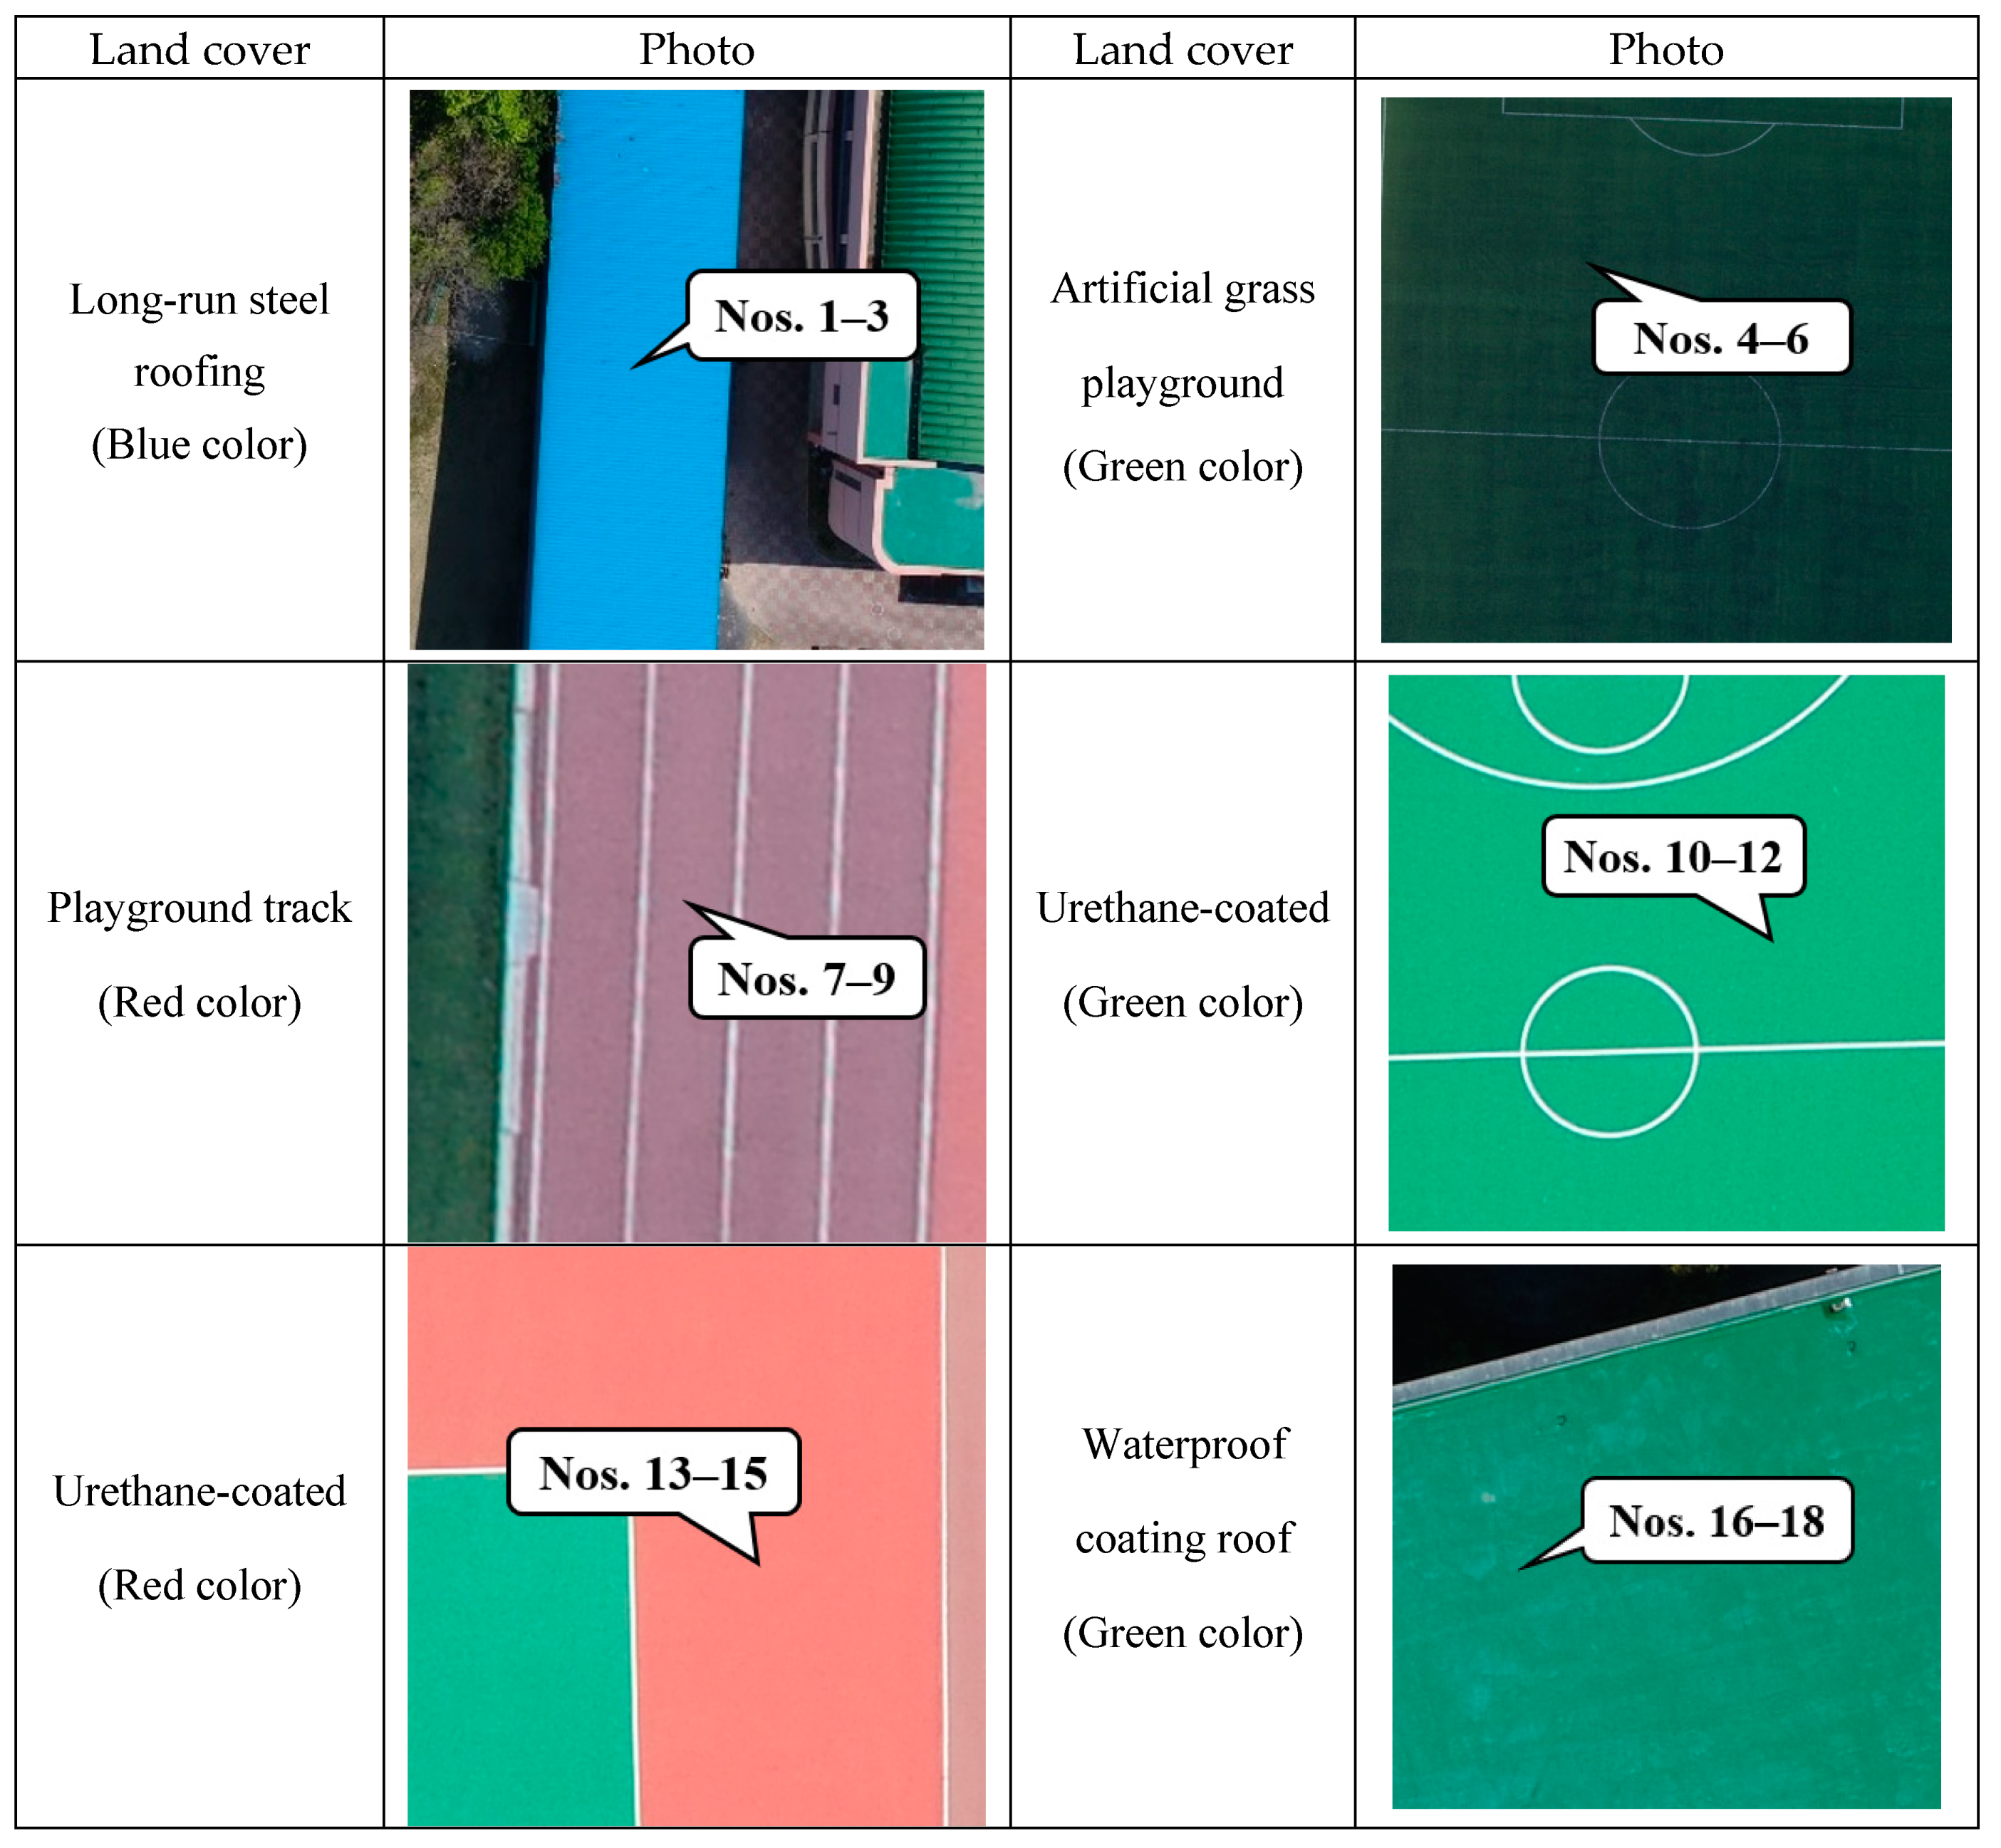
2.2. Study Area
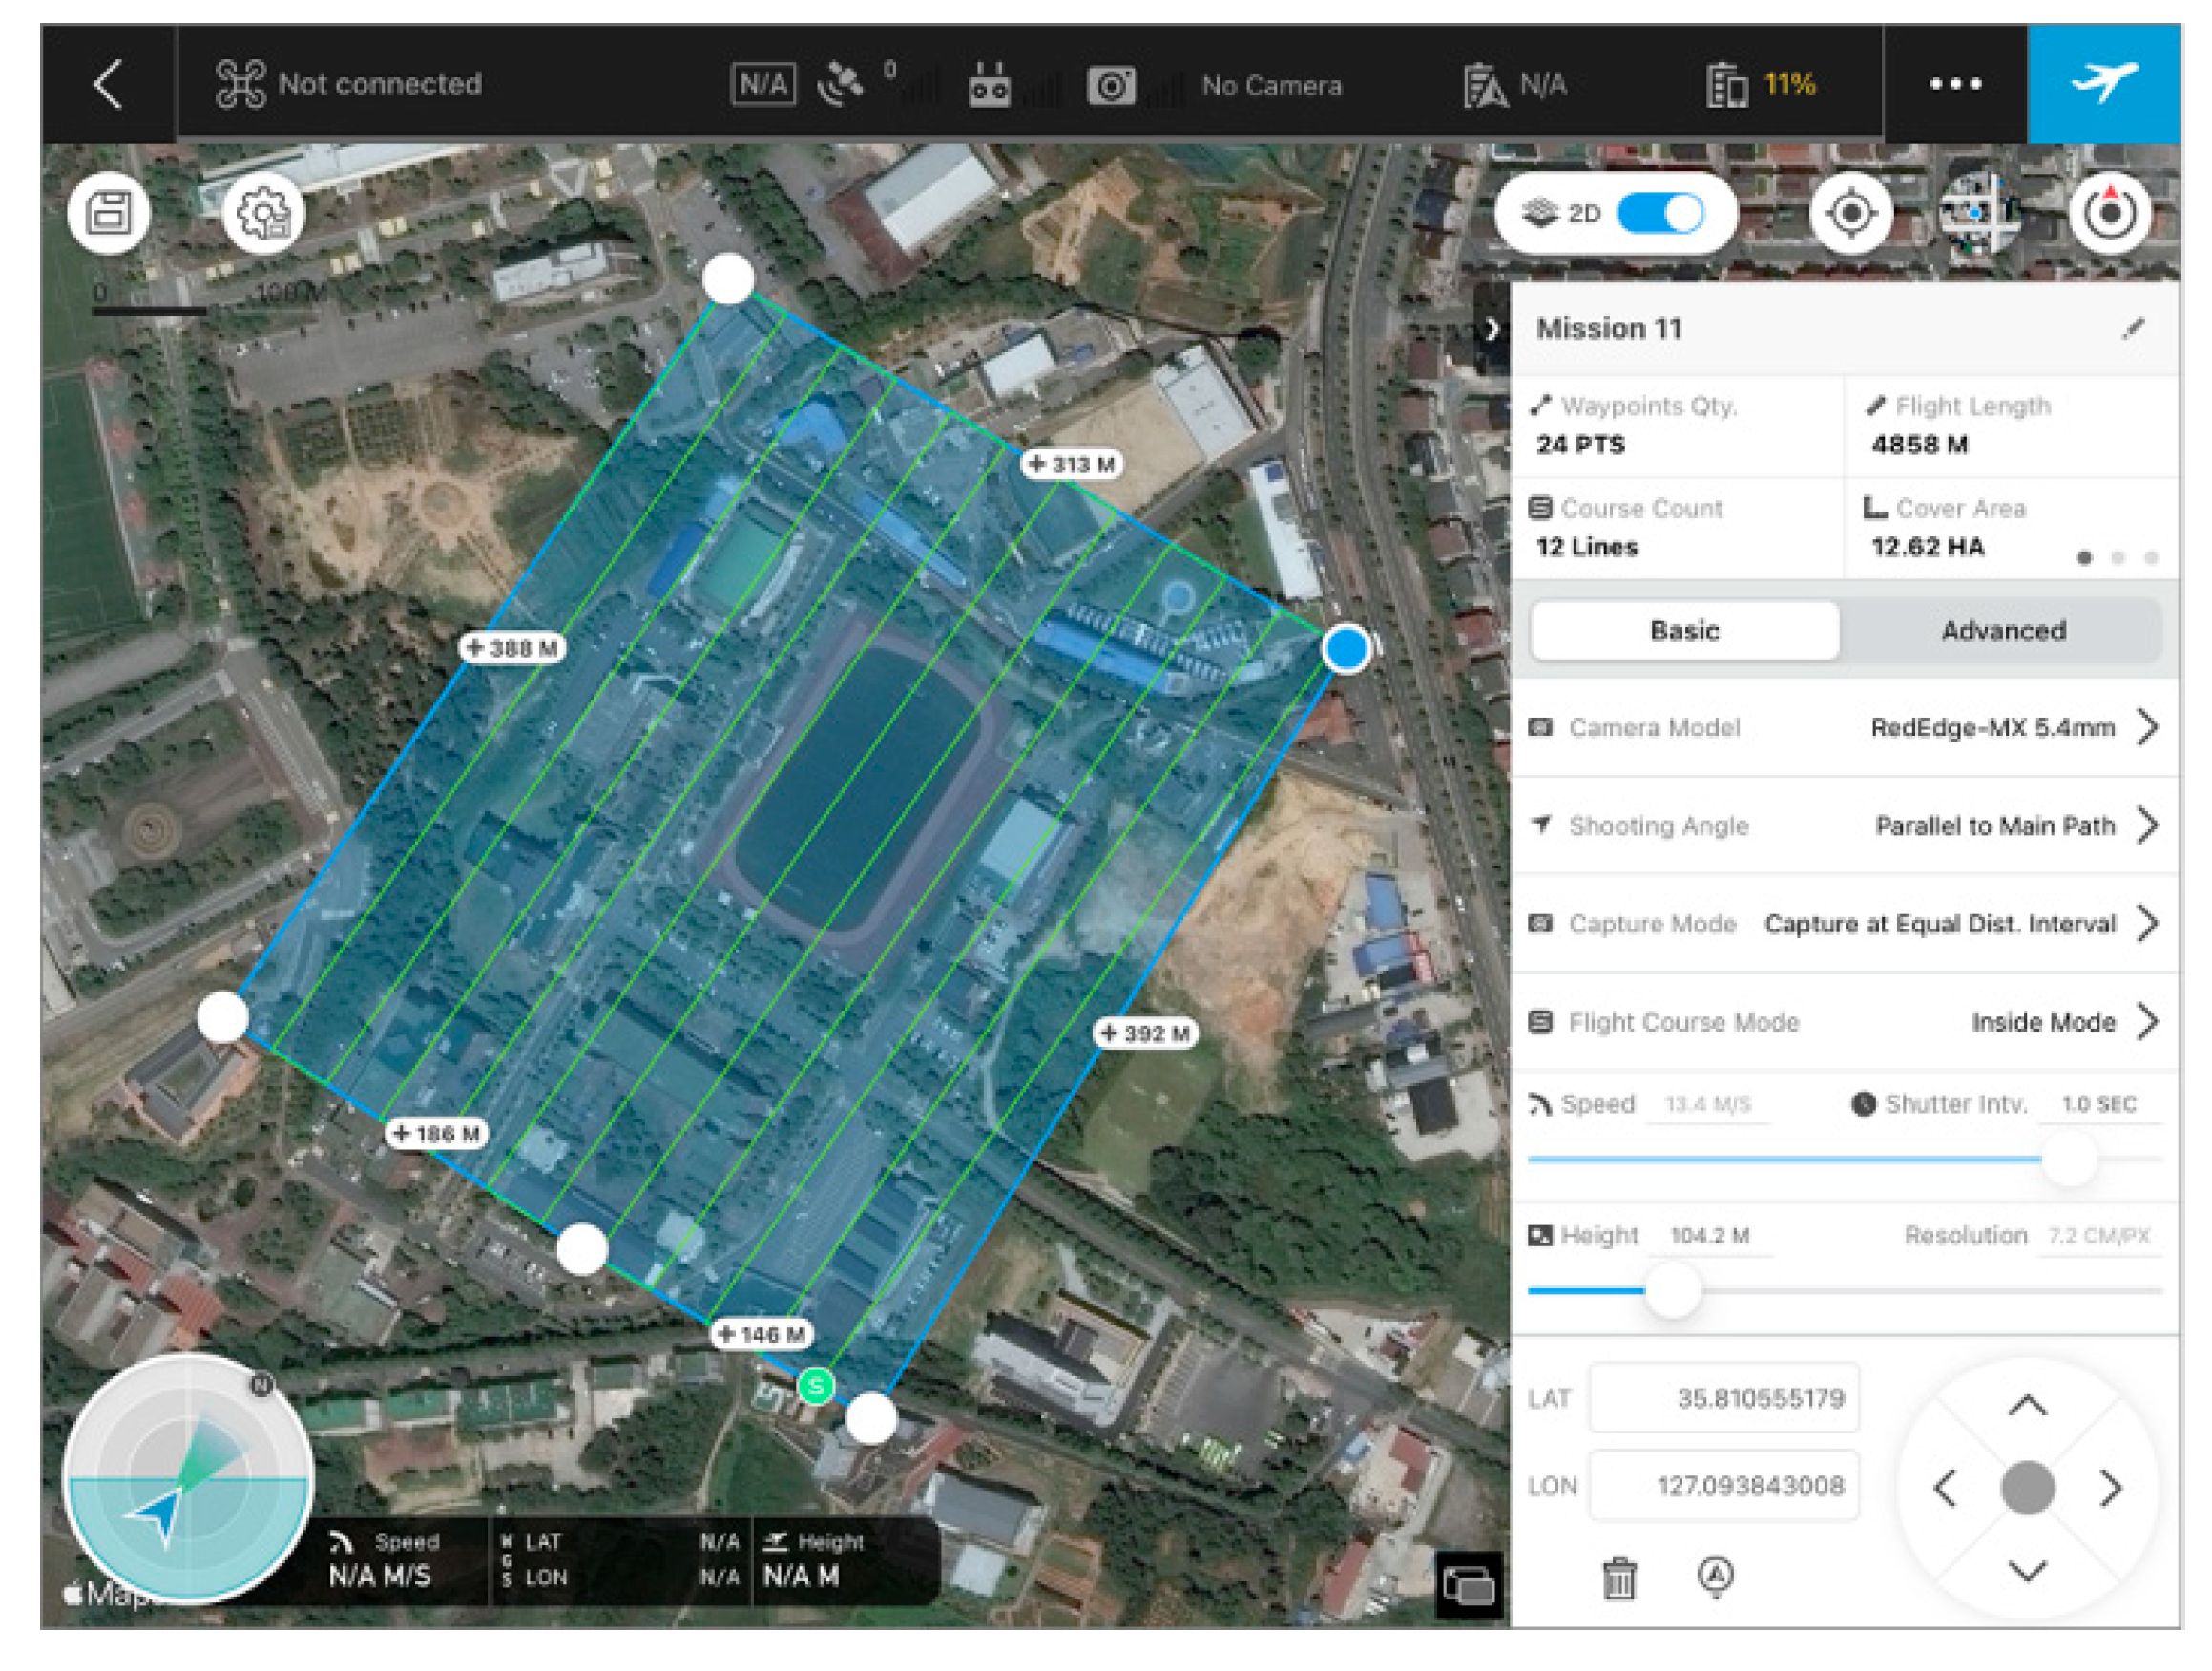
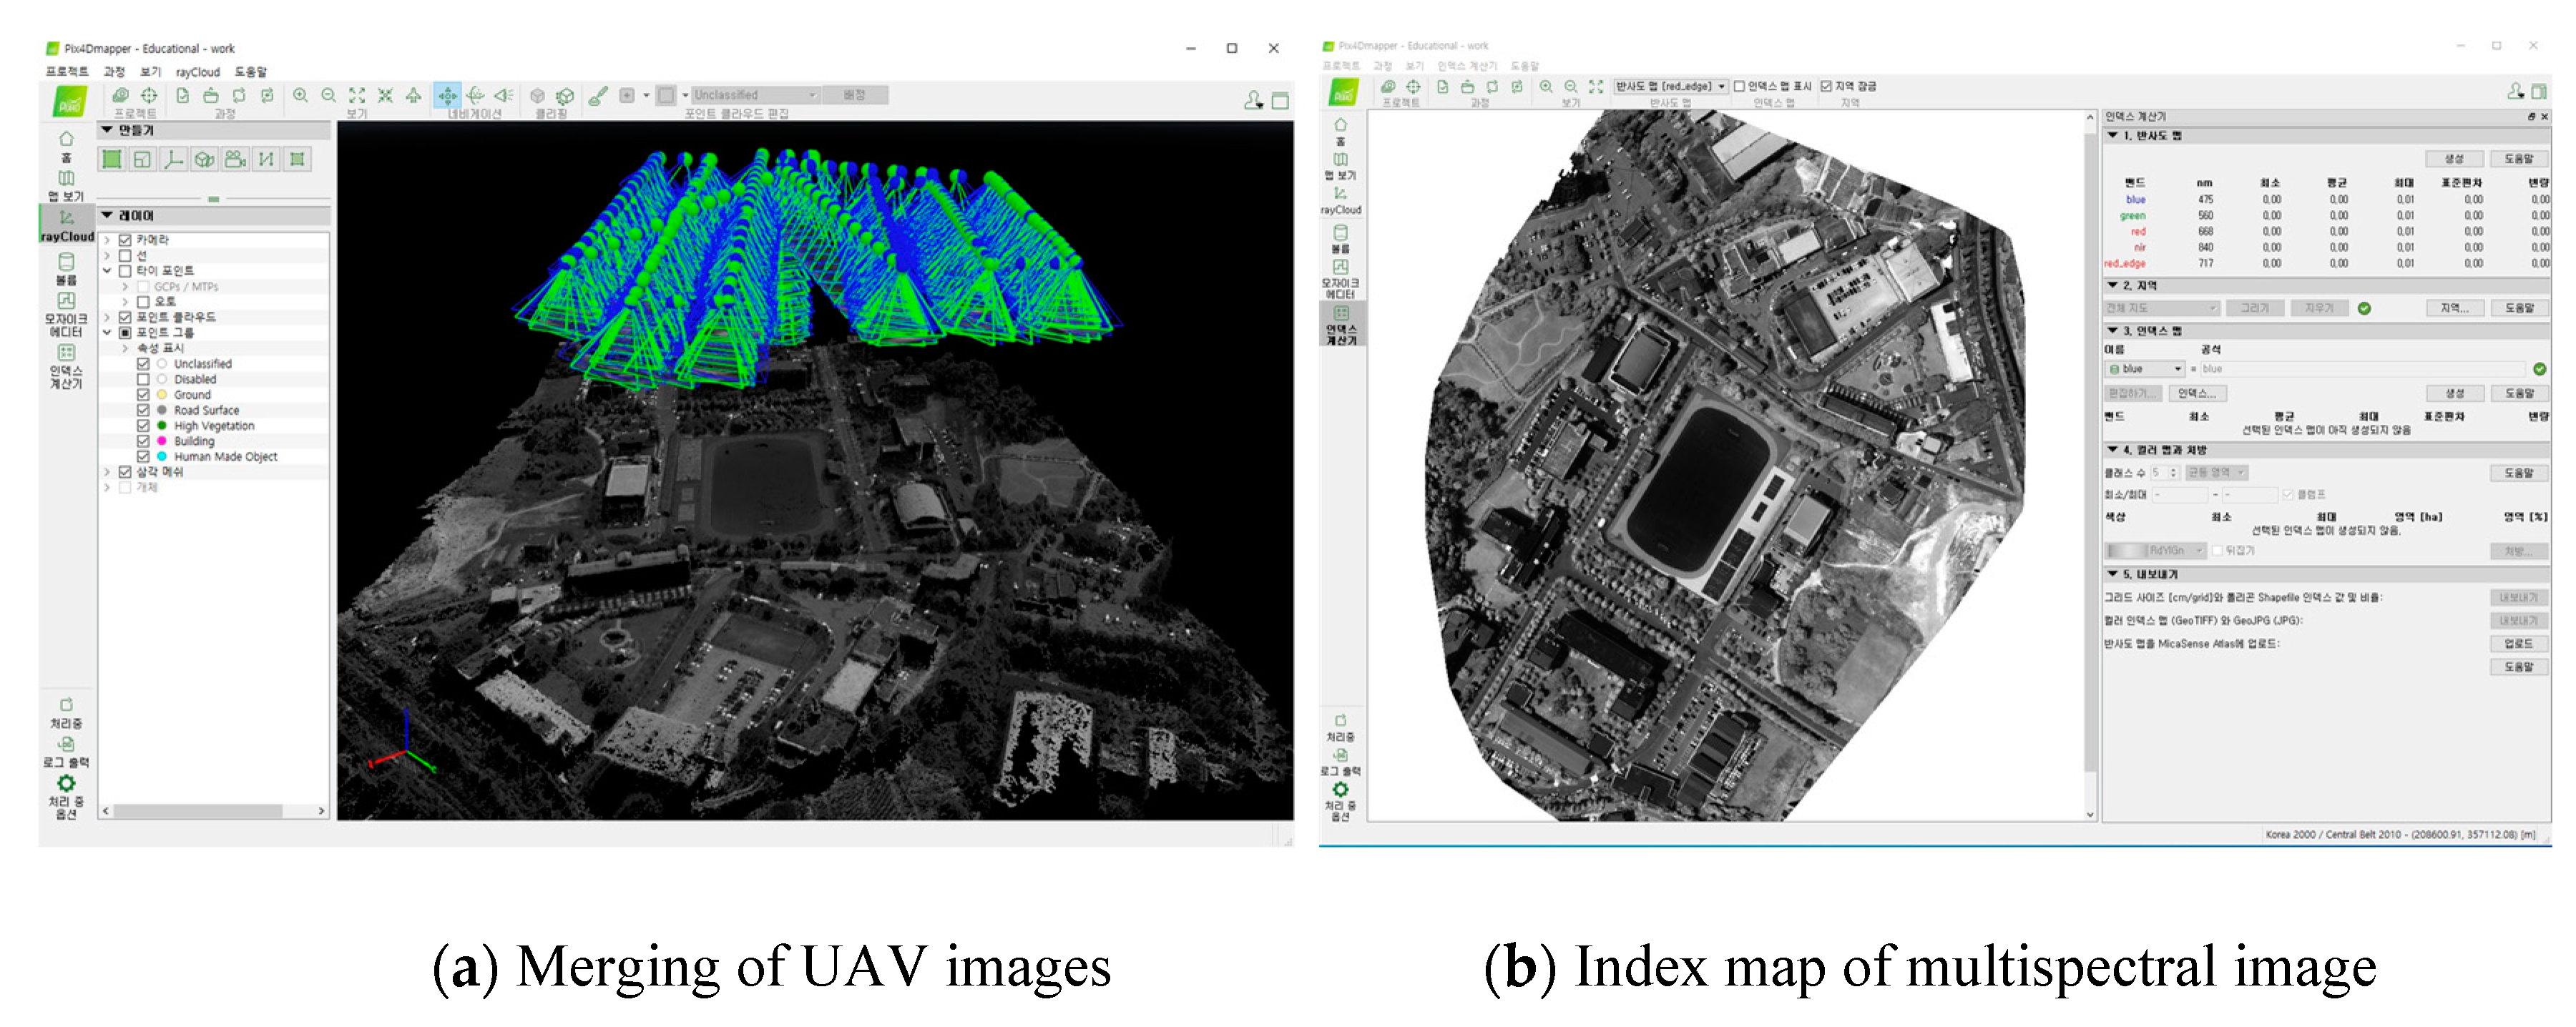
2.3. UAV Image Processing
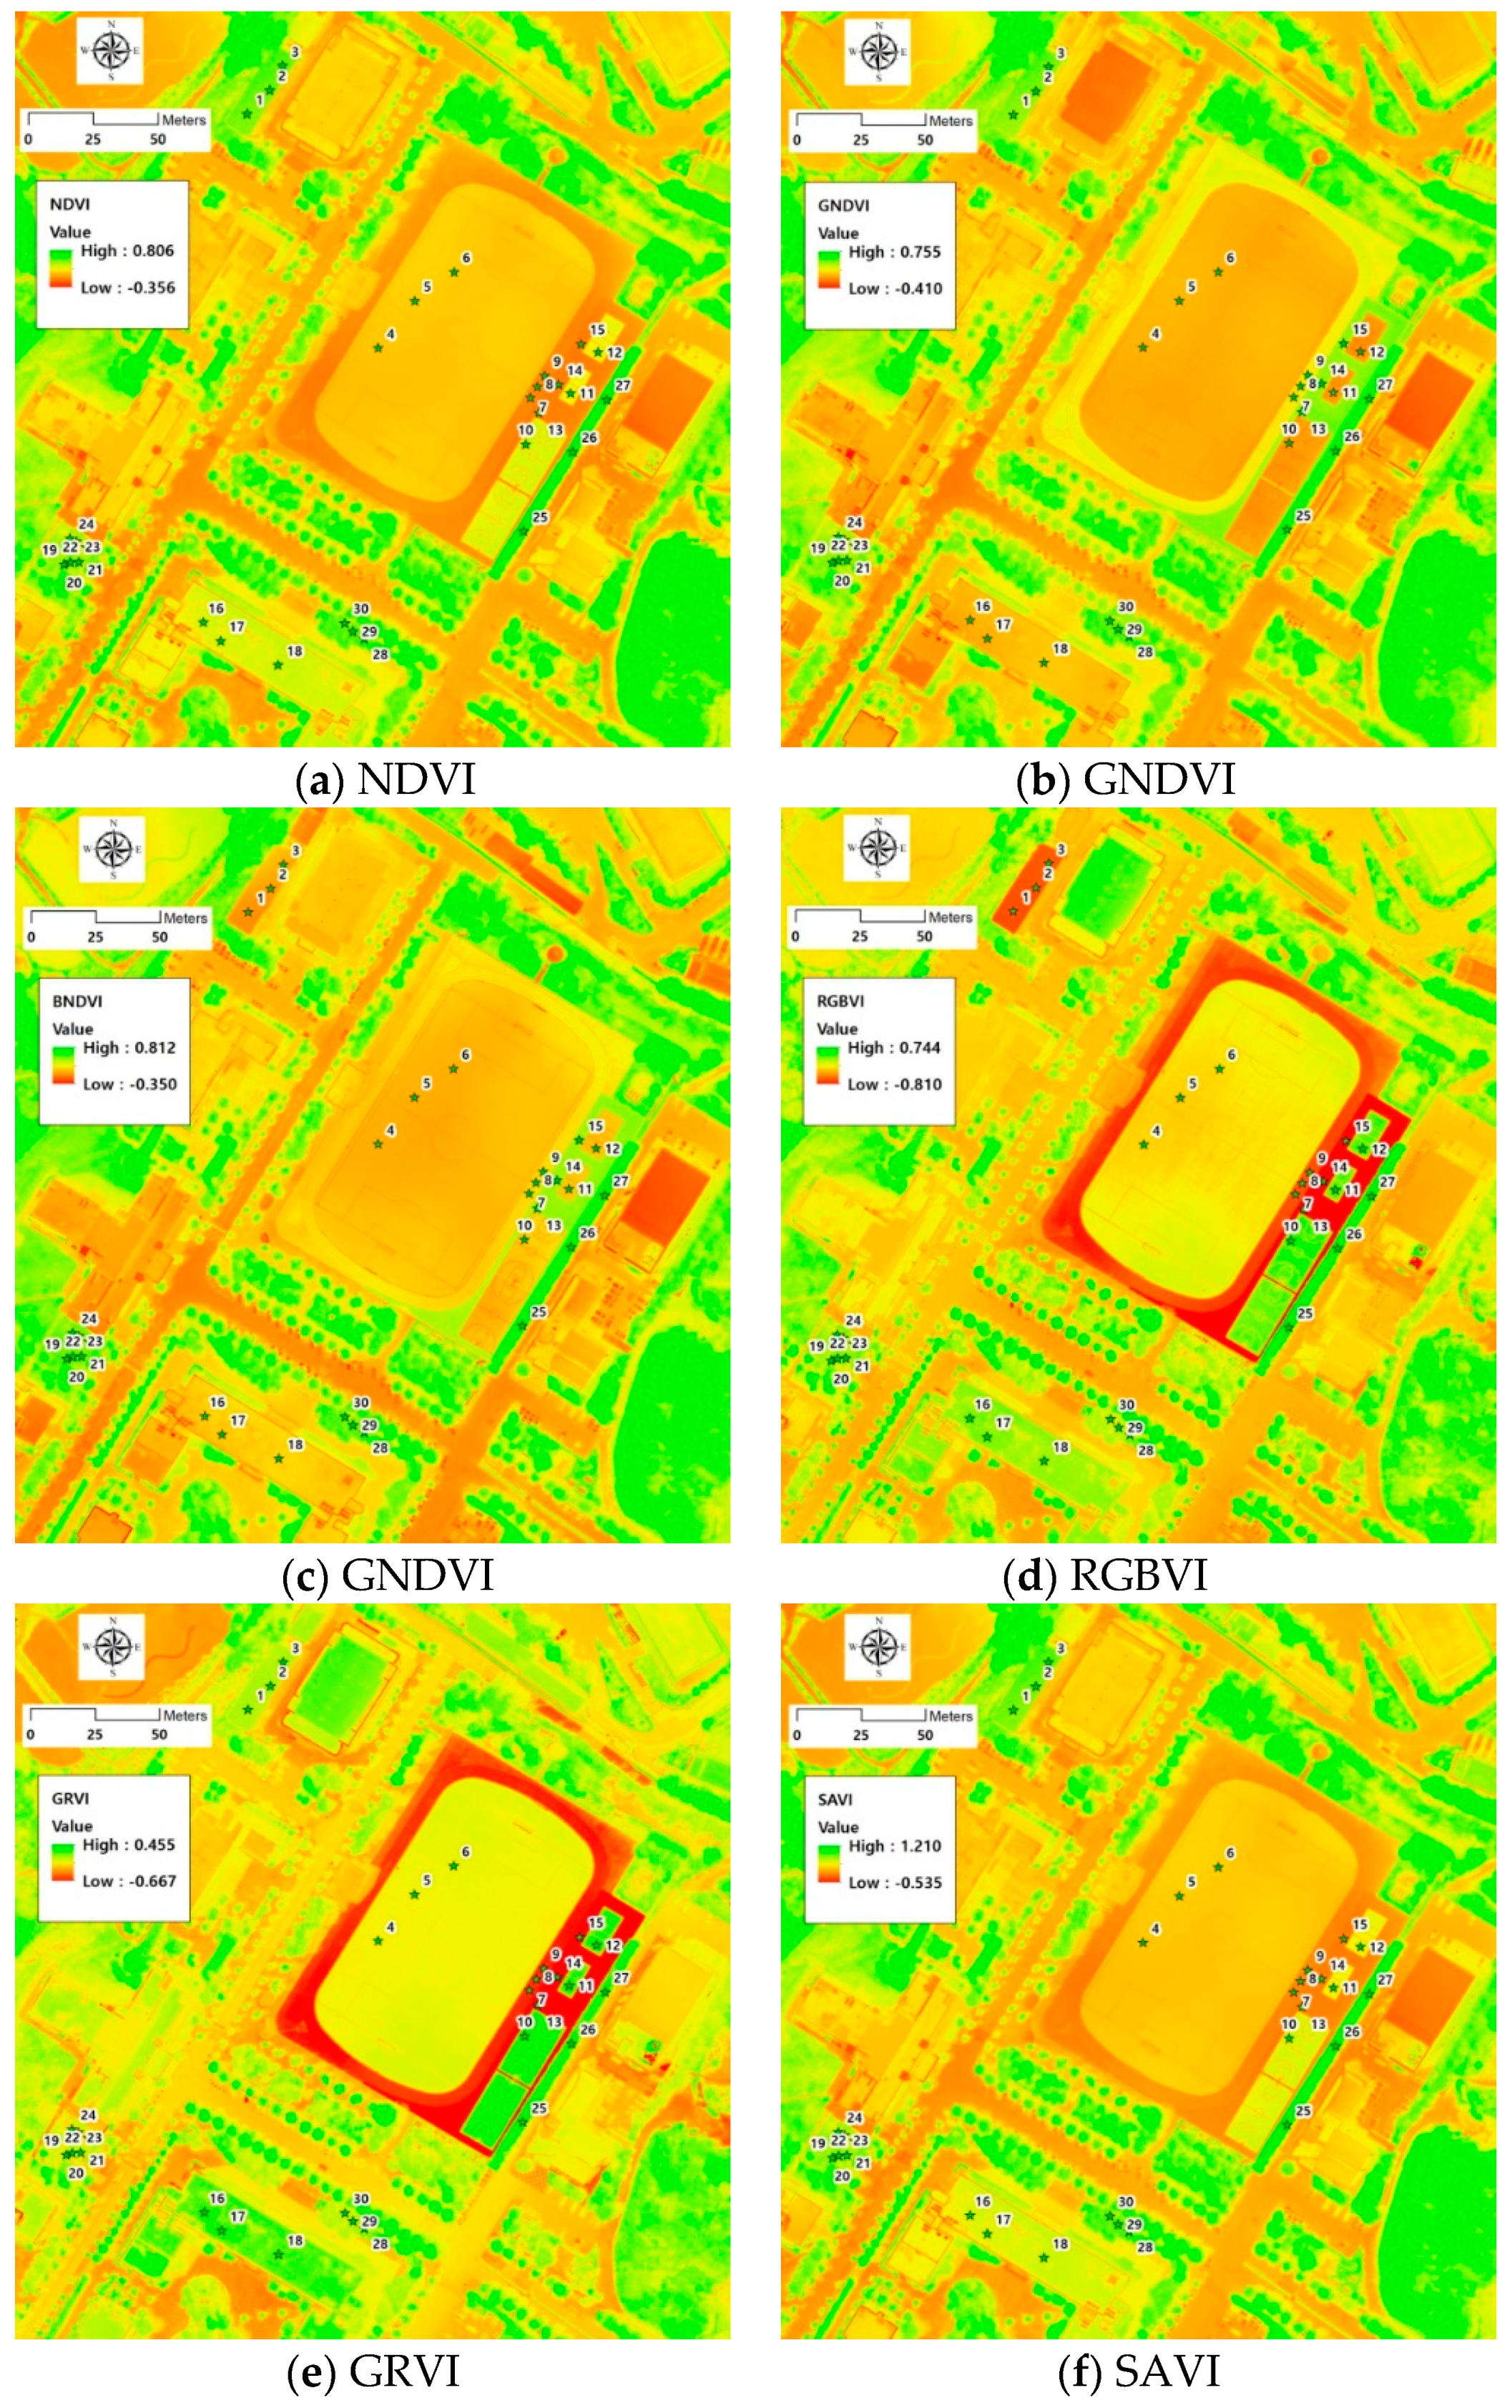
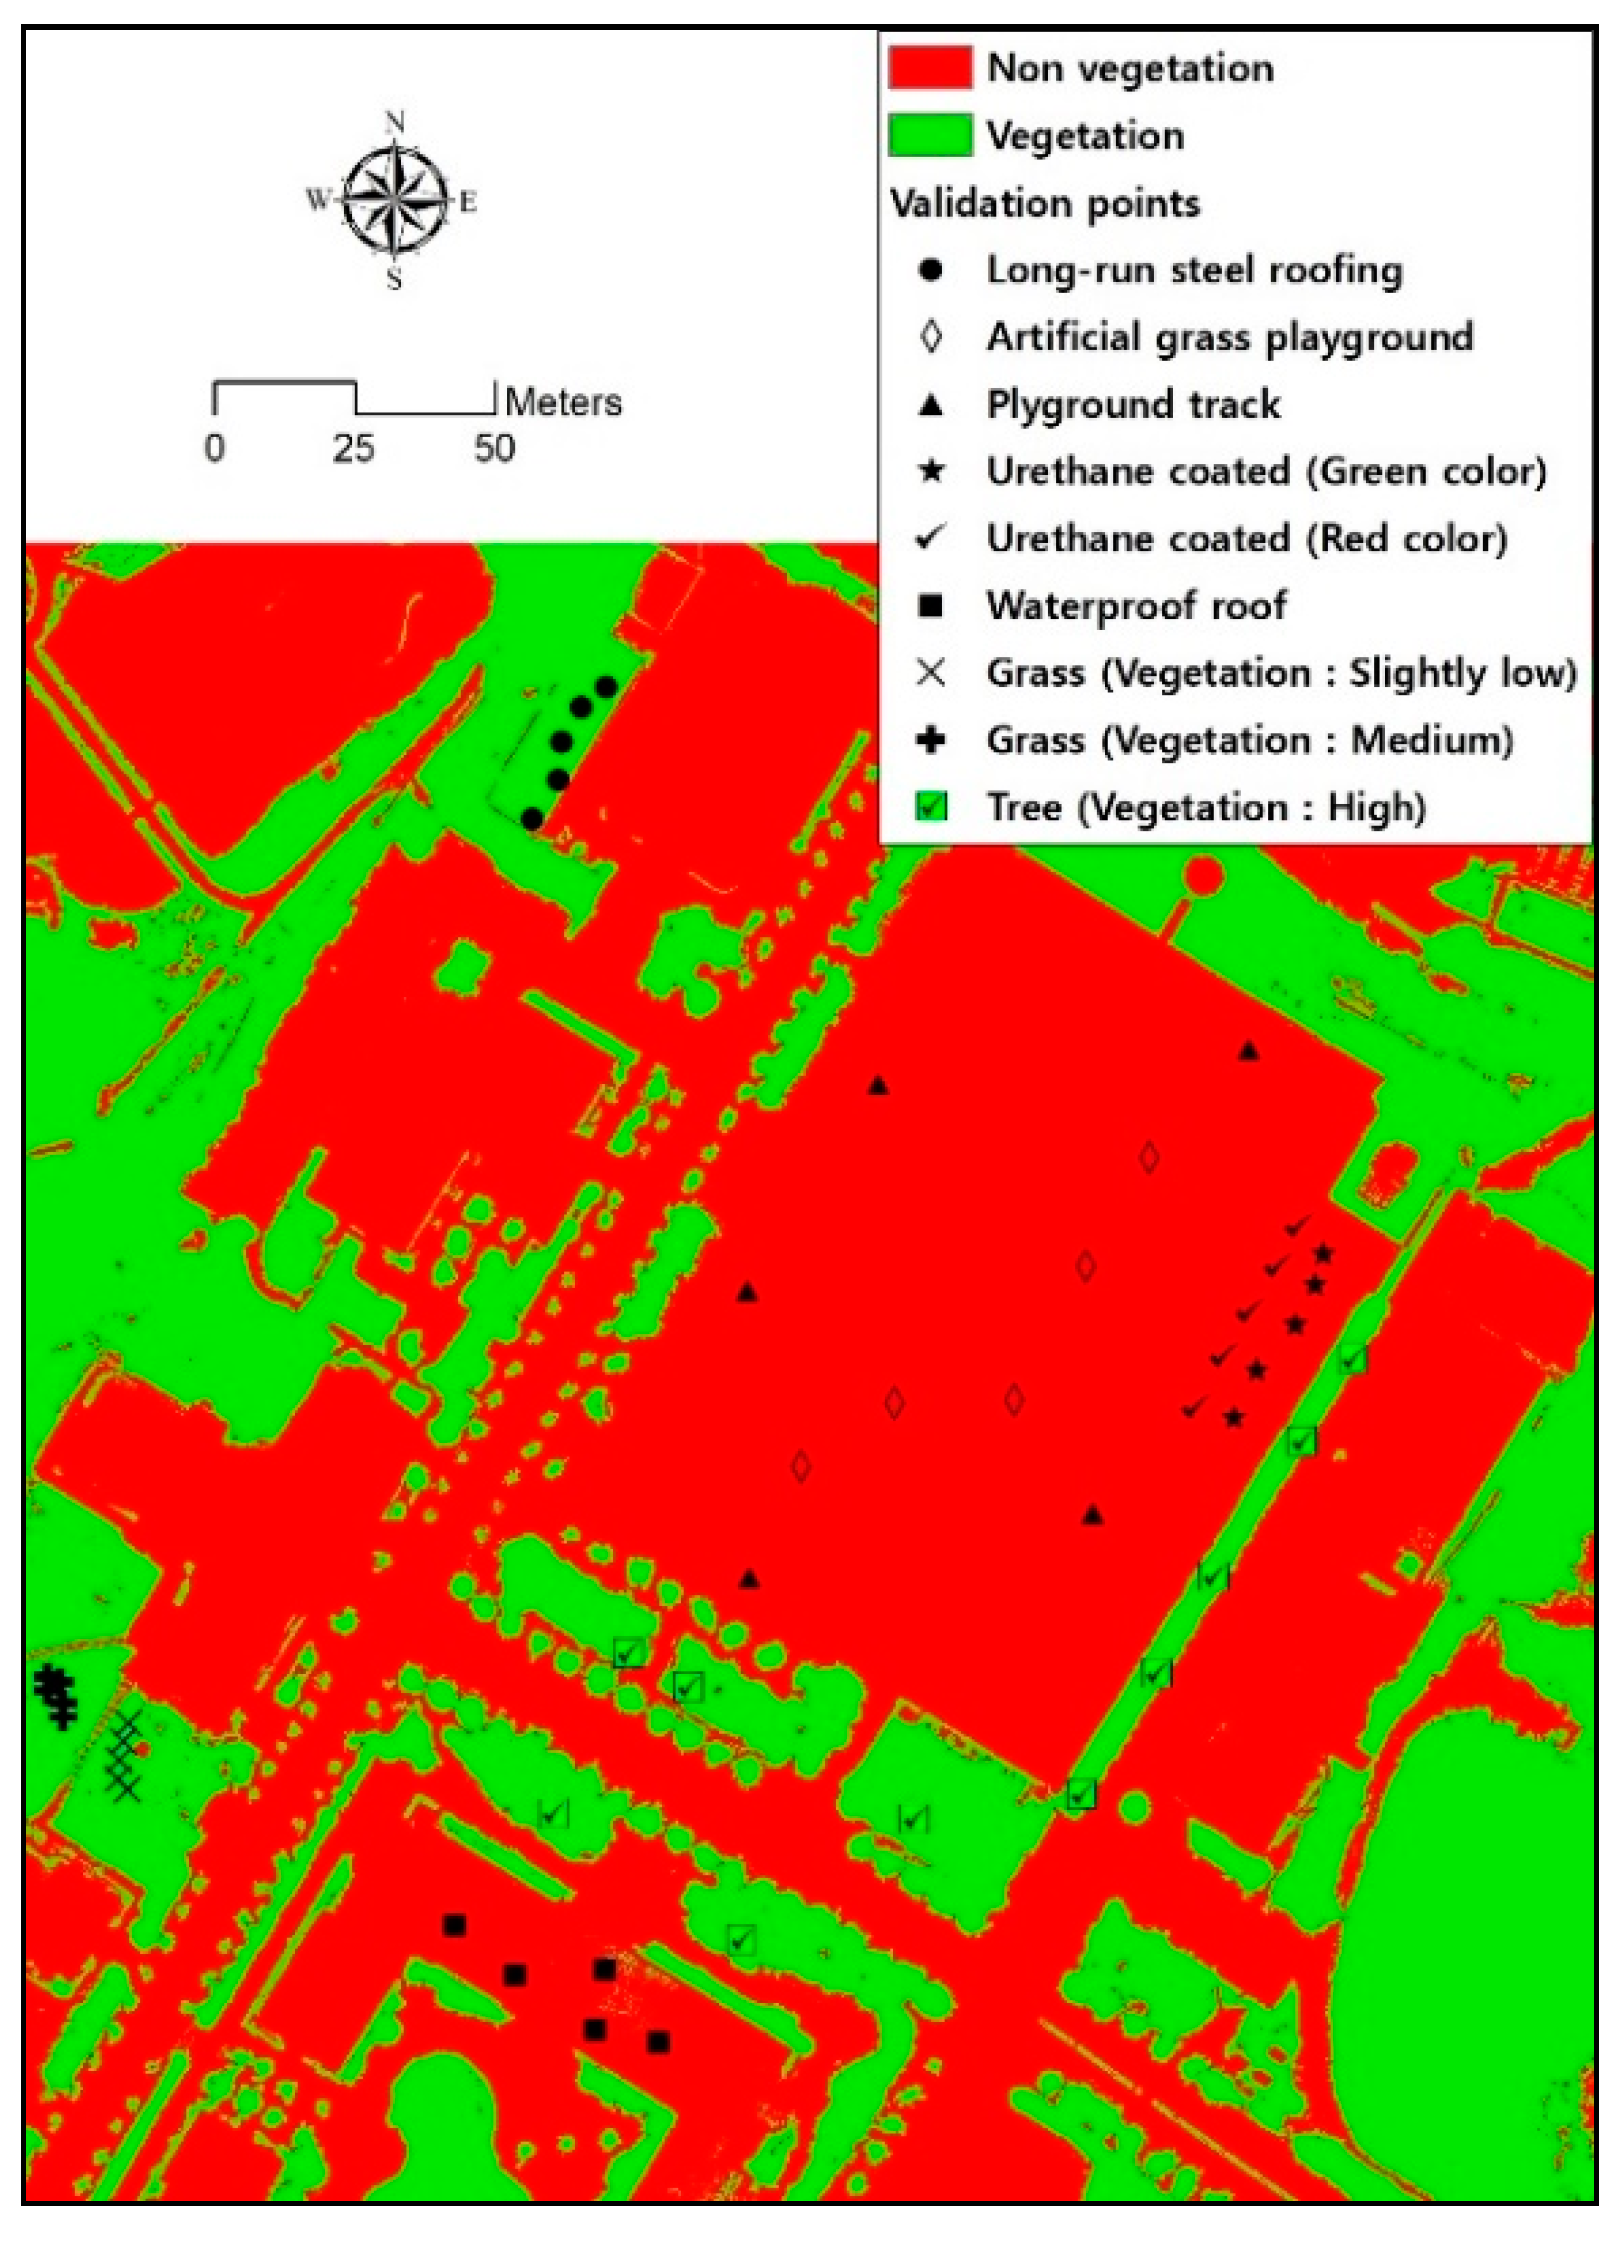
3. Vegetation Analysis Using Existing Vegetation Indices
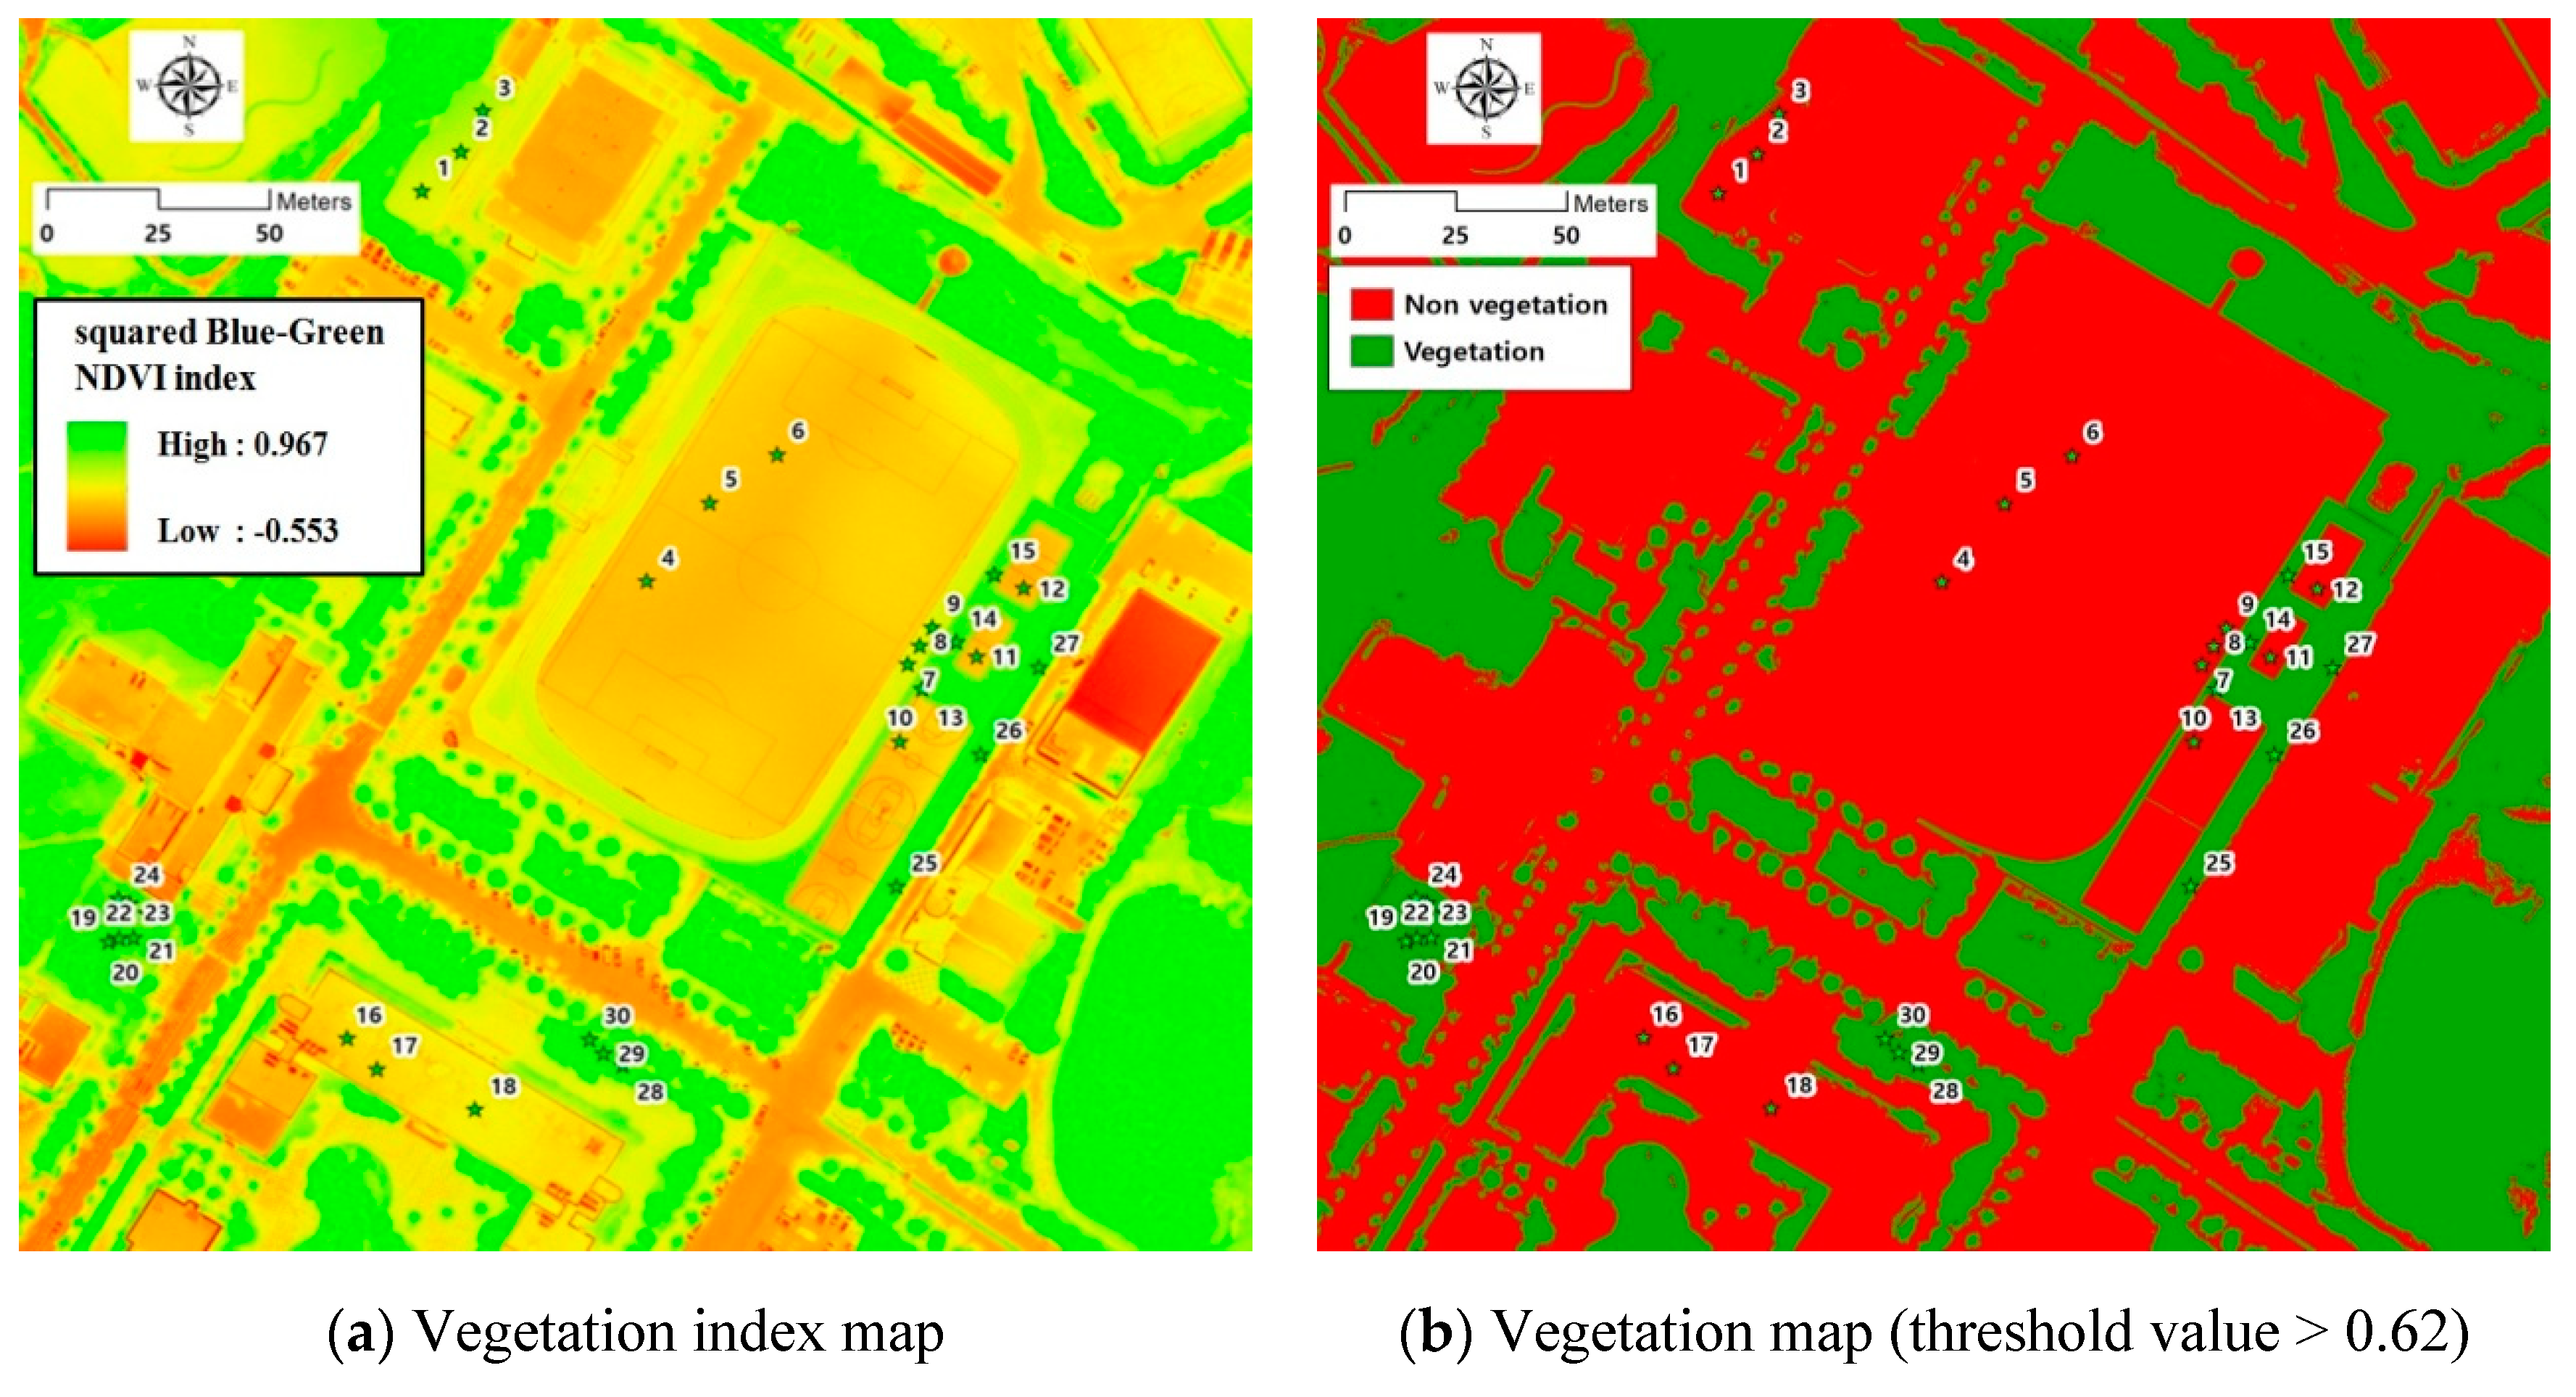
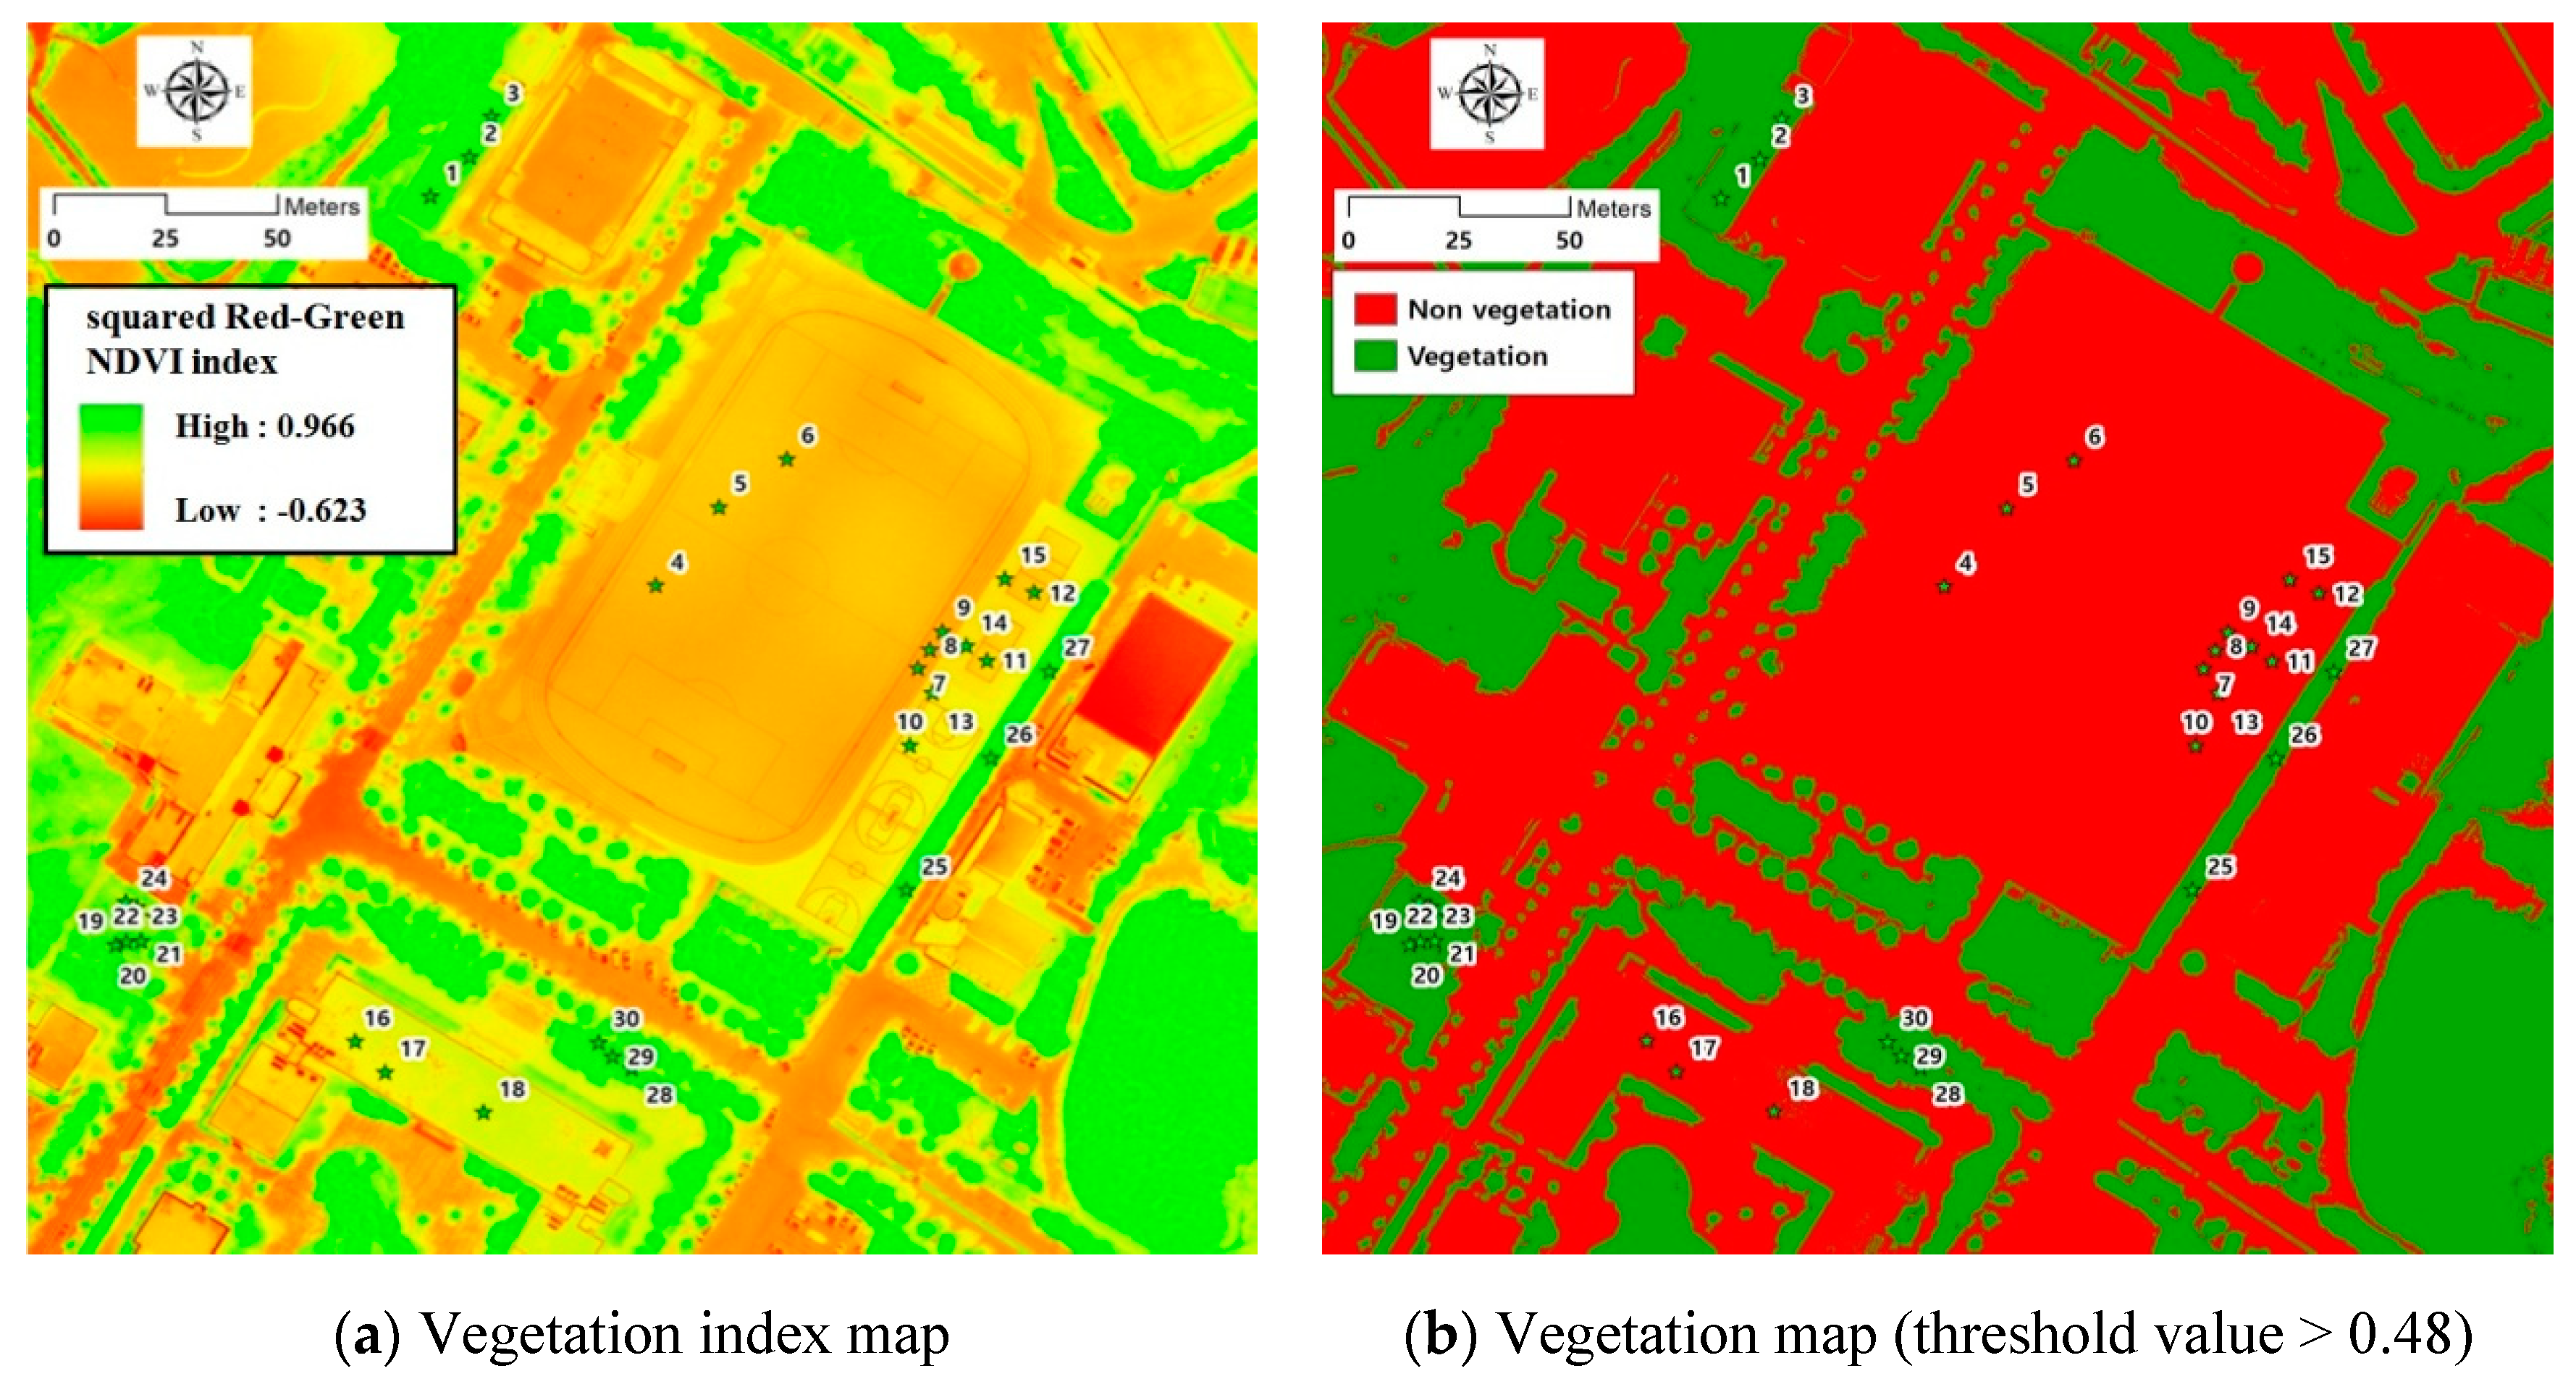
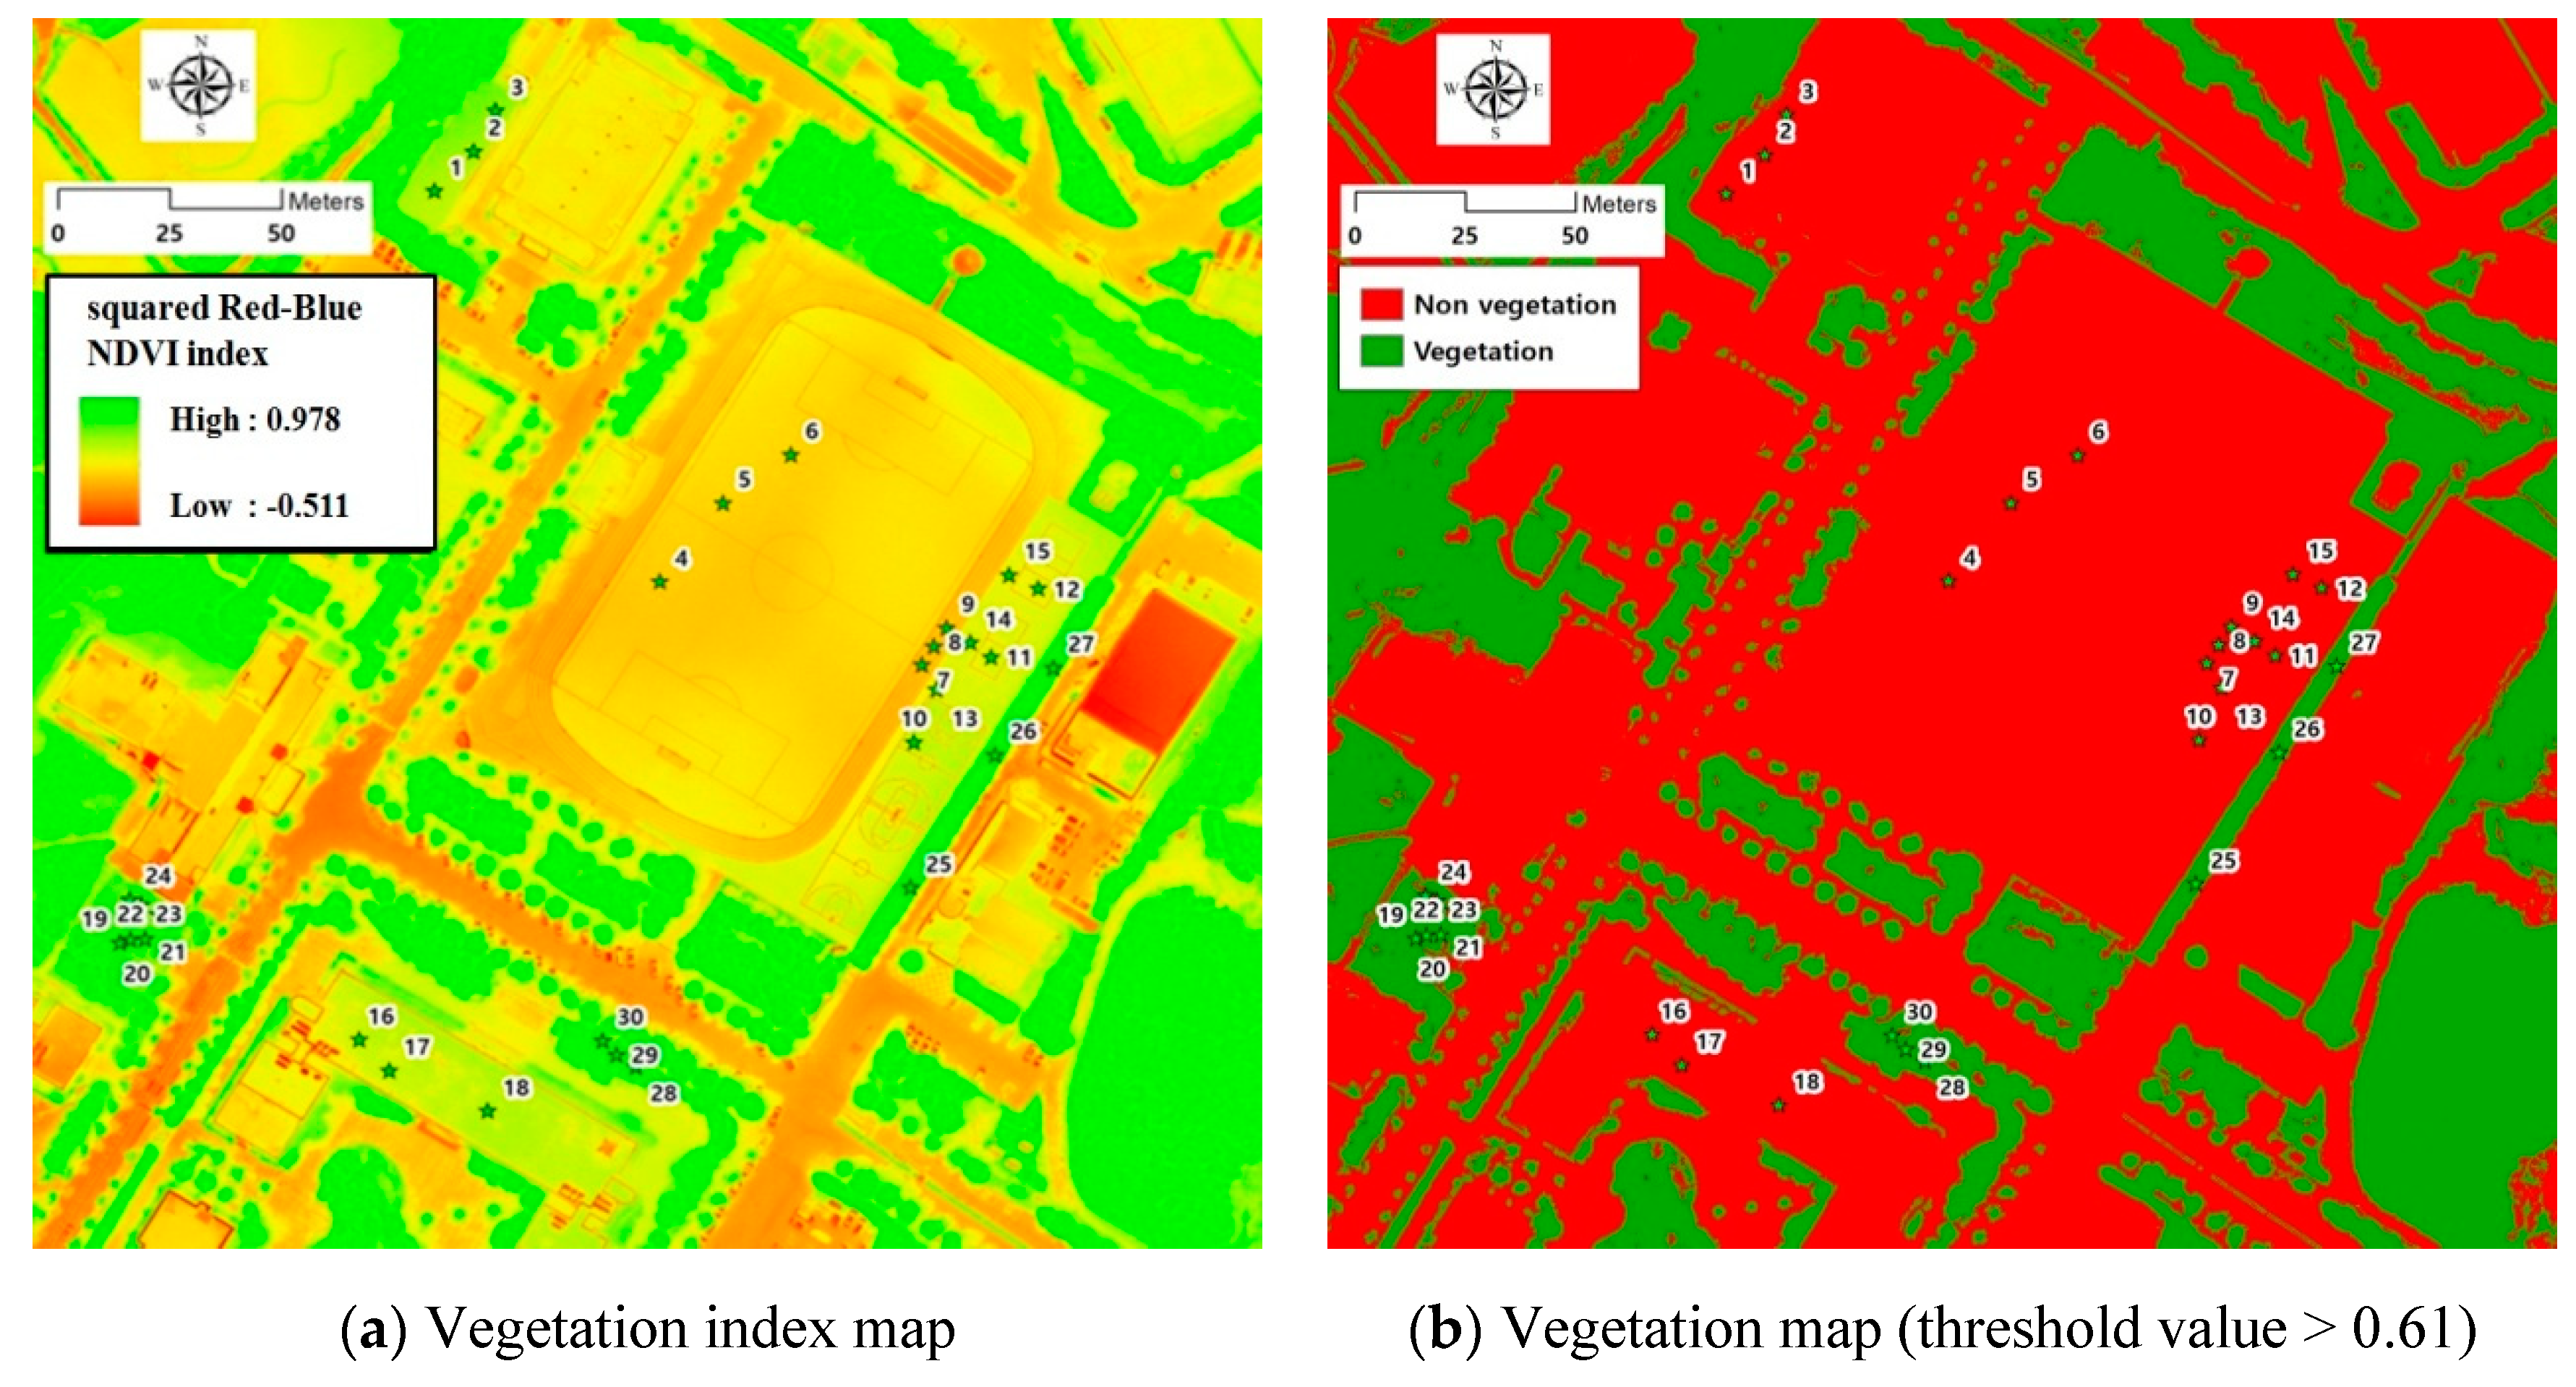
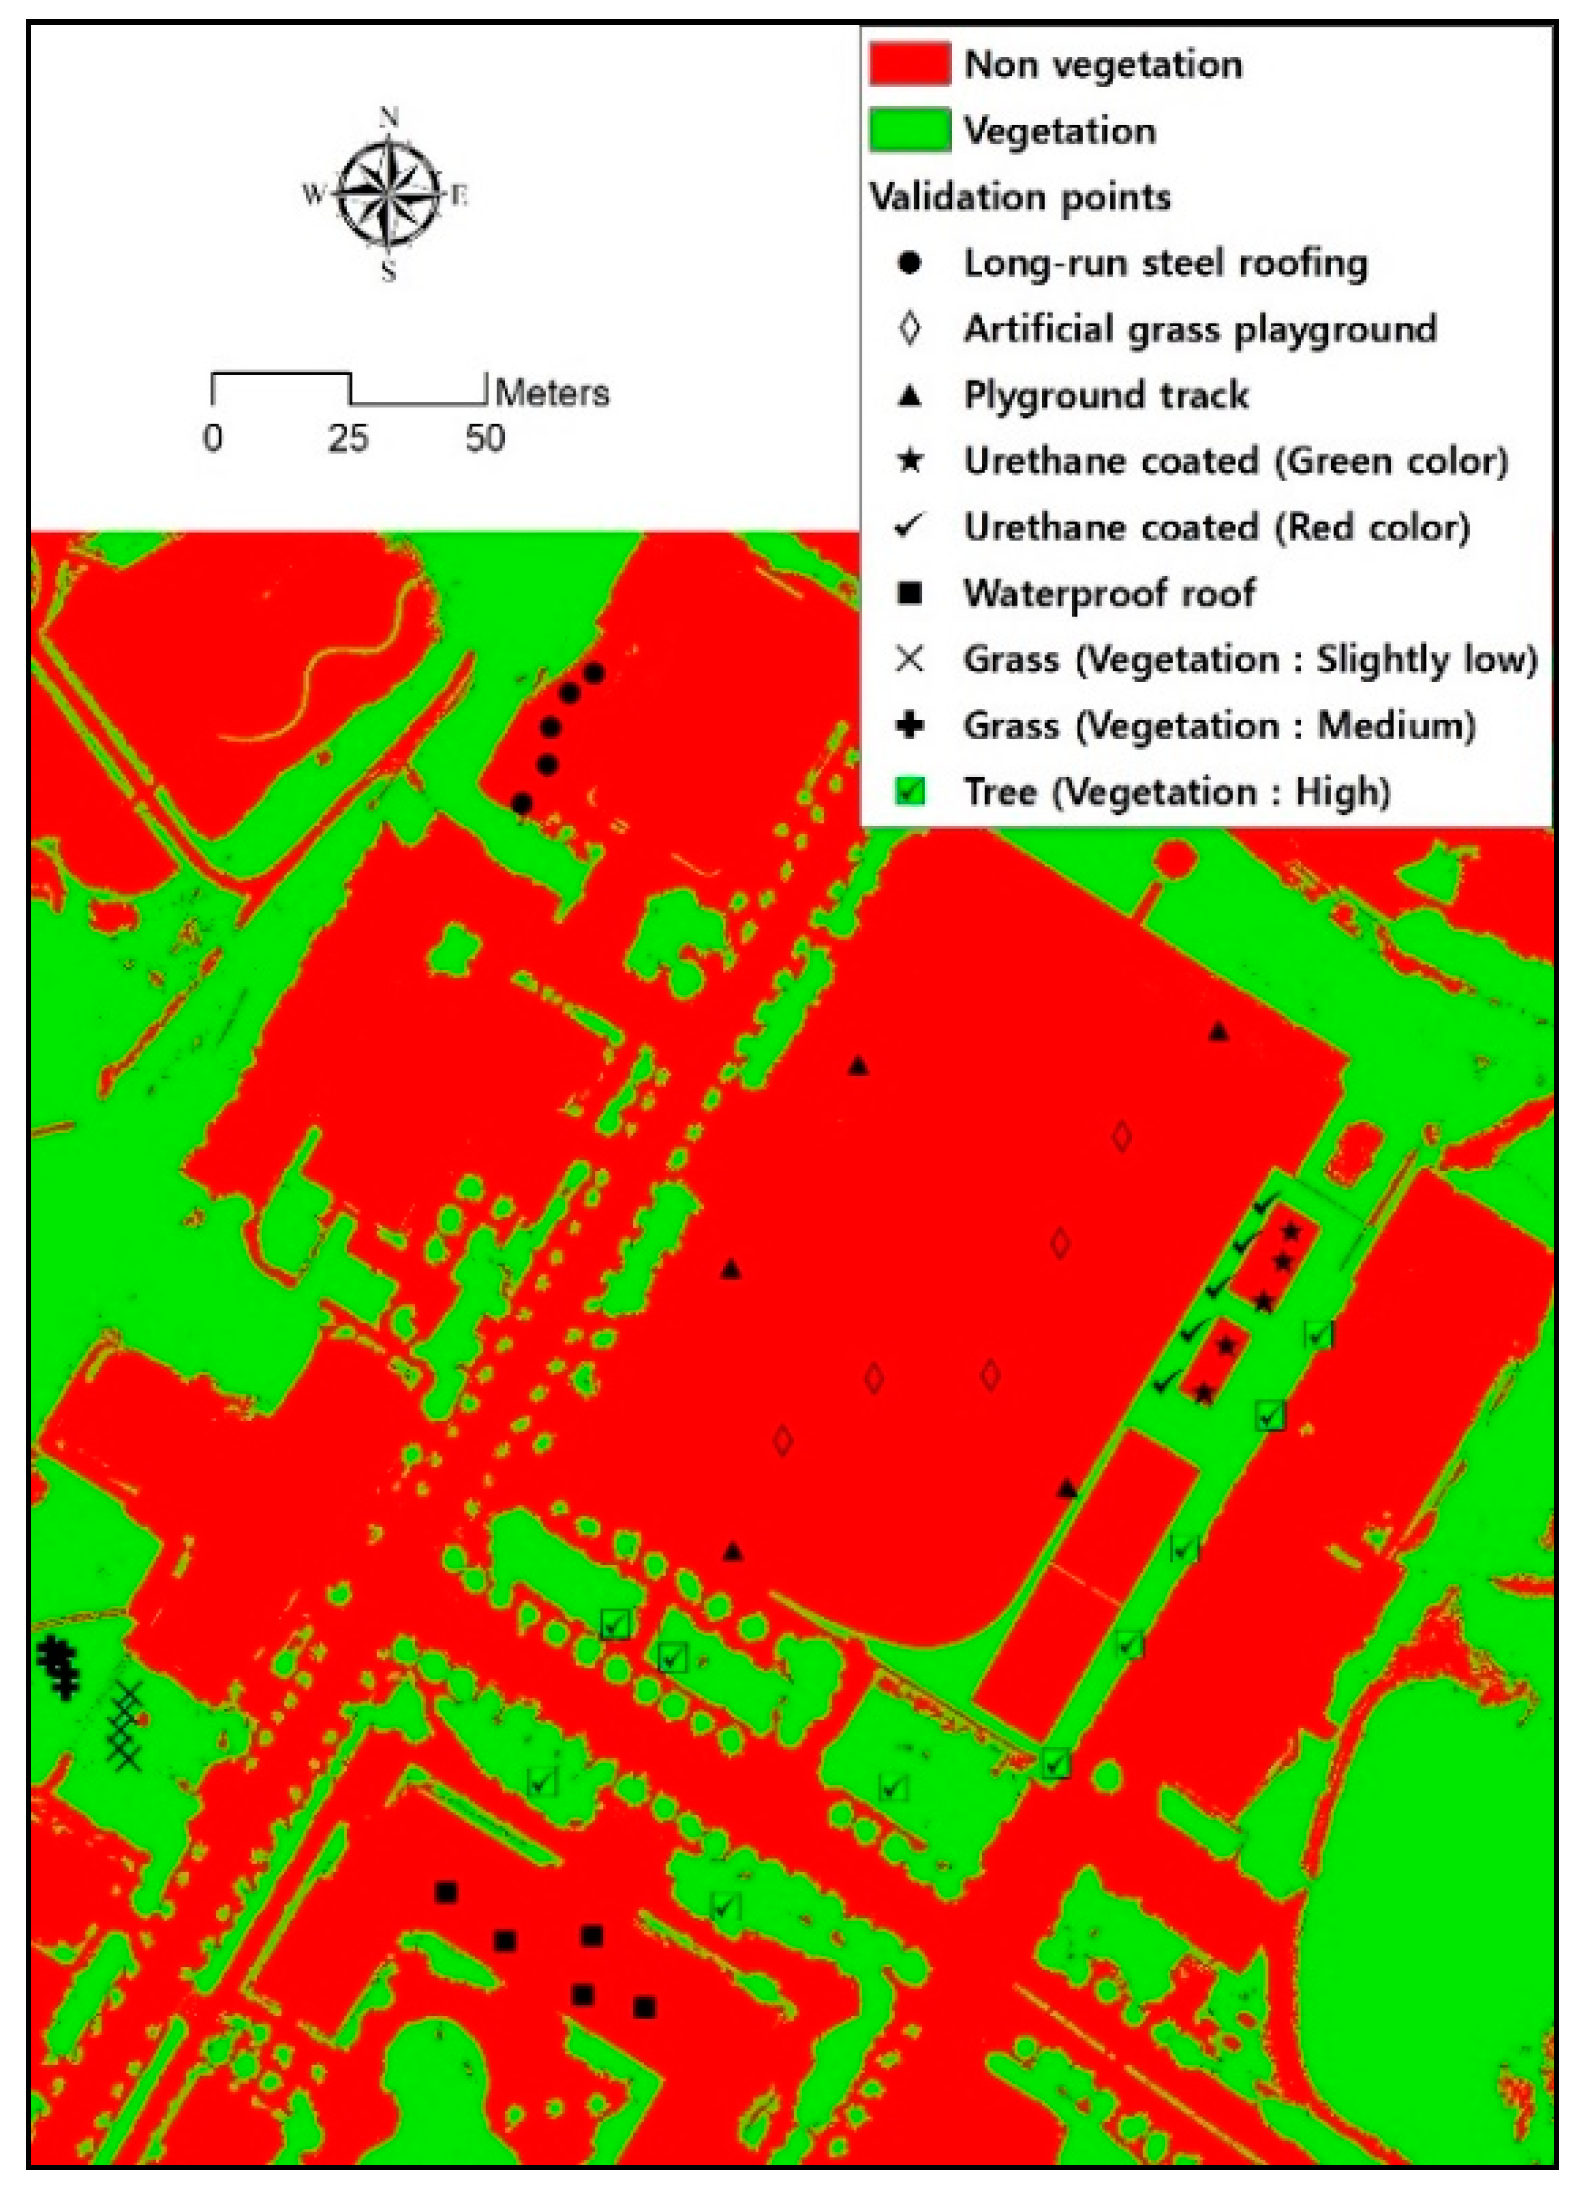
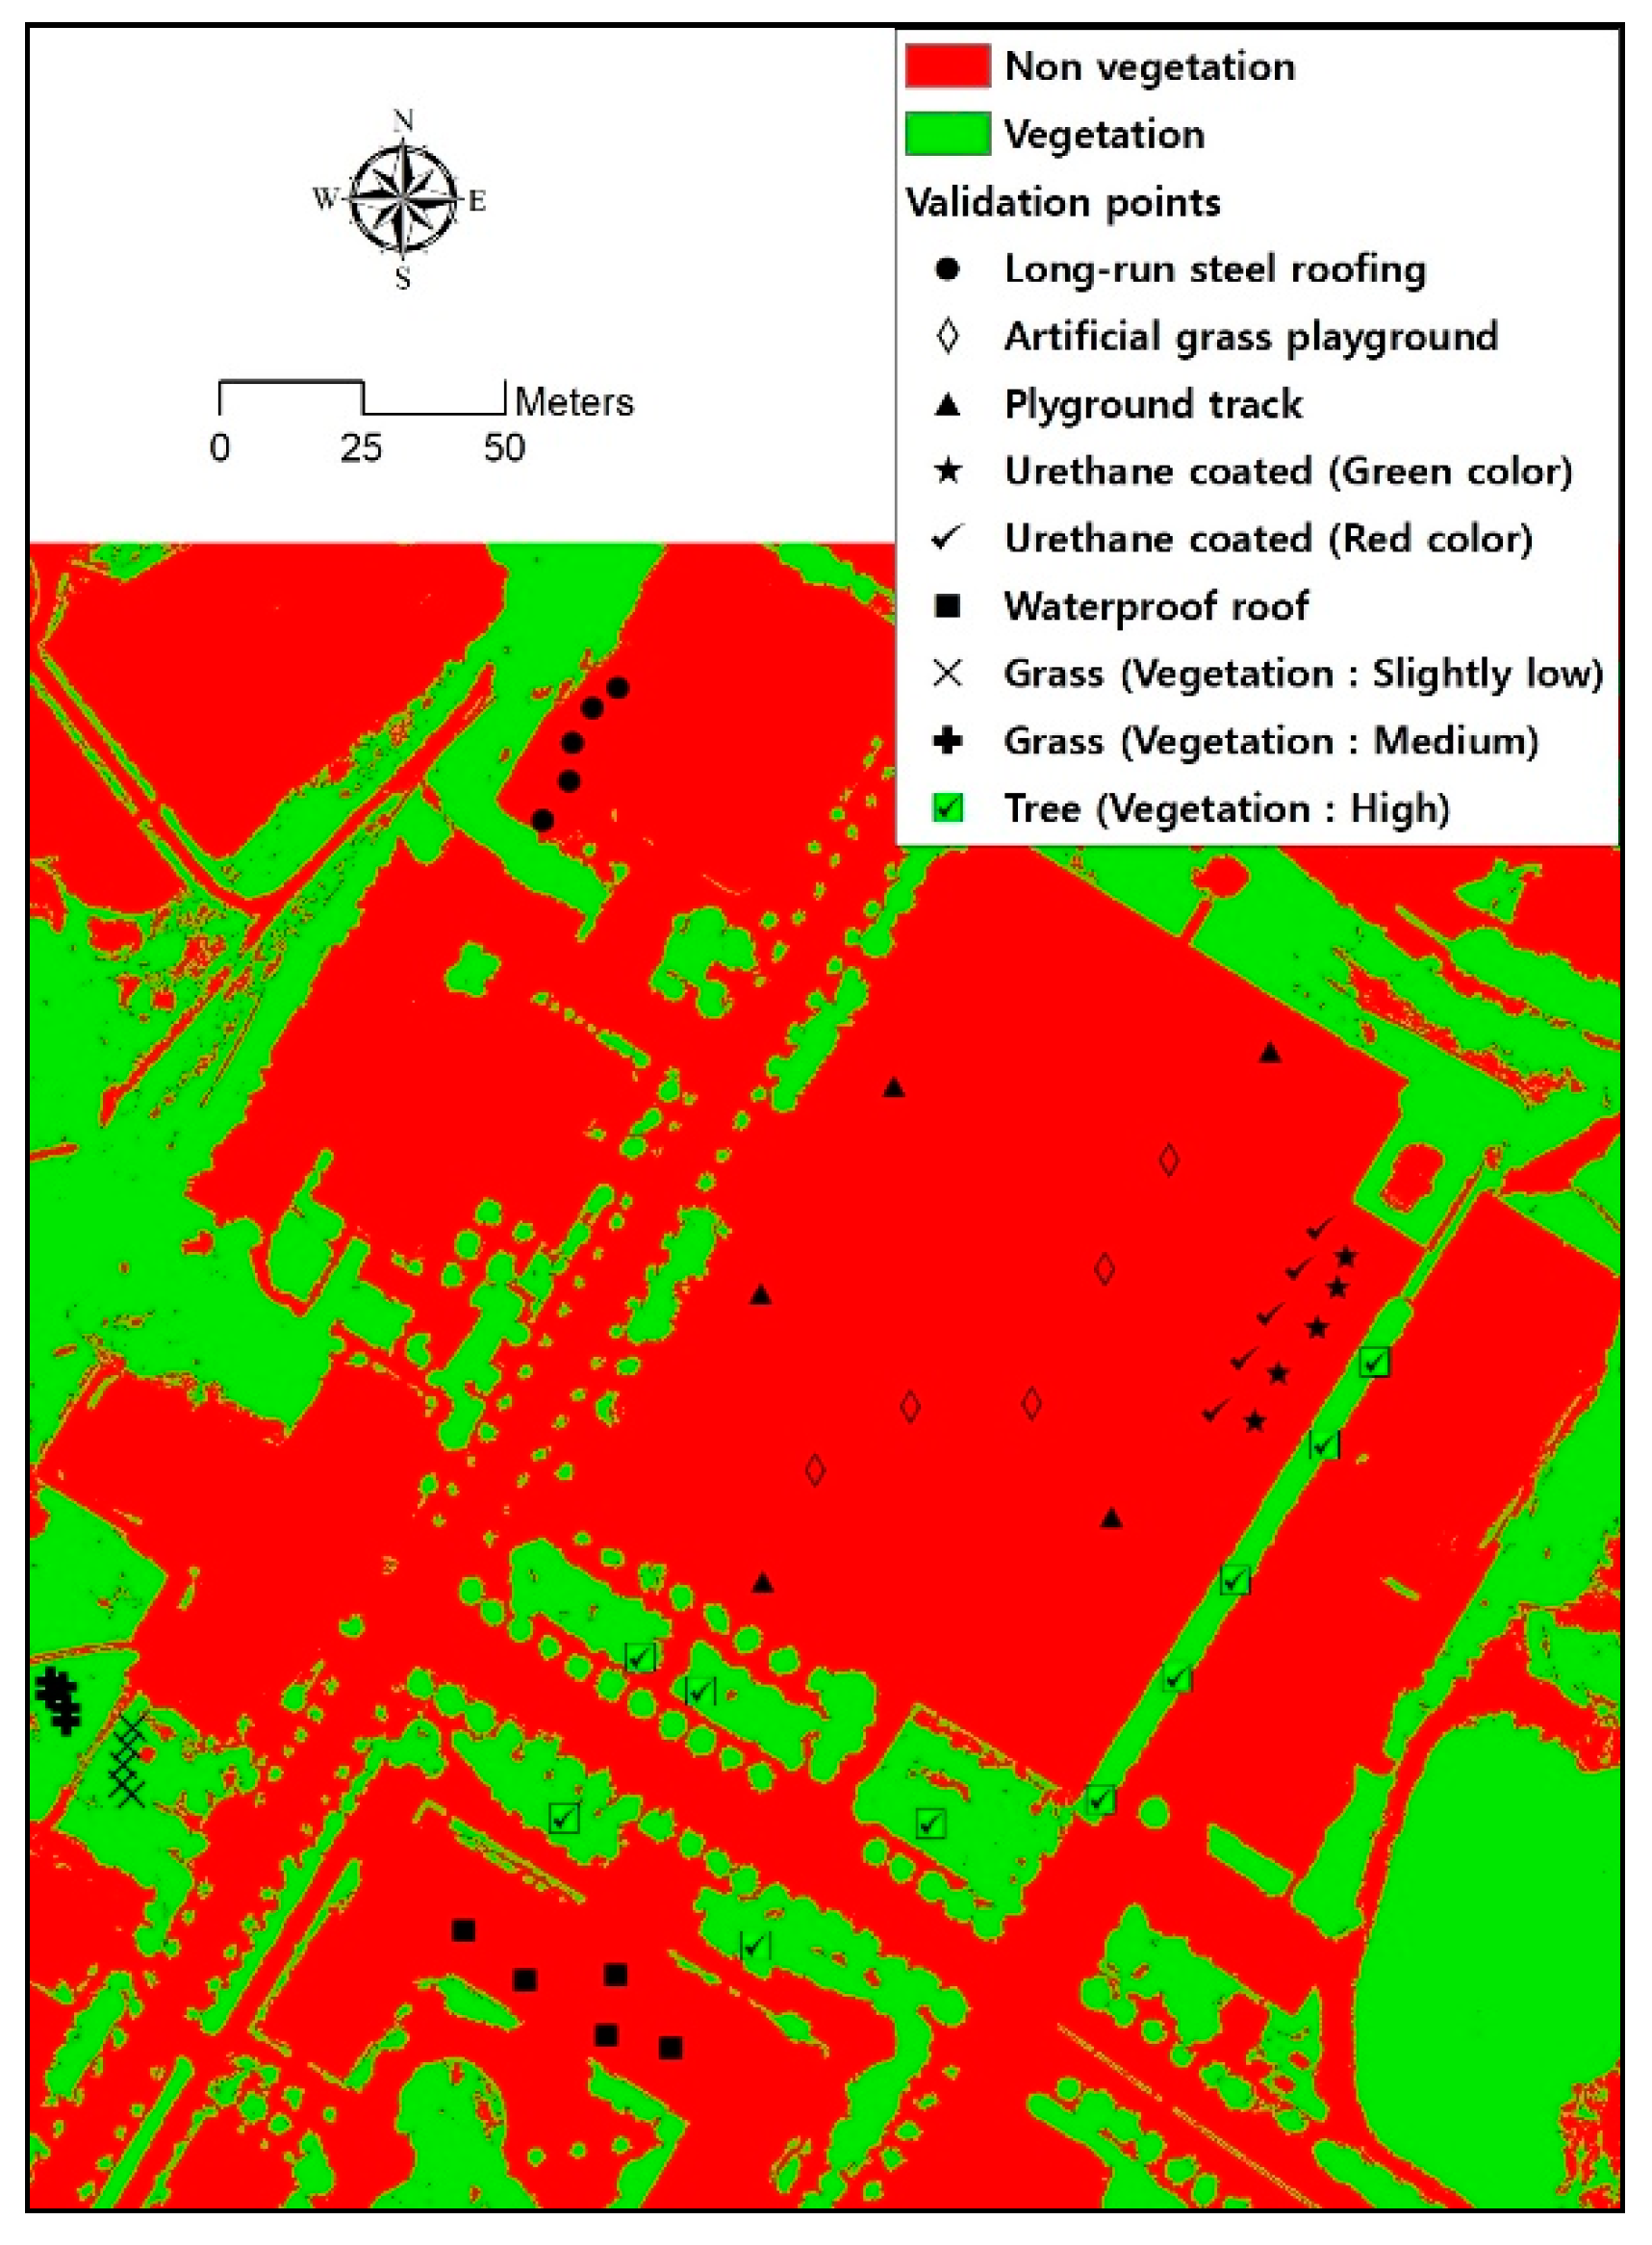
4. A Novel Vegetation Index That Accurately Reflects Urban Land Cover
5. Conclusions
Author Contributions
Funding
Institutional Review Board Statement
Informed Consent Statement
Data Availability Statement
Conflicts of Interest
References
- Fahad, G.R.; Nazari, R.; Bhavsar, P.; Jalayer, M.; Karimi, M. A decision-support framework for emergency evacuation planning during extreme storm events. Transp. Res. Part D Transp. Environ. 2019, 77, 589–605. [Google Scholar] [CrossRef]
- Sabrin, S.; Karimi, M.; Nazari, R. Developing Vulnerability Index to Quantify Urban Heat Islands Effects Coupled with Air Pollution: A Case Study of Camden, NJ. ISPRS Int. J. Geo-Inf. 2020, 9, 349. [Google Scholar] [CrossRef]
- Uddin, N.; Islam, A.S.; Bala, S.K.; Islam, G.T.; Adhikary, S.; Saha, D.; Haque, S.; Fahad, G.R.; Akter, R. Mapping of climate vulnerability of the coastal region of Bangladesh using principal component analysis. Appl. Geogr. 2019, 102, 47–57. [Google Scholar] [CrossRef]
- Peng, J.; Hu, Y.; Dong, J.; Liu, Q.; Liu, Y. Quantifying spatial morphology and connectivity of urban heat islands in a megacity: A radius approach. Sci. Total. Environ. 2020, 714, 136792. [Google Scholar] [CrossRef] [PubMed]
- Sabrin, S.; Karimi, M.; Nazari, R.; Pratt, J.; Bryk, J. Effects of Different Urban-Vegetation Morphology on the Canopy-level Thermal Comfort and the Cooling Benefits of Shade Trees: Case-study in Philadelphia. Sustain. Cities Soc. 2021, 66, 102684. [Google Scholar] [CrossRef]
- Voogt, J.; Oke, T. Thermal remote sensing of urban climates. Remote. Sens. Environ. 2003, 86, 370–384. [Google Scholar] [CrossRef]
- Ziter, C.D.; Pedersen, E.J.; Kucharik, C.J.; Turner, M.G. Scale-dependent interactions between tree canopy cover and impervious surfaces reduce daytime urban heat during summer. Proc. Natl. Acad. Sci. USA 2019, 116, 7575–7580. [Google Scholar] [CrossRef] [PubMed]
- Ellison, D.; Morris, C.E.; Locatelli, B.; Sheil, D.; Cohen, J.; Murdiyarso, D.; Gutierrez, V.; van Noordwijk, M.; Creed, I.F.; Pokorny, J.; et al. Trees, forests and water: Cool insights for a hot world. Glob. Environ. Chang. 2017, 43, 51–61. [Google Scholar] [CrossRef]
- Su, Y.; Liu, L.; Wu, J.; Chen, X.; Shang, J.; Ciais, P.; Zhou, G.; Lafortezza, R.; Wang, Y.; Yuan, W.; et al. Quantifying the biophysical effects of forests on local air temperature using a novel three-layered land surface energy balance model. Environ. Int. 2019, 132, 105080. [Google Scholar] [CrossRef] [PubMed]
- D’Amour, C.B.; Reitsma, F.; Baiocchi, G.; Barthel, S.; Güneralp, B.; Erb, K.-H.; Haberl, H.; Creutzig, F.; Seto, K.C. Future urban land expansion and implications for global croplands. Proc. Natl. Acad. Sci. USA 2017, 114, 8939–8944. [Google Scholar] [CrossRef] [PubMed]
- Seto, K.C.; Guneralp, B.; Hutyra, L.R. Global forecasts of urban expansion to 2030 and direct impacts on biodiversity and carbon pools. Proc. Natl. Acad. Sci. USA 2012, 109, 16083–16088. [Google Scholar] [CrossRef] [PubMed]
- Rouse, J.W.; Haas, R.H.; Schell, J.A.; Deering, D.W. Monitoring vegetation systems in the Great Plains with ERTS. NASA Spec. Publ. 1974, 351, 309. [Google Scholar]
- Jarchow, C.J.; Nagler, P.L.; Glenn, E.P. Greenup and evapotranspiration following the Minute 319 pulse flow to Mexico: An analysis using Landsat 8 Normalized Difference Vegetation Index (NDVI) data. Ecol. Eng. 2017, 106, 776–783. [Google Scholar] [CrossRef]
- Zhe, M.; Zhang, X. Time-lag effects of NDVI responses to climate change in the Yamzhog Yumco Basin, South Tibet. Ecol. Indic. 2021, 124, 107431. [Google Scholar] [CrossRef]
- Gascon, M.; Cirach, M.; Martínez, D.; Dadvand, P.; Valentín, A.; Plasència, A.; Nieuwenhuijsen, M.J. Normalized difference vegetation index (NDVI) as a marker of surrounding greenness in epidemiological studies: The case of Barcelona city. Urban For. Urban Green. 2016, 19, 88–94. [Google Scholar] [CrossRef]
- Lanorte, A.; Lasaponara, R.; Lovallo, M.; Telesca, L. Fisher–Shannon information plane analysis of SPOT/VEGETATION Normalized Difference Vegetation Index (NDVI) time series to characterize vegetation recovery after fire disturbance. Int. J. Appl. Earth Obs. Geoinf. 2014, 26, 441–446. [Google Scholar] [CrossRef]
- Rhyma, P.; Norizah, K.; Hamdan, O.; Faridah-Hanum, I.; Zulfa, A. Integration of normalised different vegetation index and Soil-Adjusted Vegetation Index for mangrove vegetation delineation. Remote. Sens. Appl. Soc. Environ. 2020, 17, 100280. [Google Scholar] [CrossRef]
- Taddeo, S.; Dronova, I.; Depsky, N. Spectral vegetation indices of wetland greenness: Responses to vegetation structure, composition, and spatial distribution. Remote. Sens. Environ. 2019, 234, 111467. [Google Scholar] [CrossRef]
- Dixon, D.J.; Callow, J.N.; Duncan, J.M.; Setterfield, S.A.; Pauli, N. Satellite prediction of forest flowering phenology. Remote. Sens. Environ. 2021, 255, 112197. [Google Scholar] [CrossRef]
- Hatton, N.M.; Menke, E.; Sharda, A.; van der Merwe, D.; Schapaugh, W. Assessment of sudden death syndrome in soybean through multispectral broadband remote sensing aboard small unmanned aerial systems. Comput. Electron. Agric. 2019, 167, 105094. [Google Scholar] [CrossRef]
- Kleefeld, A.; Gypser, S.; Herppich, W.B.; Bader, G.; Veste, M. Identification of spatial pattern of photosynthesis hotspots in moss- and lichen-dominated biological soil crusts by combining chlorophyll fluorescence imaging and multispectral BNDVI images. Pedobiologia 2018, 68, 1–11. [Google Scholar] [CrossRef]
- Huete, A. A soil-adjusted vegetation index (SAVI). Remote. Sens. Environ. 1988, 25, 295–309. [Google Scholar] [CrossRef]
- Guo, Z.-C.; Wang, T.; Liu, S.-L.; Kang, W.-P.; Chen, X.; Feng, K.; Zhang, X.-Q.; Zhi, Y. Biomass and vegetation coverage survey in the Mu Us sandy land—Based on unmanned aerial vehicle RGB images. Int. J. Appl. Earth Obs. Geoinf. 2021, 94, 102239. [Google Scholar] [CrossRef]
- Bendig, J.; Yu, K.; Aasen, H.; Bolten, A.; Bennertz, S.; Broscheit, J.; Gnyp, M.L.; Bareth, G. Combining UAV-based plant height from crop surface models, visible, and near infrared vegetation indices for biomass monitoring in barley. Int. J. Appl. Earth Obs. Geoinf. 2015, 39, 79–87. [Google Scholar] [CrossRef]
- Khadanga, G.; Jain, K. Tree Census Using Circular Hough Transform and GRVI. Procedia Comput. Sci. 2020, 171, 389–394. [Google Scholar] [CrossRef]
- Thomas, J.R.; Gausman, H.W. Leaf Reflectance vs. Leaf Chlorophyll and Carotenoid Concentrations for Eight Crops 1. Agron. J. 1977, 69, 799–802. [Google Scholar] [CrossRef]
- Zhang, F.; Zhang, L.-W.; Shi, J.-J.; Huang, J.-F. Soil Moisture Monitoring Based on Land Surface Temperature-Vegetation Index Space Derived from MODIS Data. Pedosphere 2014, 24, 450–460. [Google Scholar] [CrossRef]
- Bai, T.; Zhang, N.; Mercatoris, B.; Chen, Y. Jujube yield prediction method combining Landsat 8 Vegetation Index and the phenological length. Comput. Electron. Agric. 2019, 162, 1011–1027. [Google Scholar] [CrossRef]
- Rokni, K.; Musa, T.A. Normalized difference vegetation change index: A technique for detecting vegetation changes using Landsat imagery. Catena 2019, 178, 59–63. [Google Scholar] [CrossRef]
- Roy, D.; Kovalskyy, V.; Zhang, H.; Vermote, E.; Yan, L.; Kumar, S.; Egorov, A. Characterization of Landsat-7 to Landsat-8 reflective wavelength and normalized difference vegetation index continuity. Remote. Sens. Environ. 2016, 185, 57–70. [Google Scholar] [CrossRef]
- Xie, Y.; Wang, P.; Bai, X.; Khan, J.; Zhang, S.; Li, L.; Wang, L. Assimilation of the leaf area index and vegetation temperature condition index for winter wheat yield estimation using Landsat imagery and the CERES-Wheat model. Agric. For. Meteorol. 2017, 246, 194–206. [Google Scholar] [CrossRef]
- Mohseni, F.; Mokhtarzade, M. A new soil moisture index driven from an adapted long-term temperature-vegetation scatter plot using MODIS data. J. Hydrol. 2020, 581, 124420. [Google Scholar] [CrossRef]
- Swain, S.; Abeysundara, S.; Hayhoe, K.; Stoner, A.M. Future changes in summer MODIS-based enhanced vegetation index for the South-Central United States. Ecol. Inform. 2017, 41, 64–73. [Google Scholar] [CrossRef]
- Vijith, H.; Dodge-Wan, D. Applicability of MODIS land cover and Enhanced Vegetation Index (EVI) for the assessment of spatial and temporal changes in strength of vegetation in tropical rainforest region of Borneo. Remote. Sens. Appl. Soc. Environ. 2020, 18, 100311. [Google Scholar] [CrossRef]
- Zhang, G.; Xiao, X.; Dong, J.; Kou, W.; Jin, C.; Qin, Y.; Zhou, Y.; Wang, J.; Menarguez, M.A.; Biradar, C. Mapping paddy rice planting areas through time series analysis of MODIS land surface temperature and vegetation index data. ISPRS J. Photogramm. Remote. Sens. 2015, 106, 157–171. [Google Scholar] [CrossRef]
- Zhou, X.; Wang, P.; Tansey, K.; Zhang, S.; Li, H.; Wang, L. Developing a fused vegetation temperature condition index for drought monitoring at field scales using Sentinel-2 and MODIS imagery. Comput. Electron. Agric. 2020, 168. [Google Scholar] [CrossRef]
- Shrestha, R.; Di, L.; Yu, E.G.; Kang, L.; Shao, Y.-Z.; Bai, Y.-Q. Regression model to estimate flood impact on corn yield using MODIS NDVI and USDA cropland data layer. J. Integr. Agric. 2017, 16, 398–407. [Google Scholar] [CrossRef]
- Sotille, M.E.; Bremer, U.F.; Vieira, G.; Velho, L.F.; Petsch, C.; Simões, J.C. Evaluation of UAV and satellite-derived NDVI to map maritime Antarctic vegetation. Appl. Geogr. 2020, 125, 102322. [Google Scholar] [CrossRef]
- Estrany, J.; Ruiz, M.; Calsamiglia, A.; Carriquí, M.; García-Comendador, J.; Nadal, M.; Fortesa, J.; López-Tarazón, J.A.; Medrano, H.; Gago, J. Sediment connectivity linked to vegetation using UAVs: High-resolution imagery for ecosystem management. Sci. Total. Environ. 2019, 671, 1192–1205. [Google Scholar] [CrossRef]
- Zhao, F.; Wu, X.; Wang, S. Object-oriented Vegetation Classification Method based on UAV and Satellite Image Fusion. Procedia Comput. Sci. 2020, 174, 609–615. [Google Scholar] [CrossRef]
- Li, D.; Wu, S.; Liang, Z.; Li, S. The impacts of urbanization and climate change on urban vegetation dynamics in China. Urban For. Urban Green. 2020, 54, 126764. [Google Scholar] [CrossRef]
- Shidiq, I.P.A.; Wibowo, A.; Kusratmoko, E.; Indratmoko, S.; Ardhianto, R.; Nugroho, B.P. Urban forest topographical mapping using UAV LIDAR. IOP Conf. Ser. Earth Environ. Sci. 2017, 98, 012034. [Google Scholar] [CrossRef]
- Rumora, L.; Majić, I.; Miler, M.; Medak, D. Spatial video remote sensing for urban vegetation mapping using vegetation indices. Urban Ecosyst. 2021, 24, 21–33. [Google Scholar] [CrossRef]
- Gibril, M.B.A.; Kalantar, B.; Al-Ruzouq, R.; Ueda, N.; Saeidi, V.; Shanableh, A.; Mansor, S.; Shafri, H.Z.M. Mapping Heterogeneous Urban Landscapes from the Fusion of Digital Surface Model and Unmanned Aerial Vehicle-Based Images Using Adaptive Multiscale Image Segmentation and Classification. Remote. Sens. 2020, 12, 1081. [Google Scholar] [CrossRef]
- Noor, N.M.; Abdullah, A.; Hashim, M. Remote sensing UAV/drones and its applications for urban areas: A review. IOP Conf. Ser.: Earth Environ. Sci. 2018, 169, 012003. [Google Scholar] [CrossRef]
- Feng, Q.; Liu, J.; Gong, J. UAV Remote Sensing for Urban Vegetation Mapping Using Random Forest and Texture Analysis. Remote. Sens. 2015, 7, 1074–1094. [Google Scholar] [CrossRef]
- Gu, Z.; Zhang, X. Framing social sustainability and justice claims in urban regeneration: A comparative analysis of two cases in Guangzhou. Land Use Policy 2021, 102, 105224. [Google Scholar] [CrossRef]
- Hui, E.C.-M.; Chen, T.; Lang, W.; Ou, Y. Urban community regeneration and community vitality revitalization through participatory planning in China. Cities 2021, 110, 103072. [Google Scholar] [CrossRef]
- Templeton, L.K.; Neel, M.C.; Groffman, P.M.; Cadenasso, M.L.; Sullivan, J.H. Changes in vegetation structure and composition of urban and rural forest patches in Baltimore from 1998 to 2015. For. Ecol. Manag. 2019, 454, 117665. [Google Scholar] [CrossRef]
- Trentanovi, G.; Campagnaro, T.; Kowarik, I.; Munafò, M.; Semenzato, P.; Sitzia, T. Integrating spontaneous urban woodlands into the green infrastructure: Unexploited opportunities for urban regeneration. Land Use Policy 2021, 102, 105221. [Google Scholar] [CrossRef]
- Cao, S.; Danielson, B.; Clare, S.; Koenig, S.; Campos-Vargas, C.; Sanchez-Azofeifa, A. Radiometric calibration assessments for UAS-borne multispectral cameras: Laboratory and field protocols. ISPRS J. Photogramm. Remote. Sens. 2019, 149, 132–145. [Google Scholar] [CrossRef]
- Morgan, B.; Stocker, M.; Valdes-Abellan, J.; Kim, M.; Pachepsky, Y. Drone-based imaging to assess the microbial water quality in an irrigation pond: A pilot study. Sci. Total. Environ. 2020, 716, 135757. [Google Scholar] [CrossRef] [PubMed]
- Praeger, C.; Vucko, M.J.; McKinna, L.; De Nys, R.; Cole, A. Estimating the biomass density of macroalgae in land-based cultivation systems using spectral reflectance imagery. Algal Res. 2020, 50, 102009. [Google Scholar] [CrossRef]
- Jiang, R.; Sanchez-Azofeifa, A.; Laakso, K.; Wang, P.; Xu, Y.; Zhou, Z.; Luo, X.; Lan, Y.; Zhao, G.; Chen, X. UAV-based partially sampling system for rapid NDVI mapping in the evaluation of rice nitrogen use efficiency. J. Clean. Prod. 2021, 289, 125705. [Google Scholar] [CrossRef]
- Su, J.; Liu, C.; Coombes, M.; Hu, X.; Wang, C.; Xu, X.; Li, Q.; Guo, L.; Chen, W.-H. Wheat yellow rust monitoring by learning from multispectral UAV aerial imagery. Comput. Electron. Agric. 2018, 155, 157–166. [Google Scholar] [CrossRef]



| Items | Contents |
|---|---|
| Weight | 231.9 g |
| Dimensions | 8.7 cm × 5.9 cm × 3.4 cm |
| Spectral bands | Blue, Green, Red, Red Edge, Near Infrared |
| Ground sample distance | 8 cm per pixel at 120 m AGL |
| Field of view | 47.2° HFOV |
| Capture rate | 12-bit RAW |
| No. | X (E) | Y (N) | Z (EL.m) |
|---|---|---|---|
| 1 | 208,205.89 | 357,135.16 | 54.925 |
| 2 | 208,094.13 | 356,938.89 | 51.212 |
| 3 | 208,089.28 | 356,768.06 | 53.999 |
| 4 | 208,264.45 | 357,025.07 | 48.135 |
| 5 | 208,211.96 | 356,939.97 | 48.101 |
| 6 | 208,319.01 | 356,991.52 | 48.183 |
| 7 | 208,266.54 | 356,906.45 | 48.116 |
| 8 | 208,241.17 | 356,787.41 | 49.358 |
| Vegetation Index Equation |
|---|
| Vegetation Index | Min | Max | Mean | StD. |
|---|---|---|---|---|
| NDVI | −0.356 | 0.806 | 0.253 | 0.226 |
| GNDVI | −0.410 | 0.755 | 0.232 | 0.173 |
| BNDVI | −0.350 | 0.812 | 0.301 | 0.216 |
| RGBVI | −0.810 | 0.744 | 0.117 | 0.184 |
| GRVI | −0.667 | 0.455 | 0.034 | 0.126 |
| SAVI | −0.535 | 1.210 | 0.380 | 0.339 |
| No | Land Cover | NDVI | GNDVI | BNDVI | RGBVI | GRVI | SAVI | ||||||
|---|---|---|---|---|---|---|---|---|---|---|---|---|---|
| Value | Mean | Value | Mean | Value | Mean | Value | Mean | Value | Mean | Value | Mean | ||
| 1 | Long-run steel roofing (Blue color) | 0.48 | 0.50 | 0.38 | 0.41 | 0.04 | 0.08 | −0.24 | −0.24 | 0.12 | 0.11 | 0.72 | 0.75 |
| 2 | 0.50 | 0.41 | 0.07 | −0.25 | 0.11 | 0.75 | |||||||
| 3 | 0.53 | 0.44 | 0.12 | −0.23 | 0.11 | 0.79 | |||||||
| 4 | Artificial grass playground (Green color) | 0.12 | 0.14 | 0.09 | 0.10 | 0.11 | 0.11 | 0.05 | 0.04 | 0.03 | 0.04 | 0.19 | 0.21 |
| 5 | 0.15 | 0.12 | 0.11 | 0.01 | 0.02 | 0.22 | |||||||
| 6 | 0.15 | 0.09 | 0.11 | 0.07 | 0.06 | 0.22 | |||||||
| 7 | Playground track (Red color) | −0.04 | −0.04 | 0.22 | 0.22 | 0.23 | 0.24 | −0.24 | −0.24 | −0.26 | −0.26 | −0.06 | −0.06 |
| 8 | −0.04 | 0.22 | 0.23 | −0.24 | −0.26 | −0.06 | |||||||
| 9 | −0.04 | 0.23 | 0.25 | −0.24 | −0.26 | −0.06 | |||||||
| 10 | Urethane-coated (Green color) | 0.32 | 0.28 | 0.05 | 0.04 | 0.19 | 0.17 | 0.40 | 0.37 | 0.27 | 0.24 | 0.48 | 0.41 |
| 11 | 0.26 | 0.04 | 0.18 | 0.35 | 0.22 | 0.39 | |||||||
| 12 | 0.24 | 0.02 | 0.14 | 0.34 | 0.23 | 0.37 | |||||||
| 13 | Urethane-coated (Red color) | −0.07 | −0.07 | 0.41 | 0.40 | 0.46 | 0.46 | −0.42 | −0.39 | −0.47 | −0.45 | −0.11 | −0.11 |
| 14 | −0.07 | 0.39 | 0.46 | −0.37 | −0.44 | −0.10 | |||||||
| 15 | −0.08 | 0.39 | 0.46 | −0.38 | −0.45 | −0.12 | |||||||
| 16 | Waterproof-coated roof (Green color) | 0.30 | 0.32 | 0.09 | 0.11 | 0.18 | 0.20 | 0.30 | 0.30 | 0.21 | 0.22 | 0.44 | 0.48 |
| 17 | 0.30 | 0.09 | 0.18 | 0.31 | 0.22 | 0.45 | |||||||
| 18 | 0.35 | 0.15 | 0.23 | 0.30 | 0.22 | 0.53 | |||||||
| 19 | Grass (Vegetation: Middle) | 0.50 | 0.52 | 0.43 | 0.43 | 0.59 | 0.60 | 0.29 | 0.33 | 0.09 | 0.11 | 0.74 | 0.78 |
| 20 | 0.50 | 0.41 | 0.58 | 0.33 | 0.11 | 0.75 | |||||||
| 21 | 0.56 | 0.46 | 0.63 | 0.37 | 0.14 | 0.84 | |||||||
| 22 | Grass (Vegetation: Slightly low) | 0.35 | 0.29 | 0.33 | 0.30 | 0.50 | 0.45 | 0.24 | 0.17 | 0.03 | −0.01 | 0.53 | 0.43 |
| 23 | 0.27 | 0.29 | 0.43 | 0.14 | −0.02 | 0.40 | |||||||
| 24 | 0.24 | 0.27 | 0.42 | 0.13 | −0.03 | 0.36 | |||||||
| 25 | Tree (Vegetation: High) | 0.68 | 0.70 | 0.51 | 0.54 | 0.68 | 0.72 | 0.49 | 0.50 | 0.26 | 0.25 | 1.02 | 1.05 |
| 26 | 0.71 | 0.56 | 0.73 | 0.51 | 0.26 | 1.07 | |||||||
| 27 | 0.71 | 0.57 | 0.73 | 0.49 | 0.24 | 1.07 | |||||||
| 28 | Tree (Vegetation: High) | 0.63 | 0.66 | 0.47 | 0.44 | 0.61 | 0.65 | 0.41 | 0.54 | 0.23 | 0.31 | 0.95 | 0.99 |
| 29 | 0.67 | 0.40 | 0.65 | 0.63 | 0.36 | 1.00 | |||||||
| 30 | 0.69 | 0.47 | 0.68 | 0.57 | 0.33 | 1.03 | |||||||
| Vegetation Index Equation | |
| squared Blue-Green NDVI index | |
| squared Red-Green NDVI index | |
| squared Red-Blue NDVI index | |
| No | Land Cover | Squared Blue-Green NDVI Index | Squared Red-Green NDVI Index | Squared Red-Blue NDVI Index | |||
|---|---|---|---|---|---|---|---|
| Value | Mean | Value | Mean | Value | Mean | ||
| 1 | Long-run steel roofing (Blue color) | 0.42 | 0.47 | 0.73 | 0.76 | 0.51 | 0.52 |
| 2 | 0.46 | 0.75 | 0.53 | ||||
| 3 | 0.53 | 0.78 | 0.52 | ||||
| 4 | Artificial grass playground (Green color) | 0.20 | 0.21 | 0.21 | 0.24 | 0.23 | 0.25 |
| 5 | 0.23 | 0.27 | 0.25 | ||||
| 6 | 0.20 | 0.24 | 0.25 | ||||
| 7 | Playground track (Red color) | 0.43 | 0.43 | 0.18 | 0.18 | 0.19 | 0.20 |
| 8 | 0.43 | 0.17 | 0.19 | ||||
| 9 | 0.45 | 0.19 | 0.21 | ||||
| 10 | Urethane-coated (Green color) | 0.24 | 0.21 | 0.37 | 0.31 | 0.48 | 0.43 |
| 11 | 0.22 | 0.30 | 0.43 | ||||
| 12 | 0.15 | 0.26 | 0.37 | ||||
| 13 | Urethane-coated (Red color) | 0.74 | 0.73 | 0.35 | 0.33 | 0.41 | 0.40 |
| 14 | 0.72 | 0.33 | 0.41 | ||||
| 15 | 0.72 | 0.32 | 0.39 | ||||
| 16 | Waterproof-coated roof (Green color) | 0.27 | 0.30 | 0.38 | 0.41 | 0.46 | 0.48 |
| 17 | 0.27 | 0.38 | 0.46 | ||||
| 18 | 0.36 | 0.47 | 0.54 | ||||
| 19 | Grass (Vegetation: medium) | 0.81 | 0.82 | 0.76 | 0.78 | 0.84 | 0.85 |
| 20 | 0.80 | 0.76 | 0.84 | ||||
| 21 | 0.84 | 0.81 | 0.88 | ||||
| 22 | Grass (Vegetation: Slightly low) | 0.71 | 0.66 | 0.61 | 0.54 | 0.73 | 0.66 |
| 23 | 0.64 | 0.52 | 0.63 | ||||
| 24 | 0.62 | 0.48 | 0.61 | ||||
| 25 | Tree (Vegetation: High) | 0.89 | 0.91 | 0.88 | 0.90 | 0.93 | 0.94 |
| 26 | 0.91 | 0.91 | 0.95 | ||||
| 27 | 0.92 | 0.91 | 0.95 | ||||
| 28 | Tree (Vegetation: High) | 0.84 | 0.85 | 0.85 | 0.85 | 0.90 | 0.92 |
| 29 | 0.83 | 0.84 | 0.92 | ||||
| 30 | 0.87 | 0.87 | 0.93 | ||||
| Ground Truth | Squared Blue-Green NDVI Index | Squared Red-Green NDVI Index | Squared Red-Blue NDVI Index | |||
|---|---|---|---|---|---|---|
| Vegetation | Non-Vegetation | Vegetation | Non-Vegetation | Vegetation | Non-Vegetation | |
| Vegetation (20 points) | 20 | 0 | 20 | 0 | 20 | 0 |
| Non- vegetation (30 points) | 5 | 25 | 5 | 25 | 0 | 30 |
| Kappa coefficient | 0.8 | 0.8 | 1.0 | |||
Publisher’s Note: MDPI stays neutral with regard to jurisdictional claims in published maps and institutional affiliations. |
© 2021 by the authors. Licensee MDPI, Basel, Switzerland. This article is an open access article distributed under the terms and conditions of the Creative Commons Attribution (CC BY) license (https://creativecommons.org/licenses/by/4.0/).
Share and Cite
Lee, G.; Hwang, J.; Cho, S. A Novel Index to Detect Vegetation in Urban Areas Using UAV-Based Multispectral Images. Appl. Sci. 2021, 11, 3472. https://doi.org/10.3390/app11083472
Lee G, Hwang J, Cho S. A Novel Index to Detect Vegetation in Urban Areas Using UAV-Based Multispectral Images. Applied Sciences. 2021; 11(8):3472. https://doi.org/10.3390/app11083472
Chicago/Turabian StyleLee, Geunsang, Jeewook Hwang, and Sangho Cho. 2021. "A Novel Index to Detect Vegetation in Urban Areas Using UAV-Based Multispectral Images" Applied Sciences 11, no. 8: 3472. https://doi.org/10.3390/app11083472
APA StyleLee, G., Hwang, J., & Cho, S. (2021). A Novel Index to Detect Vegetation in Urban Areas Using UAV-Based Multispectral Images. Applied Sciences, 11(8), 3472. https://doi.org/10.3390/app11083472


