1. Introduction
Detecting the presence, the position and the extension of architectural coverings separations is at the base of the analysis of the state of conservation of ancient structures. The non-destructive investigations used in a laboratory to find detachments are hardly executable in situ. For this reason, traditionally, conservators rely on the technique of auscultation, which entails gently knocking with the hand, and listening to the sound produced by the surface. The results of these examinations are translated into the graphic documentation of the discontinuities of the structural elements, detachments and cracks between layers, in order to achieve the conservative diagnosis and design a project of intervention. Analysis carried out with such method is accurate, but introduces a strong subjective conservator’s connotation, which makes it non-repeatable. For these reasons, we introduced an automatic system to detect and measure the detachments, and non-visible defects in general. We used a probe that, performing a signal processing based on a cross-correlation algorithm, allows us to detect the detachments between adjacent layers and their discontinuities. The proposed technique allows measuring entire surfaces, using a sound correlation method between an acoustic “snap” of the point of interest and an acoustic “reference snap” of a point certainly known. Furthermore, using a force sensor integrated in the system, an impact-force measurement is made that allows us to measure also detachments that produce sounds that cannot be perceived by the audio part of the instrument as they are outside the useful band of the used microphone. Thus, from a fusion of the available data, it is possible to measure a wide range of detachments.
For this purpose, we have developed the PICUS device, similar to a handheld “tester”, easy to use, safe for the delicate structures to be examined, with a good repeatability of the measurement. The proposed method was implemented in an inexpensive portable version using an Arduino-like board, battery supply, making the new system suitable for “in situ” operation. It can be also used for monitoring the evolution of the conservative scenario.
The techniques of detection and control of degradation are intended to clearly and uniquely define the state of preservation of the artifact, identifying the type, morphology and distribution of degradation and evaluating the possible analyses to be carried out. Diagnostics is an indispensable phase in any restoration operation, and its execution must be entrusted to an experienced, multidisciplinary staff. The restorer has the fundamental task of predicting the objectives and select the appropriate survey methodologies, locate the areas to be investigated, coordinate the staff, preside over operations and finally summarize the results.
In order to achieve optimal results, it would be necessary to carry out the survey with more techniques and to compare the various results, as well as to accompany the non-destructive investigations even with chemical-physical laboratory tests, in this case destructive.
In particular, to detect the detachments between layers, there has recently been significant development of techniques capable of determining the conservation status of the antique coatings through non-invasive and non-destructive, or partially invasive. The most promising methodologies are the non-invasive investigations based on the extent of the cover’s surface vibrations, adopting different modalities both to excite surfaces and to measure the signal of interest [
1,
2,
3].
One of the techniques of detection based on the vibration of the covers is the impact test [
4,
5]: the surface is hit with a small “hammer” that can measure the intensity of the pulse, using a force sensor; this method is used to measure the impact force and the vibration rate of the surface, and examining differences in mobility due to localized damage, it is possible to diagnose the defect. Tap testing (also called the coin tap test, CTT) [
6,
7] is a simple but effective impact-based NDT (Non-Destructive-Technique) technique that gives results from local excitation. This technique has been in use for a long time in the aerospace industry for the testing of composite materials. Over the years, it has evolved from hearing-based coin tap testing to an instrumented testing capable of producing “images” with quantitative detection of sub-surface discontinuities (delamination, unbound, and voids) in thin composite laminates, sandwich structures, and bonded joints [
8,
9]. Coin tap testing involved the tapping of a coin or a hammer on the surface of the test object whose condition was assumed depending on the type of sound it made. Solid high-pitch sound would suggest that the point is in a good condition whereas a “dull” sound suggested a bad condition. Although simple and cost-effective, this method could only provide qualitative data and was entirely dependent on the operator’s hearing ability and was influenced by the background noises. To eliminate these drawbacks, the technique was developed into instrumented devices [
8]. Three major commercial devices to perform digital tap testing (DTT) were developed thereafter: the Rapid Damage Detection Device (RD3) by WichiTech Industries [
9], the Woodpecker developed by Mitsui Industries [
10], and the Computer Aided Tap Tester (CATT) by Iowa State University [
11]. The techniques used in these DTTs involves tapping the test surface with an impact hammer or tapper, for which the contact time (impact duration) is measured. The contact time can be measured by mounting an accelerometer or a force transducer into the tapping mass. The force-time pulse received by the accelerometer after each tap is converted into a voltage pulse. The width at half-amplitude, in other words the contact time, is measured by a logic circuit and displayed in the numerical form [
9]. In this case, the half amplitude width is taken because the force-time curve is not defined at the bottom for the full amplitude width due to inherent noise. The presence of defects will decrease the local stiffness of a structure and produce a wider force-time pulse or show a longer contact time. The test surface is analyzed by comparing the contact time or determining the deviation of the force-time pulse width from the nominal width obtained from a reference undamaged surface. Hence, a sound of a rigid area will give lower reading whereas a damaged area will give a higher reading. It is generally understood that [
12] the impact sounds can be broadly divided into two areas: (a) sounds generated by the initially high surface acceleration and deceleration of impacting bodies found during the time of contact, and (b) sounds arising from the free-vibration of the bodies following the impact. We use the same method, but instead of measuring only the duration of the force-time pulse (as said, the width at half-amplitude), we try to model the same method used by professional restorers, recording the noise produced by the impact and trying to correlate it with a reference one. They make the surface under examination slightly vibrate by knocking on it with the knuckles of the fingers, producing a sound, and mentally perform a kind of correlation between the sound signals respectively of a point that they judge in good condition compared to another that may not be. This type of analysis depends heavily on the user performing the measurement. To remove the dependence on the human ear and personal experience, many efforts have been made to automate the impact test operation [
13,
14,
15]. The system we have developed seeks to fill a gap in the equipment sector linked to this type of analysis, also allowing it to be used easily in situ. This way it is meant to complement the experience of the restorer, confirming or modifying the feeling that each professional feels with respect to the defect measured only with the hand.
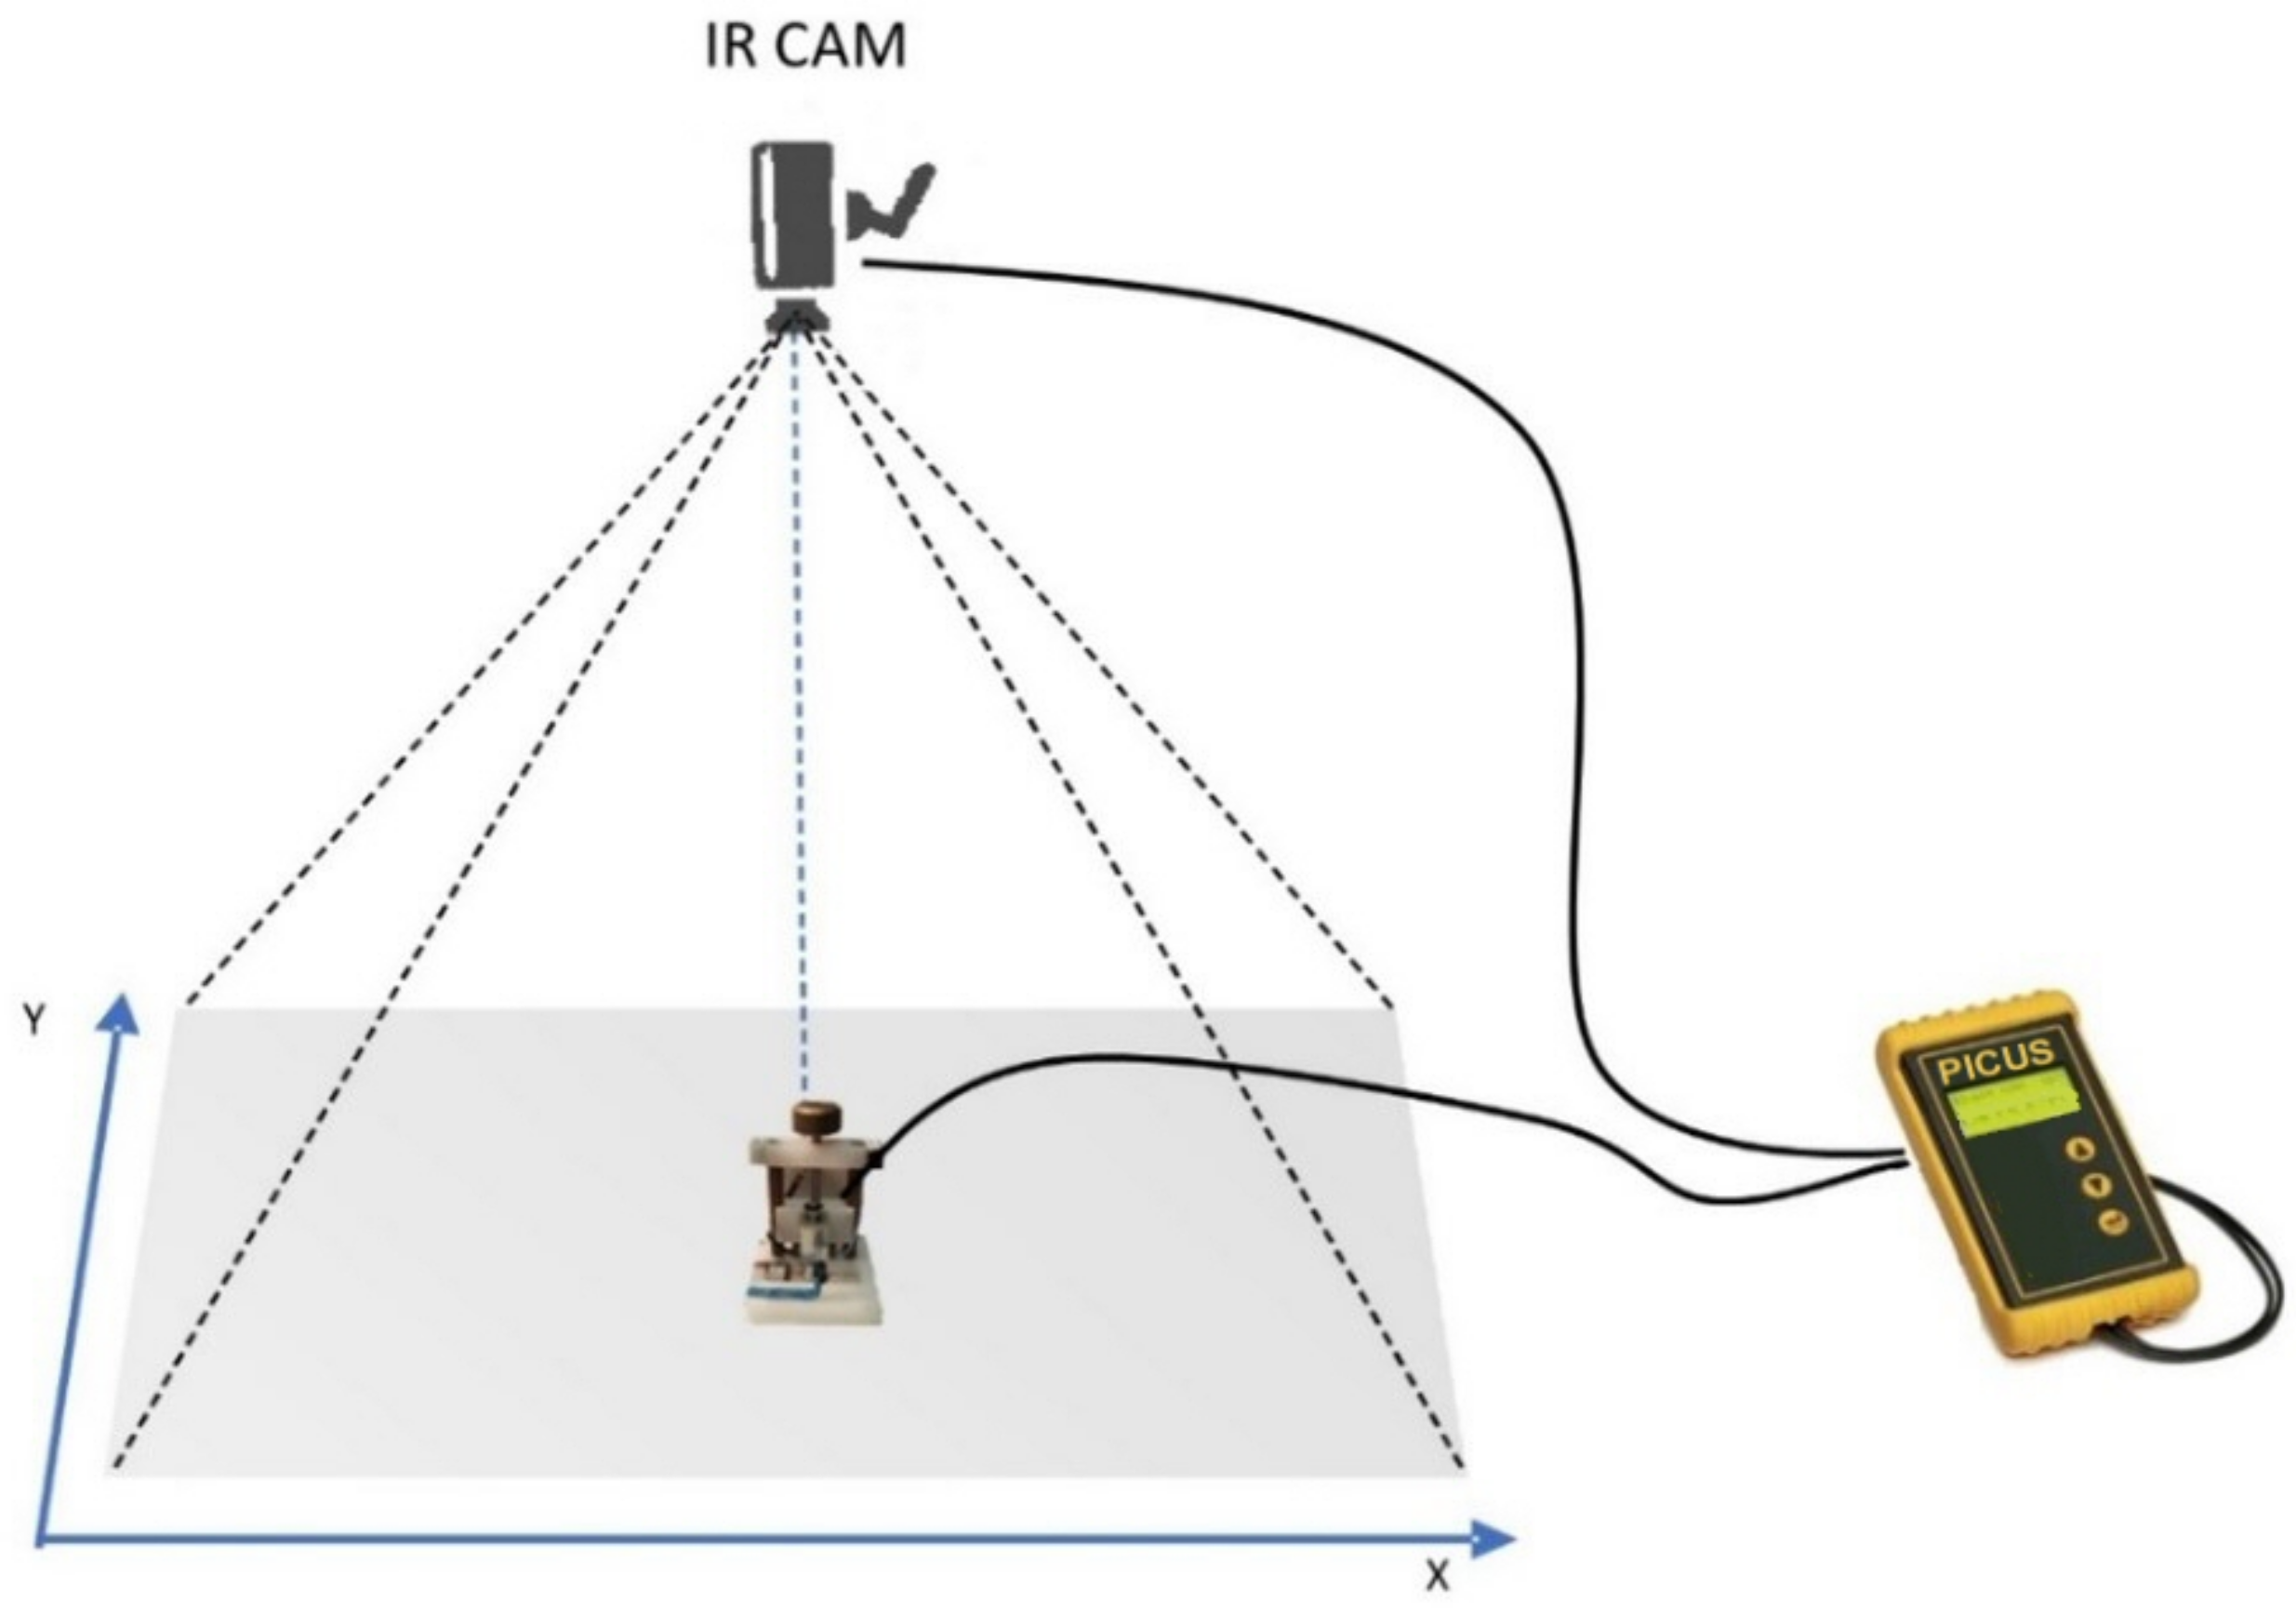
In this paper we will show the probe, equipped with a force sensor specially fabricated in our laboratory, to measure the actual impact force of our “hitting device”. The probe is then equipped with a microphone that allows the capture of the free-vibration audio signal generated by the impact of the hammer on the surface under examination. The audio signal is captured using a low-cost microcontroller electronics unit, and the calculated measurement is stored in a local mass-memory. In addition, because the probe’s position on the measurement scenario is important, a two-dimensional measurement system based on the use of an infrared (IR) camera that detects the location of an IR-LED (light-emitting diode) placed on the probe was implemented. The camera sends the X and Y coordinates of the probe to the same microcontroller unit, to provide the localization of its position on the plane (
Figure 1). In another section of the paper we will show the algorithm used, and the solutions adopted to implement it on a small microcontroller board like Arduino. The section dedicated to XY measurement will be very light, because it does not represent the purpose of this document to describe in depth this feature, extensively investigated by others; however, although it is not scientifically relevant, this feature is essential for the reconstruction of the diagnosis scheme as a map. Finally, we will present the results obtained on some laboratory-produced test objects, to test the system and how the information is represented.
2. Materials and Methods
Given the vastness of the artistic heritage and the impossibility, sometimes, to perform tests and diagnoses in the laboratory or to transport expensive and fragile equipment in situ, together with the prohibitive costs that this type of analysis usually entails, the availability of a pocket-sized system that performs a detachment analysis seems to be a practical solution to solve the problem that arises to restorers who often have to work in precarious situations and with unconventional and standard tools, relying heavily on their professionalism and experience to conduct a diagnosis that later includes an intervention plan.
In this section we will describe the individual components of the system, the design and the manufacturing process leading to the final device, as well as the algorithm implemented in the microcontroller unit. Furthermore, the parameters used for the correct acquisition of the signals involved in the correlation analysis will be also discussed.
2.1. Force Sensor
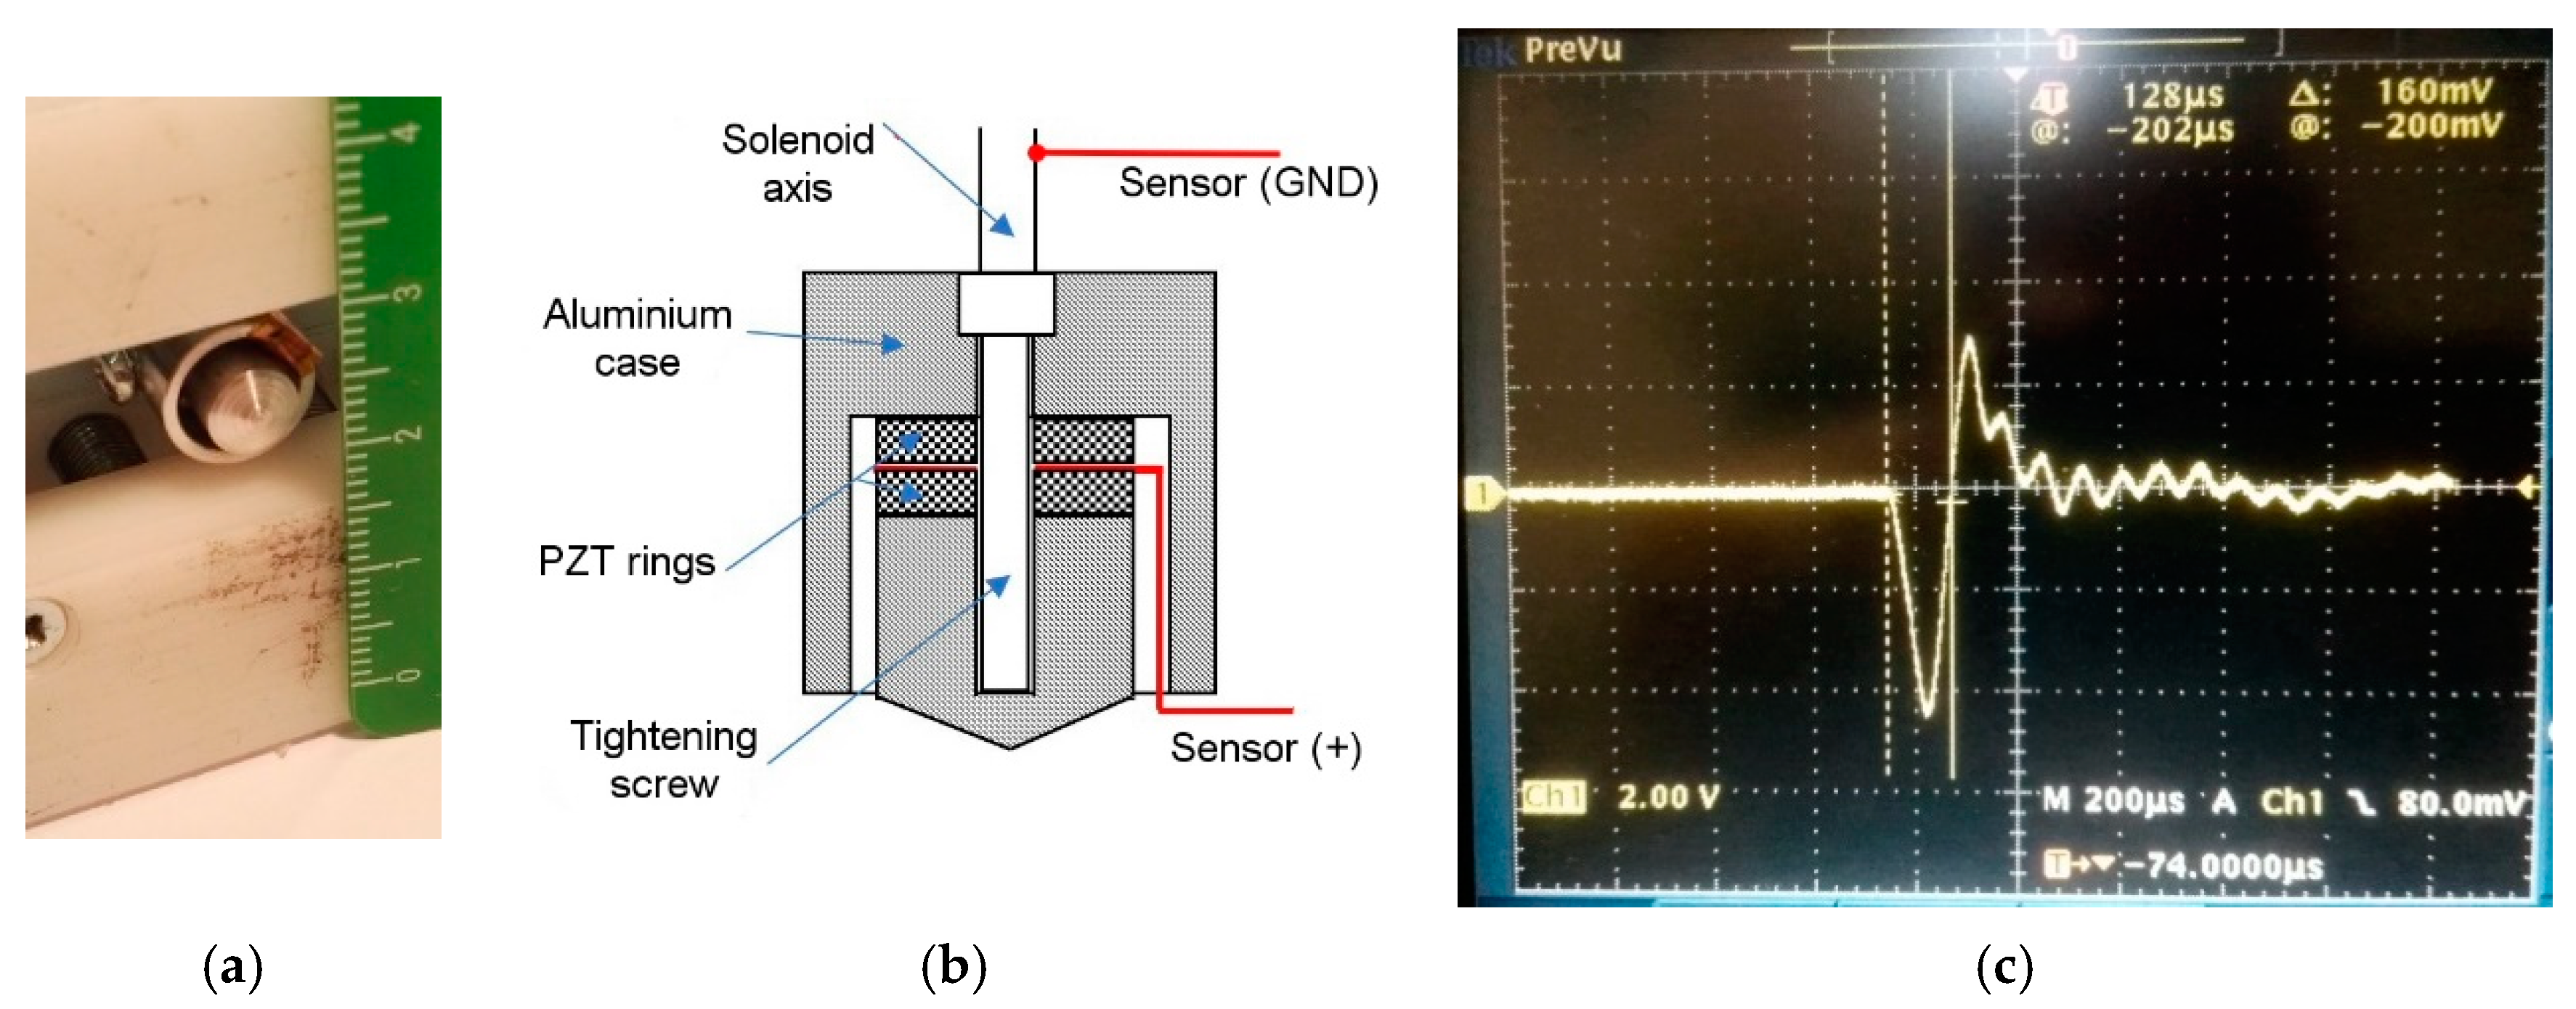
Figure 2a shows a photo of the developed force sensor. The force sensor was used for many reasons. First, it is important to monitor the force with which the surface under examination is “hit”, for obvious reasons of safe conservation. Furthermore, the sensor signal is used as a trigger for the acquisition window of the sound picked up by the microphone, to optimize the amount of digital data to be examined by the calculation system (
Figure 2c). Finally, we measure the impact-force to implement the CTT procedure described in the previous paragraph: the signal from the force sensor is sampled by the ADC (analog to digital converter) section that is inside the hardware at 500 kHz, a high sampling frequency for this type of signal (this signal is in a band up to 10–20 kHz); this sampling frequency was chosen to accurately measure the impact-time.
The device is manufactured in a classic way, using two piezoelectric ceramic rings (type PZ27 Ferroperm, Meggitt A/S, Kvistgaard, Denmark) connected in parallel and prestressed by a screw and inserted in a metal case that represents both a protection for the delicate ceramics used, and the system for transferring the force to the ceramics themselves (
Figure 2b).
It is well known [
16] that the exertion of a force
F on a PZT transducer results in the generation of a charge
Q = −d33*F (
d33 is the piezoelectric charge constant). This charge is completely independent of the dimensions of the PZT element. However, if
n PZT rings are stacked and connected electrically in parallel results
Q = −n*d33*F since the force acts simultaneously on
n plates. The open circuit voltage
V on a disc of height
t is given by:
V = −g33*t*T3, where
g33 is the piezoelectric voltage constant, and
T3 is the stress in axial direction. In the case of the stack, the rings are connected in parallel, so the resulting voltage is the same. The advantage of a stack is more charge, higher capacitance and thus a lower impedance. Since the voltage increases almost linearly with mechanical stress, the PZT transducer can be used as force sensor. It is possible to rewrite the equation of the open circuit voltage to calculate the force exerted on the stack of the rings, in function of the material properties and of the geometrical dimensions, remembering that the stress T is dimensionally equivalent to a force acting on an area:
where
V is the measured voltage,
do and
di are the outer and the inner diameter of the PZT ring,
g33 is the piezoelectric voltage constant, defined as the electric field generated in a material per unit of mechanical stress applied to it (for PZ27 Ferroperm,
), and
t is the thickness of the ceramic. In our case,
do = 5 mm,
di = 2.3 mm,
t = 1 mm and hence
. With our setup, we obtain an impact force of about 0.3–2 N.
2.2. Hitting Device
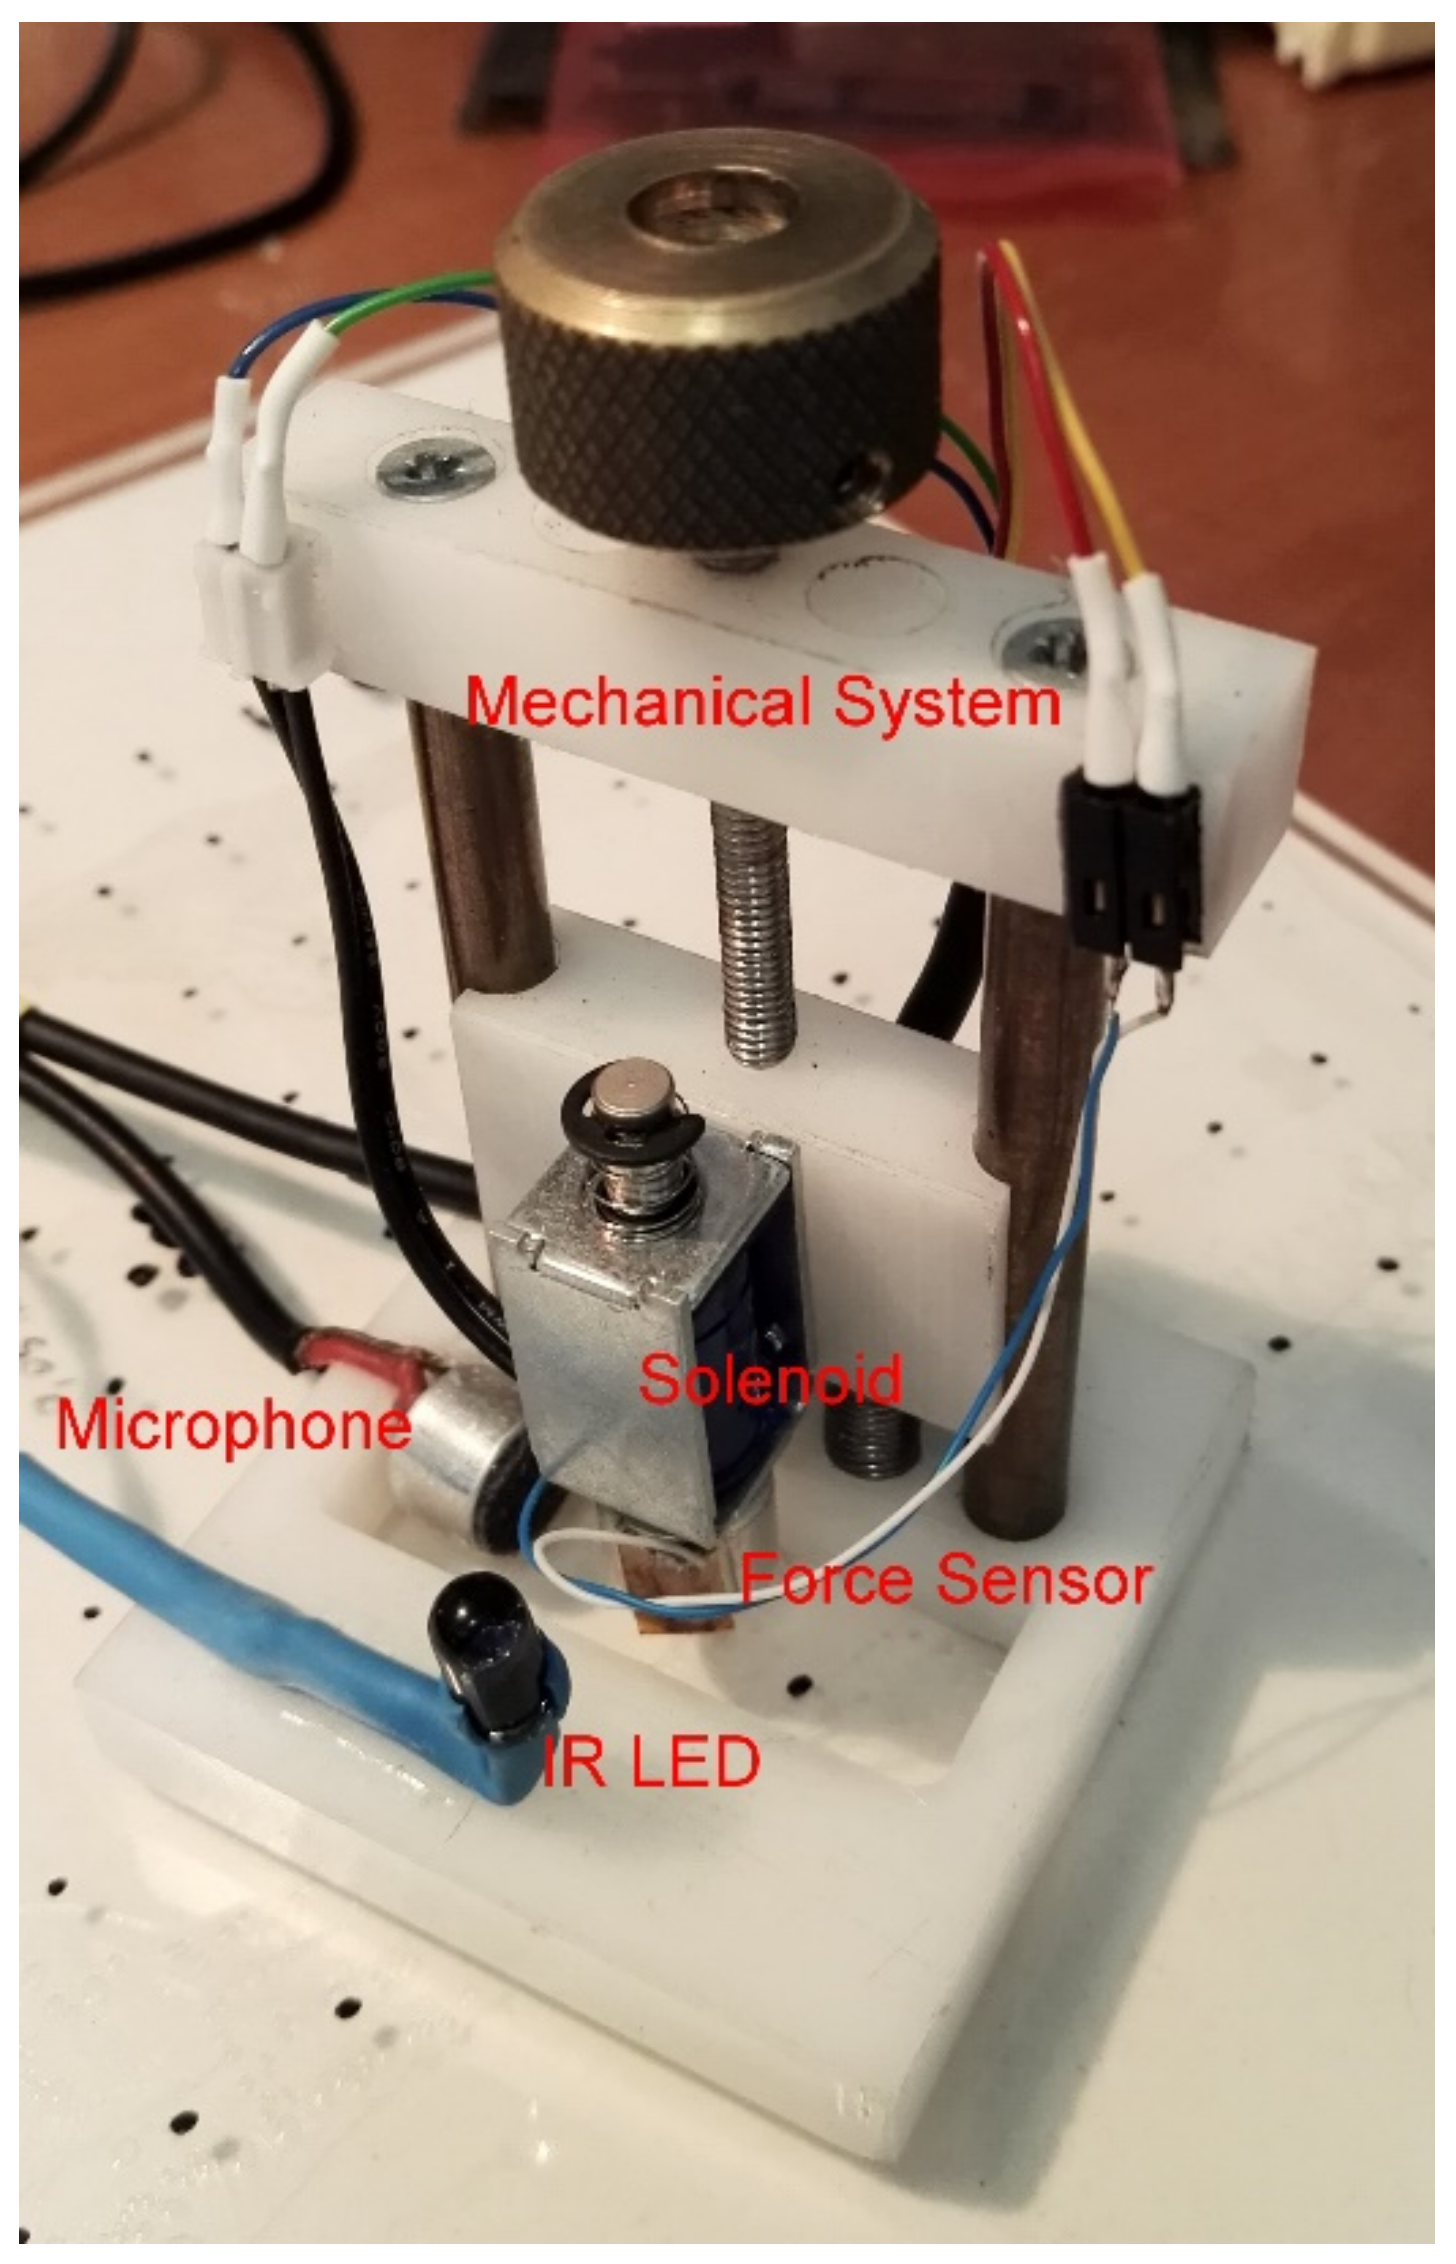
The
Figure 3 shows the superficial hitting device. The device consists of a very low cost solenoid (ZH0-0420S-05A4.5, Zonhen Electric Appliances Co., Ltd., Shenzhen, China) which is the essential part of the hitting device. Solenoids are a good way to induce linear motion for pushing or pulling. This small solenoid is designed to work directly with 5 V. The solenoid is positioned on a mechanical system equipped with a mechanical slide (a low precision system) with the possibility of calibrating the impact force on the surface to be analyzed depending on the material of the surface, by raising or lowering the solenoid, so as to adapt the hitting device to different materials. The reading of the measured impact force will allow the operator to calibrate (electronically) the impact force properly and safely set the maximum possible force applicable to the different surfaces to be analyzed. After this calibration (once), the force exerted by the solenoid is not dependent by the operator: the operator can only place the sensor in a specific point or randomly. The sensor is driven electronically and the force exerted is defined by the hardware that manages the current flowing in the solenoid, which acts as an actuator. It is not important to know the parameters involved in the operation (mass, elastic constant, height drop, etc.) as the impact force is simply measured and sampled by the system, and this is sufficient to measure the impact-time. Even if the force exerted by the solenoid were lower this would be reflected in the amplitude of the signal, while the measurement of the impact time depends, as stated, on the mechanical properties of the surface (its stiffness).
The system is low cost and the mechanics involved are easily achievable also using 3D additive printing techniques, since it is not precision mechanics. The force sensor is mounted on the end of the solenoid shaft; it is the latter that actually hits the surface causing the impact sound. The system is completed by an omni-directional foil electret condenser microphone (CEM-C9745JAD462P2.54R, Challenge Electronics, NY, USA) mounted near the point of impact, which picks up the sound produced by the impact and transmits it to the acquisition and processing unit. The microphone has a sensitivity of −46 ± 2 dB @1 kHz (0 dB = 1 V/Pa) and a frequency range 100 ÷ 10,000 Hz. Finally, the unit is equipped with an infrared LED, which allows the IR positioning camera to know the exact position of the system on the measurement scenario, with an adequate precision for the purpose of the measurement.
2.3. Locating System
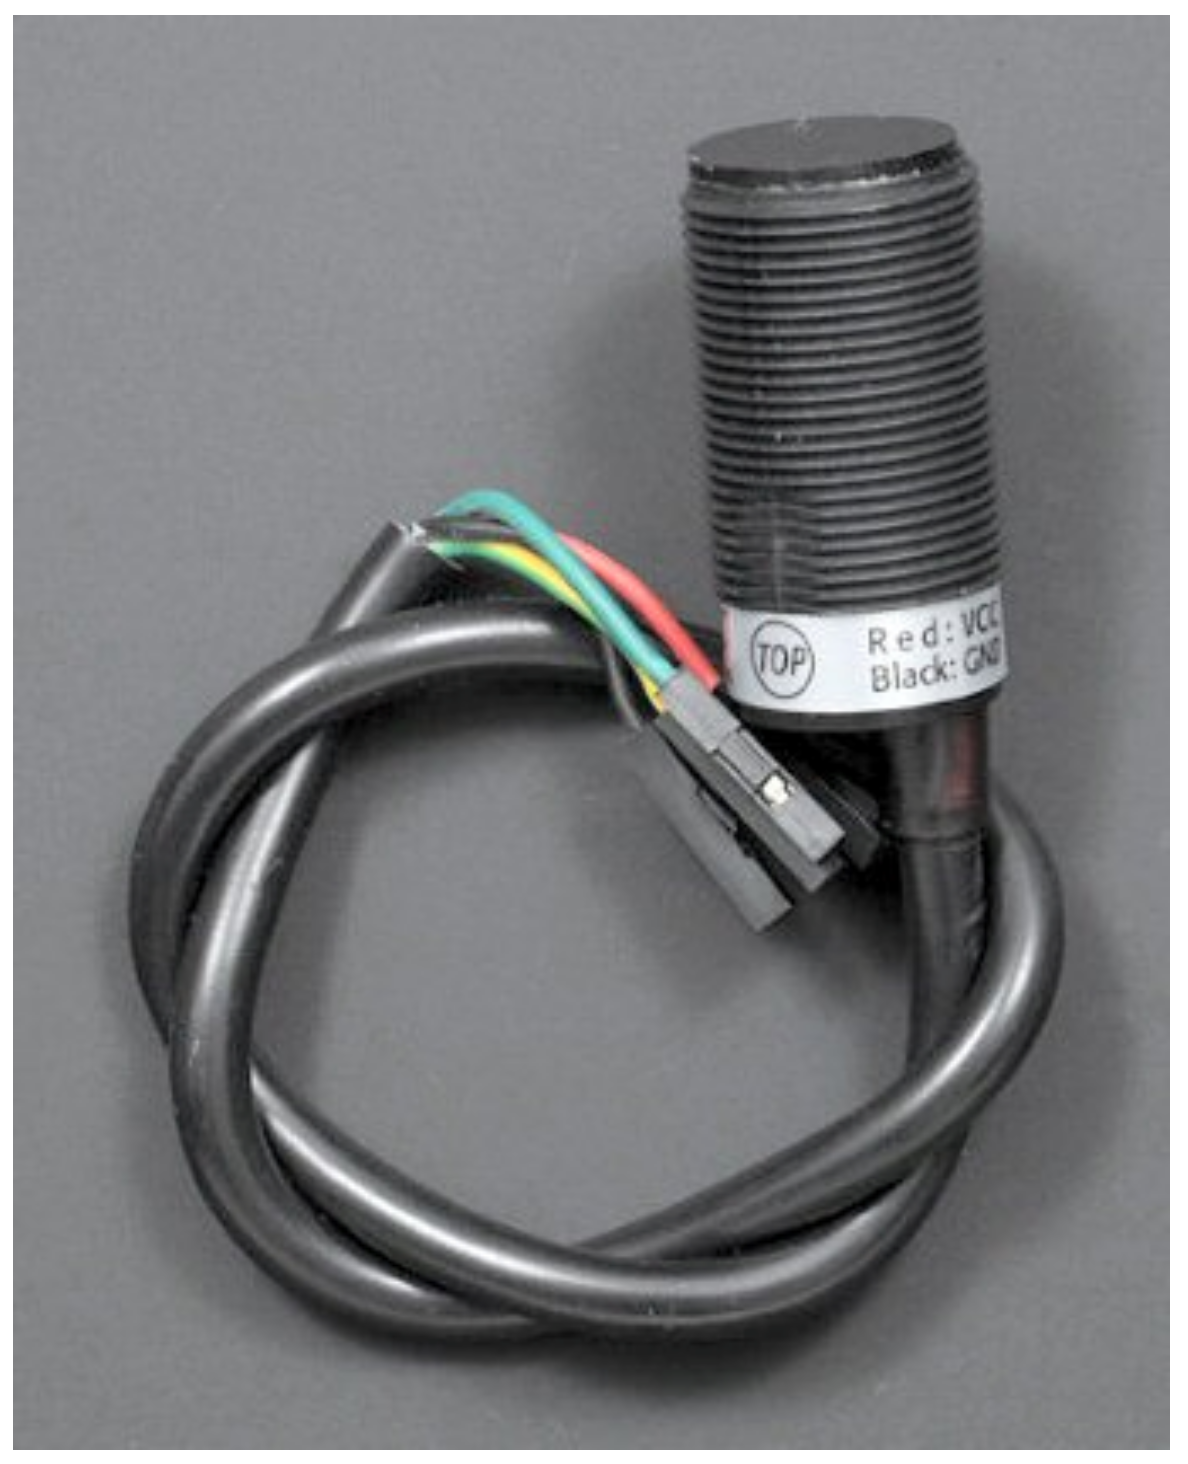
The positioning system is based on the use of a very low cost infrared camera, developed for gaming applications (
Figure 4). IR cameras are the core of any optical tracking system [
17,
18]: specialized IR cameras are generally used in commercial tracking systems and this leads to costs that are often not affordable. Consumer electronics and in particular devices for entertainment now provide affordable and effective tools to design and implement systems usually based on special purpose hardware. Among the other cheap alternatives among commercially available, an IR camera sensor manufactured by PixArt Imaging Inc. (Hsinchu, Taiwan, R.O.C.) was very effective, because it was used (in a special version) in the Wii-Nintendo
(R) gaming system. The IR camera implements a real-time multi-object tracking engine (MOT), that allows it to track up to four bright IR light sources. Camera resolution is 1024 × 768 interpolated pixels (native resolution is 128 × 96 pixels) and has an effective field of view of about 33 degrees horizontally and 23 degrees vertically and a sample rate up to 100 Hz. Object tracking is implemented directly in the camera by specialized electronic, thus reducing the amount of data to be managed. In fact, only the xy coordinates of the pixel detected as a spot are exported by the camera over a I2C (
Inter Integrated Circuit protocol) connection, thus simplifying the implementation of target tracking applications. IR camera performance for this kind of applications are comparable with that of cameras provided at a significant higher cost (i.e., 20
$ vs. 180–200
$). The range of marker visibility, intended as the maximum distance that the IR camera is able to detect a marker, depends on a marker’s size and power of IR illuminators, and was experimentally determined as in
Table 1. With the built-in IR-pass filter, 940 nm sources are detected with approximately twice the intensity of equivalent 850 nm sources. With respect to traditional cameras, the IR camera returns a couple of coordinates for each (up to four) bright IR spot. Thus, the IR LED of the hitting device (an SFH4544 infrared emitter 940 nm by OSRAM Opto Semiconductors GmbH, Regensburg, Germany) can be sequentially sampled and acquisition delays can be kept unnoticeable. The camera looks through an infrared pass filter in the remote’s plastic casing. Raw pixel data are not available to the host, so the camera cannot be used to take a conventional picture.
2.4. Acquiring and Elaboration Unit
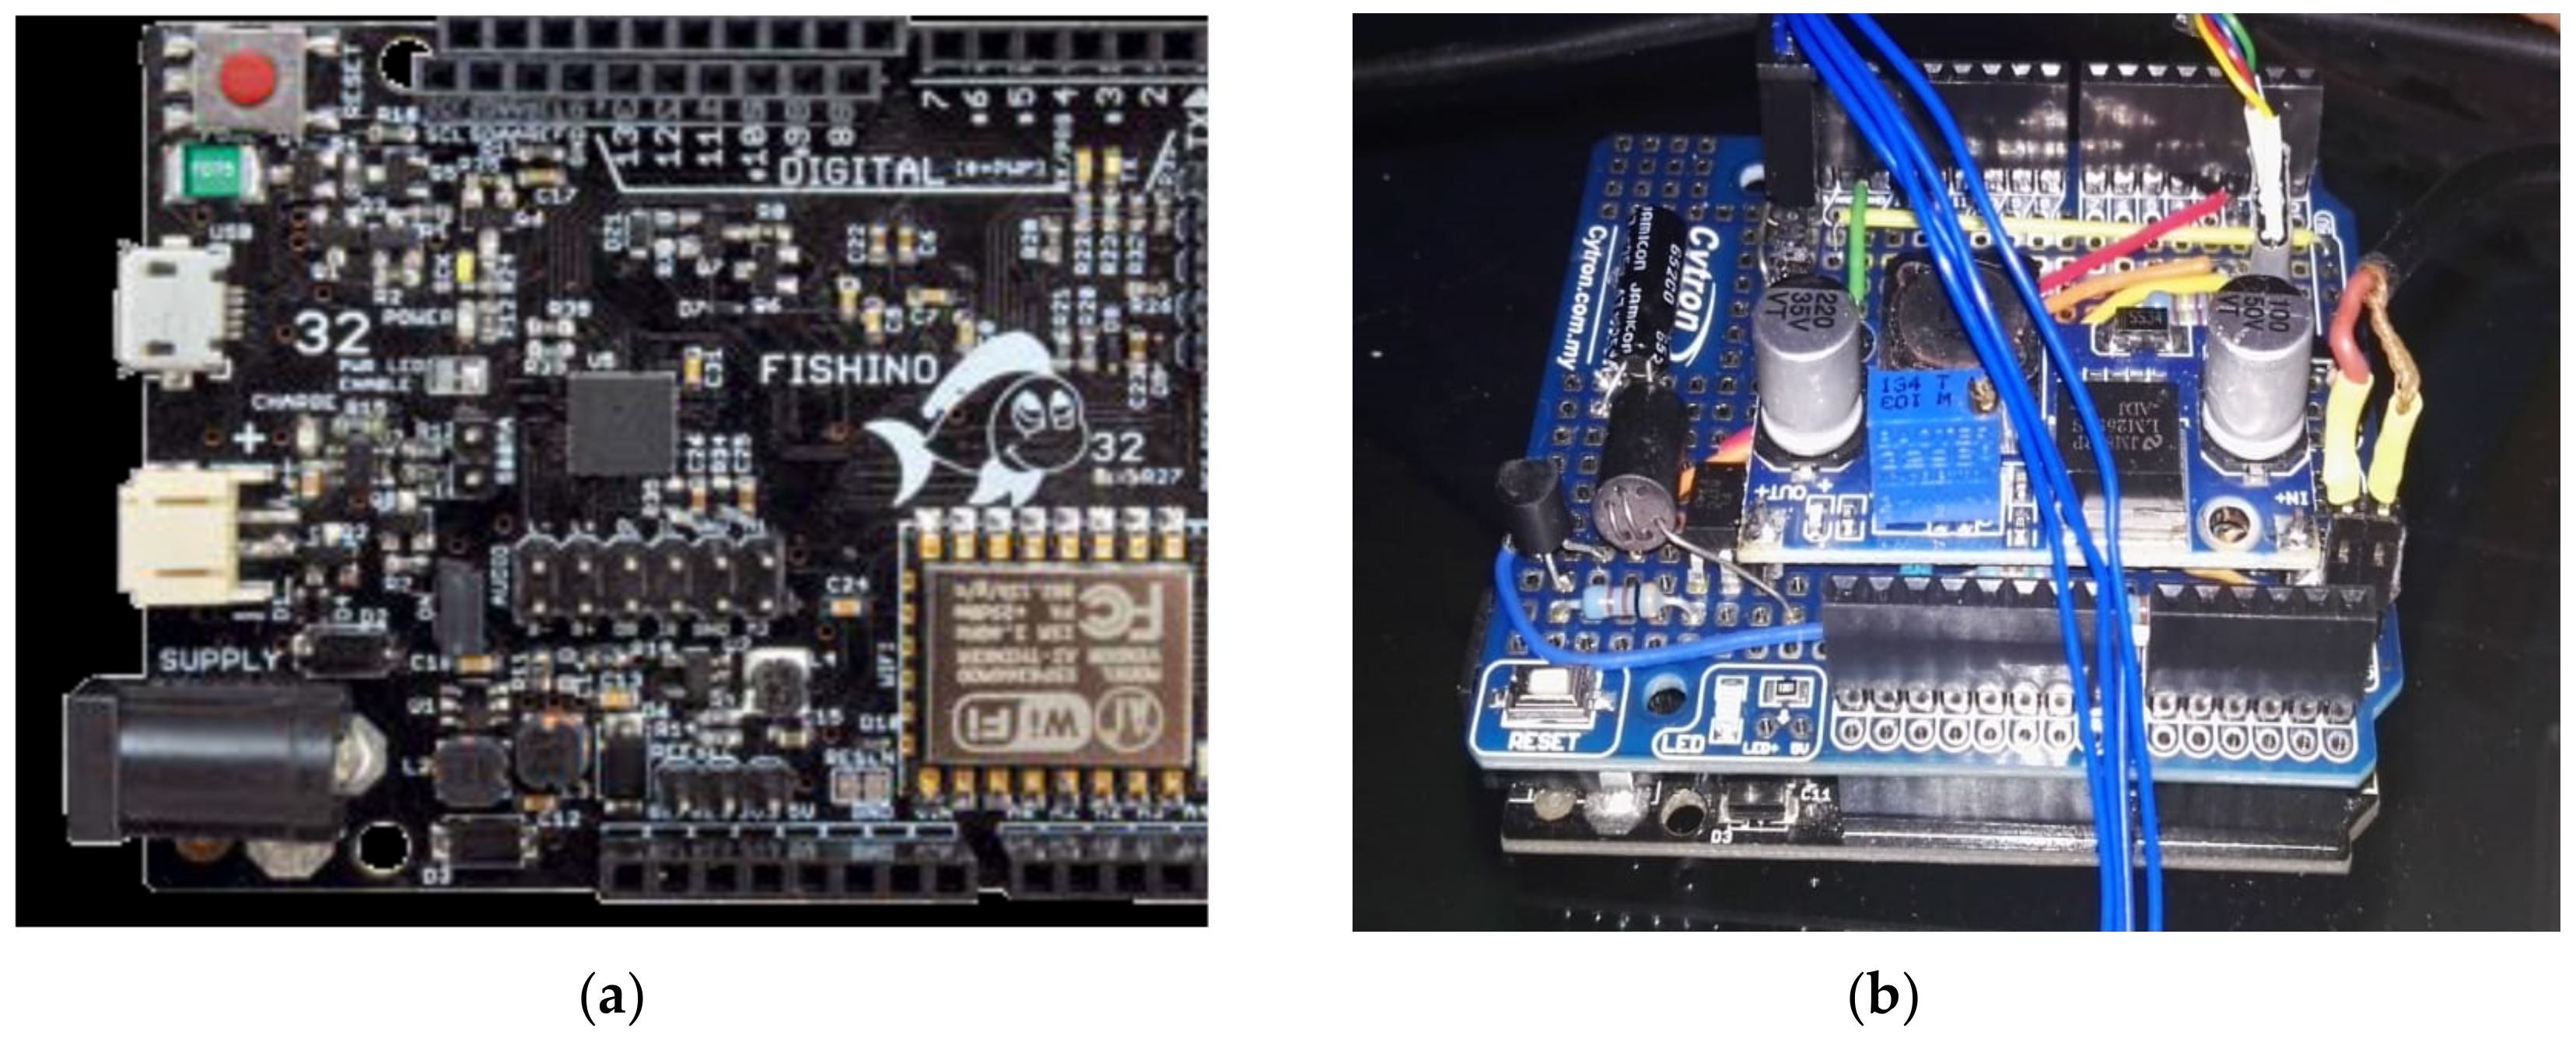
The microcontroller board used as the acquisition, control and calculation unit is based on a 32-bit PIC32MX (Microchip Technology Inc., Chandler, AZ, USA) architecture (120 MHz/150 DMIPS), inserted in an Arduino platform, maintaining its simplicity of use but enormously increasing its potential thanks to the 32-bit microcontroller and additional components. The strengths of the board (called Fishino32, designed by dr. M. Del Fedele [
19]) are the possibility of being powered by a LiPo battery, integrates a dedicated audio codec, a flash memory of 512 KB which, combined with a RAM of 128 KB, and an A/D (analog to digital) converter 10-bit 1 Msps rate, allows the development of extremely complex applications. On the card (68 × 53 mm) there are also a Wi-Fi module, a slot for microSD, and a Real Time Clock and Calendar (
Figure 5a).
A shield board (
Figure 5b) is positioned on the Fishino32 board containing the few hardware components to correctly interface the signals coming from the sensors (force sensor, IR camera, liquid crystal display (LCD)) and to produce the signals necessary to correctly actuate the solenoid (a direct current (DC)–DC converter and an opto-isolator).
2.5. Algorithm Implemented
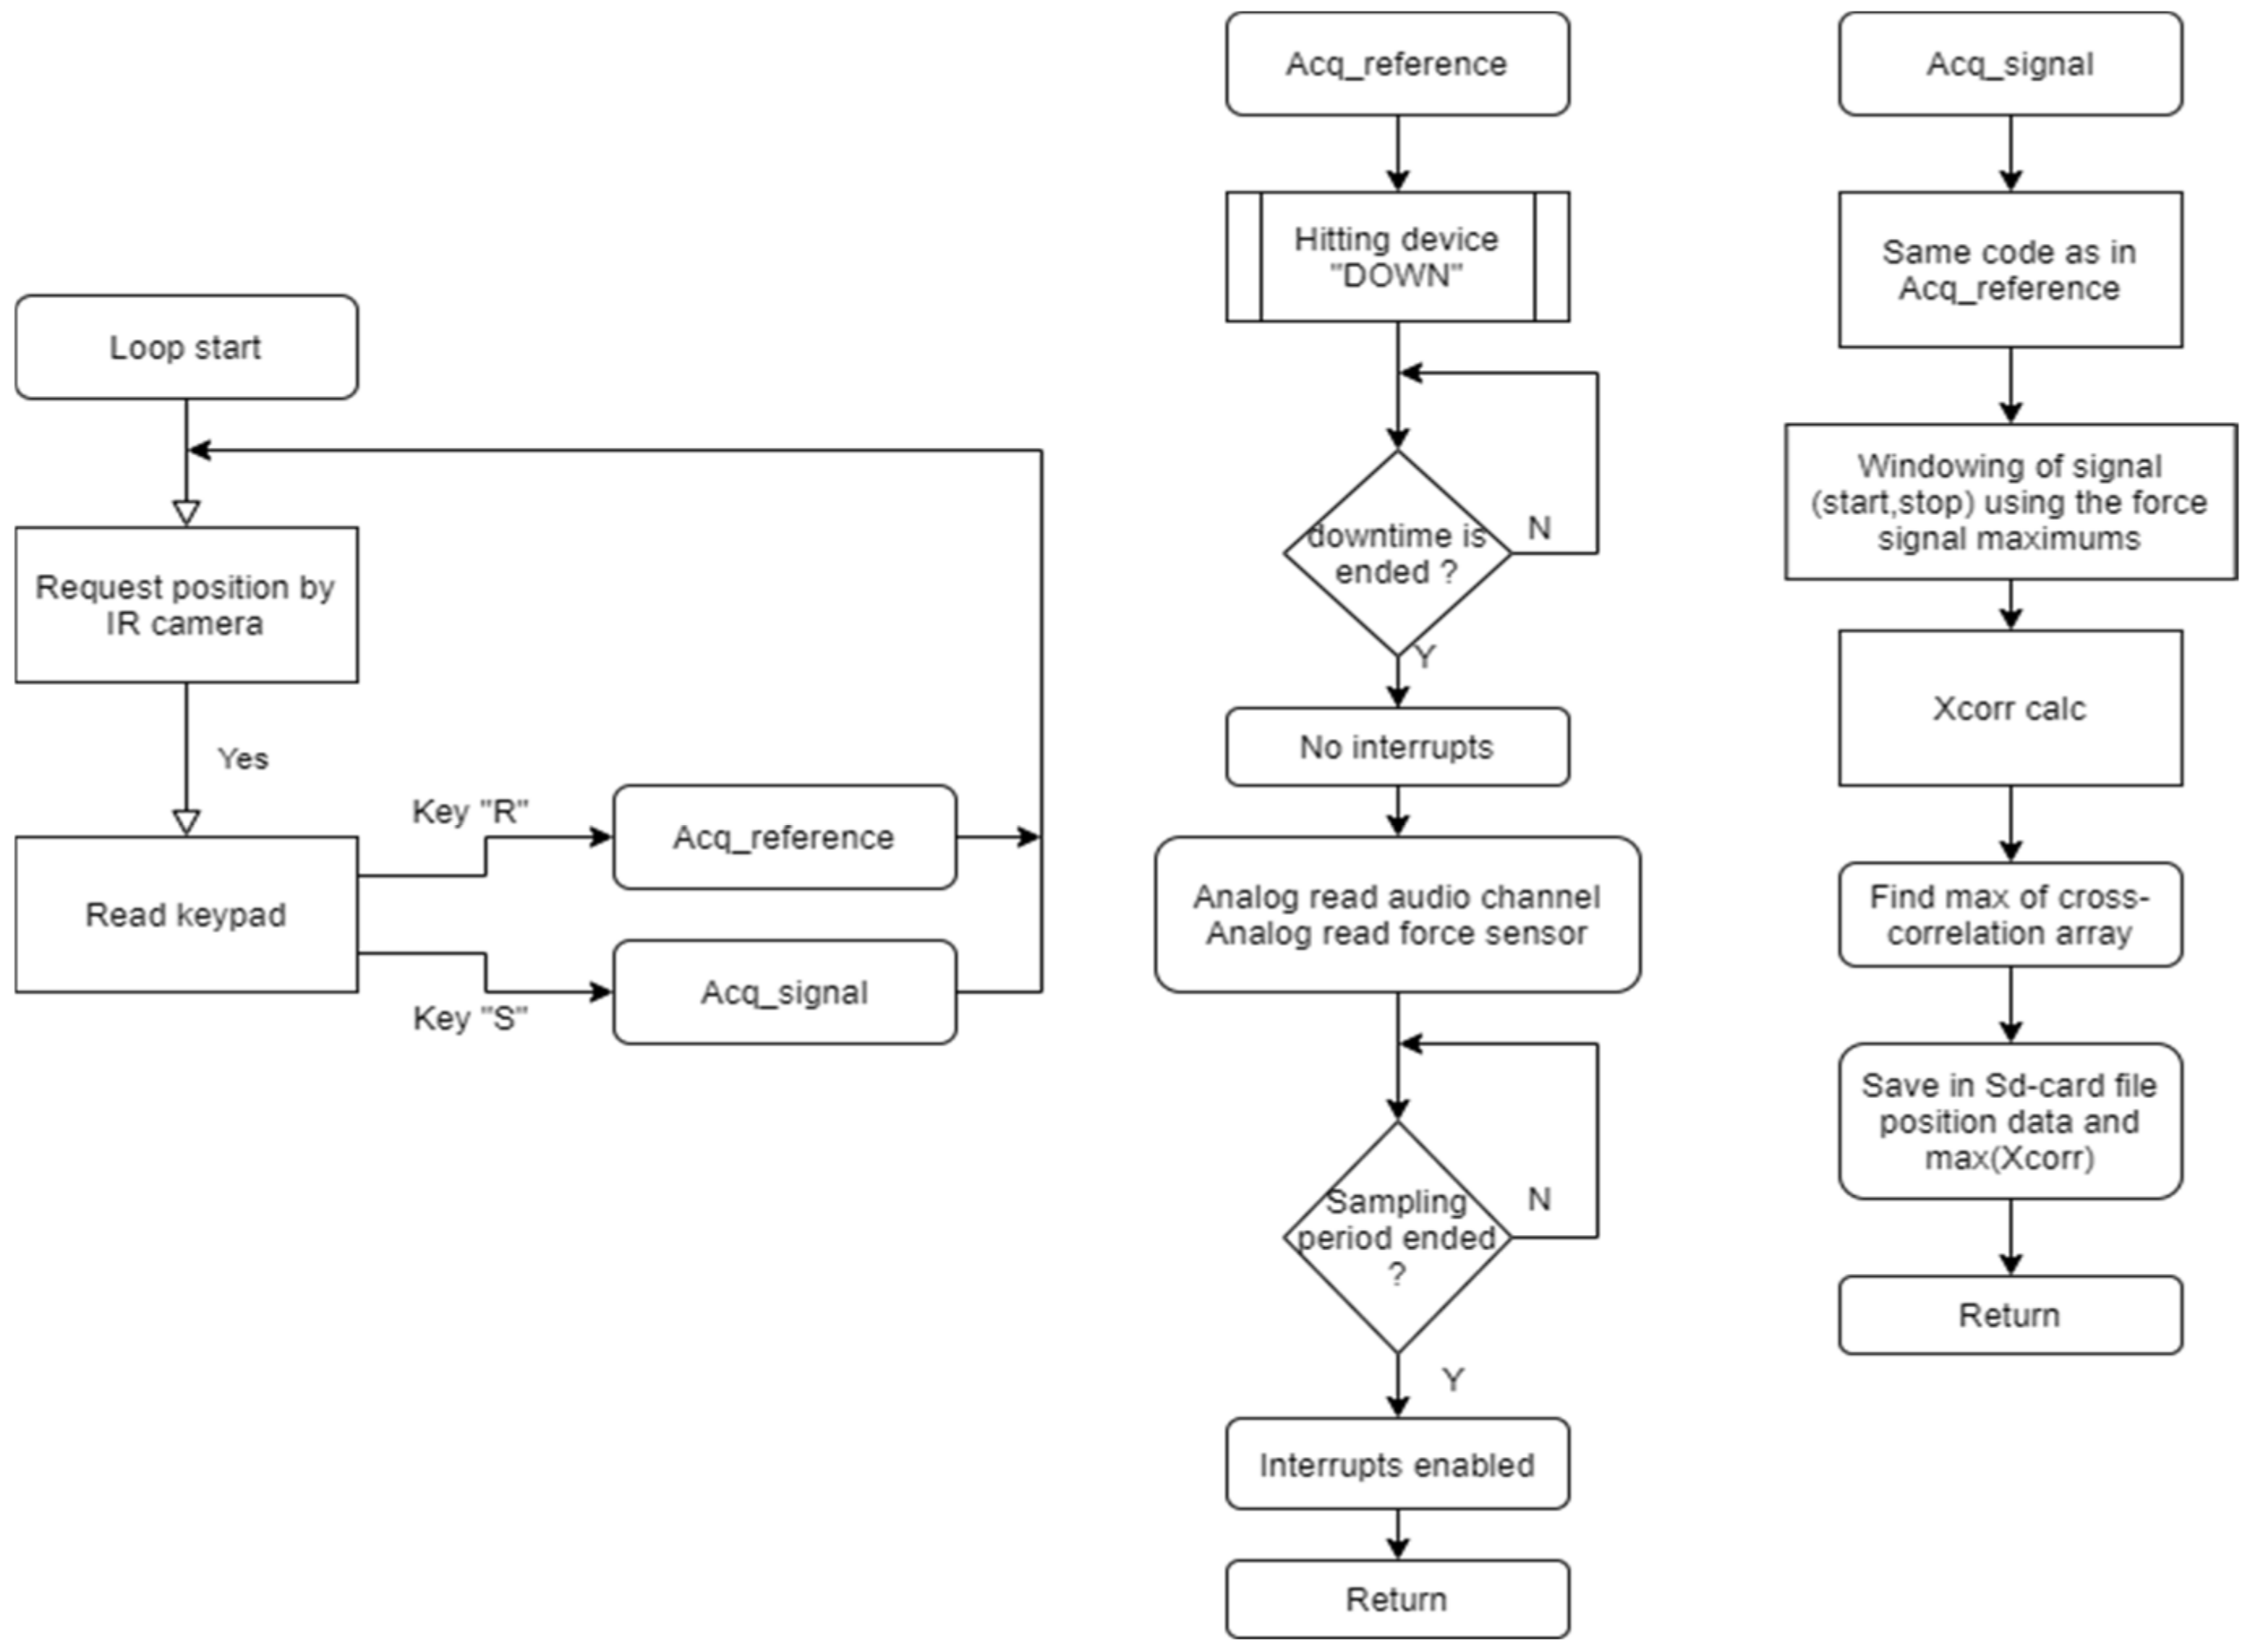
The implemented software is depicted in
Figure 6. The audio sampling frequency was set to 200 kHz, and considering that the analyzed signals are in the band up to 10 kHz, the signal is oversampled, in order to avoid aliasing problems. The force-sensor sampling frequency was set to 500 kHz to acquire a sufficient number of points to measure properly the impact-time. The depth of quantization is 10 bit. As already stated in the introduction, the concept underlying the algorithm is to establish a test point at which there is certainty: this point can, for example, be adherent with certainty. The restorer, based on his experience and professionalism, establishes the test point; with respect to this point all the other points will be compared, and the result will tell if the point under examination is similar to the one taken as test-point or is definitely dissimilar from it, using both the information coming from the impact-time measurement and the correlation index that is calculated by comparing the audio recorded by the test point and the point being measured.
The number of audio samples is set to 512 which is a good compromise between the memory occupation and the fidelity of the recorded signal. The data frame is 2.56 ms long and is suitably windowed considering the references introduced by the signal coming from the force sensor. In fact, as can be seen in
Figure 7a, the audio signal to be analyzed is triggered by the force sensor signal. Furthermore, even considering the dead-time due to the distance between the microphone and the impact point of the hitting device (1 cm, thus about 30 µs), the remaining acquisition time is sufficient to consider the main part of the audio signal.
Figure 7 shows an acquisition of an audio signal obtained hitting the surface and the relative signal of the force sensor (both appropriately scaled). The figure shows the starting point of the 512-sample window which will then be analyzed by the cross-correlation index extraction software. The signal is acquired starting from 12 samples before the maximum of the force sensor signal and ends after the acquisition of 512 samples. Obviously the acquired signal is wider, and the window is applied after the acquisition.
Furthermore,
Figure 7b shows two acquisitions of the signal due to the force sensor. As mentioned, the presence of defects will decrease the local stiffness of the structure and produce a wider force-time pulse or shows a longer contact time. The test surface is analyzed by comparing the contact time or determining the deviation of the force-time pulse width from the nominal width obtained from a reference undamaged surface. Hence, the sound of a rigid area will give a lower reading whereas a damaged area will give a higher reading of the impact-time. First, the test signal is memorized by the central processing unit (CPU) while tapping a part of the test-object apparently in a good state of conservation and the impact time T
0 of the part is memorized as the standard value. Then the test-object is scanned with the hammer and, when the hammer hits a detached part, the impact time T at that moment is compared with the memorized standard value. An appropriate ratio of the relationships between the two time-durations measures in a simple way the state of detachment/no-detachment of the measured object.
It is possible to change the duration of the time that the solenoid touches the surface under examination: this time can vary from about 2 ms to 12 ms, times that correspond to a lower or greater force of impact on the surface.
The calculation of the cross-correlation vector, the maximum of which represents the index of cross-correlation measured by the instrument, was implemented using a procedure very similar to that used by the commercial software Matlab (MathWorks, Natick, MA, USA) [
20], through which the feedbacks for the debugging of the procedures written in the Arduino IDE (integrated development environment) were made, to test the correctness of the lines of code.
3. Results
In this section we present the results of the realized device, by means of measurements carried out both on laboratory test objects, prepared ad hoc for this use, and on an original artwork whose structure and defects were known. The data stored on the SD (secure digital) card were exported to a PC and viewed using a commercial software that displays 3D maps from sampled data, Surfer 8.05 (Golden Software Inc., Golden, CO, USA) [
21].
3.1. Gridding and Interpolation Method
The points were analyzed with the kriging gridding system. Kriging is an advanced geostatistical procedure that generates an estimated surface from a scattered set of points (x, y) with z-values. Using these data, we produce 3D maps: the x and y coordinates to indicate the point where the measurement is made and the z coordinate represents either the cross-correlation index or the relative measurement of the impact-time, using a color scale. Since the three-dimensional view is not appropriate for this type of analysis, we display the 3D map in orthographic projection (viewpoint from above) with a light source normal to the surface and placed in its center at a predefined height. The kriging method assumes that the distance or direction between sample points reflects a spatial correlation that can be used to explain variation in the surface. The kriging tool fits a mathematical function to a specified number of points, or all points within a specified radius, to determine the output value for each location.
To create a grid file, the software used takes randomly the spaced
xyz data and uses it to create a regularly spaced grid file, composed of grid nodes. Each grid node is located at a particular
xy location and has a
z value associated with it. One of the disadvantages of kriging is that it can be slower than other methods. Each grid node value is based on the known data points neighboring the node. Each data point is weighted by its distance away from the node. In this way, points that are further away from the node will have less weight in the estimation of the node. For example, to compute the z value at grid node A, this equation is used:
where
ZA is the estimated value of grid node A,
n is the number of neighboring data values used in the estimation,
Zi is the value at location
i with weight
Wi. The value of weights will sum to 1 to make sure there is no bias towards clustered data points. We used the default properties of kriging: points with no drifts and a circular search (slope 1 and anisotropy ratio 1, thus a circular region). However, the performed measurement is punctual: only the state of adhesion of the point where the measurement is conducted can be certainly. It is clear that in the phase of graphic “mapping” of the object, the used mathematical method will try to connect (following the kriging method) the various areas, but it is understood that the prediction is given by the mathematical approximation used and not by the measure itself. The only certain point is the measured one.
3.2. Measurements on Test Objects
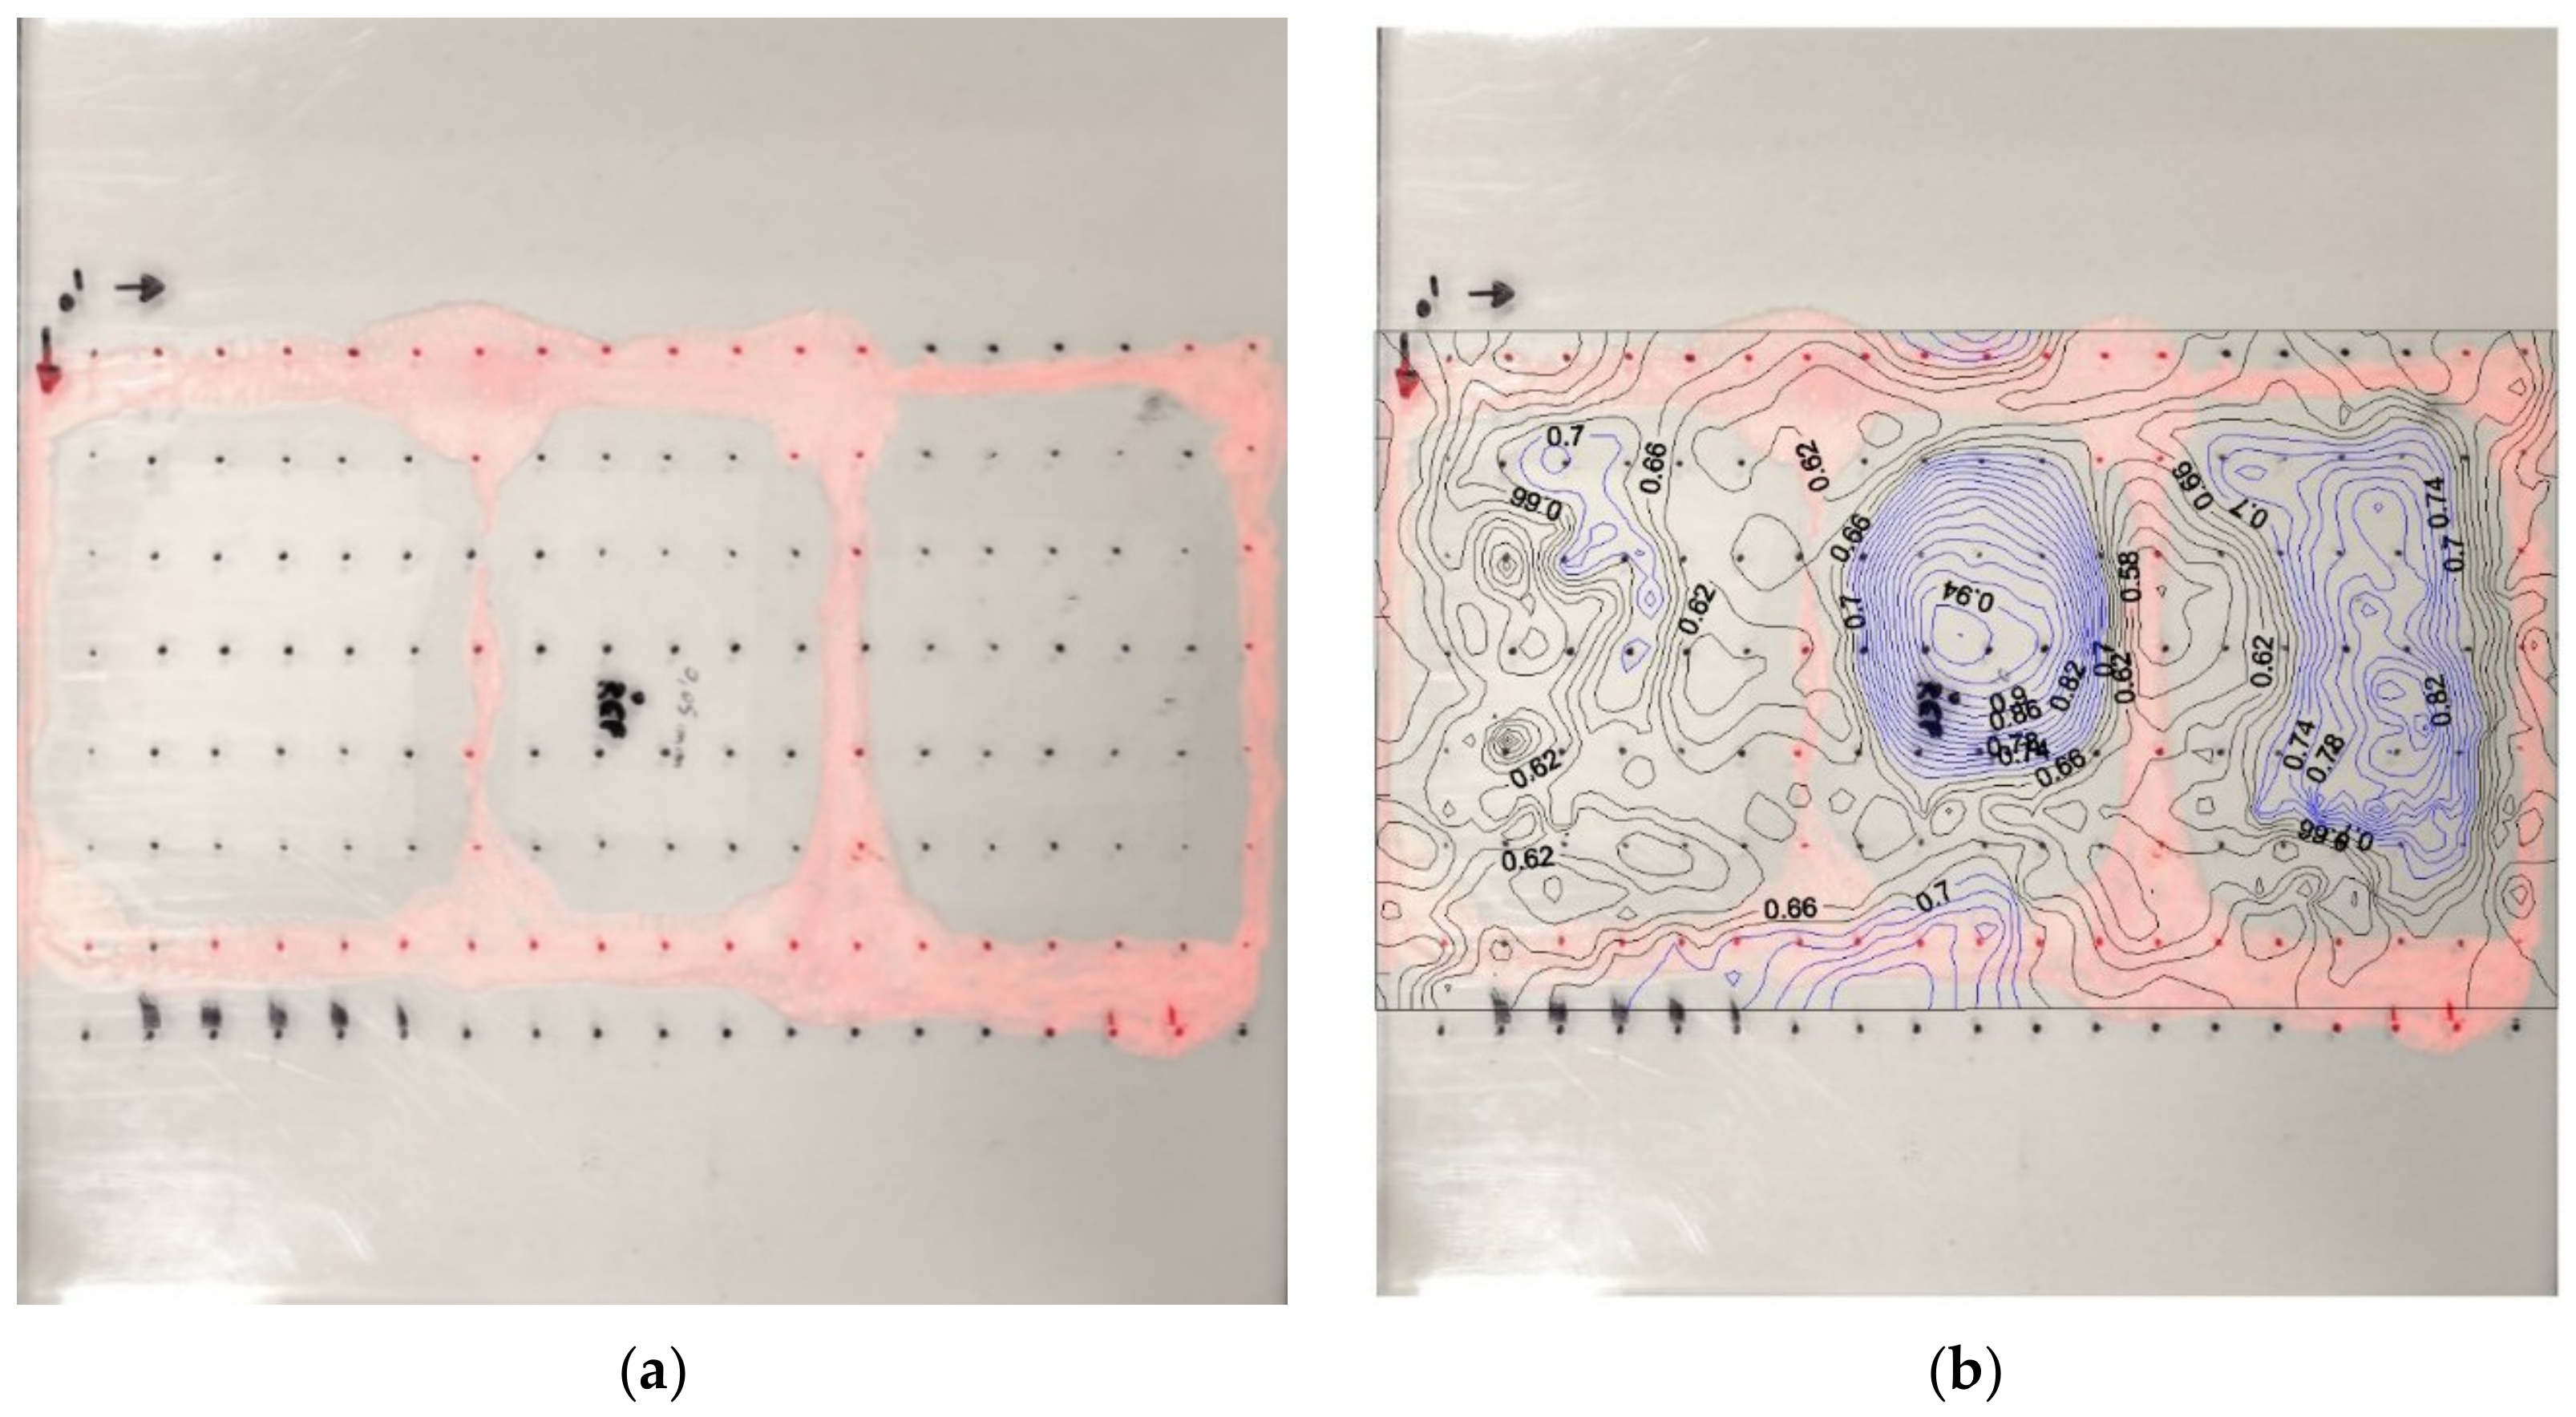
In
Figure 8 we show the measurement carried out on test object 1, using only the cross-correlation index by the audio data. This object was made using a 20 × 20 cm sheet of PMMA (Polymethyl-methacrylate also known as acrylic glass or plexiglass) with a thickness of 4.8 mm, glued with cyanoacrylate glue to a base consisting of a white tile of the same size. To obtain the gaps, paper thicknesses were used; in
Figure 8a the glue was colored to improve the contrast of the image. Using this method, three pseudo-rectangular cavities were created which are highlighted in figure. The central point (Ref) was chosen as the test point, certainly not adherent, and used as a reference point for the entire measurement of the object. The data were then processed (after the Kriging gridding steps) using the contour map technique by the software Surfer, and the recognition of the three pseudo-rectangular areas is evident in
Figure 8b. Only the rectangle on the left is not well defined, probably because the paper thicknesses introduced in this area were not sufficient to create a cavity as in the central one. It is also visible that the cyanoacrylate glue in the part bordering the central rectangle with the left area has not adhered effectively to the base, i.e., it is too thin (in width) to delimit the area, as can also be seen from the level curve visible in the
Figure 8b.
Figure 9 shows the measurement carried out on Test Object 2, using both the impact-test data (
Figure 9b) and the audio cross-correlation index (
Figure 9c), to demonstrate the fusion of data. This object was made using a 20 × 20 cm sheet of transparent PMMA with a thickness of 4.8 mm, glued to a base consisting of a tile of the same size covered with quick-setting cement mortar. To obtain a certainly empty chamber, a circular (7.5 cm in diameter) 4.8 mm thick was used in the central part. The evident non-uniformity in the thickness of the cement mortar revealed few points of actual contact with the PMMA slab. Furthermore, the bonding of the plate to the mortar was only partial, and in fact this circumstance was measured and displayed in
Figure 9b. The center point of the test object was chosen as the test point for the audio cross-correlation, certainly non-attached, and used as a reference for the entire measurement of the object. The data were then processed using the contour map technique (after kriging gridding) in Surfer. In this case, unlike the previous one in
Figure 8, the recognition of the zones is less evident, also because the measured mesh is much more complex.
Figure 9c shows high-level contour lines in the vicinity of the point chosen as the test point (as it was obvious to expect), while the areas evidently more adherent are those represented by level curves of lower value and colored blue to highlight them. In
Figure 9b, the same test-object was measured using the impact-test method: the information by this measurement is in a good agreement with the effective structure of the test-object depicted in
Figure 9a and with the audio measure of
Figure 9c. Fusion of the data for this test object made it possible to highlight with certainty the points of effective intimate contact with the PMMA plate: in fact the only different color assumed by the cement mortar could be misleading in relation to the areas actually adhered.
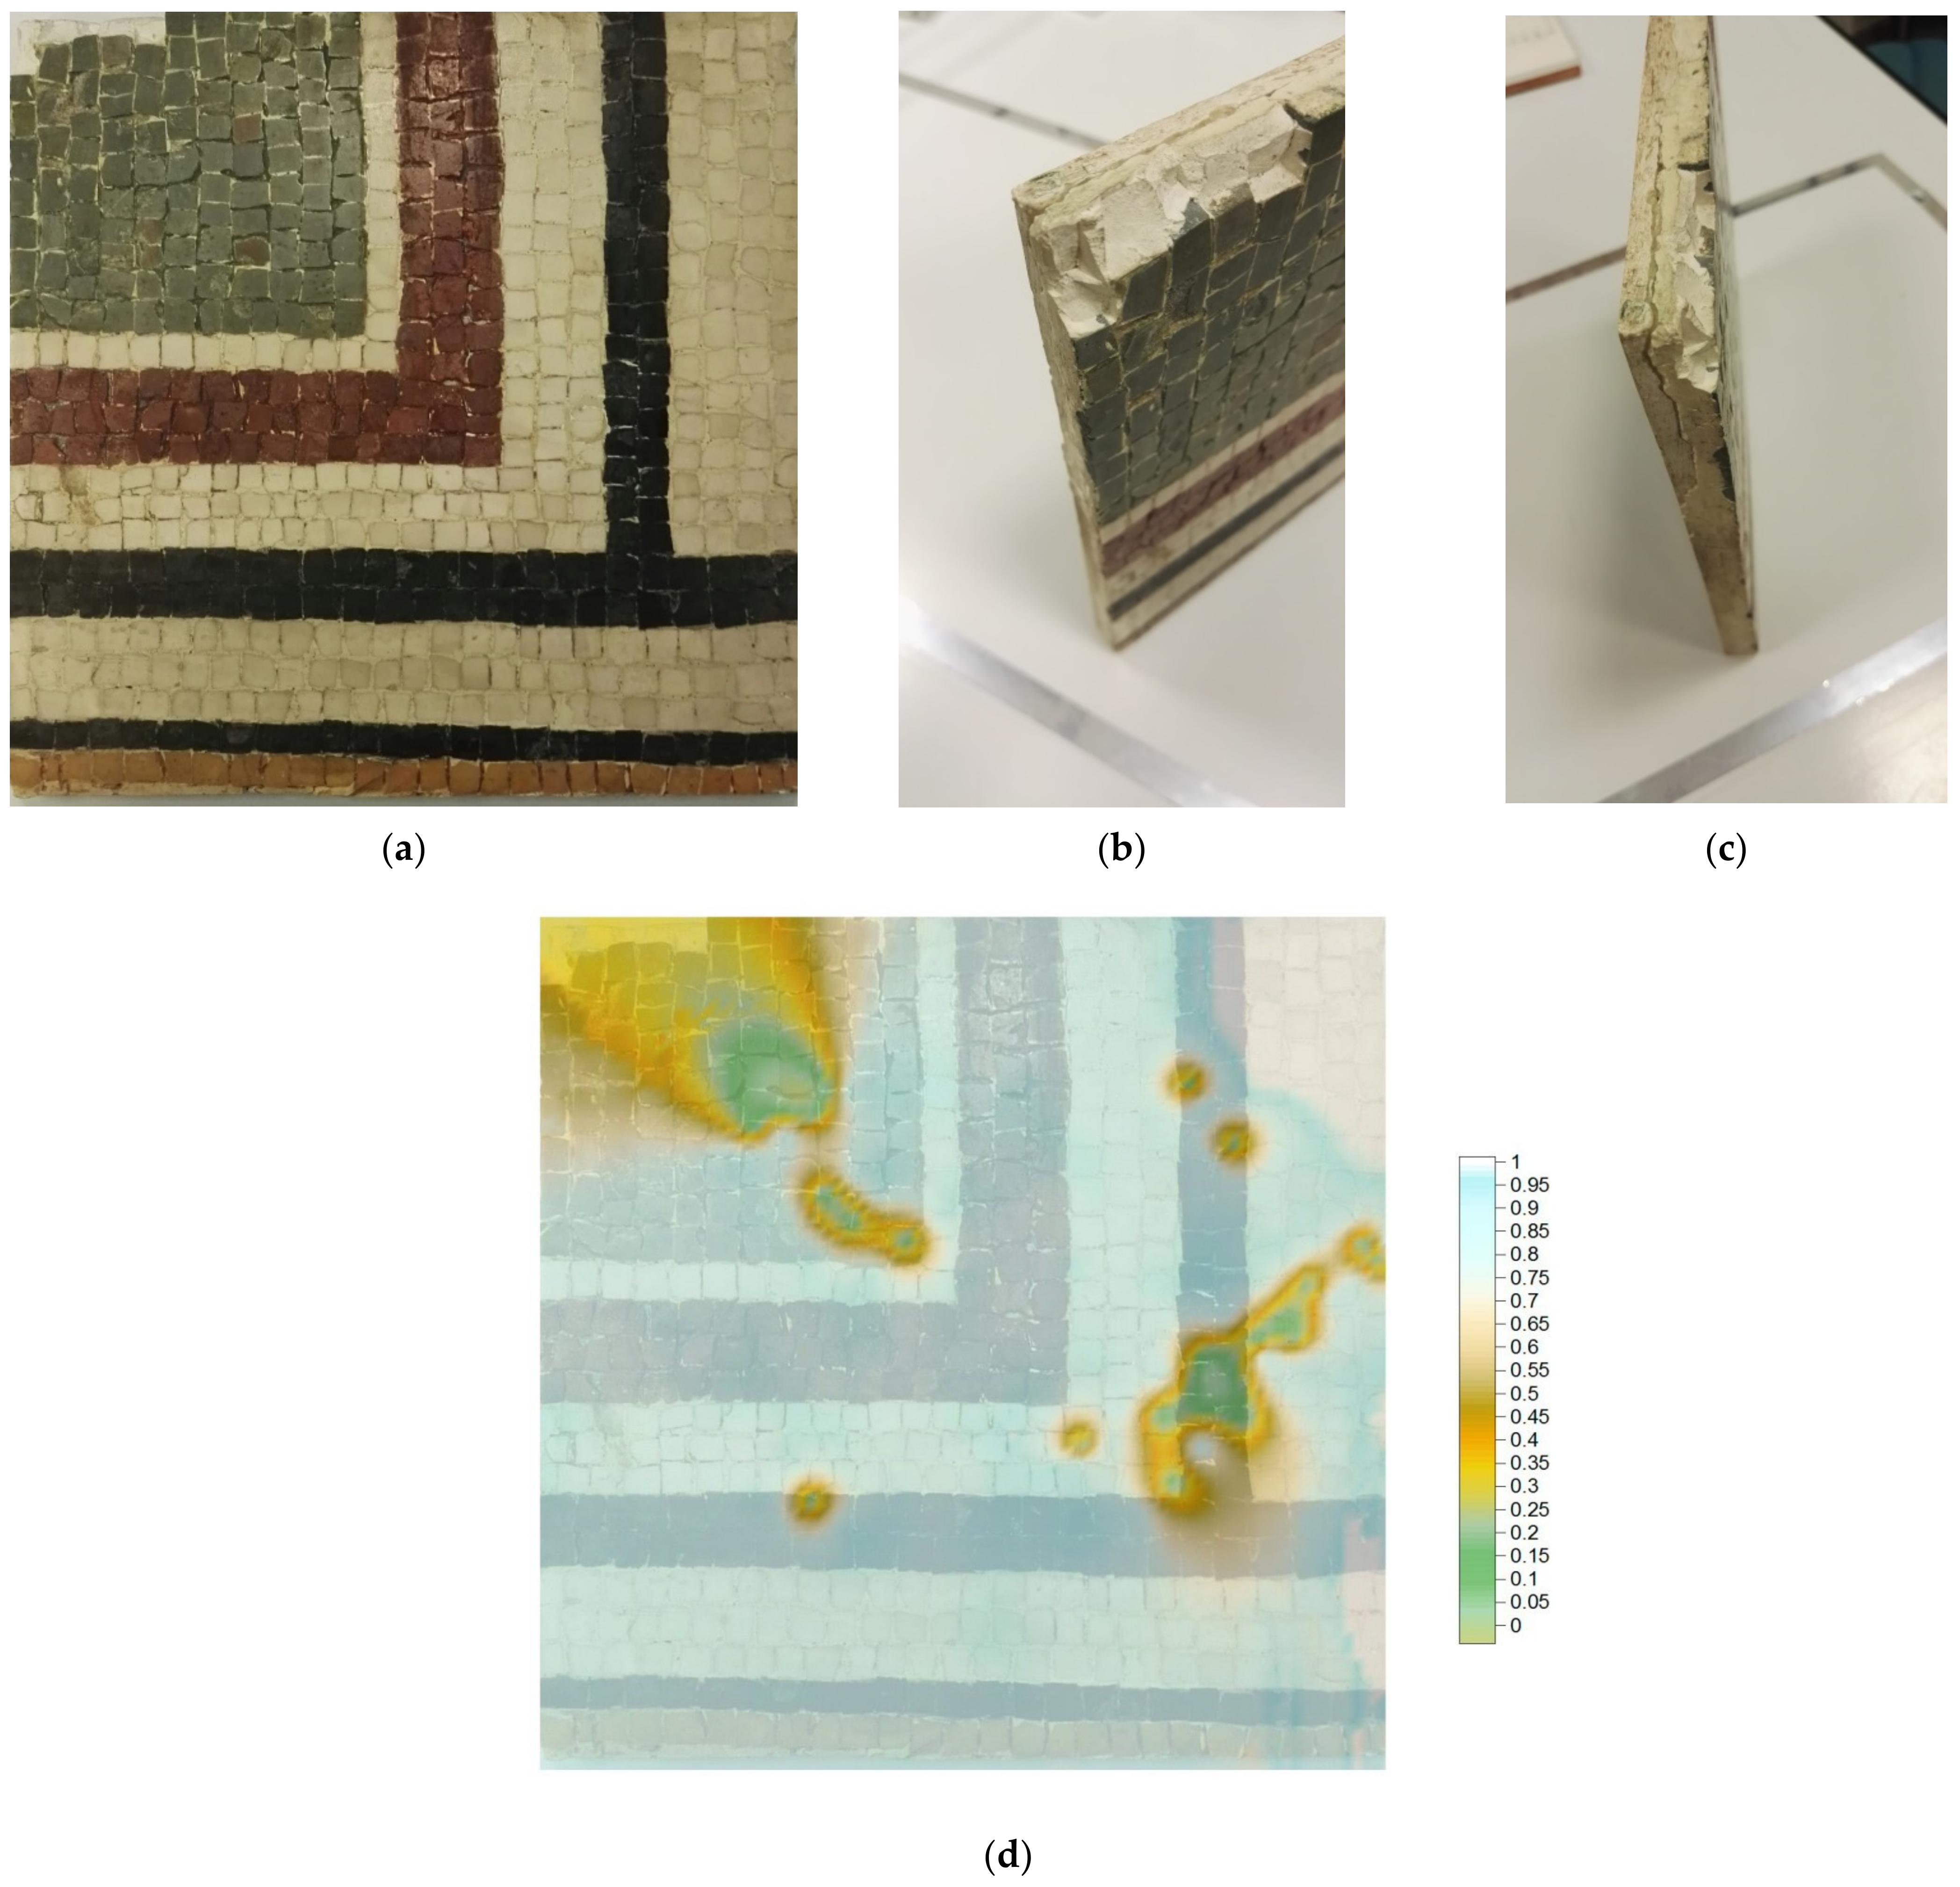
In
Figure 10 we show an audio cross-correlation measurement made on a sample of real mosaic (floor of Roman origin, coming from the archaeological area of Tivoli, Roma) measuring 20 × 20 cm. This mosaic comes from a restoration carried out in the 1970s, and was glued using cementitious material to a tile used as a base. Over the years, unfortunately, the upper left corner has undergone a partial detachment from the base, as can be easily seen from
Figure 10b,c. In this case the detachment is evident and the measurement carried out was intended to confirm the optical analysis performed.
Figure 10d shows the measurement carried out: in this case was used the 3D surfaces technique, after the kriging gridding steps, superimposed to the real photo of the mosaic. Once the approximating surface was obtained, it was added to the actual image of the mosaic, so as to effectively understand the extent of the detachment and any other points not visible to the optical analysis. In fact, in addition to confirming the detached area visible to the naked eye, it revealed a further detachment area in the peripheral area on the right and some isolated defect points. The discovery of a further detached and invisible area was of great impact to the experts to whom the verification of the measure was subjected.
The restorer, using the classic method of “knocking” carried out with the knuckles of the hand, confirmed the presence of the defect but obviously without the precision of the method described so far. The presence of isolated points in the analysis of the detachments cannot be confirmed by the restorer’s verification, not only because they are too small to be appreciated with the classic method of knocking, but they could also be false positives. In our experience, only homogeneous areas of defects can be considered as real defects, while nothing can be said about isolated points, which could also be due to measurement errors.
3.3. Measurements on Ceramic Test-Objects
A second set of measurements was carried out on another class of test objects, simulating artistic glazed ceramic tiles in terms of materials and their elastic properties.
Glaze delamination and spalling is a severe conservation problem, often correlated to water-related deterioration: the damage is mainly associated to the co-existence of the porous ceramic substrate, which may absorb water, and the glazed painted layer, which constitutes a barrier to water and to evaporation. The crystallization of soluble salts and the presence of manufacturing defects enhance the damage. The early detection of adhesion failure, before the glaze falls off and the lacunas impair the visual integrity of the artwork, is highly desirable and should identify hidden cavities a few hundreds of microns deep, when they are still invisible to the naked eye.
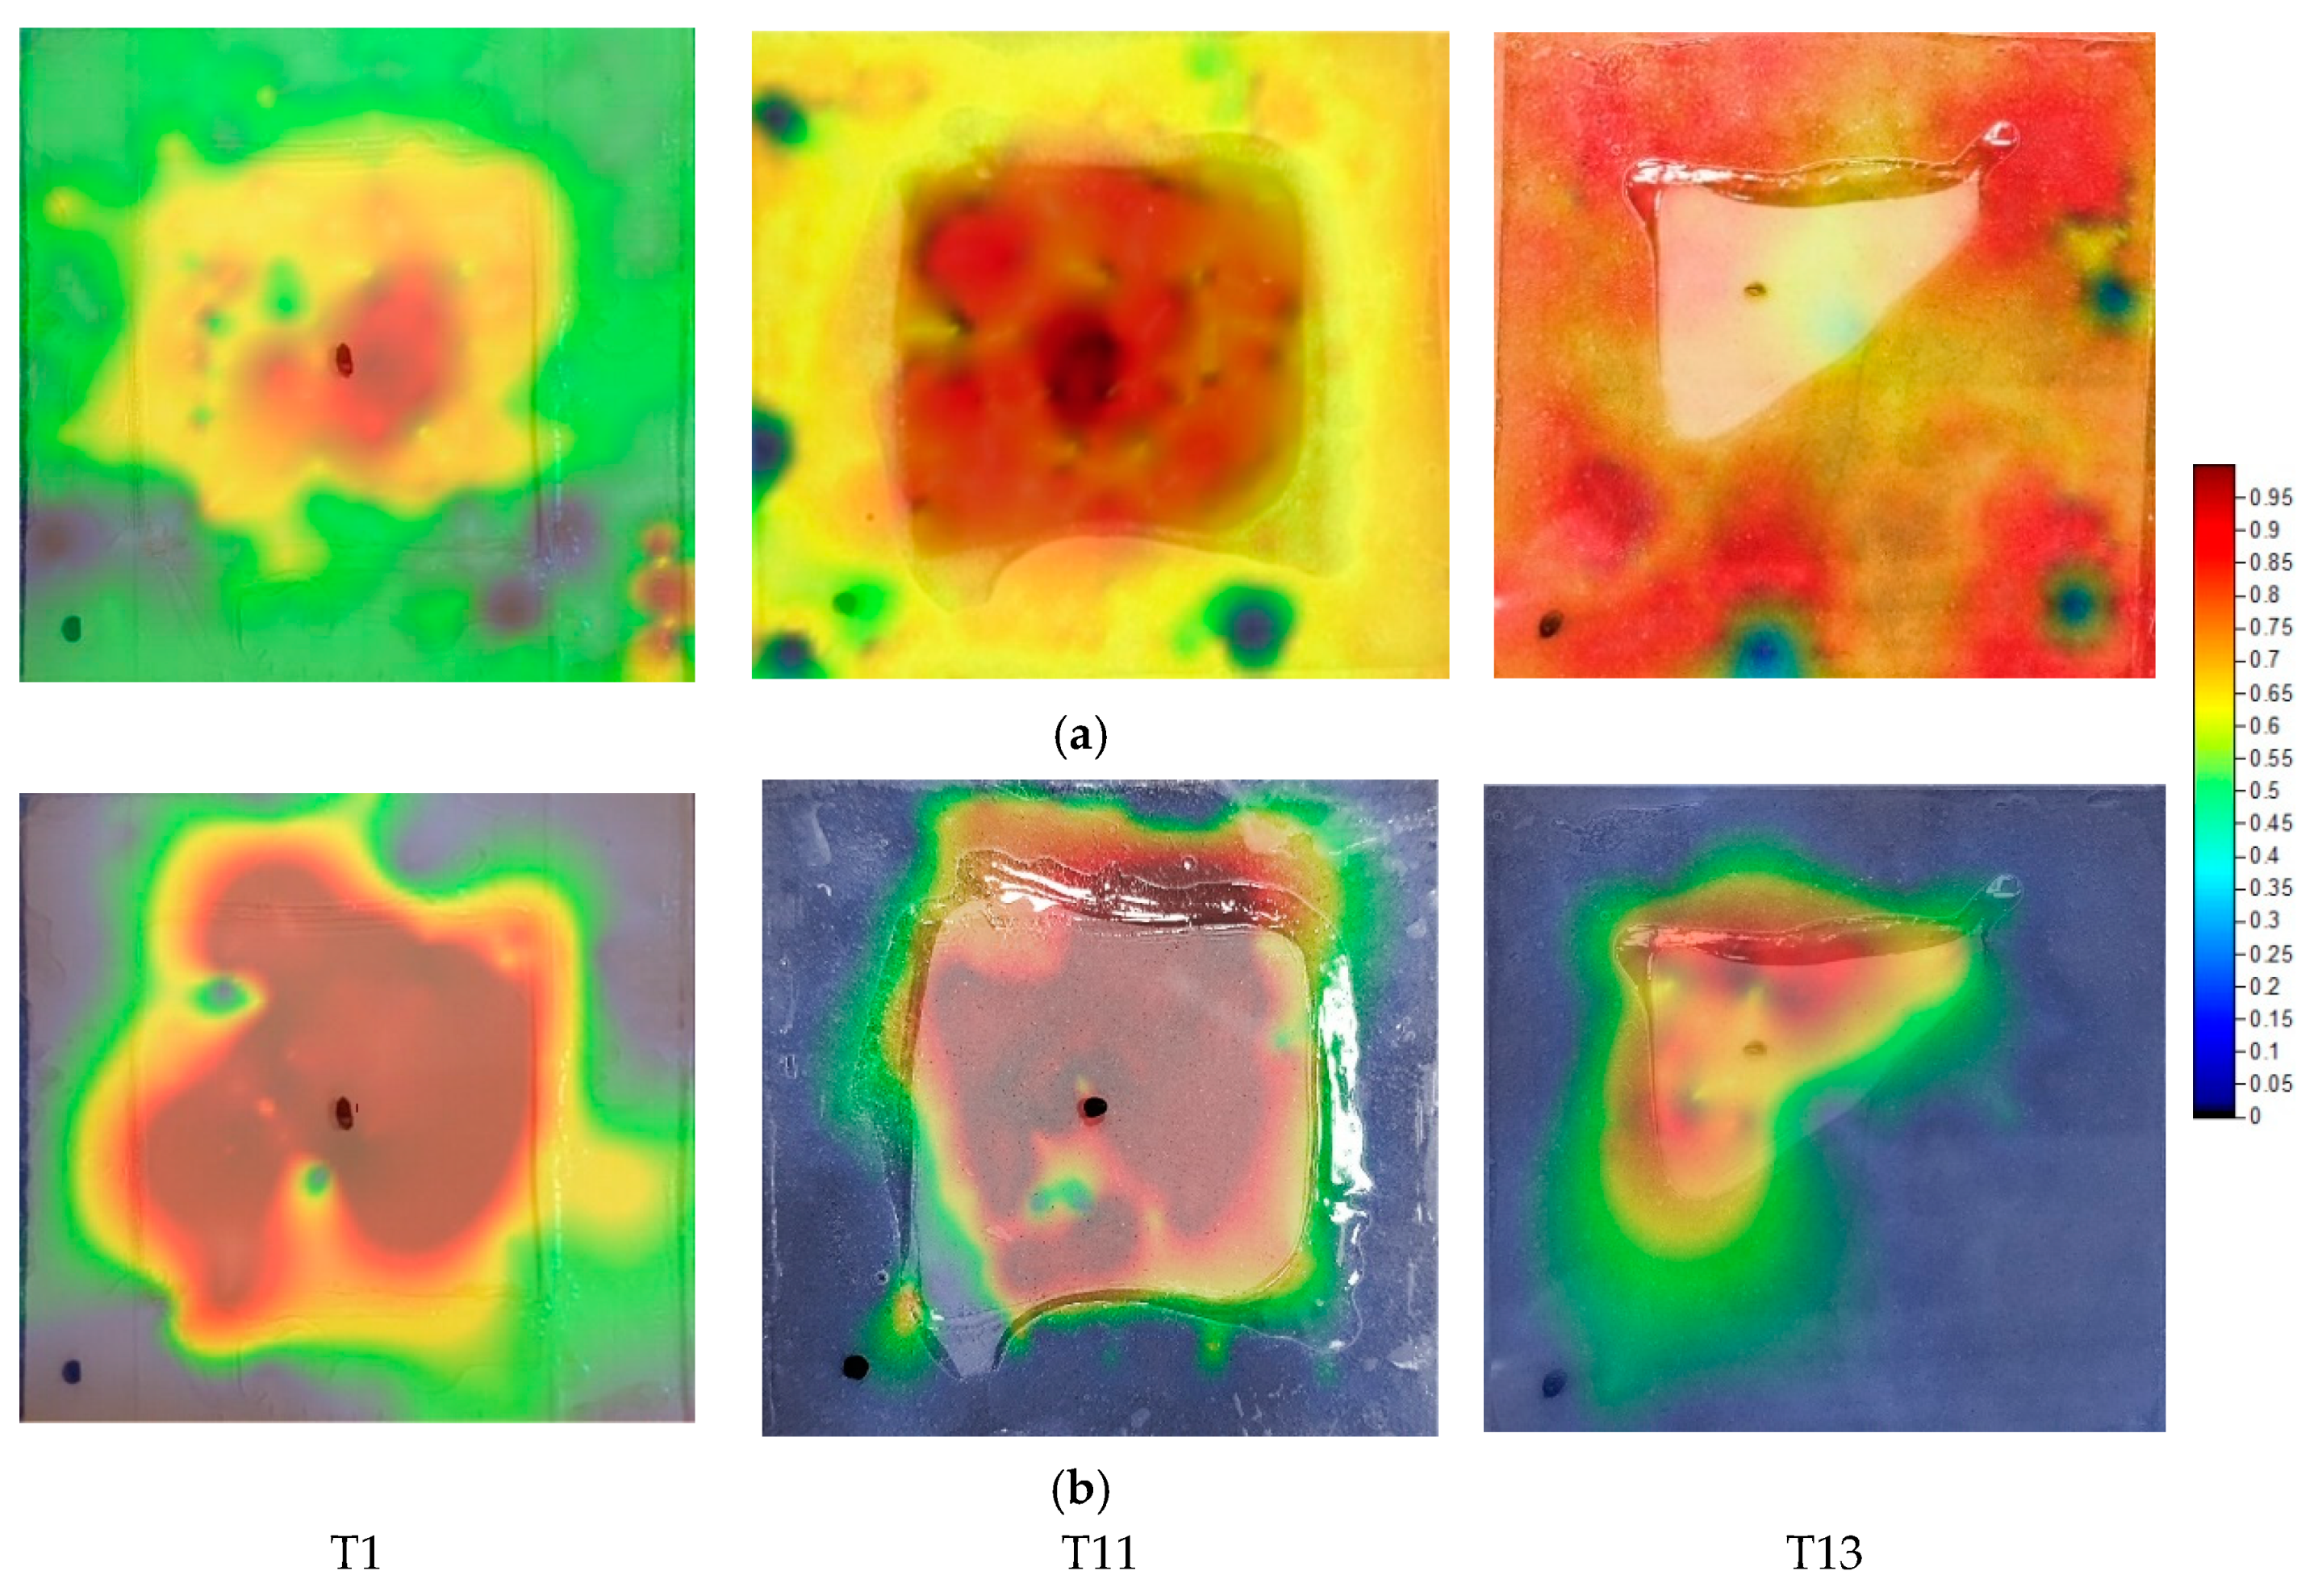
Three tile models were analyzed in the present work, shown in
Figure 11; they belong to a little and heterogeneous collection of antique azulejos and laboratory models [
22,
23] of the Laboratory of Acoustics Research applications for Cultural Heritage (LARCH) of INM-CNR (Institute of Marine Engineering, National Research Council, Roma, Italy).
The tile models T1–T11–T13 with artificial cavities, different in shape and depth, were manufactured assembling thin technical glasses of the type SCHOTT D 263
® LA eco [
24] (a colorless borosilicate glass, having thickness 0.7 mm, density 2.51 g/cm
3, and Young’s modulus 72.9 GPa) on small clay substrates using epoxy glue. The physical properties of these technical glasses and of the epoxy glue allowed simulating the physical properties (air cavity thickness, glaze thickness, density and elastic properties) of the real tiles in vibro-acoustic phenomena. The manufacturing process was carried out at room temperature using epoxy glue with medium drying time (30 min) to prevent cracks during the drying process.
For the model T1 few pieces of ordinary microscope glass, 0.8 mm thick, were cut and fixed on the clay substrate in order to build the side walls of a square cavity. Successively, the thin D 263 glass was fixed as capping layer upon the previous one, thus forming a hidden cavity having a resulting thickness of 1.3 mm.
In order to minimize the cavity thickness, for the other models a different manufacturing process was adopted, building up the cavity’s walls only with the epoxy glue. Specifically, for T11 a first uniform layer of glue was spread over the back surface of the thin technical glass used as cap layer, masking a little area to shape the cavity; after drying, a second layer of epoxy glue was uniformly spread over the first layer, in order to fix the whole to the clay substrate. It resulted a hidden square cavity having a final thickness of 0.8 mm. Similarly, T13 was built following the same procedure, masking a triangular area to shape the cavity. It resulted a hidden triangular cavity having a final thickness of 0.6 mm. The manufacturing process was essentially a handmade procedure, however particular attention was paid during any single phase in order to make uniform each model’s thickness, and obtain flat surfaces and regular cavities as much as possible. The main features of the tile models are summarized in
Table 2.
These tile models were the subject of research addressing the validation of contactless and frequency-resolved vibro-acoustic imaging methods for the early detection of hidden glazed delamination [
22,
23]. Useful information derived from that research provide, among other evidence, the measured frequencies of the most relevant peaks of the vibration velocity (fundamental mode), when the test objects were exposed to an external acoustic pressure field in the audio frequency interval. These data are reported in
Table 3, and they were also in a good agreement with the theoretical vibration frequency of the fundamental mode for a rectangular plate, with a boundary condition that is not properly clamped (mainly due to the presence of the epoxy glue), calculated using Leissa’s formulas [
25,
26].
The measurements performed with the system described in this paper are shown in
Figure 12. About 200 points were acquired on each tile and a colored visualization scale was used, before only using audio data (
Figure 12a) and then using only impact time data (
Figure 12b). As can be easily seen in the figure, the delamination modeled by the tiles T1 and T11 are easily highlighted using audio data, while that of the tile T13 is not evident. In fact, the latter has a first mode frequency of over 11 kHz, as can be seen from
Table 3, which is beyond the frequency limit detectable by the audio section of the instrument. The upper limit of the frequency detectable with this electronics is less than 10 kHz, so we can also conclude that delamination up to thicknesses of about 0.8 mm of equivalent circular area of about 40 mm in diameter can be easily highlighted. To obtain valid measurements relative to defects of a lower area (or due to delamination of lesser thickness) by the audio data, it is necessary to use a slightly more sophisticated electronics, together with a microphone that extends its reception band at a frequency up to 20 kHz, of good quality. Therefore, the system can detect a wide variety of defects even of small dimensions; using components of better quality and obviously higher cost, the characteristics of the system can be improved, allowing the detection of ever smaller defects. In conclusion we preferred to use commercial components, so as not to affect the total cost of the instrument, which was one of the objectives set in this research work.
The result of the measurement carried out using the force sensor is different. The data relating to the impact-time confirm the result relating to the samples T1 and T11, while in the case of the sample T13, which cannot be measured by means of the audio data, the measurement of the force pulse allows the detection of this type of defect, as it is not involved the free resonant frequency of the equivalent plate, but it is simply the measure of the stiffness of the surface under examination. This result is very encouraging and allows us to affirm that the fusion of the data obtainable from the two measurement methods allows to cover a large dimensional variety of defects, of various kinds and arranged in a different way with respect to the surface.
3.4. Repeatability of Measurements
In this paragraph we want to give an estimate of some typical parameters such as the repeatability of the measurement in question and its reliability. Avoiding going into the specifics of the discussions, we refer to the references for any further details [
27,
28]. For the moment we can say, starting from the concept that the measure in question is a relative measure (it is a cross-correlation coefficient, that is a test of similarity between two signals) that it has been repeated on the same points hundreds of times.
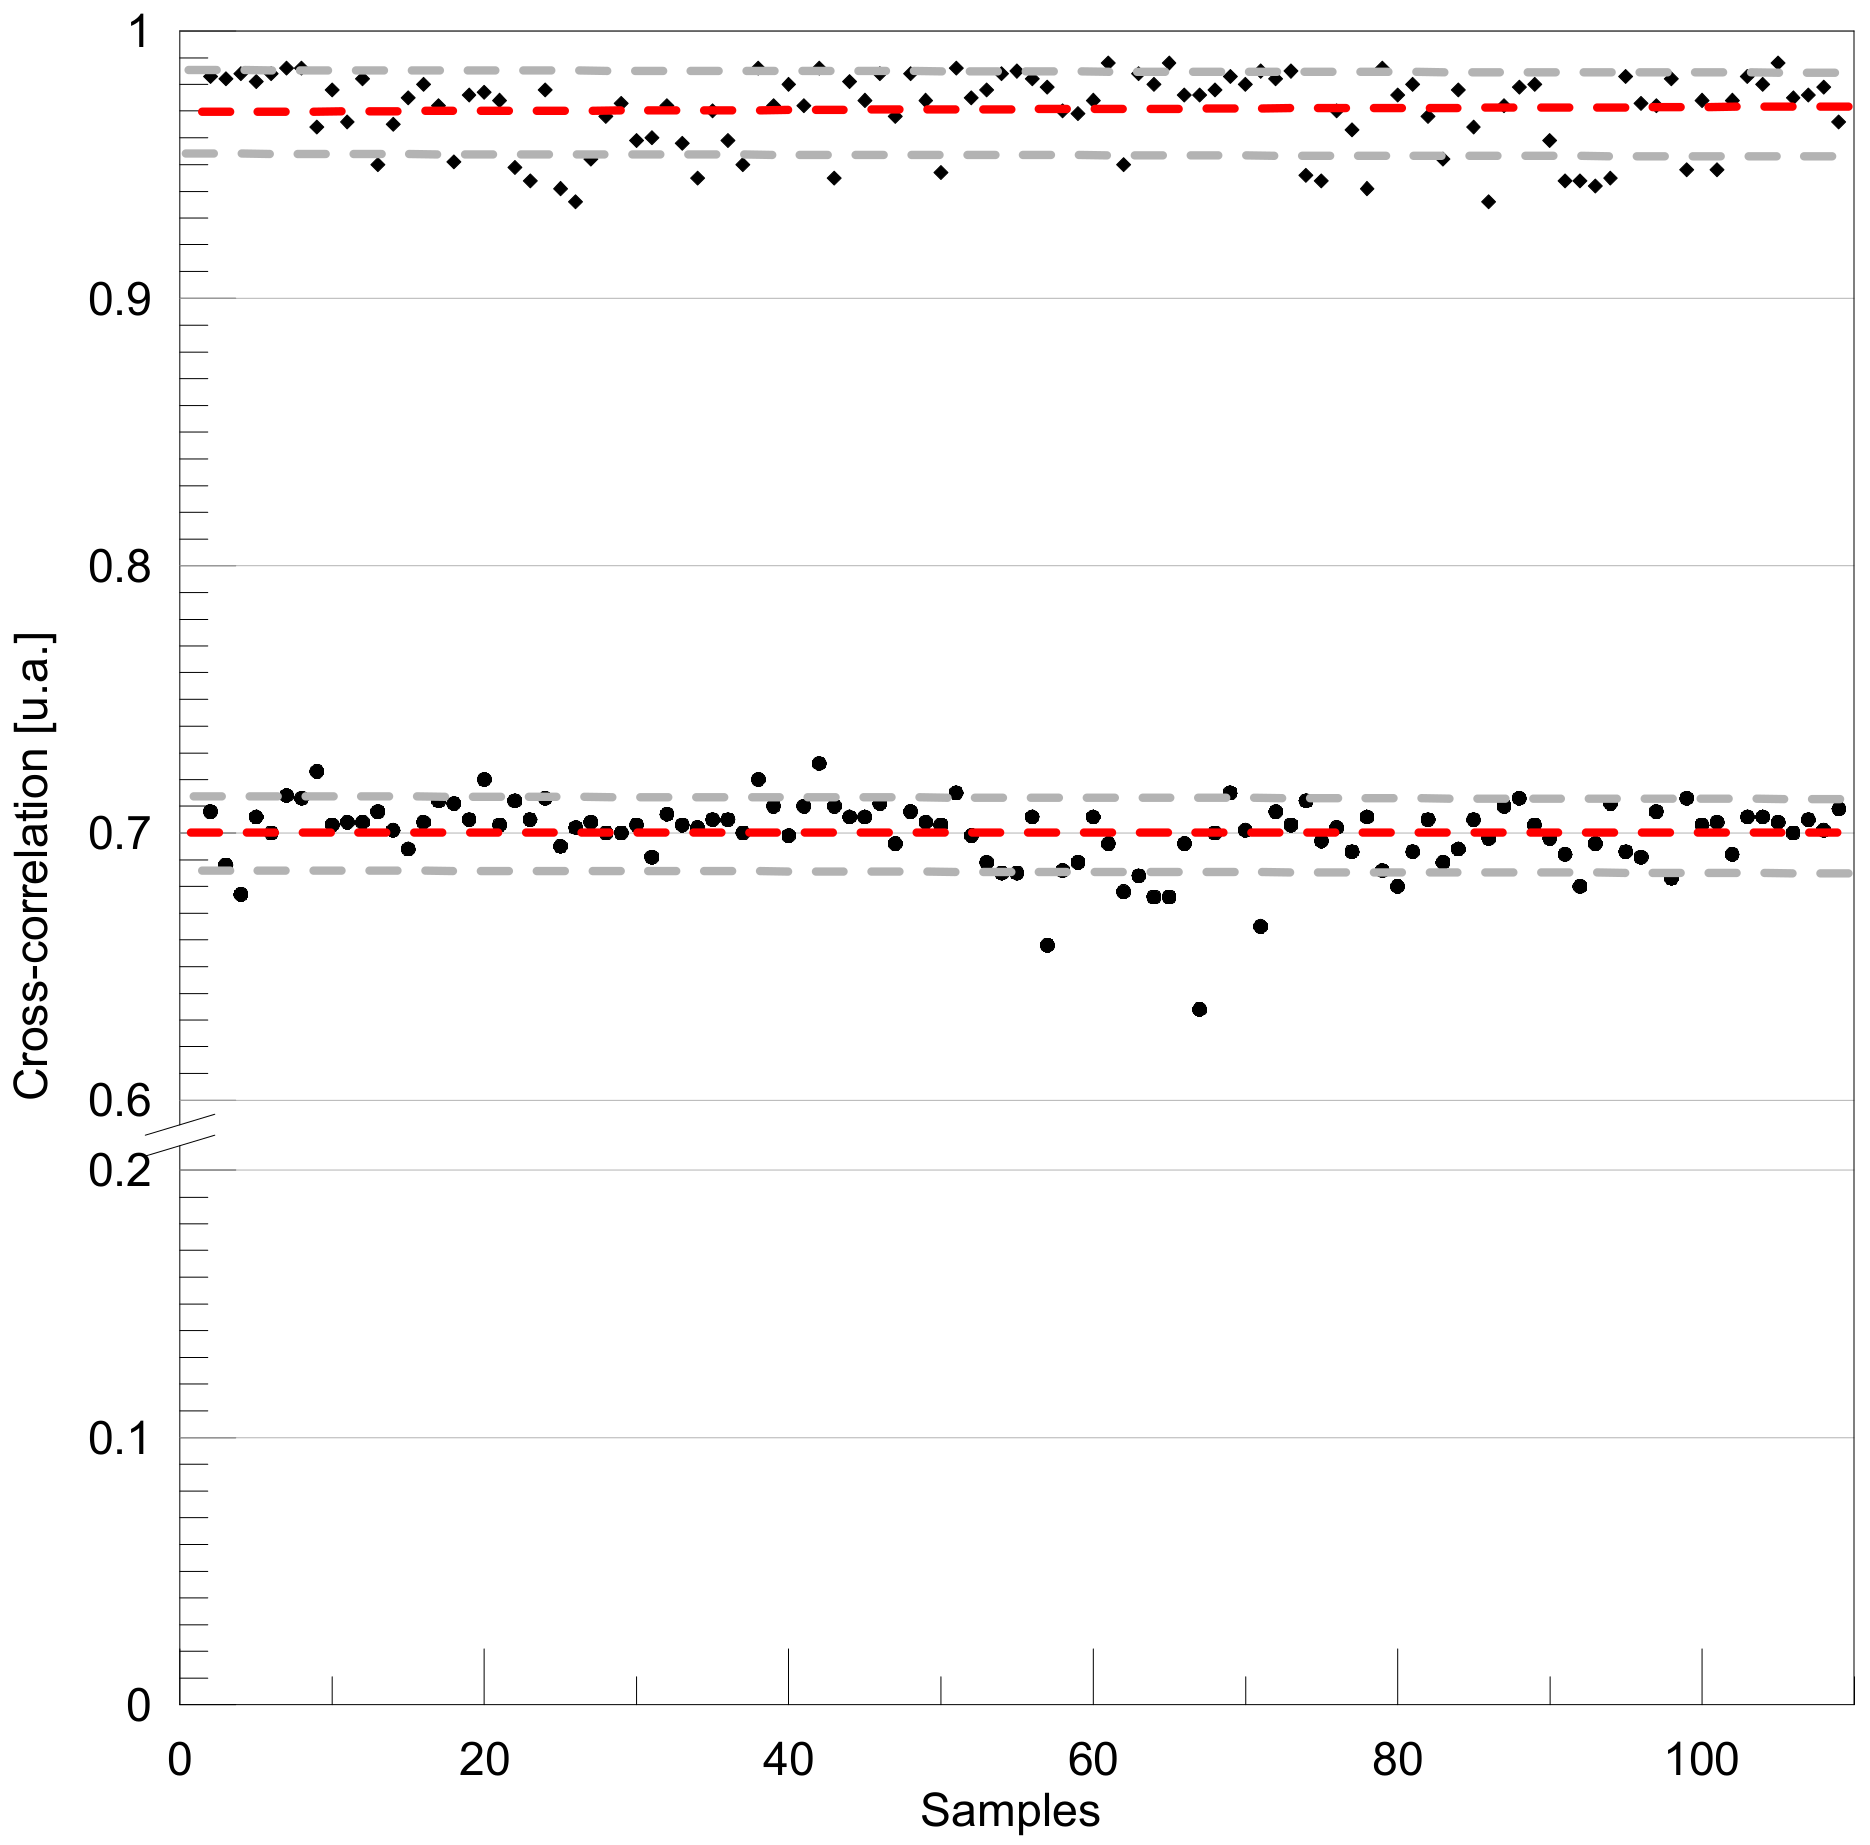
Figure 13 shows one of the measurements made, as follows: two points have been chosen, one as a reference in a well-attached point, the second is a sure not-well-attached point; the test was performed by repeating one hundred independent measurements, alternating the measurement in the two points, manually moving between the two points (thus simulating the actual measurement performed by the restorer, with an accuracy of ± 5 mm), and trying to always measure the two established points, with the help of the XY coordinates displayed by the device.
The expected value for the measure of the first point is equal to 1 (it is in the reference point), while the experimental values and their standard deviation are expected to account for the uncertainties due to positioning, signal conditioning, signal quantization, and so on. In our case, we obtain an average value of 0.97 with a standard deviation of 0.014, resulting in a relative error of 2.8%. In the second point we obtain an average value of 0.7 with a standard deviation of 0.013, resulting in a relative error of 3.7%. The total repeatability error for the two measures is less than ±0.014. This result, with relative error less than 5%, is a highly interesting feature for the type of measurement we have analyzed so far, and it represents a good trade-off between the accuracy of the measurements and the typology of the components used and their cost.
4. Discussion
A low-cost portable device capable of measuring detachments and delamination to help conservators in analyzing the state of conservation of an artefact has been designed. Tests were performed on several test objects to simulate various usage scenarios. We made both laboratory models (as in
Figure 8 and
Figure 12) and real models (as in
Figure 9), and we also measured a real object, as in
Figure 10. All these tests confirmed the validity of the system and its flexibility in use in situ.
In
Figure 8 we show the measurement carried out on a test object made using a 20 × 20 cm sheet of PMMA with a thickness of 4.8 mm, glued with cyanoacrylate glue to a base consisting of a white tile of the same size. To obtain the gaps, paper thicknesses were used, to obtain a gap depth less than 1 mm. Using this method, three pseudo-rectangular cavities were created. The data were then processed using the contour map technique, and the recognition of the three pseudo-rectangular areas was evident. Only one of the three rectangles is not well defined, probably because the paper thicknesses introduced in this area were not sufficient to create a cavity depth greater than 0.8 mm, or, more likely, because the surface of the tile was not uniform.
In
Figure 9 we show the measurement carried out on a test object made using the same type of PMMA sheet used above, glued to a base consisting of a tile covered with quick-setting cement mortar. The evident non-uniformity in the thickness of the cement mortar revealed few points of actual contact with the PMMA slab. Furthermore, the bonding of the plate to the mortar was only partial, and in fact this circumstance was measured. The data were then processed using the contour map technique and the CTT procedure, with a fusion of data. In this case the recognition of the zones is less evident, also because the measured mesh is much more complex, closer to measuring a real surface full of defects. Using this type of test object it is possible to highlight with certainty the points of effective intimate contact with the PMMA plate. In this type of test object it is not possible to define in advance the maximum dimensions of the delamination and not even the dimensions of the cavities that are artificially created. In fact, it represents the exact opposite case to the one previously examined, and also the most difficult to interpret even if it is sometimes closer to reality.
The measurements performed on the ceramic tiles in
Figure 11 allowed us to establish the limits within which the audio measure can be considered reliable. As mentioned, these limitations are mainly due to the hardware used and can be increased by improving the specifications of the used components at the expense of their cost. The tiles in
Figure 11, although made by hand, are quite faithful in the average dimensions measured, so they represent an important yardstick for establishing the conditions of use. On the other hand, the use of impact-time data permits to overcome these limitations, and these two types of measurement can be integrated to obtain the real state of detachments of the object, as it was demonstrated in
Figure 12.
Finally, in
Figure 10 we show a measurement made on a sample of real mosaic (flooring of Roman origin, coming from the archaeological area of Tivoli, Roma) measuring 20 × 20 cm. This mosaic comes from a restoration carried out in the 1970s, and applied using cementitious material to a tile used as a base. Over the years, unfortunately, the upper left corner has undergone a partial detachment from the base. In this case the detachment is evident and the measurement carried out was intended to confirm the naked eye analysis. The discovery of a further detached and invisible area was of great impact to the experts to whom the verification of the measure was subjected. The restorer, using the classic method of “knocking” carried out with the knuckles of the hand, confirmed the presence of the defect but obviously without the precision of the method described so far. The presence of isolated points in the analysis of the detachments cannot be confirmed by the restorer’s verification, not only because they are too small to be appreciated with the classic method of knocking, but they could also be false positives. In our experience, only homogeneous areas of defects can be considered as real defects, while nothing can be said about isolated points, which could also be due to measurement errors.
The repeatability measurements and the calculation of the maximum error in the measurement obviously do not exhaust the considerations that could be made on the calculation of the system performance. A wider series of measurements on additional samples, both real and laboratory, is needed to accurately establish the correctness of the measurement. In this phase of the development of the system, we believe that a qualitative analysis of the situation relating to surface defects is sufficient. One of the arguments that will certainly be developed in the next works on the subject will be to define more precisely the errors of the system and also to provide a sort of measurement of both the delaminated thickness or the volume of the cavities that are highlighted by the measurements. This procedure qualitatively maps the surface of the object, showing the existence and the position of detachments, and highlighting defects of conservation of constituent materials. By means of the scanning process and analysis described so far, it is possible to obtain a qualitative analysis of the conservation conditions of the artifact. This representation can be also considered as the “acoustic signature” of the in situ layers of covering at the time of the analysis. The formerly described method allows the measurement to be repeated in an objective way, monitoring variations of conservative conditions over time. It also allows maintenance or intervention programs to proceed through periodic controls. The output data and graphics documentation can be compared, identifying relevant factors of deterioration, bringing a concrete contribution to the diagnosis and condition control of architectonical coverings in ancient structures.
5. Conclusions
The richness and diversity of cultural and landscape heritage, profuse in archaeological and monumental areas, in cities with art, in museums and similar institutions, public and private, and in buildings of worship, are among the phenomena that most characterize Italian identity. The high density and relevance of the Italian cultural heritage combined with the demand for the protection of cultural heritage, require continuous technological research in the fields of conservation, including preventive, restoration and maintenance, which are fundamental for the national economy. Heritage, therefore, becomes an important driving force for the development of creativity, incorporated in new technologies and in research and economic organizations for cultural heritage. The authors of this paper have as their objective the search for a methodology applied to the protection of cultural heritage and, therefore, a product that is a consequence of it, in other words a tool that can fill an existing gap in the sector of interest mentioned above. Without prejudice to the excellence of the large laboratories and large research infrastructures engaged in the analysis and monitoring of the state of conservation of the artistic assets of primary importance, often the sector of less valued artistic assets (compared only to the most well-known and visited ones) does not enjoy the same economic resources and the same tools that are the prerogative of the most popular assets. On the other hand, it could not be otherwise, given the vastness of the heritage and the impossibility, sometimes, to perform tests and diagnoses in the laboratory or to transport expensive and fragile equipment in situ, together with the prohibitive costs that this type of analysis usually entails.
The method illustrated in this paper, based on acoustic-vibrational techniques, aims to make a contribution to the conservation of in situ architectonical structures and to the scientific professional practice of conservators. In other words, it is a valid tool to assess deterioration conditions, for monitoring a stabilization intervention and designing a maintenance program. The developed system tries to fill a gap in the equipment sector related to this type of in situ analysis, in such a way as to support the restorer’s experience, confirming or correcting the subjective feeling that everyone has with respect to the conventionally measured defect. The project intends to be of help to operators in the sector of protection of cultural heritage and to public and private administrations that intend to rely on the control of the conditions of the works of art in order to prevent damage and monitor and maintain them, thus concentrating resources and maximizing the potential of the cultural heritage of which they are custodians.
