Abstract
Digital radiography (DR) is a mature technology and has been broadly used in medical diagnosis. Currently, it’s also used for fruit quality inspection in the market. This purpose of the study is to conduct non-destructive experiments for visual comparisons of digital radiography images, further construct visualized grayscale image analysis technology, and analyze the changes in lemon quality and ripening using quantitative statistical methods. The materials used for the experiments were three lemons of different ripening. A general medical X-ray DR system for was used in this study for 2D digital radiography. The medical X-ray DR images were created based on the Digital Imaging and Communications in Medicine (DICOM) standard. Photometric interpretation of monochrome was applied to create multi-layered grayscale images. Then quantitative analyses and comparisons were performed with image matrix structures and grayscale pixel values in the tissues using visualization techniques and statistical methods. After layer segmentation on the radiological images, the correlations between the lemon structures and tissue changes were assessed by using the Kruskal–Wallis test. The results showed that the p values for lemon, fiber, and pulp were all under 0.05, while the peel layer did not exhibit significant change. The pulp layer is the best region for statistical analyses to determine the lemon ripening. In conclusion, this study can provide a solid reference for future quality classification in the agricultural market. The research findings can be referenced for developing computing techniques applied to agricultural inspection, expanding the scope of application of the medical DR technology.
1. Introduction
The traditional way to determine the qualities of fruit is subject to measurement using a penetrometer or the farmer’s subjective experience on the flipping sounds caused by finger tapping on fruits. Fruits are classified into solid-sound fruits, hollow-sound fruits, and bad fruits. This is how people identify and discard defective products. This manual non-destructive inspection method for selecting fruit is manually intensive, and only those with significant experience able to accurately determine fruit quality. The classification accuracy of this method varies according to personal psychological states.
Scientific non- destructive inspection techniques for selecting cultural products include ultrasound, magnetic resonance imaging, X-ray, and near infrared spectroscopy (NIRS), which have been developed over decades [1]. Ultrasound is those sound waves or vibrations with frequencies higher than 20 kHz, the upper limit of the human hearing range. Ultrasound is particularly suited to identifying the hollowness and quality of fruits and vegetables [2]. Morrison et al. used the ultrasound technology to identify the hardness and water content of navel oranges. They found that the ultrasound signals were highly correlated to navel oranges’ hardness [3]. Ignat and Mizrach et al. exploit the feature of ultrasound in relation to attenuation coefficients of substances and discovered that there was a relationship between dry weights and the ripening of bell peppers and avocados [4,5].
Magnetic resonance imaging (MRI) uses a strong magnetic field, radio waves and a computer to produce detailed images of the nucleuses in the target and make it possible to gain a deep insight into the real damages inside the agricultural product [6,7]. Zhang et al. used the MRI technology to observe the ripening of tomatoes. They used MR images to observe significant changes in signal strength with tomatoes of different ripening. The ripening of tomatoes was identified based on the T2 relaxation and diffusion weighting MR images [8]. Joyce et al. applied the MRI technology to observe the ripening of mangos. The changes in MRI signal strength according to the ripening did not follow a regular pattern due to the differences in fruit peels. Thus, the choices of the regions of interest (ROIs) on the MR images were essential [9]. Zhang et al. adopted partial least squares (PLS) to analyze pomegranate MR images to retrieve information on the quality of the collected pomegranates using a non-destructive inspection method such as brix, acidity, and pH scale [10].
The wavelength range of NIRS is between 780 nm and 2500 nm. NIRS can be used to identify the characteristic substance in the target object based on the property that the energy levels of molecules and atoms of the agricultural product are different and may lead to different absorption rates due to different wavelengths. Then, combined with the characteristic spectrum database of the known substance, the composition and structure of each point can be obtained. Most functional groups within molecules, such as C-H, O-H, and N-H, of most substances have fixed vibrational absorption spectra within this range. The NIRS inspection technology for agricultural products utilizes the absorption and transform of spectrum energy to perform qualitative and quantitative analyses on the compositions of agricultural products. Currently, many efforts have been done on the applications of this technology on agricultural products such as apples, cherries, bananas, grapes, peppers, and paddy rice [11,12,13,14,15,16,17,18,19].
Since the discovery of X-rays in 1895 by Germany physicist Wilhelm Corad Röntgen, photostimulable substances have been used to transform invisible light energy into visible light energy with the ionizing radiation energy produced from the three basic exposure controlling factors, kV, mA, and s. Different linear attenuation coefficients of substances and different absorption intensities of ionizing radiation can be reflected through film imaging [20].
With the advance of technology, the development of thin-film transistor (TFT) array technology, and the application of flat panel detectors (FPDs), high-resolution X-ray imaging has been quite mature [21,22]. Multilayered monochrome grayscale images can be created based on the DICOM (Digital Imaging and Communications in Medicine) standard [23,24], and X-ray image interpretation has been developed from intuitive interpretation to statistical interpretation based on grayscale values [25]. Monochrome is black and white. Tones of a grayscale are based on its bit depth. DICOM grayscale standard is the basis for radiography analyses. The exposure signals from the linear attenuation of the X-ray tube voltage and the absorber’s density are received by the flat panel detector, which then produces signals in the form of images. If the outputs are 8-bit grayscale images, the signals are transformed into 28 = 256 monochrome grayscale levels according to their intensities. The images are composed of pixels of values ranged from 0 to 255. The pixel value for pure black is 0. Colors closer to white have higher grayscale pixel values. The grayscale pixel value of pure white is 255. There are systems using bit depths higher than 256 for signal sampling and display, producing 2D array radiographic grayscale images of the target object [26,27]. Grayscale values corresponding to signal intensities are put in arrays to create grayscale images [28].
Without destroying fruits, the X-ray radiography technology can display density differences inside fruits using grayscale levels to show detailed density changes caused by insect pests, and thus identify healthy fruits and fruits with pest damages and classify them. Densities may vary with water content in fruits, hard tissues of kernels, holes caused by insect pests, hollowness, and corruption, etc. Different densities are represented by different grayscale levels [29,30].
Currently, radiography has been applied to classification based on quality and disease detection for citrus fruits. Besides citrus fruits, X-ray radiography is extensively used for the sorting of mature lettuce heads [31], and the assessment of the ripening of mangoes [32], and tomatoes [33] based on tomography. Surface defects of fruits are often detected using color-scale analysis and radiography with appearance images of the fruits [34]. Moreover, radiography is also used in fruit quarantine. Fluoroscopy images are captured and analyzed based on color scales to mark the problematic areas [35,36]. However, hyperspectral imaging and radiography can only be used to perform qualitative analyses for surfaces of citrus fruits. Internal ripening of citrus fruits cannot be analyzed using these methods [36,37]. This study adopted radiography for non-destructive grayscale X-ray imaging for lemons and then performed quantitative quality analyses and comparisons based on the changes in structures and tissues using data visualization and statistical analyses, aiming to provide scientific-technical references and to expand the scope of applications of radiography.
2. Materials and Methods
2.1. Equipment
The X-ray system used in this study includes the medical diagnostic X-ray system Hitachi PHF-15XH2 (Hitachi Medical Corporation, Tokyo, Japan) the digital radiography system (Rayence Inc., Fort Lee, NJ, USA), and the Xmaru View V1 Ver. 2.0 software used by the Department of Medical Imaging and Radiological Technology, Yanpei University of Medical Technology. The system model is 1717SCC CsI (Cesium Iodide Scintillation) Tethered, with the following specs: 17 × 17 inch flat panel detector, sensor type: Amorphous Silicon with TFT, pixel matrix: 3328 × 3328, pixel pitch: 127 μm, A/D conversion: 14/16 bit, resolution: Max. 3.5 lp/mm.
The scientific name of the lemon used in this study is citrus limon, which is a fruit of warm climates of the Rutaceae family and the citrus genus [38]. The fruit is composed of two major parts, the peel and the pulp. The peel is composed of the exocarp and the mesocarp, which is a white layer. The pulp is made of ovarian locules, which are filled with juice vesicles. The pulp is the edible part of the fruit. Citrus limon is a crude fruit [39,40]. The materials used in the experiments were three lemons of similar sizes, but different ripening (fresh, mature and overripe) selected by professional farmers with 20 years of experience. The lemons harvested from Eureka lemons grown in Taiwan were imaged by a vertical x-ray radiographic system with exposure conditions of 53 kVp, 160 mA, and 63 ms. Lemons were imaged in a lying horizontally position and a standing position, respectively. Two grayscale images of the median plane and axial plane of the three lemons with different ripening levels were obtained, and then the images were visualized and processing for statistical analysis.
2.2. Data Processing and Visualization
Figure 1 shows the process of data visualization. After radiographic imaging of the lemons, the monochrome grayscale radiographic images based on the DICOM format were generated for photometric interpretation of the lemons. The radiographic images were then transformed to a 2D matrix that contains the XY coordinate positions and grayscale value of each pixel using ImageJ software (National Institutes of Health and the Laboratory for Optical and Computational Instrumentation, University of Wisconsin, Madison, WI, USA). Then, the color scale conversion was conducted based on the XY positions and grayscale value of each pixel using Sigmaplot 12.5 software (Systat Software Inc., Chicago, IL, USA). Three layers of lemon peel (exocarp), fiber (mesocarp) and pulp (endocarp) can be clearly distinguished and visualized from the colored scale image. In addition, we employed multi-level Otsu thresholding to separate peel, fiber, and pulp regions. The outputted XY positions and grayscale value of each layered pixel group can be obtained for stratification image visualization. Finally, the statistical analysis of the grouped grayscale data was performed using Kruskal–Wallis test to evaluate the classification results of lemon qualities. The null hypothesis was that the average pixel values of the layer between lemons were the same, and the significance level α was set as 0.05.
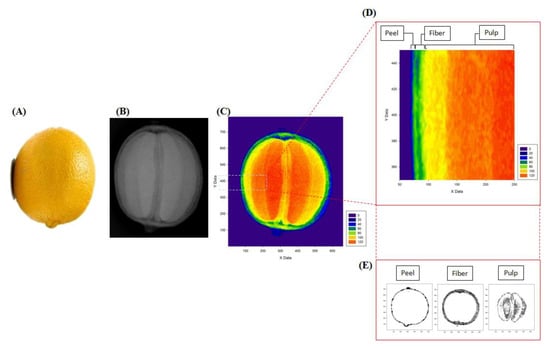
Figure 1.
The process of data visualization and statistical analyses. (A) Real lemons; (B) X-ray radiographic grayscale images with Digital Imaging and Communications in Medicine (DICOM) format; (C) a chromatographic image showing different tissue structures of the lemons; (D) a zoomed-in image showing the three solid layers of tissue structures of the lemons, namely peel, fiber, and pulp; (E) visualized images of the stratification analysis of the grayscale data.
3. Results
Through DR, the X-ray radiographic DICOM grayscale images of the 3 lemons were obtained. After applying the quantitative comparison methods, fresh, mature, and overripe lemons were identified, as shown in Figure 2. Different X-ray intensities and different densities of the absorbers led to different signals. The low-density substances exhibited low absorption of ionizing radiation, meaning the ionizing radiation direction attenuation coefficients of the substances were also low. Thus, the exposure effect of the FPD to ionizing radiation was high, leading to low-signal (dark) images. On the other hand, the high-density substances exhibited high absorption of ionizing radiation, leading to high-signal (bright) images. Figure 2 shows the median-plane images (A) and the axial-plane images (B) of the lemons. (1), (2), and (3) represent different ripening of the lemons. These images are DICOM grayscale images of the (1) fresh, (2) mature, and (3) overripe lemons. According to the results, the images of the overripe lemon were low-signal (dark) images, while those of the fresh and mature lemons were high-signal (bright) images. The visual differences could be identified. However, it remains difficult to distinguish the fresh lemon from the mature one based on visual differences.
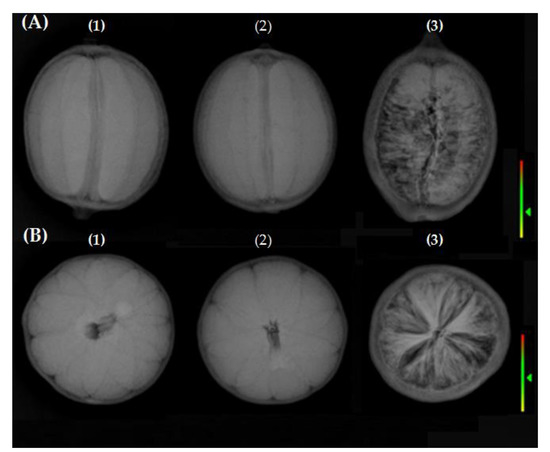
Figure 2.
X-ray radiographic images of (1) fresh, (2) mature, and (3) overripe lemons acquired at (A) median-plane and (B) axial-plane of the lemons.
The acquired median-plane and axial-plane images were divided into three regions using multi-thresholding image segmentation for visualization of stratification. Figure 3 shows the median-plane and axial-plane results, displayed according to the three layers of the structure, namely the peel layer, the fiber layer, and the pulp layer (endocarp). Then the Kruskal–Wallis test was performed with the visualized grayscale value data for quantitative statistical analyses.
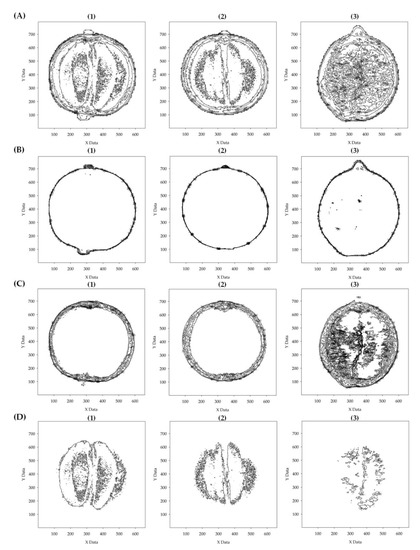
Figure 3.
Median-plane images of (1) fresh, (2) mature, and (3) overripe lemons to visualize the results of stratification analyses of the grayscale values, including (A) visualization diagrams of the lemon data, (B) visualization diagrams of the peel data, (C) visualization diagrams of the fiber data, and (D) visualization diagrams of the pulp data.
The median-plane DICOM grayscale image of the lemons were transformed into visualized grayscale pixel matrix images, as shown in Figure 3. The visualized results of further stratification analyses of the grayscale pixel matrixes based on the three layers, namely the peel layer, the fiber layer, and the pulp layer, are shown in Figure 3B–D. The grayscale value of each pixel of each layer was marked on the matrix coordinate to create visual images showing all data on the same layer, as shown in Figure 3A. It can be seen that the grayscale pixel matrix stratification results presented in Figure 3A–C (1), and (2) were not different visually, while Figure 3D (1), (2), and (3) exhibited visual differences.
The axial-plane DICOM grayscale images of the lemons were transformed into visualized grayscale pixel matrix images. Figure 4 shows the visualized results of further stratification analyses of the grayscale pixel matrixes. These results are corresponding to Figure 2B (1), (2), and (3). It can be seen that the grayscale pixel matrix stratification results presented in Figure 4B (1), (2), and (3) and Figure 4C (1) and (2) were not different visually, while Figure 4D (1), (2), and (3) exhibited visual differences. The grayscale value analyses and the visualized stratification analyses could only produce qualitative results based on partial visual differences. It was not possible to identify the freshness and ripening of the lemons. Thus, the grayscale matrixes were quantified and analyzed using quantified statistical analysis methods to perform scientific comparisons of the freshness and ripening of the lemons. The results are shown in Figure 5.
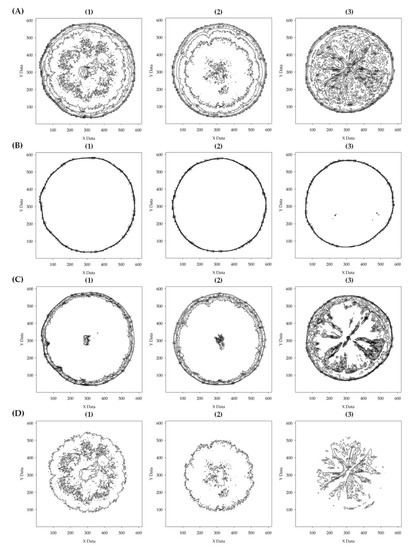
Figure 4.
Axial-plane images of (1) fresh, (2) mature, and (3) overripe lemons to visualize the results of stratification analyses of the grayscale values, including (A) visualization diagrams of the lemon data, (B) visualization diagrams of the peel data, (C) visualization diagrams of the fiber data, and (D) visualization diagrams of the pulp data.
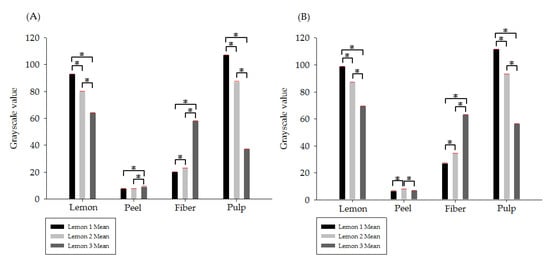
Figure 5.
(A,B) represent two different phases. The images show the quantified statistical analysis results of (1) fresh, (2) mature, and (3) overripe lemons based on the four-layer stratification of lemon, peel, fiber, and pulp. The p values less than 0.05 are summarized with one asterisk.
Figure 5 shows the quantified statistical analysis (Kruskal–Wallis test) results of the grayscale value data of (1) fresh, (2) mature, and (3) overripe lemons based on the four-layer stratification of lemon, peel, fiber, and pulp under two image planes. The corresponding grayscale pixel matrix images are Figure 3 and Figure 4. Then Kruskal–Wallis test was applied to the stratified grayscale pixel matrix data to obtain the (A) median-plane and (B) axial-plane images of three lemons of different freshness, showing the comparison results. The p-values for lemon, fiber, and pulp were all under 0.05, meaning there was a significant difference. Only the result for the peel layer was not significant. According to the results of the quantitative statistical analyses of the grayscale data, the densities for lemon and pulp decreased as the ripening increased, while that for fiber increased as the ripening increased. The results are in agreement with Hassan et al. [41]. Only the peel layer did not exhibit any significant change in density while some of the other statistical comparison results of this layer were meaningful (p < 0.05).
4. Discussion
The theory behind radiography is related to the linear attenuation coefficients of ionizing radiation through substances of uneven densities. The linear attenuation coefficients of X-ray through substances are proportioned to substance densities [42]. The imagining grayscale value of each pixel represents the image converted from the pixel element density [43]. In the fields of food and agriculture, the radiography technique is only used for quality control based on visual differences. For example, in the food industry, the technique based on visual differences of radiography has been widely used [44] and the thresholding of image segmentation technique has been applied with DR to explore the influences of quality loss in fruits caused by plant diseases and insect pests [45]. As for the application of radiography in this study, besides using visual differences for quality control, the DICOM standard was also used to produce monochrome grayscale images, combined with the quantified statistical methods, to analyze the quality and freshness of fruits [24,46]. The standard errors of the means of the grayscale values and the 95% CIs were all under one, meaning the X-ray output exposure quality and the linear attenuation of the substances of uneven densities were quite stable, proven by the accuracies of the results obtained using the quantified statistical method with the grayscale values, as shown in Table 1 [47].

Table 1.
The statistics of the X-ray imaging results of (1) fresh, (2) mature, and (3) overripe lemons based on the four-layer stratification of lemon, peel, fiber, and pulp after the linear attenuation of the lemon samples with fixed X-ray output exposure quality.
According to Table 1, the SEM results showed that the variations of the means of the grayscale values of the grayscale images were rather low, and the corresponding 95% CI results were consistent. The linear regression results are shown in Figure 6. The stratified analysis results of the (A) median-plane and (B) axial-plane images of the lemons showed that the coefficients of determination R2 of the lemon, fiber, and pulp layers were all higher than 0.8 [48]. The coefficients dropped with freshness of the lemon and pulp layers, and increased of the fiber layer. Only the peel layer did not exhibit any consistent trend. This finding is consistent with the study on the citrus growth [49], verifying the feasibility of applying the non-destructive radiography grayscale imaging and statistical methods on analyzing lemon ripening. The results indicate that the pulp layer is the best region for statistical analyses to determine the lemon ripening, as the averaged gray values at the layer have a significant change with the increase of lemon ripening.
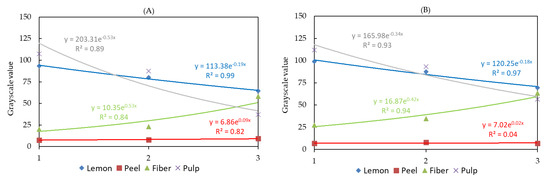
Figure 6.
The linear regression results of (1) fresh, (2) mature, and (3) overripe lemons based on the four-layer stratification of lemon, peel, fiber, and pulp with (A) median-plane imaging and (B) axial-plane imaging.
The primary limitation of the study lies in a limited number of lemons for evaluation, although the scope of the study is to evaluate the feasibility of lemon ripening evaluation based on the image quantification of X-ray radiological images. Our preliminary results are promising, and additionally, citruses have a similar structure to lemons. Further work should be made to collect more lemons and other citruses for advanced analysis and eventually establish an automatic system of determining the ripening of lemons based on the statistical analyses of the pulp region.
5. Conclusions
The ripening inspection methods currently used for agricultural products include hyperspectral images, color and thermal images, and X-ray imaging threshold color analysis. With these methods external defects and internal diseases and insect pests can be identified using visual qualitative inspections. This study applied the medical DR technology for non-destructive inspection, producing grayscale X-ray images, and then applied data visualization and statistical methods on the image matrixes and grayscale pixel values for quantitative analyses and comparisons, to identify the ripening changes of lemons and to verify the relationship between lemon structures and lemon tissue changes. The research findings can be used as references for development of artificial intelligence (AI) applications in agriculture for inspection, expanding the scope of applications of the medical DR technology.
Author Contributions
Conceptualization, W.-T.H. and W.-C.K.; methodology, W.-T.H.; validation, W.-T.H. and L.-H.L.; formal analysis, H.-H.L.; writing—original draft preparation, W.-T.H.; writing—review and editing, L.-H.L. and H.-H.L. All authors have read and agreed to the published version of the manuscript.
Funding
This research was funded by Ministry of Science and Technology of Taiwan (Project Nos. 109-2622-8-264-001-TB1).
Institutional Review Board Statement
Not applicable.
Informed Consent Statement
Not applicable.
Data Availability Statement
No new data were created or analyzed in this study. Data sharing is not applicable to this article.
Acknowledgments
We would like to thank the Ministry of Science and Technology of Taiwan/Hitachi Medical Corporation/Promed Instrument Co., Ltd., and Taipei City for their assistance.
Conflicts of Interest
The authors declare no conflict of interest.
References
- Hussain, A.; Pu, H.; Sun, D.W. Innovative nondestructive imaging techniques for ripening and maturity of fruits–a review of recent applications. Trends Food Sci. Technol. 2018, 72, 144–152. [Google Scholar] [CrossRef]
- Firouz, M.S.; Farahmandi, A.; Hosseinpour, S. Recent advances in ultrasound application as a novel technique in analysis, processing and quality control of fruits, juices and dairy products industries: A review. Ultrason. Sonochemistry 2019, 57, 73–88. [Google Scholar] [CrossRef]
- Morrison, D.S.; Abeyratne, U.R. Ultrasonic technique for non-destructive quality evaluation of oranges. J. Food Eng. 2014, 141, 107–112. [Google Scholar] [CrossRef]
- Ignat, T.; Mizrach, A.; Schmilovitch, Z.E.; Felföldi, J. Bell pepper maturity determination by ultrasonic techniques. Prog. Agric. Eng. Sci. 2010, 6, 17–34. [Google Scholar] [CrossRef]
- Mizrach, A.; Flitsanov, U.; El-Batsri, R.; Degani, C. Determination of avocado maturity by ultrasonic attenuation measurements. Sci. Hortic. 1999, 80, 173–180. [Google Scholar] [CrossRef]
- Srivastava, R.K.; Talluri, S.; Beebi, S.K.; Kumar, B.R. Magnetic resonance imaging for quality evaluation of fruits: A review. Food Anal. Methods 2018, 11, 2943–2960. [Google Scholar] [CrossRef]
- Patel, K.K.; Khan, M.A.; Kar, A. Recent development in applications of MRI techniques for foods and agricultural produce-an overview. J. Food Sci. Technol. 2015, 52, 1–26. [Google Scholar] [CrossRef]
- Zhang, L.; McCarthy, M.J. Measurement and evaluation of tomato maturity using magnetic resonance imaging. Postharvest Biol. Technol. 2012, 67, 37–43. [Google Scholar] [CrossRef]
- Joyce, D.C.; Hockings, P.D.; Mazucco, R.A.; Shorter, A.J. 1H-Nuclear magnetic resonance imaging of ripening ‘Kensington Pride’ mango fruit. Funct. Plant Biol. 2002, 29, 873–879. [Google Scholar] [CrossRef]
- Zhang, L.; McCarthy, M.J. Assessment of pomegranate postharvest quality using nuclear magnetic resonance. Postharvest Biol. Technol. 2013, 77, 59–66. [Google Scholar] [CrossRef]
- Yan-de, L.; Yi-bin, Y.; Xiaping, F.; Huishan, L. Experiments on Predicting Sugar Content in Apples by FT-NIR Technique. J. Food. Eng. 2007, 80, 986–989. [Google Scholar]
- Fan, G.; Zha, J.; Du, R.; Gao, L. Determination of Soluble Solids and firmness of Apples by Vis/NIR Transmittance. J. Food. Eng. 2009, 93, 416–420. [Google Scholar] [CrossRef]
- Carlini, P.; Massantini, R.; Mencarelli, F. Vis-NIR Measurement of Soluble Solids in Cherry and Apricot by PLS Regression and Wavelength Selection. J. Agric. Food Chem. 2000, 48, 5236–5242. [Google Scholar] [CrossRef]
- Clark, C.J.; McGlone, V.A.; Requejo, C.; White, A.; Woolf, A.B. Dry Matter Determination in “Hass” Avocado by NIR Spectroscopy. Postharvest Biol. Technol. 2003, 29, 300–307. [Google Scholar] [CrossRef]
- Herrera, J.; Guesalaga, A.; Agosin, E. Shortwave Near Infrared Spectroscopy for Non-Destructive Determination of Maturity of Wine Grapes. Meas. Sci. Technol. 2003, 14, 689–697. [Google Scholar] [CrossRef]
- Schulz, H.; Baranska, M.; Schutze, W.; Losing, G. Characterization of Peppercorn, Pepper Oil, and Pepper Oleoresin by Vibrational Spectroscopy Methods. J. Agric. Food Chem. 2005, 53, 3358–3363. [Google Scholar] [CrossRef]
- Lapchareonsuk, R.; Sirisomboon, P. Sensory Quality Evaluation of Rice Using Visible and Shortwave Near-Infrared Spectroscopy. Int. J. Food Prop. 2015, 18, 1128–1138. [Google Scholar] [CrossRef]
- Khodabakhshian, R.; Emadi, B.; Khojastehpour, M.; Golzarian, M.R.; Sazgarnia, A. Non-destructive evaluation of maturity and quality parameters of pomegranate fruit by visible/near infrared spectroscopy. Int. J. Food Prop. 2017, 20, 41–52. [Google Scholar] [CrossRef]
- Phuangsombut, K.; Phuangsombut, A.; Talabnark, A.; Terdwongworakul, A. Empirical reduction of rind effect on rind and flesh absorbance for evaluation of durian maturity using near infrared spectroscopy. Postharvest Biol. Technol. 2018, 142, 55–59. [Google Scholar] [CrossRef]
- Bontrager, K.L.; Lampignano, J. Textbook of Radiographic Positioning and Related Anatomy-E-Book. Elsevier Health Sciences. 2013. Available online: https://books.google.com.hk/books/about/Textbook_of_Radiographic_Positioning_and.html?id=FNP5PQAACAAJ&source=kp_book_description&redir_esc=y (accessed on 4 April 2021).
- Rowlands, J.A.; Yorkston, J. Flat panel detectors for digital radiography. Handb. Med Imaging 2000, 1, 223–328. [Google Scholar]
- Lança, L.; Silva, A. Digital radiography detectors–A technical overview: Part 2. Radiography 2009, 15, 134–138. [Google Scholar] [CrossRef]
- Pianykh, O.S. Digital Imaging and Communications in Medicine (DICOM): A Practical Introduction and Survival Guide; Springer Science & Business Media: Berlin, Germany, 2009. [Google Scholar]
- Bhagat, A.P.; Atique, M. Medical images: Formats, compression techniques and DICOM image retrieval a survey. In Proceedings of the International Conference on Devices, Circuits and Systems (ICDCS), Coimbatore, India, 15–16 March 2012. [Google Scholar]
- Ekstrom, M.P. Digital Image Processing Techniques; Academic Press: Cambridge, MA, USA, 2012; Volume 2. [Google Scholar]
- Parks, E.T.; Williamson, G.F. Digital radiography: An overview. J. Contemp. Dent. Pr. 2002, 3, 23–39. [Google Scholar] [CrossRef]
- Chou, R.Y. U.S. Patent No. 7,538,827; Patent and Trademark Office: Washington, DC, USA, 2009. [Google Scholar]
- Fu, C.; Meng, W.H.; Zhan, Y.F.; Zhu, Z.L.; Lau, F.C.; Chi, K.T.; Ma, H.F. An efficient and secure medical image protection scheme based on chaotic maps. Comput. Biol. Med. 2013, 43, 1000–1010. [Google Scholar] [CrossRef]
- AbdShaib, M.F.; Rahim, R.A.; Muji, S.Z.M.; Ahmad, A.A.A. Investigating Maturity State and Internal Properties of Fruits Using Non-Destructive Techniques-A Review. Telkomnika 2017, 15, 1574–1584. [Google Scholar]
- Diels, E.; van Dael, M.; Keresztes, J.; Vanmaercke, S.; Verboven, P.; Nicolai, B.; Smeets, B. Assessment of bruise volumes in apples using X-ray computed tomography. Postharvest Biol. Technol. 2017, 128, 24–32. [Google Scholar] [CrossRef]
- Lenker, D.H.; Adrian, P.A. Use of X-rays for selecting mature lettuce heads. Trans. Asae 1971, 14, 894–0898. [Google Scholar]
- Barcelon, E.G.; Tojo, S.; Watanabe, K. Nondestructive ripening assessment of mango using an X-ray computed tomography. Int. Agric. Eng. J. 2000, 9, 73–80. [Google Scholar]
- Brecht, J.K.; Shewfelt, R.L.; Garner, J.C.; Tollner, E.W. Using X-ray-computed tomography to nondestructively determine maturity of green tomatoes. HortScience 1991, 26, 45–47. [Google Scholar] [CrossRef]
- Hernández-Sánchez, N.; Moreda, G.P.; Herre-ro-Langreo, A.; Melado-Herreros, Á. Assessment of internal and external quality of fruits and vegetables. In Imaging Technologies and Data Processing for Food Engineers; Springer: Berlin, Germany, 2016; pp. 269–309. [Google Scholar]
- Iqbal, Z.; Khan, M.A.; Sharif, M.; Shah, J.H.; urRehman, M.H.; Javed, K. An automated detection and classification of citrus plant diseases using image processing techniques: A review. Comput. Electron. Agric. 2018, 153, 12–32. [Google Scholar] [CrossRef]
- Jiang, J.A.; Chang, H.Y.; Wu, K.H.; Ouyang, C.S.; Yang, M.M.; Yang, E.C.; Lin, T.T. An adaptive image segmentation algorithm for X-ray quarantine inspection of selected fruits. Comput. Electron. Agric. 2008, 60, 190–200. [Google Scholar] [CrossRef]
- Lorente, D.; Blasco, J.; Serrano, A.J.; Soria-Olivas, E.; Aleixos, N.; Gómez-Sanchis, J. Comparison of ROC feature selection method for the detection of decay in citrus fruit using hyperspectral images. Food Bioprocess Technol. 2013, 6, 3613–3619. [Google Scholar] [CrossRef]
- Morton, J.F. Fruits of Warm Climates; the University of Michigan: Ann Arbor, MI, USA, 1987. [Google Scholar]
- Iglesias, D.J.; Cercós, M.; Colmenero-Flores, J.M.; Naranjo, M.A.; Ríos, G.; Carrera, E.; Ruiz-Rivero, O.; Talon, M. Physiology of citrus fruiting. Braz. J. Plant Physiol. 2007, 19, 333–362. [Google Scholar] [CrossRef]
- Iglesias, D.J.; Cercos, M.; Colmenero-Flores, J.M.; Naranjo, M.A.; Rios, G.; Carrera, E.; Talon, M. Citrus: An Overview of Fruiting Physiology; DeMatta, F., Ed.; Nova Science: New York, NY, USA, 2010. [Google Scholar]
- Hassan, H.E.; El-Rahman, A.; Abdel-Hameed, U.A. Lemon Quality Evaluation during Maturity Using Color Analysis and Laser Technology. Misr J. Agric. Eng. 2015, 32, 771–788. [Google Scholar] [CrossRef]
- Phillips, D.H.; Lannutti, J.J. Measuring physical density with X-ray computed tomography. NdtE Int. 1997, 30, 339–350. [Google Scholar] [CrossRef]
- Sima, W.; Liu, S.; Yuan, T.; Luo, D.; Wu, P.; Zhu, B. Experimental study of the discharge area of soil breakdown under surge current using X-ray imaging technology. IEEE Trans. Ind. Appl. 2015, 51, 5343–5351. [Google Scholar] [CrossRef]
- Haff, R.P.; Toyofuku, N. X-ray detection of defects and contaminants in the food industry. Sens. Instrum. Food Qual. Saf. 2008, 2, 262–273. [Google Scholar] [CrossRef]
- Kim, S.; Schatzki, T. Detection of pinholes in almonds through x–ray imaging. Trans. Asae 2001, 44, 997. [Google Scholar]
- Mustra, M.; Delac, K.; Grgic, M. Overview of the DICOM standard. In Proceedings of the 2008 50th International Symposium ELMAR, Borik Zadar, Croatia, 10–12 September 2008. [Google Scholar]
- Streiner, D.L. Maintaining standards: Differences between the standard deviation and standard error, and when to use each. Can. J. Psychiatry 1996, 41, 498–502. [Google Scholar] [CrossRef]
- Draper, N.R.; Smith, H. Applied Regression Analysis; John Wiley & Sons: Hoboken, NJ, USA, 1998; Volume 326. [Google Scholar]
- Ladanyia, M.; Ladaniya, M. Citrus Fruit: Biology, Technology and Evaluation; Academic Press: Cambridge, MA, USA, 2010. [Google Scholar]
Publisher’s Note: MDPI stays neutral with regard to jurisdictional claims in published maps and institutional affiliations. |
© 2021 by the authors. Licensee MDPI, Basel, Switzerland. This article is an open access article distributed under the terms and conditions of the Creative Commons Attribution (CC BY) license (https://creativecommons.org/licenses/by/4.0/).