Abstract
In numerical control (NC)-based machining, NC data-based tool paths affect both quality and productivity. NC data are generated according to cutting conditions. However, NC data causing excessive cutting load can accelerate tool wear and even result in tool damage. In the opposite case, increasing machining time can affect productivity. NC data can influence surface quality from the perspective of cutting dynamics according to machine tool–material–tool combination. There have been a lot of studies on tool-path optimization. However, it is impossible to perfectly predict cutting dynamics such as tool wear, material non-uniformity, chatter, and spindle deformation. In fact, such prediction-based tool-path optimization can cause errors. Therefore, this study attempts to synchronize spindle load and NC data and uniformize the machining load through the analysis of stored data using digital-twin technology, which stores and manages machining history. Uniformizing machining load can reduce rapid traverse in the event of no load, feed rate in an overload area, and shock on a tool when the tool and material are met by adding approach feed. Analyzing results of the attempts proposed in this paper, the chatter was completely removed in the machining with D100 and D16, although some chatter remained in the machining with D25 and D16R3 tools. In addition, the processing time could be reduced from a minimum of 7% to a maximum of 50% after optimization.
1. Introduction
In general, in the event of a chatter, severe vibration is found for tools and workpieces, causing diverse damages such as quality deterioration, decrease in tool lifespan, and machine damage with a chatter mark on the surface. Therefore, there have been many attempts to avoid such self-excited vibration [1]. Previous studies have performed chatter detection based on diverse signals such as signal measurement using a tool dynamometer [2,3], and analysis of sound-pressure signals with a microphone [4]. In terms of a chatter detection method, analysis of signal frequency has been primarily used [5,6]. Many other methods have also been suggested, including amplitude detection using the standard deviation of sound-pressure signals [4]. However, there are limitations in applying a tool dynamometer with relatively high signal reliability. In terms of detection through analysis of sound-pressures signals, various issues such as operator/motor noise can occur. To check a chatter frequency range through frequency analysis, a modal analysis must be performed in advance, using related techniques such as an impact hammer. For this, information on changes in machining environments (e.g., materials, tools, cutting conditions, acceleration/deceleration, supplementary axis) is necessary [1,7]. Therefore, these methods have some difficulties in actual application. Recently, a cutting force-based optimization software has been used for optimization [8,9]. In fact, machining efficiency and accuracy have been considerably improved [10,11,12,13,14]. However, this method cannot perfectly predict cutting dynamics such as tool wear, material non-uniformity, chatter vibration, and spindle deformation during machining. In particular, effects are minor in mass-production or automotive parts in which products with the same shape are being processed consecutively.
2. Related Works
2.1. Cutting Condition and Machining Quality
In cutting, materials are removed in a chip form by the relative motion of tools and materials. The feed trajectory of a tool has an influence on the machining shape. Cutting conditions also affect machining quality. In addition to such tool trajectory, physical values such as feed speed, revolutions per minute (RPM), and tool–material engagement are decided by an operator’s experiences and know-how known to have an influence on machining quality and productivity. Changes in material shapes can occur during machining. Such changes can be predicted through cutting simulation (3D cutting simulation, virtual manufacturing). Instant physical values during machining can be calculated by analyzing the tool–material engagement.
The material removal rate (MRR) per unit hour affects tools and equipment (spindle, especially) The tool load can be measured with a feed per tooth. In addition, power and torque used in machining along with the specific cutting resistance of materials can be calculated by analyzing on geometric tool–material engagement. As shown in Figure 1, the MRR can be calculated by analyzing the tool–material engagement. In addition, torque and power can be calculated with Equations (1) and (2) according to the non-cutting coefficient of the material. However, the geometric analysis method ‘MRR’ does not reflect cutting dynamics during machining, such as tool wear and chatter. In particular, it is unable to calculate changes in cutting force by chip thickness.
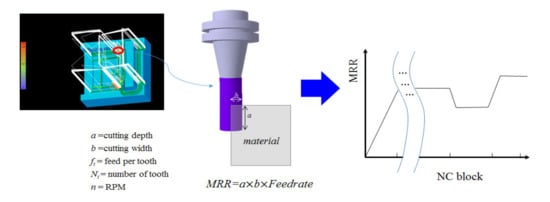
Figure 1.
Material removal rate (MRR)-related equation.
In Equation (1), ‘’ and ‘’ refer to torque required for cutting and tooth number, respectively; ‘’ and ‘’ refer to tool radius and tangential cutting force by the tool blade, respectively; ‘’, ‘’ and ‘’ represent the coefficient of the material, cutting width, and feed per tooth/round, respectively; refers to tool blade. In Equation (2), ‘’ and ‘’ refer to the power required for cutting and torque, respectively, and means spindle speed (RPM).
2.2. Cutting Dynamics
With the recent development of visualization technologies along with the growth of computer-aided engineering (CAE) and finite element method (FEM), 3D simulation machining has been enabled. In addition, there have been a lot of studies on the prediction and quantification of machining processes (refer to CAE and FEM-related papers) [15,16,17]. These days, many studies on cutting reflecting dynamic aspects have been performed. In addition, there have been studies on machining methods that reflect cutting dynamics and machining conditions known to change in real-time according to geometric interpretation-based static analysis [18]. The vibration occurring during machining can accelerate tool wear and even cause tool breakage and material wasting.
Figure 2 shows surface changes between the previous and current tool teeth. When the phase is matched, stable machining is observed. When the phase is shifted, in contrast, unstable regenerative chatter is found, as shown in Figure 3.
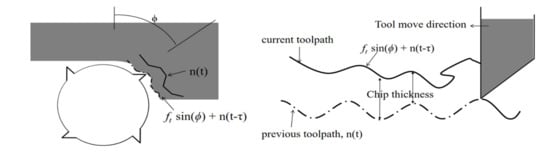
Figure 2.
Changes in chip thickness by continuous cutting teeth. Figure 2 has been modified from a figure of reference [1].
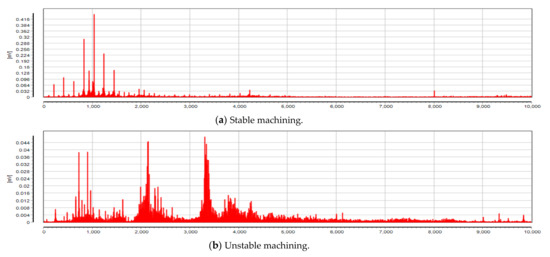
Figure 3.
Fast Fourier transform (FFT) analysis of acceleration sensor data. This figure was directly captured from the result screen of a manufacturing digital twin for dedicated equipment (MDT4DE) software. In this figure, comma is a notation to separate thousands. It does not mean a decimal point.
To eliminate the occurrence of chatter, during machining, cutting conditions are set using Equation (3) [1]. Equation (3) is characteristic equation for calculating stable RPM corresponding to cutting depth [3]. If a certain cutting thickness is maintained by matching natural frequency with spindle RPM through machine tools and other tools, a certain level of cutting force can be kept. Consequently, it is able to acquire uniform machining quality. However, cutting dynamics can change depending on complicated factors such as tool wear, temperature, and tool–material engagement. A chatter can shorten the life of the tool and cause material wasting. If the chatter is serious, it can even destroy the equipment.
2.3. Chatter Diagnosis
In three-axis machining using computerized numerical control (CNC) machine tools, it is difficult to diagnose conditions of tools and materials. A lubricating oil used to reduce friction between tools and materials can also make it difficult to observe machining conditions intuitively. It is also very difficult to monitor such conditions that can instantly change. However, in terms of cutting force by tool rotation, a certain pattern is repeated, as shown in Figure 4. Cutting force differs depending on the relative tool–material engagement. If a certain engagement is kept, the cutting force distribution illustrated in Figure 4 can be obtained, creating a certain tooth-path frequency Equation (4). In Equation (4), refers to the number of tool teeth.
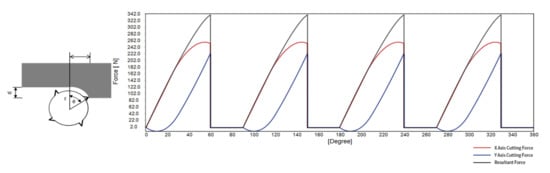
Figure 4.
Cutting force. Red and blue lines indicate cutting power on x and y axes, respectively. The black line indicates the resultant power. This figure is drawn by developing a program that expresses related equations.
Therefore, machining vibration frequency can be determined through FFT analysis using data from acceleration sensors. Theoretically, the frequency stated in Equation (4) can be obtained as a tool-path frequency. As shown in Figure 2, phase differences between previous and current tool teeth bring changes in cutting force, generating frequencies other than the tool-path frequency in Figure 3.
The frequency greater than the amplitude of the harmonic frequency is decided by the chatter through the FFT analysis. Once chatter occurs, the spindle speed can be adjusted, which is defined as:
In Equation (5), and refers to chatter frequency and the number of teeth () respectively.
2.4. Digital Twin
According to [19], a digital twin is defined as “an evolving digital profile of the historical and current behavior of a physical object or process that helps optimize business performance”. A digital twin can be estimated based on real-time data measurements accumulated on a large scale across multiple dimensions [20]. Based on such cumulative data, a digital profile that is best matched with reality is created, enabling physical responses such as changes in system performances, product design, and manufacturing process [20,21,22,23,24,25,26,27,28,29]. In Figure 5, four digital twin components and six different acts are defined. This study is structured to control optimized numerical control (NC)-machine manufacturing processes in real-time by installing diverse sensors in NC machine and analyzing the data collected from such sensors after synchronizing CNC data.
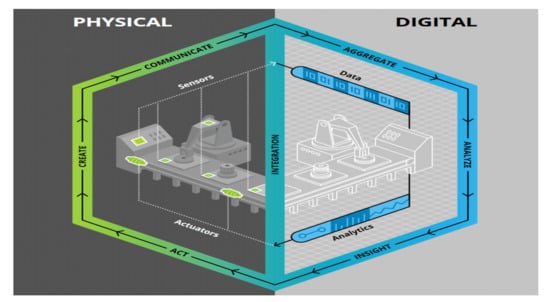
Figure 5.
Manufacturing-process digital twin model. This figure shows the concept of a digital twin in a previous study [19].
3. Design and Implementation
3.1. Manufacturing Digital Twin for Dedicated Equipment
A digital twin used in this study was a system adopted when developing MDT4DE (the Manufacturing Digital Twin for Dedicated Equipment). MDT4DE is a software framework for Digital Twin developers and users. It is applied to a servo press, an electric water pump (EWP) quality inspection system, and others for welding and plastic machining instead of general-purpose equipment such as CNC, machining center tool (MCT), and NC [30,31,32,33,34]. After collecting data from various equipment, they are filtered and integrated according to user needs. They are then are used for the improvement of quality or manufacturing processes through analysis logic. The advantage of MDT4DE is that it conforms to a standard such as MT-Connect and open platform communication unified architecture (OPC-UA). It can also normalize gathering data by collecting analog or raw digital data from old equipment in the field that does not support the standard. In other words, software design patterns that support an easy standardization of data from non-standard communication devices are advantages of MDT4DE. Such an advantage of MDT4DE can provide digital twin developers with software design patterns to support easy standardization of data from non-standard communication devices. Figure 6 shows the package diagram of the Manufacturing Digital Twin for Dedicated Equipment, which is comprised of CONFIG, HELPER, LOGGER, MODEL, IO, UI, DASHBOARD, ANALYZE and others. Specifically, the CONFIG package manages setup files while the HELPER package consists of a setup file management utility and others needed to implement programs. LOGGER manages logging data collected from the equipment. MODEL provides an interface to communicate with the database. The IO is needed as an interface for the manufacturing equipment on a shop floor through a protocol (e.g., OPC-UA, RS-232C, RS-485, CAN, Standard programmable logic controller (PLC), Non-Standard PLC, etc.). The UI is a user interface. DASHBOARD plays a gauge role, representing analysis data or their real-time changes. The SENSOR collects data from additionally installed sensors. ANALYZE conducts statistical analysis and support vector machine (SVM)-based analysis.
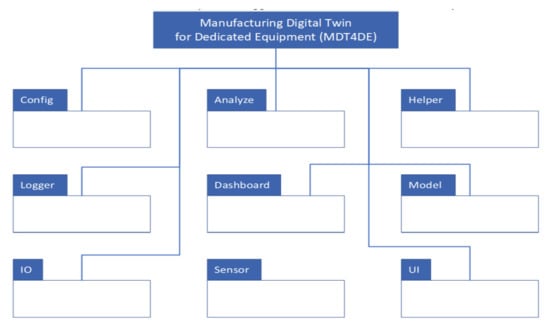
Figure 6.
A package diagram of the MDT4DE.
3.2. Sensor Data Synchronization
The CNC information includes tool coordinates by tool position and peripheral information (e.g., feed rate, spindle RPM, G code, etc.). However, due to the absence of additional information on machining status, it is hard to estimate tool wear (breakage) and chatter exactly. For the diagnosis of machining conditions, sensors should be selected collected data should be synchronized to CNC information. For the diagnosis of tool wear, a CNC load meter can be adopted. However, it is hard to diagnose overload or micro-load during machining using a face cutter or a small-size tool (3 or less in diameter). It is very difficult to diagnose a chatter with CNC information only. To check if there is any problem during machining, diagnosing current machining conditions by synchronizing sensor data is needed. Therefore, this study collected data through the SENSOR and IO packages of MDT4DE and stored them in a database through the model.
3.3. CNC Information and Acceleration Sensor
The CNC controller of the machine tool can access the memory from the outside through the MDT4DE. Figure 7 shows the internal control structure of the CNC [35]. In this study, the CNC memory is interfaced to monitor tool position and spindle speed (RPM) during machining. Among data monitored in real-time during machining, spindle RPM is used as a key parameter for chatter diagnosis in Equation (4). In terms of tool coordinates, whether there is a problem in machining can be diagnosed by synchronizing chatter location. Figure 8 shows the synchronization of acceleration sensor data through the MDT4E.
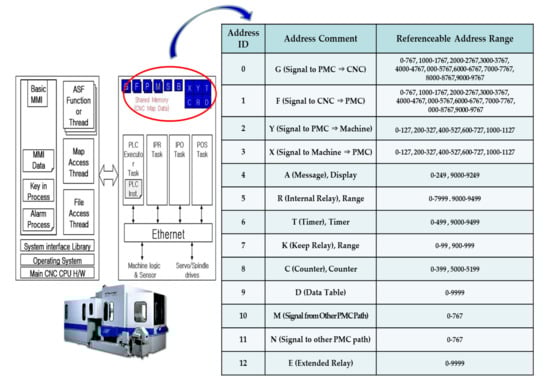
Figure 7.
CNC monitoring and FANUC CNC standards [35].
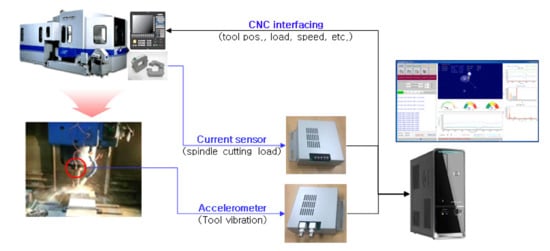
Figure 8.
Synchronization of acceleration sensor data through the MDT4E.
3.4. CNC Information and Current Sensor
A current sensor measures the electric current applied to a motor from the servo driver. In general, as the spindle rotates faster, the output of the spindle drive is increased. With measurements, data can be obtained by voltage (current) through the ADC using IO and SENSOR packages of the MDT4DE. Machining load and current sensor values are proportional to each other. Different values can be obtained under the same spindle RPM depending on the type of the material and tool conditions. When the same material is machined with the same tool, cutting force by the tool–material engagement increases (decreases) proportionally if it affects the current sensor values.
As shown in Figure 9, the current sensor values by the CNC tool position can be expressed with a machining load map according to the tool trajectory.
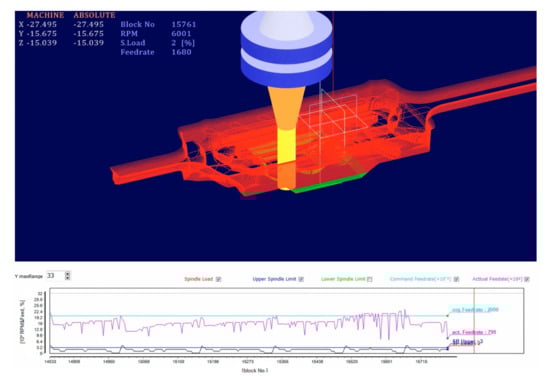
Figure 9.
Conversion of current sensor values by tool position. This figure was directly captured from the result screen of the MDT4DE.
3.5. Storage of Machining History File
Figure 10 shows the sensors needed for diagnosing machining conditions and synchronized figure of CNC information. It can extend records of synchronized CNC information and sensor data at a random point (t) to the consecutive machining time axis with Equation (6). Sensor data and CNC information at an arbitrary processing point is the processing status at that point, and the continuous synchronized data can become machining history. To store consecutively synchronized data, database and serialization are used through the streaming class provided by the MDT4DE model. Figure 11 shows a data schema needed to store the synchronization data. Machining history will record phenomena during machining. It can be used for diverse purposes such as detection of overload/chatter sections and diagnosis of tool wear through a review after machining. This study proposed a machining data (NC program) optimization method using such machining history. In Equation (6), ‘’, ‘’, and ‘’ refer to storage interval total number of records, and the ’’ processing history, respectively.
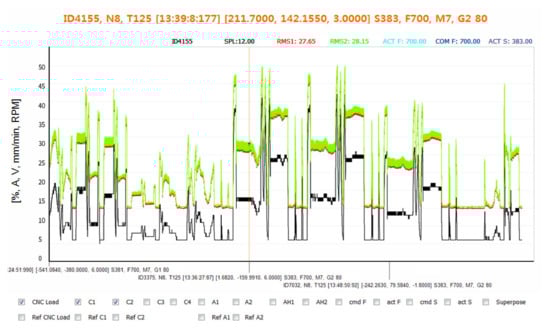
Figure 10.
Synchronized machining history of sensor data. This figure was directly captured from the results screen of the MDT4DE.
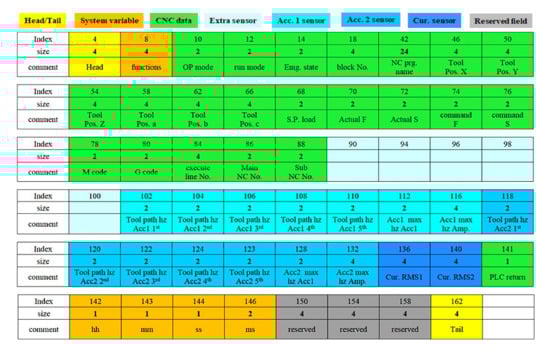
Figure 11.
Data schema for storage of synchronization data.
4. Machining History Analysis and Optimization
The machining data (NC program) refers to files on tool trajectory, considering cutting conditions, tool/machining path patterns, and others. They are comprised of codes that can be understood in CNC machine tools. In general, they include G-codes or automatic programmable tools (APTs). Some of them are prepared with a language specialized for machine tools. If this NC program is implemented in a CNC machine tool, equipment motions (e.g., tool transfer, spindle rotation, table transfer, etc.) and auxiliary features such as cutting oil and lamp are enabled. This kind of situation is a ‘machining status’. Attached sensors can measure the status of the servo motor in the spindle and feed axis and synchronizes it with CNC information through the MDT4DE.
This study proposed a method to uniformize machining load by adjusting feed rate and spindle RPM and eliminating chatter using a synchronized machining history under the assumption that tool and machining paths do not change.
4.1. Linear Interpolation Based on User-Input Maximum Load
Cutting conditions include cutting depth, cutting width, feed rate (F) and spindle RPM (S). The feed rate is calculated with feed per tooth () and RPM using the following equation:
In Equation (7), refers to the number of tool teeth. In terms of spindle RPM, the tool RPM in Equation (8) is decided according to the property values of materials. If the line speed at the tip of the tool which encounters a material exceeds the limit of the material, wear is rapidly accelerated. In contrast, a sufficient level of torque and power should be kept to remove the materials.
In Equation (9), ‘’ refers to the specific cutting resistance of a material by the unit area, while ‘’ represents a torque when the RPM is ‘’. If machining history is floated on the time domain, it can check tool position, machining load, and chatter existence, as shown in Figure 12. Changes in feed rates can affect machining load. In addition, adjusting spindle speed can remove chatter. In an overload section, the machining load should be reduced by decreasing the feed rates. In a no-load section, on the contrary, an increase in feed rates has no influence on the machining quality. In terms of chatter, a very short violation can be ignored. However, if it lasts ‘’ seconds or longer, the speed should be adjusted to chatter avoidance RPM.
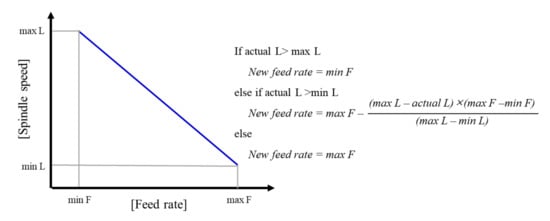
Figure 12.
Linear interpolation-based feed rate optimization.
First, for uniformization of the machining load, maximum and minimum load ranges should be set. In terms of machining load optimization at a random time (t) on the time domain, feed rates are adjusted by linear interpolation with an equation shown in Figure 12. For chatter removal, a new RPM is set by Equation (5). The new feed rates and RPM should meet Equations (7)–(9).
4.2. Machining History-Based Optimization Flowchart
The machining history-based optimization flow is shown in Figure 13. The first step of machining history-based optimization is to map machining history in the NC program. Depending on what line of the current NC program has been implemented to obtain the synchronized data, the adjusted feed rates and the spindle speed are added before/after the line. In terms of matters to be considered during optimization, if a consecutive non-load section is sufficiently long, transferring at the maximum feed rate is needed. The feed rate should be adjusted to an original/approach feed rate at the end of the non-load section. In an overload section, a linear interpolation is implemented to be included in the machining load range. In an instant overload section, such as an entry of material, applying an approach feed is needed.
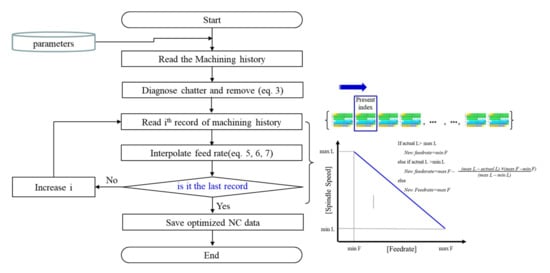
Figure 13.
Machining history data-based optimization flowchart.
To apply chatter avoidance RPM, it is necessary to adjust the RPM to the level that meets Equations (7)–(9) by reducing the feed rates to the minimum.
5. Experiments and Analysis
To verify the machining history data-based optimization method proposed in this study, aircraft parts in Figure 14 were tested. The target material was ‘AL7075’. End mills (D100, D25, D16, D16R3, D10) were used for shaping. In addition, a hole drill was adopted for machining the back of the material. In terms of a CNC machine tool, HYUNDAI WIA’s KV75DM was chosen. Table 1 shows the specifications and cutting conditions of each tool. The current sensor was a product of Seri2B Co. Ltd. Its model was ‘zen-U2-100Ab-245.’ The accelerometer was a product of PCB Co. Ltd. Its model was 607A11. Optimization was applied to an end mill specially designed for shaping. To diagnose machining load and chatter, current and acceleration sensors stated in Table 2 were used.
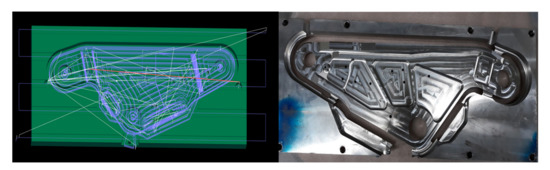
Figure 14.
Machining shape and tool path.

Table 1.
Specifications and cutting conditions of each tool.
Table 2.
Sensor types and specifications.
The optimization input is shown in Table 3, assuming that the CNC machine has sufficient torque (feed per tooth not considered). The chatter occurring during machining is described in Table 4. Chatter avoidance RPM was calculated using Equation (5). However, a single standard spindle speed was chosen according to diverse chatter frequencies. Figure 15, Figure 16, Figure 17 and Figure 18 show optimized feed rates by the CNC load meter. In these figures, red, blue, black lines indicate the original feed rate, the optimized feed rate, and the cutting load, respectively. As illustrated in these figures, feed rates were interpolated linearly depending on the machining load.
Table 3.
Optimized parameters.
Table 4.
Chatter frequency and avoidance RPM by tool.
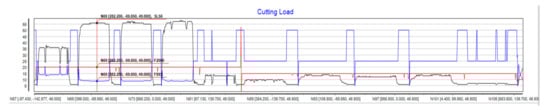
Figure 15.
Feed rates of D100 optimization results. This figure was directly captured from the result screen of the MDT4DE.
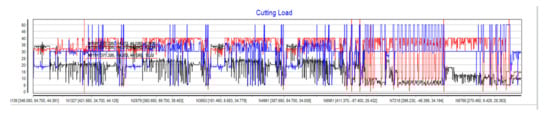
Figure 16.
Feed rates of D25 optimization results. This figure was directly captured from the result screen of the MDT4DE.
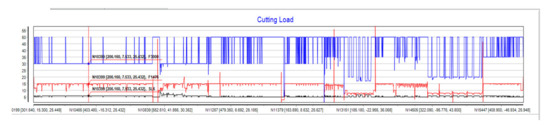
Figure 17.
Feed rate of D16 optimization results. This figure was directly captured from the result screen of the MDT4DE.
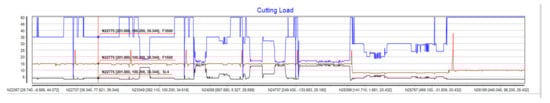
Figure 18.
Feed rate of D16R3.0 optimization results. This figure was directly captured from the result screen of the MDT4DE.
Figure 19, Figure 20, Figure 21 and Figure 22 show the machining load before/after optimization and feed rate changes. As shown in these figures, chatter was completely removed in D100 and D16 optimizations. When D25 or D16R3 was used, some chatters were found even after chatter removal. Table 4 confirms a decrease of up to 50% after optimization with machining time. Table 5 shows machining time before and after optimization.
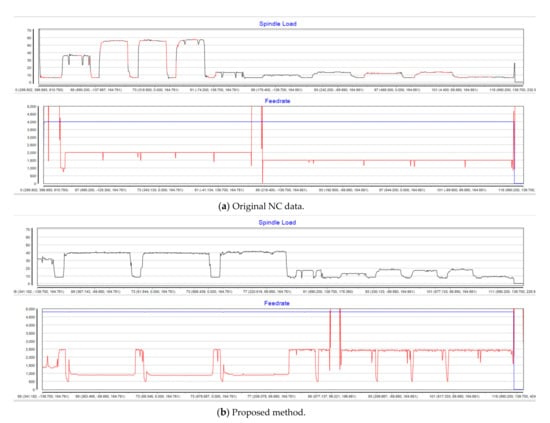
Figure 19.
Machining load and feed rate before and after D100 optimization. This figure was directly captured from the result screen of the MDT4DE. In this figure, comma is a notation to separate thousands. It does not mean a decimal point.
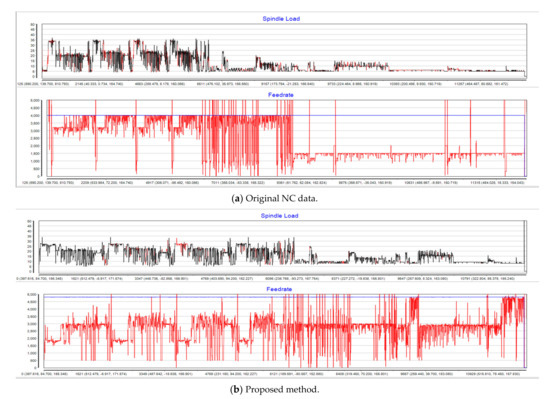
Figure 20.
Machining load and feed rate before and after D25 optimization This figure was directly captured from the result screen of the MDT4DE. In this figure, comma is a notation to separate thousands. It does not mean a decimal point.
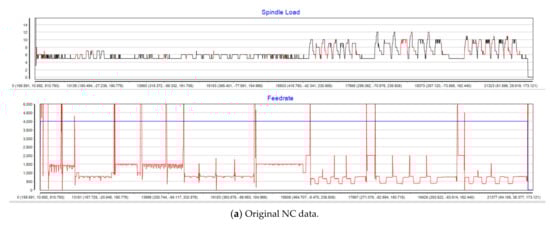
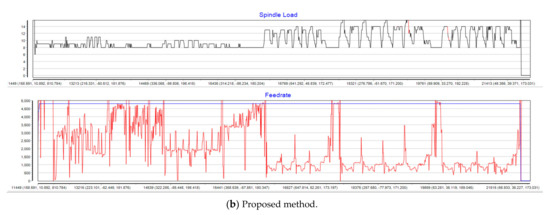
Figure 21.
Machining load and feed rate before and after D16R3.0 optimization. This figure was directly captured from the result screen of the MDT4DE. In this figure, comma is a notation to separate thousands. It does not mean a decimal point.
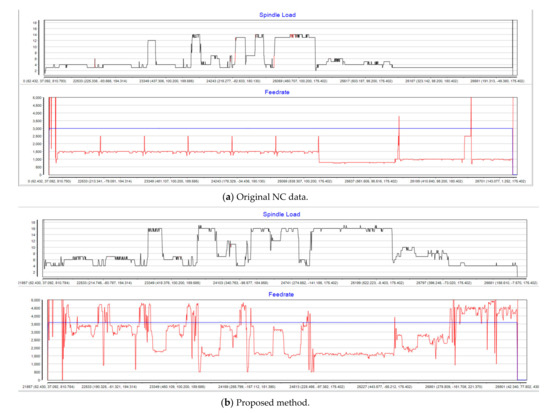
Figure 22.
Machining load and feed rate before and after D16 optimization. This figure was directly captured from the result screen of the MDT4DE. In this figure, comma is a notation to separate thousands. It does not mean a decimal point.
Table 5.
Matching time comparison between original NC and the proposed method.
6. Conclusions
In the case of repetitive mass production processing, such as in automobile parts, it is difficult to produce NC data that can guarantee quality while having an optimal production time. Although computer-aided design (CAD)/computer-aided manufacturing (CAM) software has evolved, NC codes are generated based on predictions. However, it is difficult to maintain optimized production conditions because chatter and tool wear conditions are different depending on the characteristics of equipment and tools. In particular, the spindle has a very flexible performance in the processing environment. Since the overload section, the no-load section, and the chatter occurrence section can be identified through the initial processing of the part, optimized NC code can be generated by storing and analyzing related data. This is called machining optimization. It is very difficult for an operator to intuitively modify NC codes in the field. The method proposed in this paper can perform NC code optimization based on the processing history using an MDT4DE. For reference, since the optimization of the cutting curve does not have linearity as shown in Equation (3), it cannot be optimized by accumulating experience.
Cutting is a process to remove materials in a chip form, using relative material-tool motions. The efficiency of the NC data that decides the tool transfer can be expressed with machining time. When machining time is shorter, NC data are more efficient. However, the quality of the machined surface must be met, considering the lifespan of tools. Chatter, machining quality and tool lifespan are closely related to each other. This study proposed a method to enhance the efficiency of NC machine by storing and analyzing machining data using MDT4DE.
The proposed method is applicable to machining or repetitive manufacturing of parts such as mass production. It was optimized using the machining load history. First, to remove chatter, the chatter avoidance RPM equation was applied. After creating an alternative for a new spindle speed, RPM was chosen considering the cutting speed of the material. In terms of feed speed, machining load was optimized, using linear interpolation under maximum-minim ranges in consideration of feed per tooth. When machined using optimized NC data, machining time increased in an overload section during D100 face milling. In contrast, the overall machining time was reduced by 7% by increasing the feed rates in a no-load section. In D25 rough cutting, the machining time decreased by more than 28%. In D16R3 and D16 intermediate cutting, the machining time was reduced by nearly 50% due to an increase in feed rate.
Author Contributions
Conceptualization, E.H. and N.Y.; Methodology, E.H.; Software, N.Y.; Validation, E.H. and N.Y.; Formal analysis, E.H.; Investigation, E.H. and N.Y.; Data curation, E.H. and N.Y.; Writing—original draft preparation, E.H. and N.Y.; Writing—review and editing, N.Y. All authors have read and agreed to the published version of the manuscript.
Funding
This research was supported by Software Convergence Cluster 2.0 funded by the Ministry of Science and ICT, Gyeongsangnam-do, and National IT Industry Promotion Agency.
Institutional Review Board Statement
Not applicable.
Informed Consent Statement
Not applicable.
Data Availability Statement
Not applicable.
Acknowledgments
The authors would like to thank the reviewers and editors for their comments and suggestions.
Conflicts of Interest
The authors have no conflicts of interest relevant to this study to disclose.
References
- Yusuf, A. Manufacturing Automation: Metal Cutting Mechanics, Machine Tool Vibration and CNC Design, 2nd ed.; Cambridge University Press: Cambridge, UK, 2012; pp. 119–139. [Google Scholar]
- Kim, Y.K.; Yoon, M.C.; Ha, M.K.; Sim, S.B. A Study on the Behaviors of Chatter in Milling Operation. J. Korean Soc. Manuf. Technol. 2002, 1, 123–132. [Google Scholar]
- Zhang, X.; Yu, T.; Wang, W. Chatter Stability of Micro end Milling by Considering Process, Nonlinearities and Process Damping. Int. J. Adv. Manuf. Technol. 2016, 87, 2785–2796. [Google Scholar]
- Yoon, M.C.; Chin, D.H. Time Series Modeling and Spectrum Analysis for Chatter Mode in Endmilling Dynamics. Int. J. Adv. Manuf. Technol. 2006, 20, 1125–1133. [Google Scholar] [CrossRef]
- Jo, M.H.; Kim, J.Y.; Lee, J.H.; Kim, J.S. Signal Acquisition for Effective Prediction of Chatter Vibration in Milling Processes. J. Korean Soc. Manuf. Technol. Eng. 2014, 23, 325–329. [Google Scholar]
- Shi, Y.; Mahr, F.; Wagner, U.; Uhlmann, E. Chatter Frequencies of Micromilling Processes: Influencing Factors and Online Detection via Piezoactuators. Int. J. Mach. Tools Manuf. 2012, 56, 10–16. [Google Scholar] [CrossRef]
- Jeong, N.S.; Yang, M.Y. Analytical Prediction of Chatter Vibration in Milling Process. J. Korean Soc. Mech. Eng. 2009, 33, 210–217. [Google Scholar] [CrossRef]
- VERICUT. Available online: https://www.cgtech.com/ (accessed on 21 March 2021).
- MACHPRO. Available online: https://www.malinc.com/products/machpro/ (accessed on 21 March 2021).
- Altintas, Y.; Kersting, P.; Biermann, D.; Budak, E.; Denkena, B.; Lazoglu, I. Virtual Process System for Part Machining Operations. Cirp Ann. Manuf. Technol. 2014, 63, 585–605. [Google Scholar] [CrossRef]
- Anwer, N.; Yang, Y.; Zhao, H.; Coma, O.; Paul, J. Reverse Engineering for NC Machining Simulation. In Proceedings of the IDMME 2010-Visaul Concept 2010, Bordeaux, France, 20–22 October 2010; pp. 1–8. [Google Scholar]
- Zhang, X.; Nassehi, A.; Newman, S.T. Feature Recognition from CNC Part Programs for Milling Operations. Int. J. Adv. Manuf. Technol. 2014, 70, 397–412. [Google Scholar] [CrossRef]
- Chui, H.; Guan, L.; Hua, Y.; Wang, X. Study on the Technology of Cutting Force Simulation for NC Machining Process Based on the Secondary Development of VERICUT. Modul. Mach. Tool Autom. Manuf. Tech. 2012, 5, 9–12. [Google Scholar]
- Gao, L.; Yang, Y.; Li, X. Research and Development of Optimization of NC Machining Parameters. Aeronaut. Manuf. Technol. 2010, 22, 48–51. [Google Scholar]
- Cus, F. The Inclusion of Geometrical Shape of the Cutter into the Optimization of the Milling Process. Int. J. Adv. Manuf. Technol. 2000, 16, 392–403. [Google Scholar]
- Dolinsek, S. Interrelation between Cutting Mechanics and Machinability Parameters. Drill. Austenitic Stainl. Steels Met. 2000, 54, 184–189. [Google Scholar]
- Vajde Horva, R.; Welzer Druzovec, T.; Rozman, I.; Sokovic, M. An Evaluation of Process Complexity. Stroj. Vestn. 2001, 47, 15–27. [Google Scholar]
- Altintas, Y.; Budak, E. Analytical Prediction of Stability Lobes in Milling. Ann. CIRP 1995, 44, 357–362. [Google Scholar] [CrossRef]
- Industry 4.0 and the Digital Twin. Available online: https://www2.deloitte.com/us/en/insights/focus/industry-4-0/digital-twin-technology-smart-factory.html (accessed on 5 April 2021).
- Agnusdei, G.P.; Elia, V.; Gnoni, M.G. A Classification Proposal of Digital Twin Applications in the Safety Domain. Comput. Ind. Eng. 2021, 107–137. [Google Scholar] [CrossRef]
- Tao, F.; Zhang, M. Digital Twin Shop-Floor: A New Shop-Floor Paradigm towards Smart Manufacturing. IEEE Access 2017, 5, 20418–20427. [Google Scholar] [CrossRef]
- Zhuang, C.; Liu, J.; Xiong, H. Digital Twin-based Smart Production Management and Control Framework for the Complex Product Assembly Shop-Floor. Int. J. Adv. Manuf. Technol. 2018, 96, 1149–1163. [Google Scholar] [CrossRef]
- Tao, F.; Qi, Q. Digital Twin and Big Data towards Smart Manufacturing and Industry 4.0: 360 Degree Comparison. IEEE Access 2018, 6, 3585–3593. [Google Scholar]
- Botkina, D.; Hedlind, M.; Olsson, B.; Henser, J.; Lundholm, T. Digital Twin of a Cutting Tool. Procedia CIRP 2018, 72, 215–218. [Google Scholar] [CrossRef]
- Tao, F.; Cheng, J.; Qi, Q.; Zhang, M.; Sui, F. Digital Twin-Driven Product Design, Manufacturing and Service with Big Data. Int. J. Adv. Manuf. Technol. 2018, 94, 3563–3576. [Google Scholar] [CrossRef]
- Kritzinber, W.; Karner, M.; Traar, G.; Henjes, J.; Sihn, W. Digital Twin in Manufacturing: A Categorical Literature Review and Classification. IFAC-Pap. 2018, 51, 1016–1022. [Google Scholar] [CrossRef]
- Tao., F.; Zhang, H.; Liu, A.; Nee, A.Y.C. Digital Twin in Industry: State-of-the-Art. IEEE Trans. Ind. Inform. 2019, 15, 2405–2415. [Google Scholar] [CrossRef]
- Pimenov, Y.; Bustillo, A.; Mikolajczyk, T. Artificial Intelligence for Automatic Prediction of Required Surface Roughness by Monitoring Wear on Face Mill Teeth. J. Intell. Manuf. 2018, 29, 1045–1061. [Google Scholar] [CrossRef]
- Bustillo, A.; Pimenov, Y.; Mia, M.; Kaplonek, W. Machine-learning for Automatic Prediction of Flatness Deviation Considering the Wear of the Face Mill Teeth. J. Intell. Manuf. 2021, 32, 895–912. [Google Scholar] [CrossRef]
- Kim, T.H.; Shin, G.S.; Hong, S.D.; Yoo, N.H. A Study on the Control System of Lower Ram Operation by the Upper Ram Position of Powder Molding Press. In Proceedings of the Korean Society of Manufacturing Process Engineers Spring Conference, Yeosu-si, Korea, 19–20 April 2018. [Google Scholar]
- Yoo, N.H. Design and Implementation of OPC-Based Intelligent Precision Servo Control Powder Forming Press System. J. Korean Inst. Electron. Commun. Sci. 2018, 13, 1243–1248. [Google Scholar]
- Yoo, N.H. A Heat Shock Simulation System for Testing Performance of EWP. J. Korean Inst. Electron. Commun. Sci. 2019, 14, 553–558. [Google Scholar]
- Gwon, D.H.; Lee, J.S.; Yoo, N.H. An Automotive Industry Vision Inspection System using Big Data Analytic System. In Proceedings of the Korea Institute of Information and Communication Engineering Spring Conference, Daejeon-si, Korea, 23–25 May 2019. [Google Scholar]
- Yoo, N.H. A Study of Leakage Inspection System for EWP. In Proceedings of the 2nd International Conference on Electronics and Electrical Engineering Technology, Penang, Malaysia, 25–27 September 2019. [Google Scholar]
- Kim, J.M.; Lee, C.S.; Heo, E.Y.; Moon, D.H.; Park, C.S. A Study on the Monitoring Method of Internal Barrel Temperature in Injection Molding Machine. In Proceedings of the Korean Society for Precision Engineering Spring Conference, Jeju-si, Korea, 29–31 May 2013; pp. 699–700. [Google Scholar]
Publisher’s Note: MDPI stays neutral with regard to jurisdictional claims in published maps and institutional affiliations. |
© 2021 by the authors. Licensee MDPI, Basel, Switzerland. This article is an open access article distributed under the terms and conditions of the Creative Commons Attribution (CC BY) license (https://creativecommons.org/licenses/by/4.0/).