Abstract
The textiles and garment industry plays an important role in Thailand’s economic growth, despite facing competition in product quality and rising production costs. Meeting diverse consumer needs and satisfaction has become increasingly difficult, as environmental issues become a major concern for firms internationally. Entrepreneurs require sophisticated strategic management techniques to maintain organizational productivity. Growing industries generate material losses, while negatively impacting the environment. Companies may account for their waste, but in reality, actual productivity is much lower, since hidden wastes are mostly unaccounted for and unquantified. A key barrier to reducing waste is that potential cost savings by revising waste management processes are not calculated. To solve this problem, material flow cost accounting (MFCA) was introduced to reduce negative product costs in a ladies’ lingerie company by identifying and evaluating the quantity and cost of concealed material waste. An effective meta-heuristic called the Two-Dimensional Cutting Stock Problem—Tabu Search algorithm (2DCSP-TS) was then proposed based on the idea of finding a layout that minimized a bin length. The multi-phase arrangement strategy embedded in it can obtain near-optimal conditions for solving realistic-sized problems. To illustrate the effectiveness of the proposed methods, numerical experimental results were compared with those of the current practice. From the numerical experiments, it was found that the proposed technique is an efficient method for reducing negative product costs.
1. Introduction
The industrial sector has focused on the integration of technology in the manufacturing process, known as industry 4.0 [1,2]. The competition patterns of the consumer market has also changed. Therefore, employing mass production to decrease unit costs no longer meets customers’ needs as in the past because the customers have demands on variety, as well as good value for money. Another factor to which consumers pay attention is cleaner production; thus, a new manufacturing system called mass customization has been introduced. Mass customization [3,4] requires a proper production strategy to balance uniqueness, fashion, and price. From its principle to meet consumers’ demands quickly, mass customization requires flexible and dynamic strategies in order to adapt to cases. Mass customization also allows companies to provide customers with uniqueness and meets personal demands with reasonable costs [5]. This is consistent with the Lean manufacturing system [6,7] that aims to increase values and eliminate the seven types of waste: overproduction, waiting, transporting, inappropriate processing, unnecessary inventory, and unnecessary motions [8] in production to enhance flexibility and contribute to small lot sizing.
In keeping up with global trends, the garment industry is a sector that has to be adaptive. Many organizations have launched downsizing policies due to uncertain customer demands which means that the company will not hire new employees for substitution. Consequently, employees have to be more efficient or multi-skilled to operate at the same pace. It is well-known that the garment industry is labor-intensive; production lines commonly pile up with materials due to a lack of technology as compared with, for example, the automotive industry. If there is a large amount of material piled up, it means the hidden cost not mentioned in the seven wastes is more than 50% of the total cost. Material loss is difficult to analyze by traditional cost accounting but another technique can be utilized which is Material Flow Cost Accounting (MFCA). At present, MFCA is an effective tool that has been used and accepted as a global standard to help organizations to better understand the potential environmental and financial effects of their usage of material and energy.
Today, manufacturers that have implemented a down-sizing strategy still have to consider the cost and environmental impact [9,10]. Therefore, the objective of this research is to present the application of MFCA in waste reduction in a lingerie manufacturing industry that has been operating for more than 40 years in Thailand as a case study. This research is the first study devoted to improving the organization’s efficiency along with the mitigation of environmental impacts. The study is divided into 2 parts. The first part focusing on the utilization of the MFCA technique for the analysis of structure, production, and cost in order to identify the potential process that causes the negative cost of goods. The second part focuses on the implementation of the findings from MFCA in that the cutting process resulted in the negative cost of goods leading to the study of the Two-Dimensional Cutting Stock Problem (2DCSP) and Tabu-search (TS) to identify the minimal length of workpiece sorting by using a heuristic algorithm. The issue in workpiece sorting is an important process that determines the amount of material lost. The results of this study can minimize the material wastes in term of the negative product costs which enhances the company’s competitiveness. Therefore, this research can meet the demand for mass customization due to technology intervention which down-sizes the production but improves efficiency with fewer laborers required. Whilst the number of laborers is the same, the production has increased as one person can operate several machines. Furthermore, this research can serve as a model for sustained manufacturing and minimization of the environmental impact in the textile and garment industry.
The following sections consist of MFCA, 2DCSP, evaluating improvement effects, discussion and conclusion, respectively.
2. Material Flow Cost Accounting (MFCA)
MFCA is originally from Germany but has been used in Japan since 2000 with support from Ministry of Economy, Trade and Industry, Japan [11], which delimited MFCA as one of the Environmental Management Accounting (EMA), which aims to mitigate the environmental impact and reduce cost and waste elimination, while ensuring the organization performance is improving. This technique also helps to indicate which processes can be improved. First, the material flow process is created then the MFCA calculation is developed to categorize the production compared to input material using mass balance. The key concept of mass balance is that the input material and output material are equal amounts of product and waste. For this reason, the production cost can be classified into 4 categories: Material Cost: MC, System Cost: SC, Energy Cost: EC, and Waste Management Cost: WC. The costs are considered a cost of positive product attached to the end product and a cost of negative product lost during the process and did not acquire any income. The process of the application of MCFA as an international standard (ISO 14051) [12] are as follows:
- 1.
- Preparation—to identify the target product and the process that need improvement then analyze the initial process and indicate the scope for further planning.
- 2.
- Data collection—to collect information about raw materials, input, and waste in each process.
- 3.
- MFCA calculation—to identify the input variables covering both the positive and negative cost of goods under the mass balance concept. The calculation results support affirming and categorizing costs, as well as causes, from each process.
- 4.
- Process identification—to point out the process that needs improvement along with identifying lost materials.
- 5.
- Solution—to provide options and the feasibility of reducing the material loss for each option followed by a calculation of costs and expenses to prioritize the plans for improvement.
- 6.
- Implementation—to implement the solution and collect data following implementation for further evaluation.
- 7.
- Evaluation—to assess the intervention. The number of input factors and waste upon the implementing process and MFCA calculation will be done to compare the result before and after implementation.
In recent years, Kokubu and Tachikawa [13] studied the feasibility of MFCA application in Japan and stated the environmental management cost in 2003 by METI. It was revealed that the organizations that implemented MFCA showed practical solutions and efficient performance. As a result, the implementation of MFCA has been widely considered in Japan. Nakajima [14] gathered case studies of Japanese companies that applied the MFCA technique for improving production process along with other quality control tools and showed that they received efficient results. MFCA was considerably referred to his study [15,16].
Then, several studies have adopted MFCA in various case study [17,18,19,20]; moreover, Tran and Herzig [21] provided a review of the existing literature on MFCA application in developing countries. In Thailand, MFCA is a relatively new tool that was only recognized in 2014. A study by Chompu-inwai et al. [22] focused on the implementation of MFCA to analyze the process of wooden products for SMEs combined with the experimental design to identify the significant variable to reduce waste from wood sheets. Furthermore, a study of Kasemset et al. [23] also presented data of MFCA implementation to improve a main product in plastic bottle manufacture which reduced costs efficiently.
However, there are few studies using the MFCA technique for the garment industry. The relevant studies are the research of Kasemset and Chernsupornchai [24], who applied MFCA in SMEs which showed the effective result in cost-saving; and the research of Amid et al. [25], who developed a fuzzy weighted max-min multi-objective model to reduce waste and response to environmental requirements. For this reason, there is a possibility in the garment industry to investigate and improve the manufacturing process to enhance the performance, along with mitigating environmental impact by implementing MFCA with management tools, which will be presented in the next chapter.
2.1. Case Study in Lingerie Industry
This research proposes to implement the MFCA in each process of lingerie manufacturing. According to the MFCA process, material, energy, and system costs are analyzed and classified as costs of positive and negative products. The operations with high negative product costs are improved and provided solutions in order to reduce negative product costs. The results of the study are as follows.
2.1.1. Primary Product Information
The business for the case study is the garment industry for lingerie which is made to order. All products will be delivered to headquarters, where the customer orders are placed monthly. The manufacturing begins with receiving customer orders then planning for the production process to inform related sections. The material storage department (RM) is responsible for material preparation which is sent to the cutting section (CU). The cutting plan will then be created to utilize material at the maximum efficiency. In the cutting process, there is both manual and auto cut. The cutting materials will be checked and delivered to the sewing section (SE) to tailor finished products following sewing standards in the next step. All products are examined by the quality control section (QC) and inspected randomly by the quality assurance section (QA) for guaranteeing. After the random check, all products are sent to the packaging section (FG) before being delivered to customers. All processes are supported by the technique and maintenance department to ensure that production is operated efficiently.
2.1.2. Data Collection & Compilation
According to the analysis, a major loss of material is trim loss which occurred at the cutting section. The following loss occurs at the sewing section which includes remnant and threads. The third process that has material loss is the quality control section. Some products need to be sent back to the sewing section for repair. Lastly, substandard products that were randomly inspected at the quality assurance section must be sent back to the sewing section for repair as illustrated in Figure 1.
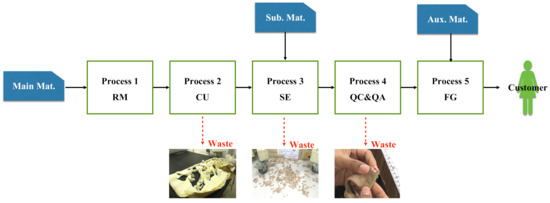
Figure 1.
Material loss occurring in lingerie production process.
As we can see in Figure 1, the cutting is the main section that defines the quantity of material used because the material will be processed from a large roll into pieces and prepared for transfer to the sewing section. Thus, a plan is required before material cutting. Although, there is a designed program that supports the planning, the current practice is still trial and error based on worker experience. In other words, the responsible person will test the arrangement pattern and then consider if there is a chance for further improvement based on her experience. For this reason, improvement in the cutting plan will help in material and cost-saving. From the data mentioned, the main issue in this case study is determining a plan for material cutting that meets the amount that customers require and utilizes materials effectively. This issue can be identified as Two-Dimensional Cutting Stock Problem. Initially, the MFCA has not been acknowledged in this case study. Hence, the present cutting plan is considered to be the most effective pattern. If the MFCA has not been implemented, the main loss at the cutting process has not yet been identified. Moreover, the study reveals that not only the main material is lost from cutting, but indirect loss also occurs, such as time-wasting for trial and error. Workers spent time trying to find the cutting pattern with nothing as the guarantee that it would be the best. For each cutting, a paper plan was printed to place on materials before the actual cut. The cutting also required a cutting mat to prevent the materials from slipping and paper to divide the shades of materials that came from different rolls. Moreover, a plastic cover was used for auto cutting. For example, the cutting pattern for the WB1234 model with 1000 orders, cup size (e.g., bra size, the smallest of which is A) A, B, C, and D. There are four different under-bust sizes which are 70, 75, 80, and 85. A bra is assembled with 5 parts which are the right cup, left cup, right band, left band, and bridge. The number of orders for each cup size is also different. For example, A85 will not be produced as it is a small cup group, but A75 is made at the maximum quantity as it is standard size and has a higher sales amount than other sizes. The D70 and D75 have not been produced as they are large cups which causes the under bust size to be bigger, as well. In the case of producing 150 pieces of A70, it does mean there are 750 parts required for pattern making. Similarly, 1000 orders of the WB1234 model needs 5000 pieces of a cutting pattern which also depends on stretching pattern and the rotation can be adjusted at only 0 and 180 degrees due to the limitation of fabric lines as shown in Figure 2.
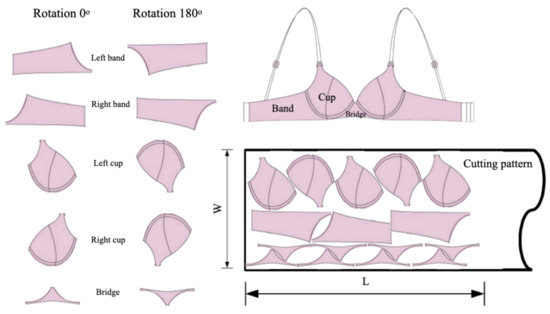
Figure 2.
An example of the parts that need to be considered in making a cutting pattern.
According to the issues that occurred in the case study mentioned above, the work sample curvature is sharp, the calculation is complex and time-consuming. The organization in this case study is a large company with an existing system and standard. However, the industrial engineering techniques (e.g., lean, time study, and operation research technique) do not focus on material loss in which material cost is almost 50% of the total cost. The data analysis of material loss and cost is difficult to identify by using traditional cost accounting. Manual cutting employs more resources and time for planning, and there is also material loss from employing an inefficient plan. Thus, a material cutting plan that meets the quantity that customers require and generates the least scrap is the issue this case study focuses upon.
2.1.3. MFCA Calculation
The MFCA calculation is made for categorizing finished products compared to materials input in each process by using a mass balance which includes products and wastes. To figure out the cost of negative products, MC can be calculated from the amount of each waste type multiplied with the unit cost and the result will be used to analyze the quantitative data in the material flow chart (Figure 3). The cost of EC, SC, and WC can be calculated by mass allocation method by using cost multiply with the percentage of the negative product cost. The materials are separated into 3 groups which are:
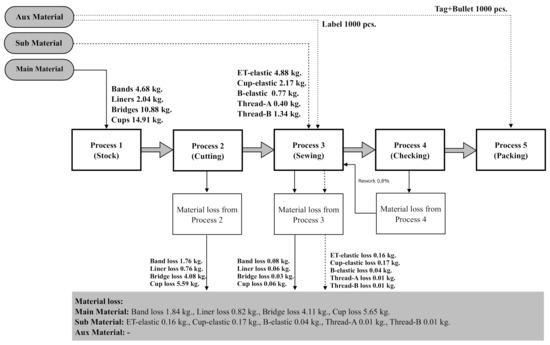
Figure 3.
The material flow chart.
- 1.
- main materials, such as bands, cups, bridges, and liners,
- 2.
- sub-materials, such as ET-elastic, Cup-elastic, B-elastic, Thread-A, and Thread-B, and
- 3.
- auxiliary materials, such as Label, Tag, and Bullet.
From Figure 3, it can be seen that the five quantity centers consist of material storage, cutting, sewing, checking, and packaging section. Due to a variety of customer orders, the targeted product was selected as one ladies’ lingerie type which has a high frequency and volume of customer orders during the study time period. The MFCA calculation and analysis were carried out based on 1000 pieces equal to one production lot size. The material flow begins with inputting the main materials to material stock where materials are collected and await delivery to the cutting section. No loss or negative products occurred in this process. The cutting section then received all materials which the negative products generated as roll fabrics are processed into pieces for sewing in the next section. The processing, however, needs a pattern before cutting. Though the programs are developed for cutting pattern arrangement, the decision is still trial and error based on workers’ experience. As a result, a high negative product ratio occurred in the cutting process. The next process is the sewing section where sub-materials are input. These sub-materials are ET-elastic, Cup-elastic, B-elastic, Thread-A, and Thread-B, along with auxiliary materials, such as labels to produce finished products. The negative products generated in the sewing section are very low compared to the cutting process as the material loss is only from trimming. After that, finished products are transferred to quality control for checking. Some negative products were found but were able to be sent back to the sewing section for adjustment. After this, all checked products are delivered to the packaging section which is the final production process. The auxiliary materials input in packaging are tags and bullets to attach to products without any alterations, so negative products have not been found. Due to mass balance, costs that occurred in each process are relevant and reflected MFCA analysis as in Figure 4.
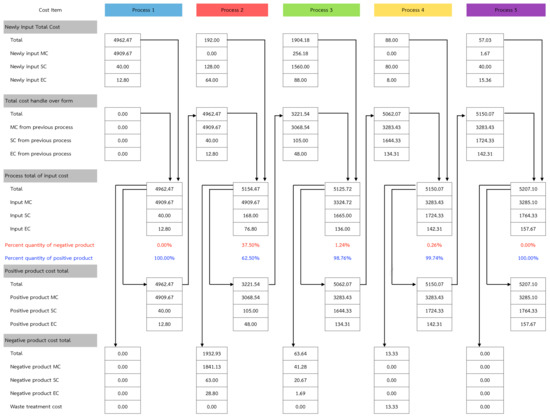
Figure 4.
The material flow cost accounting (MFCA) cost allocation (in USD).
The calculation in Figure 4 applied the MFCA technique to identify the ratio of the positive and negative products generated in lingerie production under the mass balance concept. It was found that 100% of positive product costs occurred in material storage and all of these costs were added to the following process. Next, the cutting section processed roll materials to pieces in which the cutting plan was required to minimize material loss. The product costs ratio is now 62.50% for positive products and 37.50% for negative products of which 95.25% is raw materials cost valued at 1841.13 USD. This is the highest amount compared to total costs and requires an urgent solution for adjustment. The following process is the sewing section where semi-finished materials from cutting are input for sewing and making finished products. There is a trimming which causes a small number of scraps from fabrics, rubbers, and threads, so the costs of positive products are at 98.76%. Quality control is the next section where no materials costs are added as this section only checks finished products sends faulty products back for repair. Therefore, the positive product cost ratio is 99.74% in this process. Lastly, the packaging section receives qualified finished goods in which no materials are lost, and negative product costs do not occur. From the MFCA analysis mentioned above, total costs in the lingerie production process before the improvement is shown in Table 1 and Figure 5.

Table 1.
Total costs in production process before the improvement (in USD).
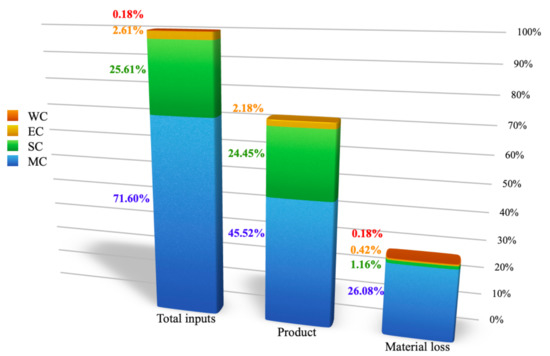
Figure 5.
Cost allocation before the improvement.
2.1.4. Identifying Improvement Requirement
As seen in Figure 5, the highest negative product cost is material cost 26.08% followed by production cost at 1.16%, energy cost 0.42%, and waste management cost 0.18%, respectively. To analyze the improvement requirement, the material cost, which is the highest negative product cost, is the priority. Other costs, such as production cost, energy cost, and waste management cost, have not been studied in this research due to permissions from the company.
According to the analysis, the highest amount of material cost occurred at the cutting process in which fabric rolls are transformed into pieces for assembling. Thus, an efficient cutting pattern and operational method are essential to minimize material loss.
As a suggestion for improvement in the cutting section where the highest negative product cost occurred, this research has introduced the 2DCSP-TS algorithm as a solution.
3. Two-Dimensional Cutting Stock Problem (2DCSP) Algorithm
One of the cutting and packing problems is the Two-Dimensional Cutting Stock Problem: 2DCSP which is concerned with finding a good arrangement of multiple items in large containment and avoiding the overlay. This problem is commonly found in different industries, such as garment and leather products. The issue still has not been sufficiently resolved as there are numerous arrangement patterns. Garey et al. [26] showed that 2DCSP is an NP-complete problem. Thus, the 2DCSP problem with irregular shapes is an NP-Complete problem, as well. According to Dyckhoff [27], the 2DCSP can be categorized as 2/V/I/R which means that two-dimensional irregular shapes or polygons can be arranged on the material at the minimum (V) and used multiple items with the same shapes and sizes (I). The property of non-convex type polygons has a common property in some items (R). Furthermore, the rotation limit is allocated for only 0 and 180 degrees due to the line pattern of fabric, as well as the consideration of three patterns of stretch type. The purpose of the 2DCSP problem is to use the material at the minimum length. In the previous study of packing problems, Jakobs [28] applied generic algorithms with BL (Bottom-Left) heuristic by substituting the irregular shape stock which is generally called Polygon to make a square shape around that polygon. Then, the squares from different sizes of polygons are put on material following the BL method by arranging stock closest to the bottom left of the material repeatedly. When this is completed, one by one arrangement will be retrieved. Swapping stocks sequence caused the change of the arrangement which affects the area of material used. As a result, minimum material use is recommended by employing a Genetic algorithm to identify the most effective arrangement. Replacing squares on irregular shapes also helps in the quick calculation. Nevertheless, replacing the squares on different sizes of stocks affects material surface loss. Oliveira et al. [29] has proposed the TOPOS algorithm which is one of the most effective arrangements at present. The TOPOS applies a no-fit polygon with the Greedy method by allocating polygons on material sheets one by one. The selected polygons provide the most effective arrangement when the process is completed. The best result in arrangement of the stocks depends on the strategies. These arrangements can be changed up to 126 patterns. The result of the study revealed that there are still effective strategies that still do not exist for every sample test. Kendall [30] has demonstrated the application of Meta-Heuristic, such as Genetic algorithm (GA), Simulated Annealing (SA), Tabu Search (TS), Ant algorithms, and Memetic algorithms, with the no-fit polygon. Two polygons were allocated at a position that caused minimum convex hull then combined to a new polygon which was used to calculate no-fit polygon with the next polygon continuously until the last. After this, the calculation for the length of the arrangement was done by using different meta-heuristic to identify the optimum length. The result showed that TS and Memetic algorithms resulted in the best outcome.
Since TS is a search method that finds a new solution from a neighborhood of a current solution and uses only two parameters, neighborhood size and tabu-list size, the solution improves rapidly. Thus, this article will introduce the arrangement applied from Kendall [30] by using TS and multi-phase arrangement strategy [31] to identify the most effective polygon arrangement. A multi-phase arrangement strategy includes two strategies which are MinCenterDistance and MinLength. MinCenterDistance strategy has been used for the first half of polygons to select a position that makes the center of the squares around the polygon closest to one another as in Figure 6a. For the other half of the polygons, a MinLength strategy is selected to identify the best position for an arrangement of new polygons at a minimum length as in Figure 6b. As the purpose of the arrangement is to minimize material length, this strategy creates a minimum arrangement when polygons are merged. MinCenterDistance strategy is a suitable early arrangement since minimum material will have been used. For later arrangements, the MinLength strategy was chosen as a means to minimize the sequence.
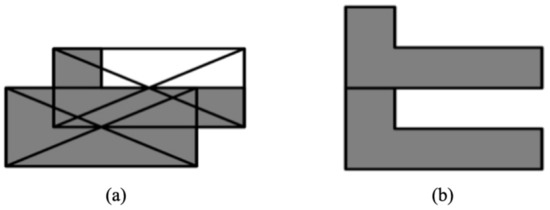
Figure 6.
The multi-phases arrangement strategies [31] are MinCenterDistance (a) and MinLength (b).
3.1. Stock Arrangement
The steps for stock arrangement are as follows:
- 1.
- Randomly choose the initial polygon.
- 2.
- Calculate the no-fit polygon for the first and the second polygon. The no-fit polygon is the position around the first polygon that can be overlaid by the second polygon perfectly.
- 3.
- Select the best position of no-fit polygon according to the strategy.
- 4.
- After choosing the position, two polygons will merge and generate a new polygon which will be used as the initial polygon to identify the no-fit polygon and the consecutive polygon. Repeat step 2 until all polygons have been allocated.
- 5.
- Calculate the length of the arrangement.
- 6.
- Implement Tabu Search (TS) to identify the most effective sequence of polygons.
3.2. No-Fit Polygon
The basic idea behind the no-fit polygon (NFP) was originally proposed by Art [32]. The NFP is a tool that can be used for identifying the position in which two can be close with no overlaps. This method has been acknowledged for its efficiency and has been used to solve problems, such as identifying motions of robots. The NFP is generated by two polygons in which the first polygon is fixed, while the second polygon is orbiting. The direction of this movement is called an NFP. If the reference point of the second polygon is in the NFP, an overlay has occurred. If the reference point is outside the NFP, the polygons are not touching. And if the reference point is on the NFP, this shows that both polygons are attached perfectly. Figure 7 illustrates that polygon A is fixed and B is moving. The dot lined shape represents the NFP and its position. Polygon B is in a position of close arrangement with polygon A.
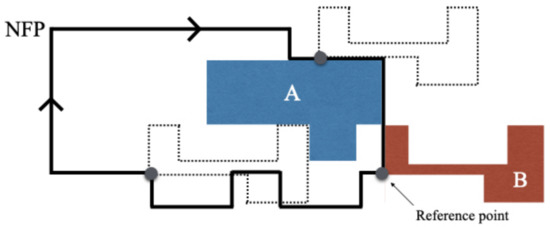
Figure 7.
An example of the no-fit polygon (NFP) (thick border) of polygon B in relation to polygon A. The reference point of B is not allowed inside the NFP if overlap is to be avoided.
A polygon can be categorized into 2 types, convex and non-convex. For a convex polygon, the edges are arranged by the angle consecutively in a clockwise direction, as shown in Figure 8a. A non-convex polygon is more complicated as its edges are not arranged in sequence. An example of a convex and non-convex polygon is shown in Figure 8. As seen in Figure 8b, the 4th and 5th edges have a narrower angle than the 3rd edge, and this represents a non-convex polygon.
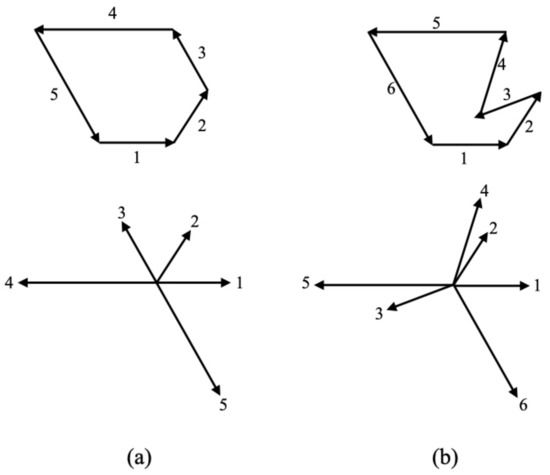
Figure 8.
Convex polygon (a) and non-convex polygon (b) [31].
The no-fit polygon convex type can be calculated by Minkowski’s Different [33,34], which states that an NFP is equal to the difference of both polygons.
which
and represent sets of edges in polygon A and B, respectively. a and b are the edge inside and , respectively.
The NFP convex type is formed by merging of the edges of two polygons. The first polygon has a counterclockwise direction, while the second polygon has a clockwise direction which is arranged by its angle from 0 to 180 degrees, respectively, as shown in Figure 9.
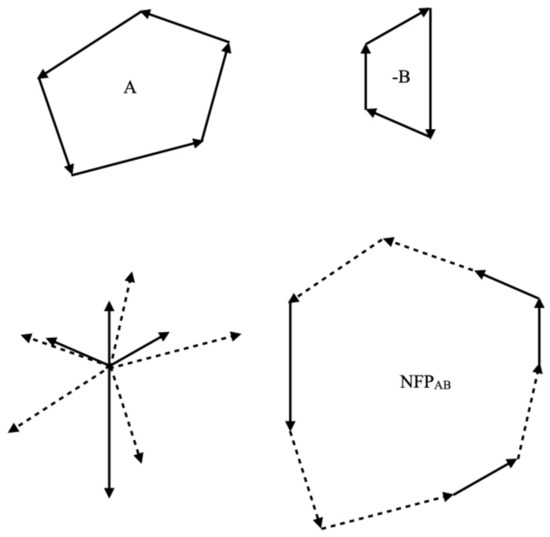
Figure 9.
A method to calculate a NFP [31].
Polygon A and B move in a counterclockwise direction. The NFP calculation is used to find the combined edges between and , in which contains the same edges as but moves in a clockwise direction. The NFP of polygon A and B is retrieved when the edges of both polygons are arranged and connected at each angle. For the non-convex type polygon, the calculation requires various methods that have been presented by numerous researchers. The calculation example is shown in Benell et al. [35] and O’Rourke [36].
3.3. Fitness Function
Due to its objective of minimizing the length of material, the arrangement value is the length of the arrangement. For vertical arrangement, the length is the different space of the top and bottom and for horizontal is the distance between the left and right position.
The area of polygon can be calculated by the following equation,
where n is the number of positions in the polygon, and x, y represent the positions of the polygon in a counterclockwise direction.
Utilization can be calculated by adding the area of every polygon and then dividing by the area of material, as seen in the equation below.
where m represents number of polygon, W represents the bin width of the material, and L represents the bin height of the material.
3.4. Tabu Search (TS)
To choose the series of the polygon that represents the best arrangement value, several meta-heuristic methods have been used in the past. The popular methods are Genetic algorithms, SA and TS, each of which have different pros and cons. TS is selected for this study as it requires fewer control parameters, of which only 2 are needed. Glover [37] first introduced the TS, which was developed from the Hill climbing method that aimed to find a neighborhood to improve, and which will serve as the starting point for the next round. The disadvantage of Hill climbing is that no further answer is created if the result shows there is no better neighborhood, the system cannot find in other areas that may have a better result. This is called the local optima. TS can solve local optima issues by determining previous answers through use of the Tabu list to collect data. The selected initial answer cannot be replicated until the determination has been completed which is equal to Tabu list size.
3.4.1. Neighborhood
The polygon order runs as 1, 2, 3, …, n. Rearrangement of the order of polygons, such as swapping a pair of polygons, will make a new polygon order which is called a neighborhood. This sample avoids alternating similar polygons to reduce the number of neighborhoods which depends on the number and type of polygons. In case none of the similar polygons, the neighborhood is n(n−1)/2 with n being the number of polygons. If there are more polygons, using all neighborhoods requires time which causes delayed searching and has less test rounds. Basically, the neighborhood is fixed at random from all neighborhoods. The number of the neighborhood is determined by a parameter called NH (Neighborhood Size). The determination of neighborhood numbers is important in finding the answer. If there are many neighborhoods, the search round is a less and low number of neighborhoods that cause inefficient searching.
3.4.2. Tabu List
The Tabu list has been used for the statistic of polygon arrangement which gives the best result of the neighborhood. For example, if the alternation between polygons 1 and 5 gives the best answer (1,5), it will be saved in Tabu list and determined a value. As a result, swapping between polygons 1 and 5 is blocked for the next round. After searching for the answer, the number that was determined for (1,5) will decrease consecutively by 1 until zero is reached, then the alternation of (1,5) can be selected again. The advantage of the Tabu list is preventing searches back to previous points. The number determined for each alternation is called the Tabu list which is defined by the parameter called TS (Tabu size) from the previous search. If there are a lot of neighborhoods, the Tabu size is large. Similarly, less neighborhoods results in a smaller Tabu size. The process of the 2DCSP-TS algorithm is illustrated in Algorithm 1.
| Algorithm 1 2DCSP-TS algorithm |
|
3.5. 2DCSP-TS Experiment
The polygons sample for testing 2DCSP are the actual two-dimensional work samples with an irregularly shaped non-convex property to identify performance of the proposed algorithms. The 2DCSP-TS algorithm was compared with traditional methods in the manual arrangement. Test datasets includes 12 combinations vary by three factors. The first factor is a polygon group that includes two datasets, Dataset4 and Dataset6, which have 4 and 6 different shapes, respectively. Dataset4 contains complex polygon with average edge number of 15.5 per polygon, while Dataset6 contains less complex polygon with average 8 edges per polygon. The second factor is the polygon quantity. In a small quantity order, Dataset4 and Dataset6 having 20 polygon and 30 polygon to be arranged at once, respectively, while, in a large quantity order, double pieces of the small quantity order were used. The last factor is a material bin height varied in 33, 50, and 100 centimeters. Totally, the test datasets has 12 combinations, as shown in Table 2.
Table 2.
The factorial experiment with 12 treatment combinations.
2DCSP-TS algorithm is developed with QT Creator in C++ programming language. The algorithm was tested with 10 replications and average result had been used to compare. By using trial and error method, parameters of TS was fixed at neighborhood (NH) 72 and Tabu list (TS) 50 that was suited for the test datasets. The algorithm was ended when it reach 5000 evaluations. These conditions was used for all combinations datasets. The computational of 2DCPS-TS ran on a workstation with dual Xeon Gold 5220 2.2 GHz, 192 GB RAM with Linux Mint version 19.3 operating system. This workstation have two CPUs with 18 cores/36 threads per CPU, totally 72 process can be run simultaneously. The algorithm wrote with support parallel process, so it can evaluate 72 solutions at the same time, while the result of manual method was collected by the work of a specialist having experience for 17 years in this process. She used OptiTex Marker software version 10 running on PC with Pentium® Dual-Core 2.60 GHz, 3.49 GB RAM and Windows XP operating system to arrange shapes. She worked three times per test combination and then average utilization and working time is recorded as a result to compare with 2DCSP-TS method.
The result example of 2DCSP-TS algorithm is shown in Figure 10. The arrangement can be implemented to practical work as it has a similar pattern to present practice with manual method but better material utilization. 2DCSP-TS tried to search 5000 solutions for each run that give an opportunity to found better arrangement patterns in faster working time. Table 3 shows the comparison of the result of the 2DCSP-TS algorithm and the traditional manual method. It can be seen in Table 3 that the material utilization using the 2DCSP-TS algorithm improved the results from using manual method in every combinations at an average of 7.7%, the minimum being 5.76% and the maximum 9.91%. The reason the 2DCSP-TS algorithm gives better results is that the research method applied TS, which prevents any disturbances of the unwanted neighborhood with a mechanism that can control and avoid local optimal. The integration of determinism and probability is direct identification, which means that, if the minimum is found, it will cause a change to the neighborhood. In case the result has improved, it will be adjusted as a present result. On the contrary, if a worse result is found, it will be prevented from replicating and, thus, expand the searching area. This case study employs worker experience and decision making to find a result which is uncertain for further improvement. For time improvement in the calculation, the 2DCSP-TS algorithm can speed up arrangement time of manual method in every treatment combinations at 46 times on average, a minimum of 14.48 times and a maximum of 105 times over the manual method. Due to the data, the 7th to 9th treatment combinations spent more time in calculation than others because the sample shapes are more complex or have more curves. The complicated curves cause more time to be spent on no-fit polygon calculation which is different from the manual method in that the time spent depends on the number of workpieces arrangements. However, the overall result reveals that the solution presented gives better results than the manual process with maximum calculation time consumed only 251.141 s in the 7th treatment combination. By this performance, it will be more suitable to use in mass customization process than the manual method.
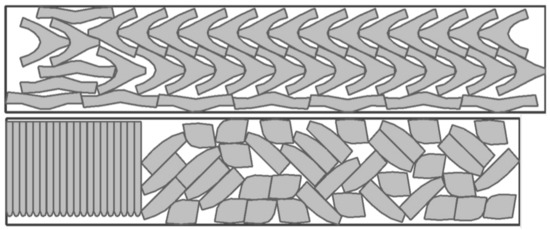
Figure 10.
The arrangement using heuristic Two-Dimensional Cutting Stock Problem—Tabu Search algorithm (2DCSP-TS) algorithm.
Table 3.
The comparison of the results from the 2DCSP-TS algorithm and present case.
4. Evaluating Improvement Effects
After suggesting the improvement plan, Table 3 shows the material utilization result from the 2DCSP-TS algorithm that was found better than the manual method to an average of 7.7% and was used to calculate by the MFCA technique again, such as material balance and MFCA cost allocation, in order to convert to financial data of the after improvement. Then, cost of prior lingerie production shown in Figure 4 and Table 1 has been improved. More details in the comparison of cost in production before and after improvement are shown in Table 4.
Table 4.
Comparison of production cost before and after improvement (in USD).
According to Table 4, the total cost of lingerie after improvement remains the same at 7217.00 USD because the improvement did not focus on the input factor but rather, the cutting process in which the highest negative product cost was generated. The result after improvement increased 7.62% in positive product cost from 5207.10 USD (72.15%) to 5756.74 USD (79.77%). The positive product costs are allocated to material cost 3806.02 USD, system cost 1784.76 USD, and energy cost 165.96 USD. Meanwhile, the negative product costs decreased from 2009.90 USD (27.85%) to 1460.26 USD (20.23%) which was allocated to material cost, 1361.49 USD, system cost, 63.24 USD, energy cost, 22.20 USD, and waste management cost, 13.33 USD. The results clearly show that positive product cost ratio has increased whilst the negative product cost has declined according to the improvement in the cutting process where the highest cost occurred. The negative product cost is mainly from material cost rather than other allocations. It means that, in future planning, we can reduce the input (raw material) from the initial planning stage, while still getting the same finished goods, and the cause helps entrepreneurs more by saving cost.
5. Discussion
In the case study, MFCA identifies the highest negative product cost as a material cost which is 26.08%, while the total negative product cost is 27.85%. Most material loss is found in the cutting process considerable as 37.5% of the total material, as shown in Figure 4. Thus, reducing cutting loss is essential to improve lingerie production. This result of MFCA investigation is the same as that has been found in the previous research [22], who proposed adjustments of cutting pieces and cutting tables to reduce the cutting wastes. However, their adjustments were done by the manual that was not suited to a large number of orders. To solve this problem to improve the cutting process, we propose 2DCSP-TS that can arrange the cutting pattern automatically by computer. This approach can improve material utilization 7.7% on average when compared to the manual arrangement of the expert. Moreover, it speeds up a cutting pattern planning process 46 times on average and provides a more comfortable planning process without the need for the expertise of the workers. The faster planning process allows adapting production lines to support mass customization which has a variety of products in a large number of orders as lingerie industry.
For the economic impact, implementation of MFCA and 2DCSP-TS in the case study can reduce 7.62% of negative product costs which saves 549.64 USD per production lot, as shown in Table 4. To evaluate the monthly cost-saving based on average orders at 90,000 pieces per month, the order per production lot is between 1000 to 4000 pieces which are 2500 pieces per lot on average. As a result, there are 90,000/2500 = 36 production lots with a total cost saving of 549.64 USD × 36 = 19,787.04 USD per month or 237,444.48 USD per year. As the organization in this case study has five branches, the solution will help save 1,187,222.40 USD per year if the improvement can be applied to other branches. Just entrepreneurs invest in the high-performance computer once at 10,000.00 USD per branch (50,000 USD per five branches), which can instantly get a payback investment. It is clear that the implementation of MFCA and 2DCSP-TS can help to identify the feasibility to reduce material loss and improve the process with economically possible as well as minimize the environmental impact.
For future work, the problem of the textile industry is that most of the wastes are fabrics. These are difficult to reuse because of their properties that soft and hard to handle for small pieces. Thus, the wastes will be moved to trash or rebuild to lower value products, such as doormats or foot towels. Applying information technology (IT), such as the proposed 2DCSP-TS, is an opportunity for improvement to this industry. It will provide data in all processes, while giving a faster data collecting time. This data can be used to predict material usage, maintain materials stock small, and reduce an unnecessary material orders. This is an example for improvement in the future that requires various knowledge, such as big data, artificial intelligence, and automation, which corresponds to an industry 4.0 transformation.
6. Conclusions
In conclusion, the analysis of material loss and the relevant cost is difficult to analyze by collecting traditional cost accounting; however, the MFCA technique helps classify and identify the loss that occurred, and is to convert production losses to monetary terms that can encourage managerial people to be aware of production losses. The advantage of combining MFCA and 2DCSP is that the presentations of both the economic and the environmental aspects encourage improvement in both the aspects simultaneously. The material cost from the working process or inefficient production technology is the basis for investigating causes and solutions for reducing loss from energy or materials consumption, as well as minimizing the impact on the environment. However, improvement strategies have to be considered appropriate for different organizational contexts. The result of the study on a leader in garment industry operating more than 40 years in Thailand with the demand chain covered from upstream to downstream reveals that the company is but one of the business sectors that has to adapt to the current world economics trend by considering ways to manage existing resources most efficiency and with environmental awareness. This case study focuses on material cost reduction by implementing the MFCA technique, the results reveal that the cutting process caused the highest material and negative product costs leading to the resolution of 2DCSP. Then, this article proposes 2DCSP-TS algorithm to improve material utilization and reduce time to arrange a cutting pattern. Hence, this study places importance on the improvement of organizational efficiency and the mitigation of environmental impact. The study outcome found that overall negative product cost and total cost have decreased which enhances competition performance and can meet a mass customization demand. With the implementation of technology, the production size is smaller but shows better performance without more labor required, and production has increased with the same number of workers. Furthermore, this study can show the best practice for sustainable manufacturing, as well as minimizing the environmental impact in the textile and garment industry.
Author Contributions
Conceptualization, D.D.; Methodology, D.D. and K.E.; Software, K.E.; Validation, D.D. and K.E.; Formal Analysis, D.D.; Funding acquisition, S.H. and W.W.; Investigation, D.D. and K.E.; Resources, D.D.; Data Curation, D.D. and K.E.; Writing—Original Draft Preparation, D.D.; Writing—Review and Editing, D.D. and K.E.; Visualization, D.D. and K.E.; Supervision, S.H. and W.W.; All authors have read and agreed to the published version of the manuscript.
Funding
This research was funded by Thammasat School of Engineering (TSE), Thammasat University.
Acknowledgments
The author would like to sincerely thank Thammasat School of Engineering (TSE) for financially supporting the scholarship during post-graduate study at Thammasat University.
Conflicts of Interest
The authors declare no conflict of interest.
References
- Rüßmann, M.; Lorenz, M.; Gerbert, P.; Waldner, M.; Justus, J.; Engel, P.; Harnisch, M. Industry 4.0: The future of productivity and growth in manufacturing industries. Boston Consult. Group 2015, 9, 54–89. [Google Scholar]
- Vaidya, S.; Ambad, P.; Bhosle, S. Industry 4.0—A glimpse. Procedia Manuf. 2018, 20, 233–238. [Google Scholar] [CrossRef]
- Schwartz, H.S. “Future Perfect”, by Stanley M. Davis (Book Review). Hum. Resour. Manag. 1989, 28, 145. [Google Scholar] [CrossRef]
- Pine, B.J. Mass Customization; Harvard Business School Press: Boston, MA, USA, 1993; Volume 17. [Google Scholar]
- Dong, B.; Jia, H.; Li, Z.; Dong, K. Implementing mass customization in garment industry. Syst. Eng. Procedia 2012, 3, 372–380. [Google Scholar] [CrossRef]
- Womack, J.; Jones, D. Lean Thinking; Simon and Schuster: New York, NY, USA, 1996. [Google Scholar]
- Alexander, P.; Antony, J.; Rodgers, B. Lean Six Sigma for small-and medium-sized manufacturing enterprises: A systematic review. Int. J. Qual. Reliab. Manag. 2019. [Google Scholar] [CrossRef]
- Ohno, T. Toyota Production System: Beyond Large-Scale Production; CRC Press: Boca Raton, FL, USA, 1988. [Google Scholar]
- Baumgartner, R.J.; Rauter, R. Strategic perspectives of corporate sustainability management to develop a sustainable organization. J. Clean. Prod. 2017, 140, 81–92. [Google Scholar] [CrossRef]
- Tang, C.S. Socially Responsible Supply Chains in Emerging Markets: Some Research Opportunities. J. Oper. Manag. 2018, 157, 1–10. [Google Scholar] [CrossRef]
- Ministry of Economy, Trade and Industry, Japan MFCA Case Examples 2011. Available online: https://www.jmac.co.jp/mfca/thinking/data/MFCA_Case_example_e2011_new.pdf (accessed on 31 March 2021).
- International Organization for Standardization; Geneva, S. International Standard: ISO 14051 Environmental Management—Material Flow Cost Accounting—General Framework. 2011. Available online: https://www.iso.org/standard/50986.html (accessed on 31 March 2021).
- Kokubu, K.; Tachikawa, H. Material flow cost accounting: Significance and practical approach. In Handbook of Sustainable Engineering; Kauffman, J., Lee, K.M., Eds.; Springer Netherlands: Dordrecht, The Netherlands, 2013; pp. 351–369. [Google Scholar]
- Nakajima, M. Evolution of material flow cost accounting (MFCA): Characteristics on development of MFCA companies and significance of relevance of MFCA. Kansai Univ. Rev. Bus. Commer. 2009, 11, 27–46. [Google Scholar]
- Nakano, K.; Hirao, M. Collaborative activity with business partners for improvement of product environmental performance using LCA. J. Clean. Prod. 2011, 19, 1189–1197. [Google Scholar] [CrossRef]
- Papaspyropoulos, K.G.; Blioumis, V.; Christodoulou, A.S.; Birtsas, P.K.; Skordas, K.E. Challenges in implementing environmental management accounting tools: The case of a nonprofit forestry organization. J. Clean. Prod. 2012, 29, 132–143. [Google Scholar] [CrossRef]
- Sulong, F.; Sulaiman, M.; Norhayati, M.A. Material Flow Cost Accounting (MFCA) enablers and barriers: The case of a Malaysian small and medium-sized enterprise (SME). J. Clean. Prod. 2015, 108, 1365–1374. [Google Scholar] [CrossRef]
- Zhou, Z.; Zhao, W.; Chen, X.; Zeng, H. MFCA extension from a circular economy perspective: Model modifications and case study. J. Clean. Prod. 2017, 149, 110–125. [Google Scholar] [CrossRef]
- Dekamin, M.; Barmaki, M. Implementation of material flow cost accounting (MFCA) in soybean production. J. Clean. Prod. 2019, 210, 459–465. [Google Scholar] [CrossRef]
- Zeng, H.; Zhou, Z.; Xiao, X. MFCA extension from a life cycle perspective: Methodical refinements and use case. Resour. Policy 2019, 101507. [Google Scholar] [CrossRef]
- Tran, T.T.; Herzig, C. Material flow cost accounting in developing countries: A systematic review. Sustainability 2020, 12, 5413. [Google Scholar] [CrossRef]
- Chompu-inwai, R.; Jaimjit, B.; Premsuriyanunt, P. A combination of Material Flow Cost Accounting and design of experiments techniques in an SME: The case of a wood products manufacturing company in northern Thailand. J. Clean. Prod. 2015, 108, 1352–1364. [Google Scholar] [CrossRef]
- Kasemset, C.; Sasiopars, S.; Suwiphat, S. The application of MFCA analysis in process improvement: A case study of plastics packaging factory in Thailand. In Proceedings of the Institute of Industrial Engineers Asian Conference 2013, Taipei, Taiwan, 19–22 July 2013; Springer: Berlin/Heidelberg, Germany, 2013; pp. 353–361. [Google Scholar]
- Kasemset, C.; Chernsupornchai, J.; Pala-ud, W. Application of MFCA in waste reduction: Case study on a small textile factory in Thailand. J. Clean. Prod. 2015, 108, 1342–1351. [Google Scholar] [CrossRef]
- Amid, A.; Zolfaghari, S.; Siyahpoush, M. A Fuzzy Multi-objective Model with MFCA Approach for Selecting Products Variety in a Textile Supply Chain. In Toward Sustainable Operations of Supply Chain and Logistics Systems; Springer: Berlin/Heidelberg, Germany, 2015; pp. 475–491. [Google Scholar]
- Garey, M.R.; Johnson, D.S. Computers and Intractability: A Guide to the Theory of NP-Completeness; W. H. Freeman: New York, NY, USA, 1979. [Google Scholar]
- Dyckhoff, H. A typology of cutting and packing problems. Eur. J. Oper. Res. 1990, 44, 145–159. [Google Scholar] [CrossRef]
- Jakobs, S. On genetic algorithms for the packing of polygons. Eur. J. Oper. Res. 1996, 88, 165–181. [Google Scholar] [CrossRef]
- Oliveira, J.F.; Gomes, A.M.; Ferreira, J.S. TOPOS—A new constructive algorithm for nesting problems. OR-Spektrum 2000, 22, 263–284. [Google Scholar] [CrossRef]
- Kendall, G. Applying Meta-Heuristic Algorithms to the Nesting Problem Utilising the No Fit Polygon. Ph.D. Thesis, University of Nottingham, Nottingham, UK, 2000. [Google Scholar]
- Ekkachai, K.; Nilagupta, P. A Hybrid Genetic Algorithms and Tabu Search for Solving an Irregular Shape Strip Packing Problem. Agric. Nat. Resour. 2003, 37, 514–522. [Google Scholar]
- Art, R.C., Jr. An Approach to the Two Dimensional Irregular Cutting Stock Problem. Ph.D. Thesis, Massachusetts Institute of Technology, Cambridge, MA, USA, 1966. [Google Scholar]
- Stoyan, Y.G.; Ponomarenko, L. Minkowski sum and hodograph of the dense placement vector function. Rep. SSR Acad. Sci. Ser. A. 1997, 10. [Google Scholar]
- Milenkovic, V.; Daniels, K.; Li, Z. Placement and Compaction of Nonconvex Polygons for Clothing Manufacture. In In Proceedings of the 4th Canadian Conference on Computational Geometry, St. John’s, NL, Canada, 10–14 August 1992; pp. 236–243. [Google Scholar]
- Bennell, J.A.; Dowsland, K.A.; Dowsland, W.B. The irregular cutting-stock problem—A new procedure for deriving the no-fit polygon. Comput. Oper. Res. 2001, 28, 271–287. [Google Scholar] [CrossRef]
- O’Rourke, J. Convex Hulls in Two Dimensions. In Computational Geometry in C; Cambridge University Press: Cambridge, UK, 1998; pp. 63–100. [Google Scholar]
- Glover, F. Tabu search—Part I. ORSA J. Comput. 1989, 1, 190–206. [Google Scholar] [CrossRef]
Publisher’s Note: MDPI stays neutral with regard to jurisdictional claims in published maps and institutional affiliations. |
© 2021 by the authors. Licensee MDPI, Basel, Switzerland. This article is an open access article distributed under the terms and conditions of the Creative Commons Attribution (CC BY) license (https://creativecommons.org/licenses/by/4.0/).