Article

Detection of Quasi-Static Trapped Human Being Using Mono-Static UWB Life-Detection Radar

1
Aerospace Information Research Institute, Chinese Academy of Sciences, No. 9 Dengzhuang South Road, Haidian District, Beijing 100094, China
2
The Key Laboratory of Electromagnetic Radiation and Sensing Technology, Chinese Academy of Science, Haidian District North 4th Ring West Road 19th, Beijing 100190, China
3
School of Electronic, Electrical and Communication Engineering, University of Chinese Academy of Sciences, Beijing 100049, China
*
Author to whom correspondence should be addressed.
Appl. Sci. 2021, 11(7), 3129; https://doi.org/10.3390/app11073129
Submission received: 4 March 2021 / Revised: 20 March 2021 / Accepted: 26 March 2021 / Published: 1 April 2021
(This article belongs to the Section Electrical, Electronics and Communications Engineering)

Abstract

:
In practical situations such as hostage rescue, earthquake and other similar events, the ultra-wideband (UWB) life-detection radar echo response from the respiration motion of the trapped person is always quasi-/non-periodic in respiration frequency or very weak in respiration amplitude, which can be called quasi-static vital sign. Although it is an extremely difficult task, considering the economic cost, the detection ability of the traditional UWB life-detection radars with only a pair of transceiver antennas is desired to be enhanced for locating the quasi-static trapped human being. This article proposes two different detection methods for quasi-static trapped human beings through the single/multiple observation points, which corresponds to the single-/multi-station radar operating mode, respectively. Proof-of-principle experiments were carried out by our designed radar prototypes, validating the effectiveness of the proposed methods.

1. Introduction

The ultra-wideband (UWB) life-detection radar is widely used to indicate human beings trapped in obstacles in rescue applications [1,2,3,4,5,6]. However, indicating the trapped human beings from raw radar echoes is extremely difficult due to heavy environment clutter, high signal attenuation of the obstacles, non-periodic micro-motion and low reflectivity of the human body [7,8,9,10]. The existing vital sign detection algorithms are divided into two categories: fast Fourier transform (FFT)-based methods [11,12,13,14] and constant false alarm rate (CFAR)-based methods. The former mainly aims at detecting the quasi-periodic breathing signal, while the latter mainly aims at tracking the large-scale human movements. However, under normal circumstances, the behaviors of the human body also include non-periodic, small-amplitude movements, such as body shaking back and forth, and non-periodic breathing, causing the characteristics of the vital signs between quasi-static breathing and large-scale movements. Therefore, the FFT-based method often cannot accurately determine the target position, and the CFAR-based method is difficult to distinguish the target from the background. Generally, quasi-/non-periodic respiration frequency or weak respiration amplitude is considered as a quasi-static vital sign for the trapped human beings. Nowadays, the detection of non-periodic but non-weak micro-motion and the detection of quasi-periodic but weak micro-motion are the research hotspots and difficulties in the field of life detection. Detection of the quasi-static trapped human beings is widely needed and urgent in public security applications.
Recently, a large amount of research work on the detection strategies and radar systems in the field of vital signs detection has been reported. Table 1 lists the main parameters and characteristics of radars published in commercial and academic papers. The novel radar transceiver signal designs are proposed to obtain the higher signal-to-noise ratio (SNR) [15,16,17]. In through-the-wall scenes, the maximum detection distances of the doppler radar proposed in Reference [15], the frequency modulated continuous wave (FMCW) radar proposed in Reference [17] and the pseudo-random coded radar are 10, 10 and 17 m, respectively. The multiple input multiple output (MIMO)-based method uses a real aperture of multiple transceiver combinations, realizing instant imaging resolution [18,19,20,21,22], which is widely used in through-wall imaging. The multi-view and multi-station radar systems proposed in References [23,24,25,26] can improve the efficiency of rescue in low SNR scenes by combining radar data in multiple observation points. In Reference [24], the proposed dual-station radar system provides a practical integrated approach for detecting and localizing stationary human targets. However, the improvement of detection capability through the optimization of transceiver signal is limited for the mono-static radar. Meanwhile, the balance between the radar sensitivity and radar false alarm should be considered in the system design. On the other hand, due to a large number of antennas in the MIMO system, the system is complex and bulky, which is not convenient for the practical field operations. Studies show that the novel multi-view system can achieve high detection capabilities and strong scene adaptability simultaneously.
To sum up, most of the existing studies are optimized in a single aspect, such as increasing the detection range, realizing radar imaging and distinguishing between obscured targets, etc. In addition, the research on the signal detection of non-periodic but non-weak micro-motion is still an open question. So, the development of an UWB radar vital sign detection system that can flexibly perform multi-scene detection is becoming a priority, motivating the design of innovative radar systems and detection strategies in a combined way, increasing the rescue efficiency.
In this article, we aim to propose an effective detection strategy dealing with general and practical cases when there exist quasi-static trapped human beings. A novel Golay complementary coded UWB radar prototype system was designed to verify the proposed detection strategy. In the strategy, two different operating modes, including stationary operating mode and scanning operating mode, are adopted. The stationary operating mode is suitable for detecting the quasi-static trapped human beings with non-periodic but non-weak respiration, using one radar to achieve single observation points. The scanning operating mode is for the quasi-periodic but weak respiration, using several radars to achieve multiple observation points.
In the stationary operating mode, a novel detection method based on the cross-correlation in slow time domain is proposed, which is suitable for the non-periodic but non-weak micro-motion life detection scene. The cross-correlation operations on the slow-time observation data of a single radar are performed in this proposed method, which can enhance and extract components with similar echo characteristics in the measured area, achieving the accurate detection of the non-periodic but non-weak micro-motion targets. In the scanning operating mode, the novel deployed UWB radar system for rescuing trapped persons can take advantage of the distributed radar configuration, and the SNR of vital sign is improved compared to that of the traditional case, achieving the accurate detection of the quasi-periodic but weak micro-motion targets.
In summary, this article presents a flexible detection strategy including stationary and scanning operating mode, to detect two typical vital signs effectively, which are quite common in the actual rescue environments. Based on the developed UWB radar system with wireless networking, the authors make an interesting attempt in the actual rescue scene and introduce two typical vital signs in different scenarios, indicating that the UWB radar system has better scene adaptability.

2. Material and Methods

2.1. The UWB Life-Detection Radar Hardware System Design

2.1.1. The Golay Complementary Coded UWB Radar

The UWB life-detection radar has obvious advantages in the ability of anti-interference and long-range resolution. The pseudo-random coded signal modulated radar transmits a pseudo-random coded signal and performs pulse compression on the radar echo in the receiver to obtain the impulse response function of the target, achieving large transmission power and high range resolution simultaneously.
The choice of pseudo-random coded signal is a key issue in the design of this system. The existing coding methods include m-sequence, Gold sequence and Golay complementary sequence. Based on the previous research on the pseudo-random codes’ technology [16,27], the Golay complementary sequence is composed of coded signal A and coded signal B, and the autocorrelation functions of these two codes can eliminate the side lobes remarkably. The amplitude of signal peak can be double. The working process of the Golay complementary coded UWB radar is that the radar sequentially transmits the Golay coded signal A and the Golay coded signal B for the electromagnetic detection. The sum of two autocorrelations of Golay coded signal A and Golay coded signal B constitutes the radar’s fast scanning time.

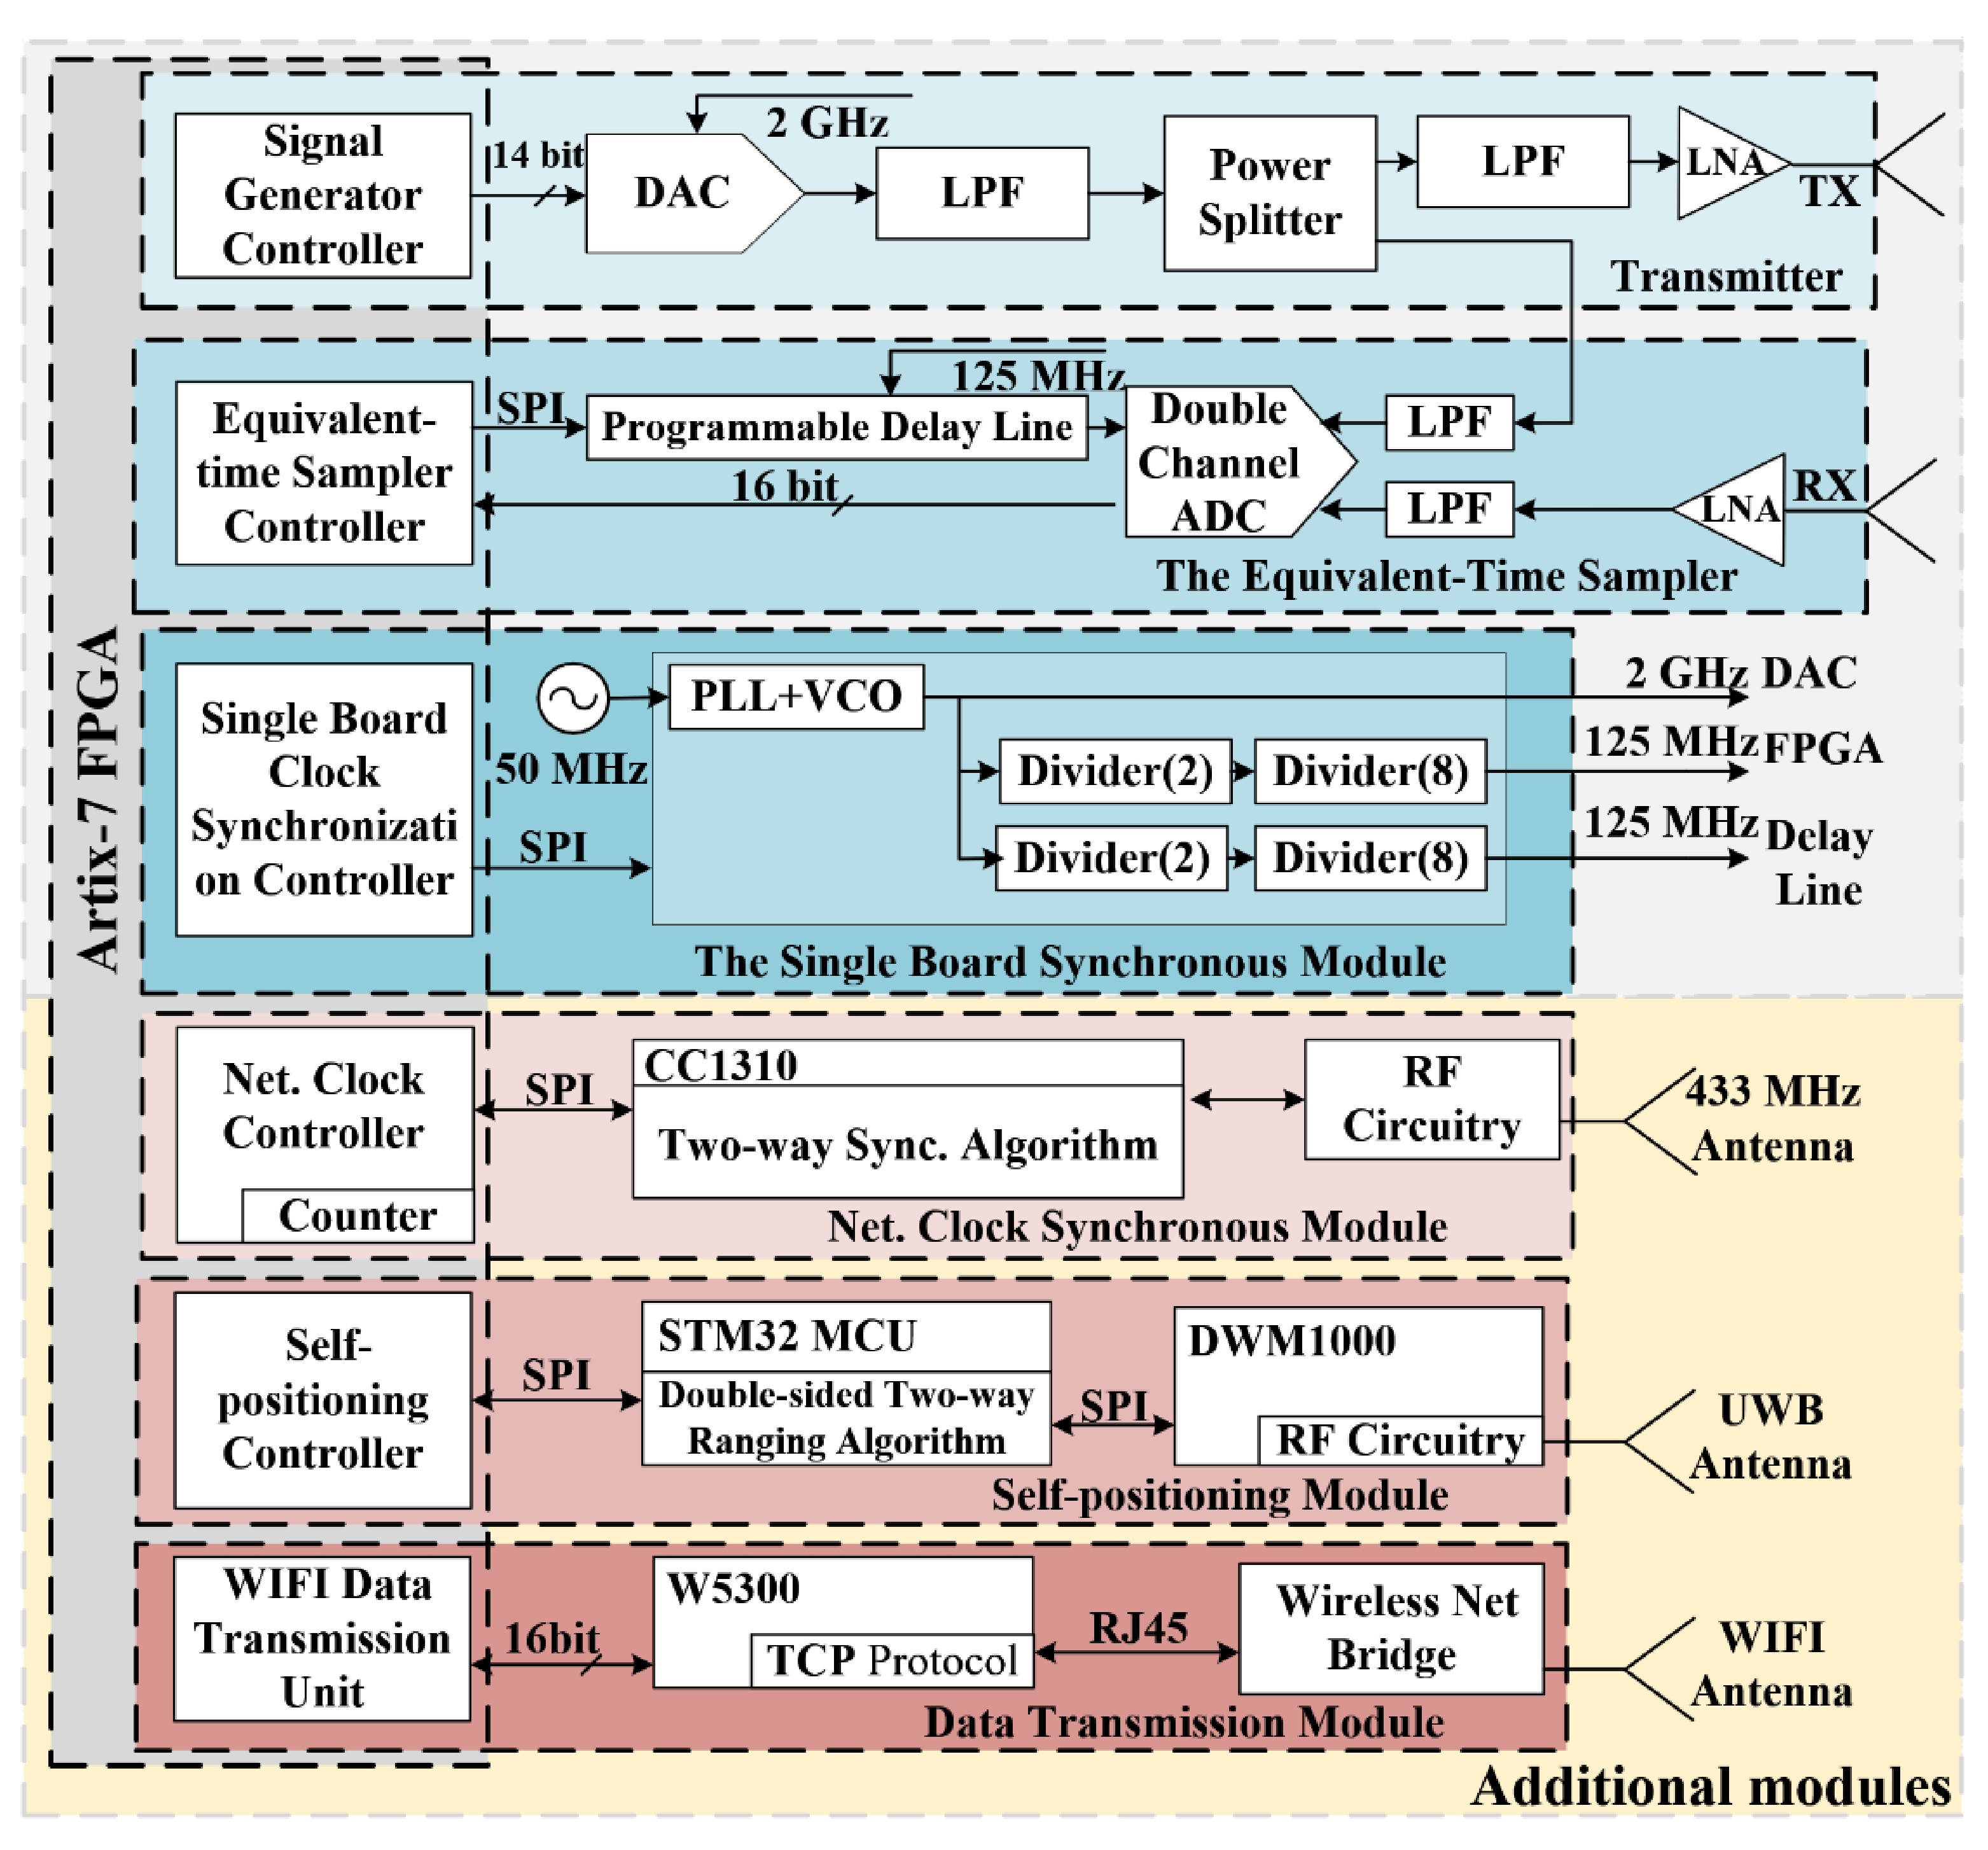
2.1.2. The Radar System

A novel Golay complementary coded UWB radar prototype system was designed to verify the proposed detection strategy. The prototype system contains several radars and a control host. The generation, transmission, reception of electromagnetic signal are integrated in the Golay-coded radars, while the human-machine interface, collaborative management, and data processing are handled by the control host. Each radar in the system has a full-featured transceiver, which can work alone at stationary operating mode. For the scanning operating mode, several additional modules would be activated for collaborative work, and the most important parts are network clock module and self-positioning module. By setting the time division multiplexing (TDM) architecture, the control host coordinates several radar nodes during the multiple observation points detection process to prevent mutual interference. All communication and control between radars are carried out wirelessly, and the number of observation points can be changed flexibly for different observation environments.

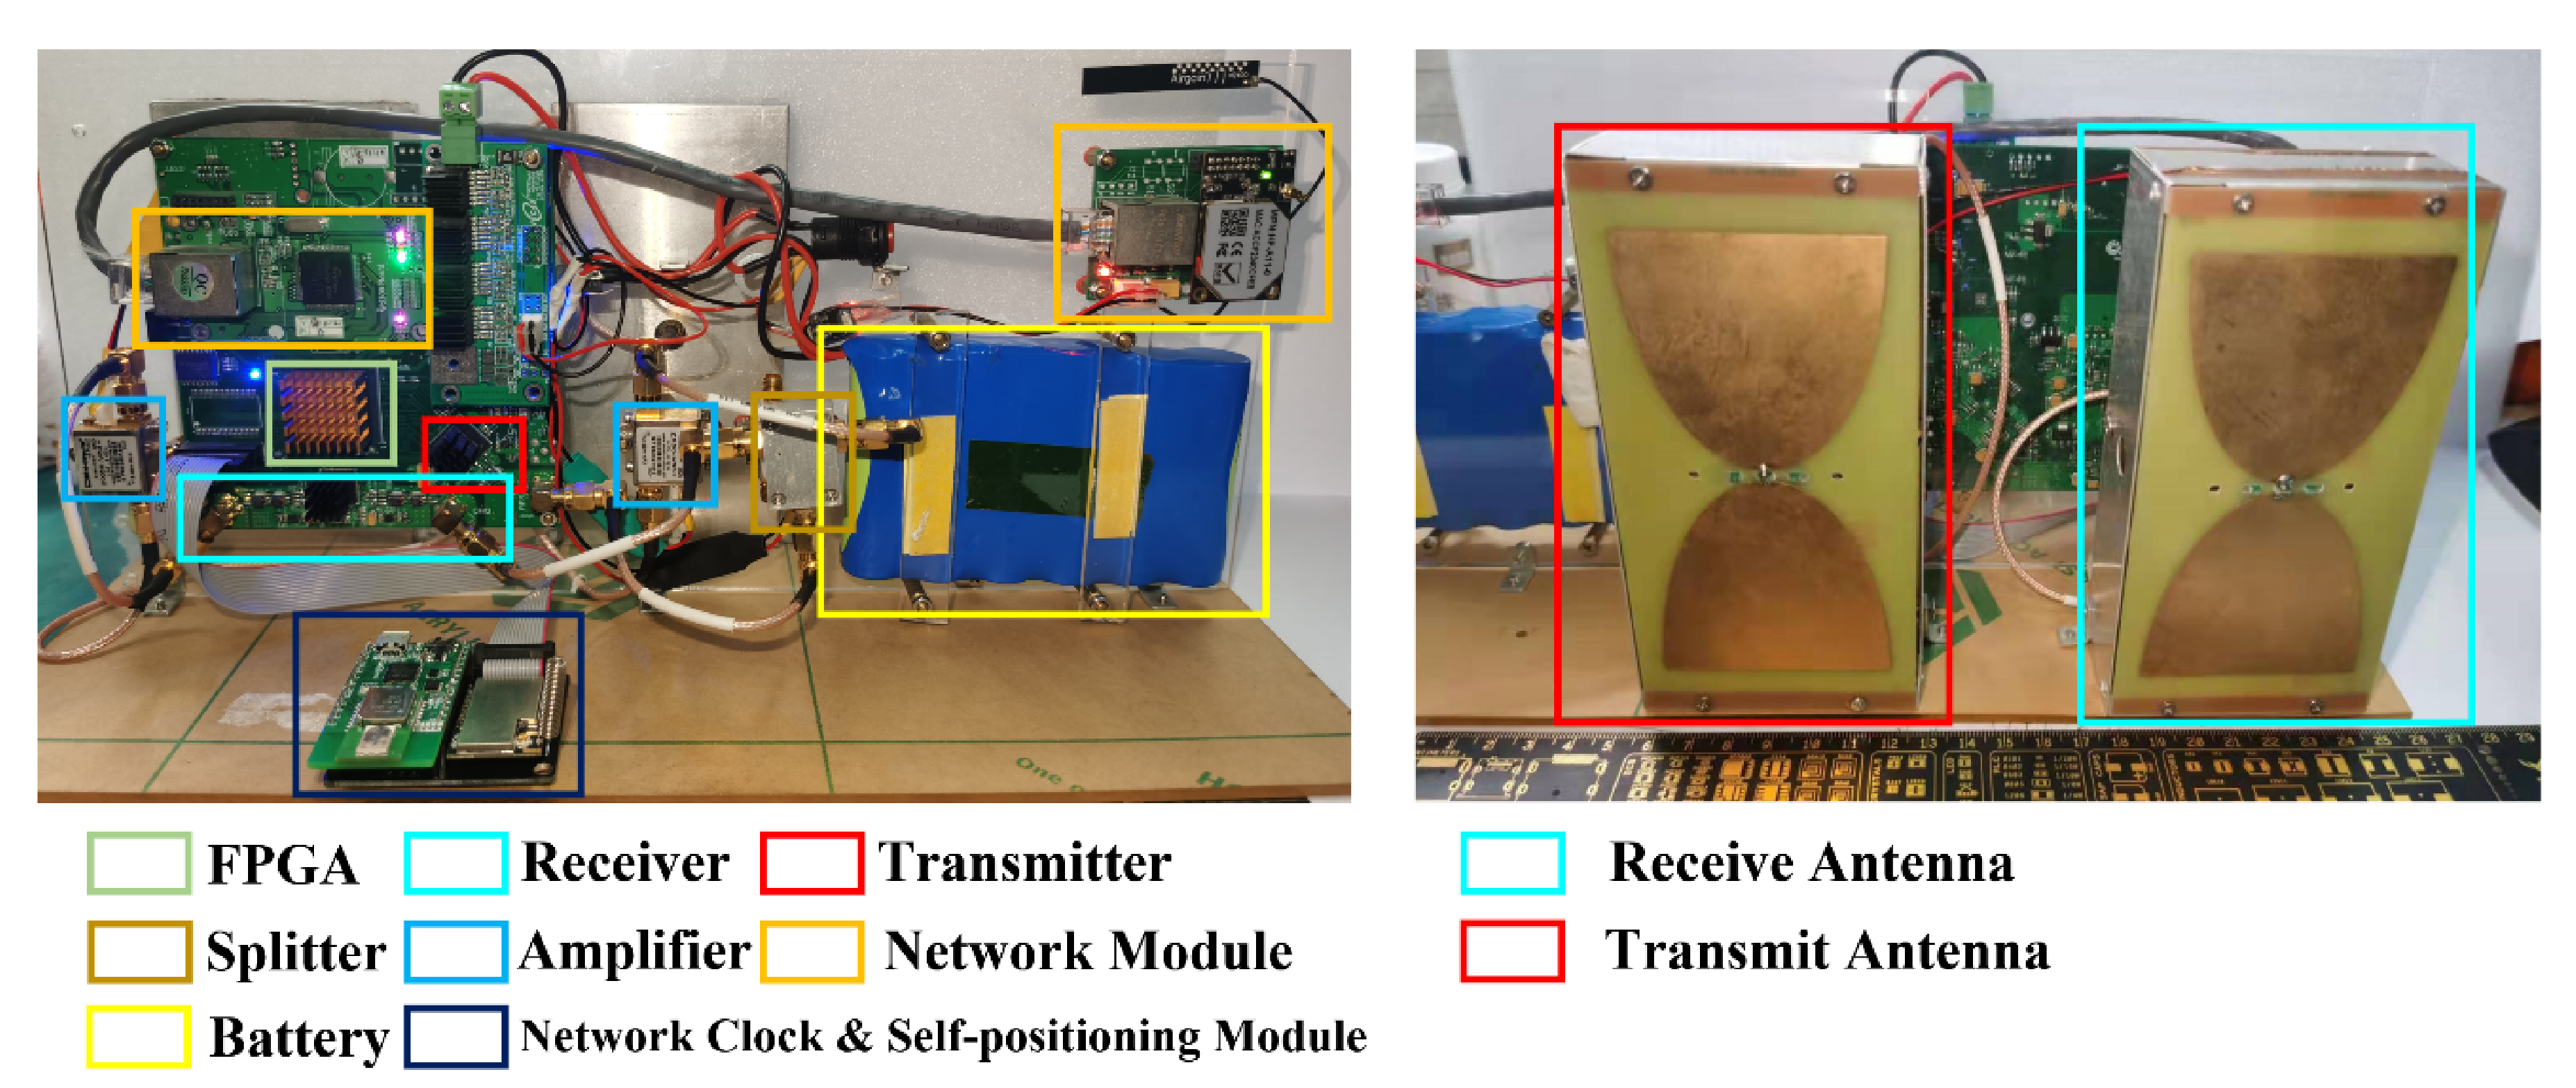
2.1.3. The Design of Single Golay-Coded Radar

The key components of the Golay-coded radar are a digital transmitter, a dual-channel receiver, a clock manager, a network clock, a self-positioning module and a wireless communication module, which are shown in Figure 1. The radar uses low sidelobes sinusoidal modulation Golay complementary coded signal with a center frequency of about 1 GHz as the transmit signal, which can improve the SNR [27,28,29,30]. To reduce the system cost and improve the spurious-free dynamic range (SFDR), the equivalent-time sampling technique is adopted. A Xilinx Artix-7 field-programmable gate array (FPGA) is used as the main control unit to manage the peripherals. A 16-bit analog to digital converter (ADC) with a maximal sampling rate of 160 million bits per second (Mbps) and a full-power bandwidth of 1.4 GHz is used for the receiver. A 14-bit digital to analog converter (DAC) at 2.5 Gigabit samples per second (GSPS) update rate is used for the transmitter. A W5300 chip is used for exchanging the raw radar data and commands with the control host by Transmission Control Protocol (TCP) network protocol, and the wireless bridge realizes the wireless communication. A pair of bow-tie antennas are used for electromagnetic radiation and reception. The prototyped radar system and its antennas is presented in Figure 2.

2.1.4. The Additional Modules for Scanning Operating Mode

In the scanning operating mode strategy, radars are deployed at different observation points with TDM architecture, executing electromagnetic detection in their own time slices. The network clock module and self-positioning module are adopted as additional modules to achieve the multiple observation points.
The network clock module avoids mutual interference between Golay-coded radars during the detection process via setting a time margin and executing wireless clock synchronization. Here, the module is designed based on Texas Instruments’ CC1310 chip and a counter in FPGA. The CC1310 provides a set of timers and taggers for radio operation by Sub-1 GHz technology. By sending and receiving synchronization requests twice, the modules can measure the difference value of the local network clocks between two Golay-coded radars via the two-way synchronization algorithm [31]. The measured values are used to correct the different initial offset. By executing wireless clock synchronization and setting the time margin as ~15 ms, different initial offset and clock drift between Golay-coded radars could be corrected.
The self-positioning module is deployed in each Golay-coded radar to sense the relative positions, as the relative positions are needed for the human respiration detection strategy. The automatic measure avoided manual measurement errors and time wasting. The DWM1000 is the critical component of the self-positioning module. It provides the function of timestamping and transmission times precise controlling and can be used in the two-way ranging with an error within 10 cm [32,33,34,35,36]. Here, the two-way ranging is realized by the double-sided two-way ranging algorithm executed in the STM32 Microcontroller Unit (MCU) to achieve the self-positioning of the Golay-coded radars.

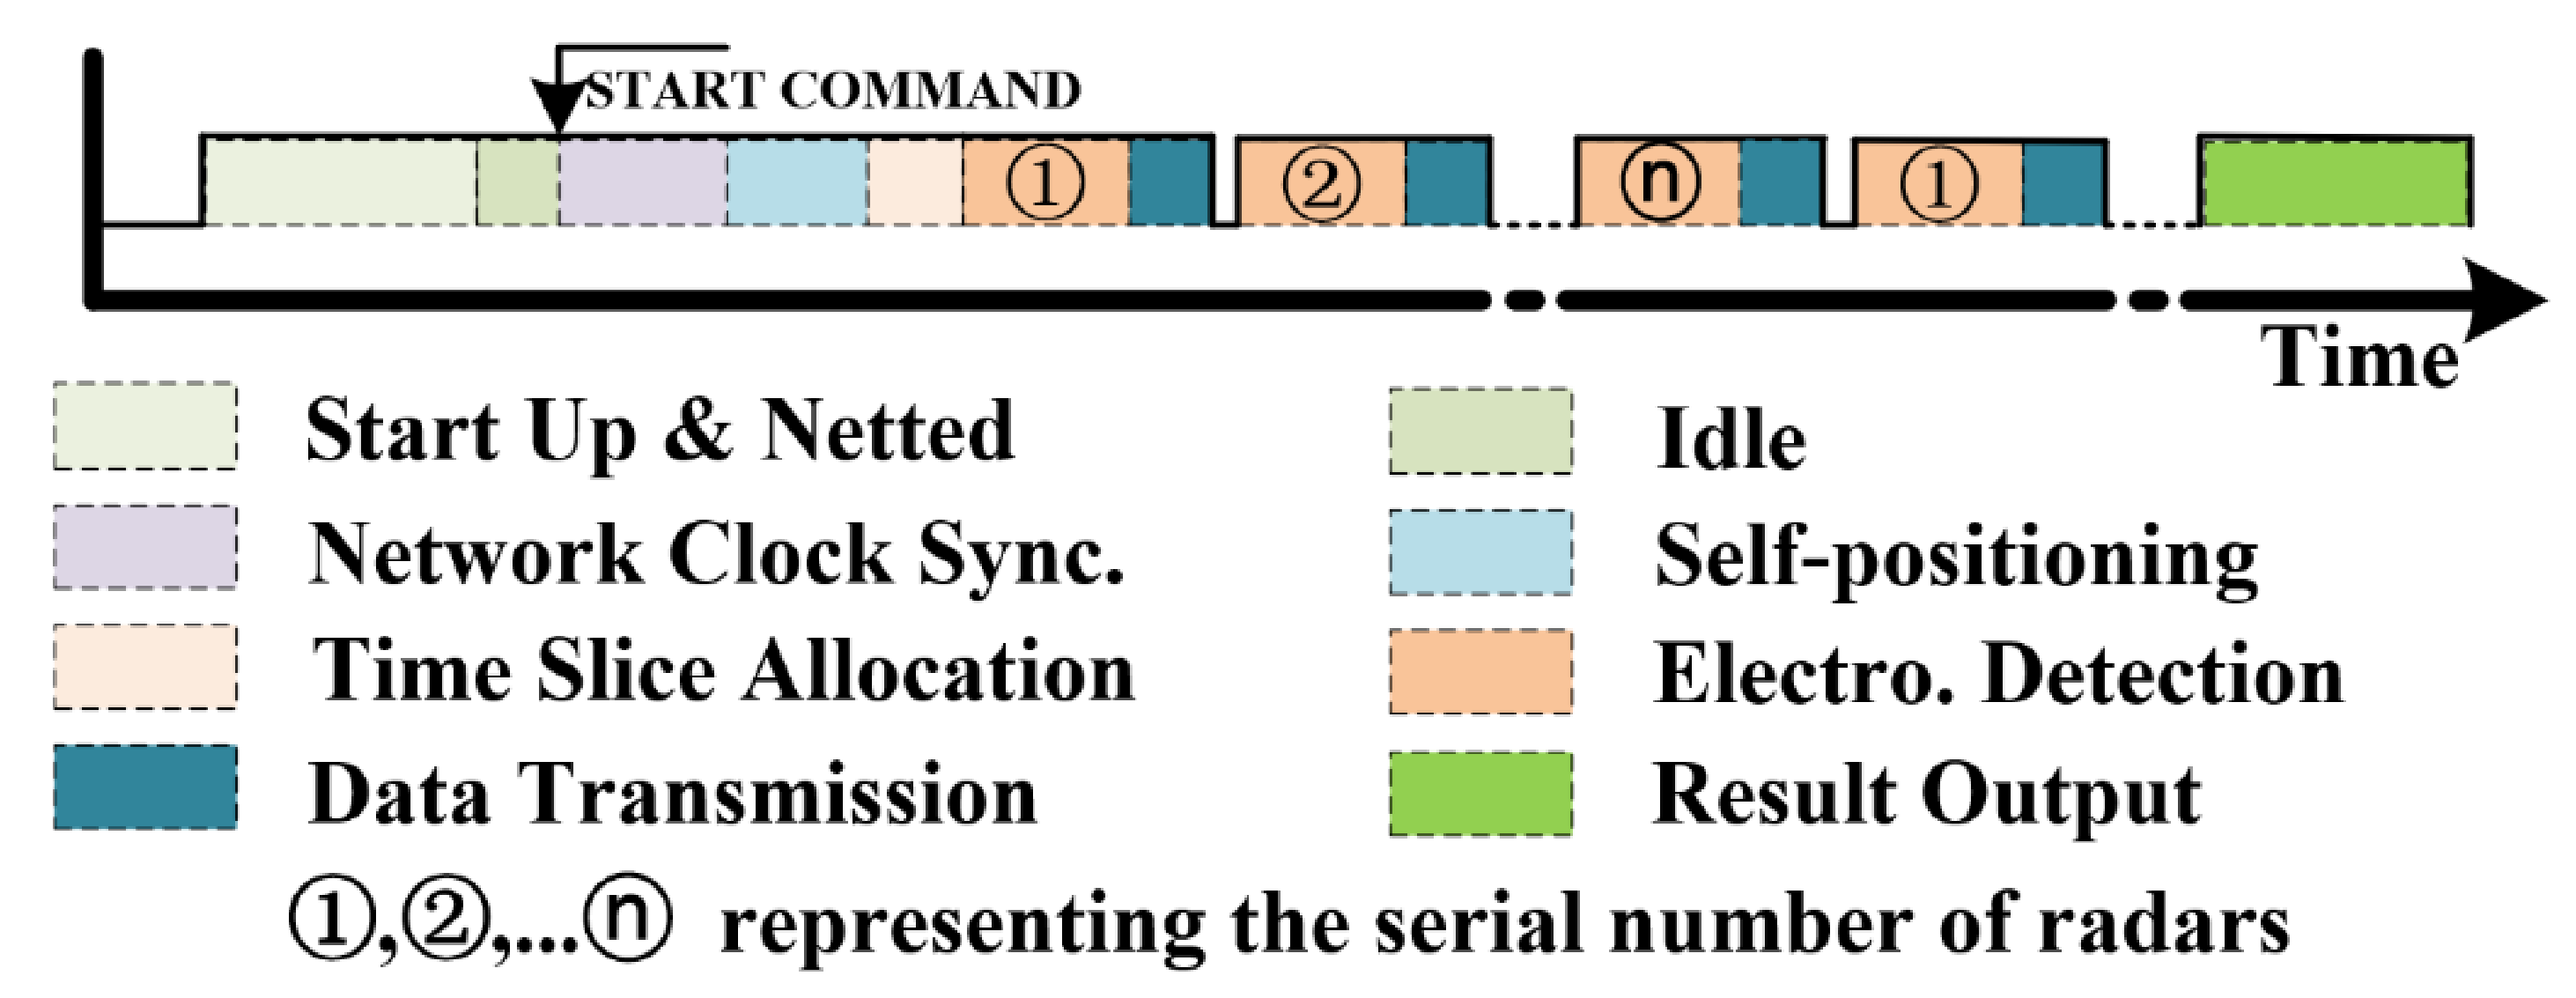
2.1.5. The Workflow for Scanning Operating Mode

The orderly collaboration between Golay-coded radars depends on the reasonable time slice management and workflow management, which are designed in accordance with the radar’s parameters in Table 2.
In the system’s workflow, each time slice for the Golay-coded radar contains an electromagnetic detection and a data transmission. According to Table 2, the corresponding time consumption is about 17 ms for UWB A-scan and about 6 ms for data transmission. It means the minimum time slice is about 23 ms. Here, we set the time slice as 32 ms, and retained the time margin for wireless transmission and the network clock module.
To understand the orderly collaboration between radars, the workflow timing is presented in Figure 3. The scanning operating detection work starts from the radars and control host netted. After receiving the “START COMMAND,” the control host orders radars’ run network clock synchronization and relative position measurement, then calculates the topology’s rationality and allocates the time slice. The radars perform electromagnetic detection and upload data within their time slice. Finally, after 16 s of detection, the host calculates the target’s position and displays the results via human–machine interface.

2.2. Vital Sign Detection Using a Mono-Static UWB Life-Detection Radar

2.2.1. Background

For one UWB radar detection, the received signal S t with the respiration of a human target can be expressed as:
S t = n = 0 N 1 u t n T τ r h r t   + n = 0 N 1 p = 1 , p r P u t n T τ p h p t + γ t + ω t    
where ∗ means convolution, u t   means the radar transmitted signal, t means fast-time, slow-time is discrete with n T , on which the reflected signal is received, and T is the adequate pulse repetition time (PRT). h r t means the respiration response of the human target and h p t means the joint impulse response of transmitting antenna, receiving antenna and P 1 static objects. τ r and τ p mean the propagation time-delay of the human target and the p th object, respectively. γ t is the non-stationary inference and ω t is the additive white Gaussian noise.
To avoid frequency aliasing and range ambiguity, T should satisfy the Nyquist sampling theorem and ensure that all the reflected signals of targets are received during a PRT. All discrete signals of the reflected signals can be expressed as a two-dimensional (2D) (fast-time and slow-time) M × N matrix S m ,   n :
S m , n = h m , n + c m , n + γ m , n + ω m , n
where M means the number of fast-time sampling points and m = 0 , 1 , , M 1 , N means the number of slow-time sampling points and n = 0 , 1 ,   , N 1 . Every term in (2) corresponds to that in (1). Matrix S m ,   n is named slow-time range matrix, where the column represents the range dimension and the row represents the slow-time dimension, respectively.

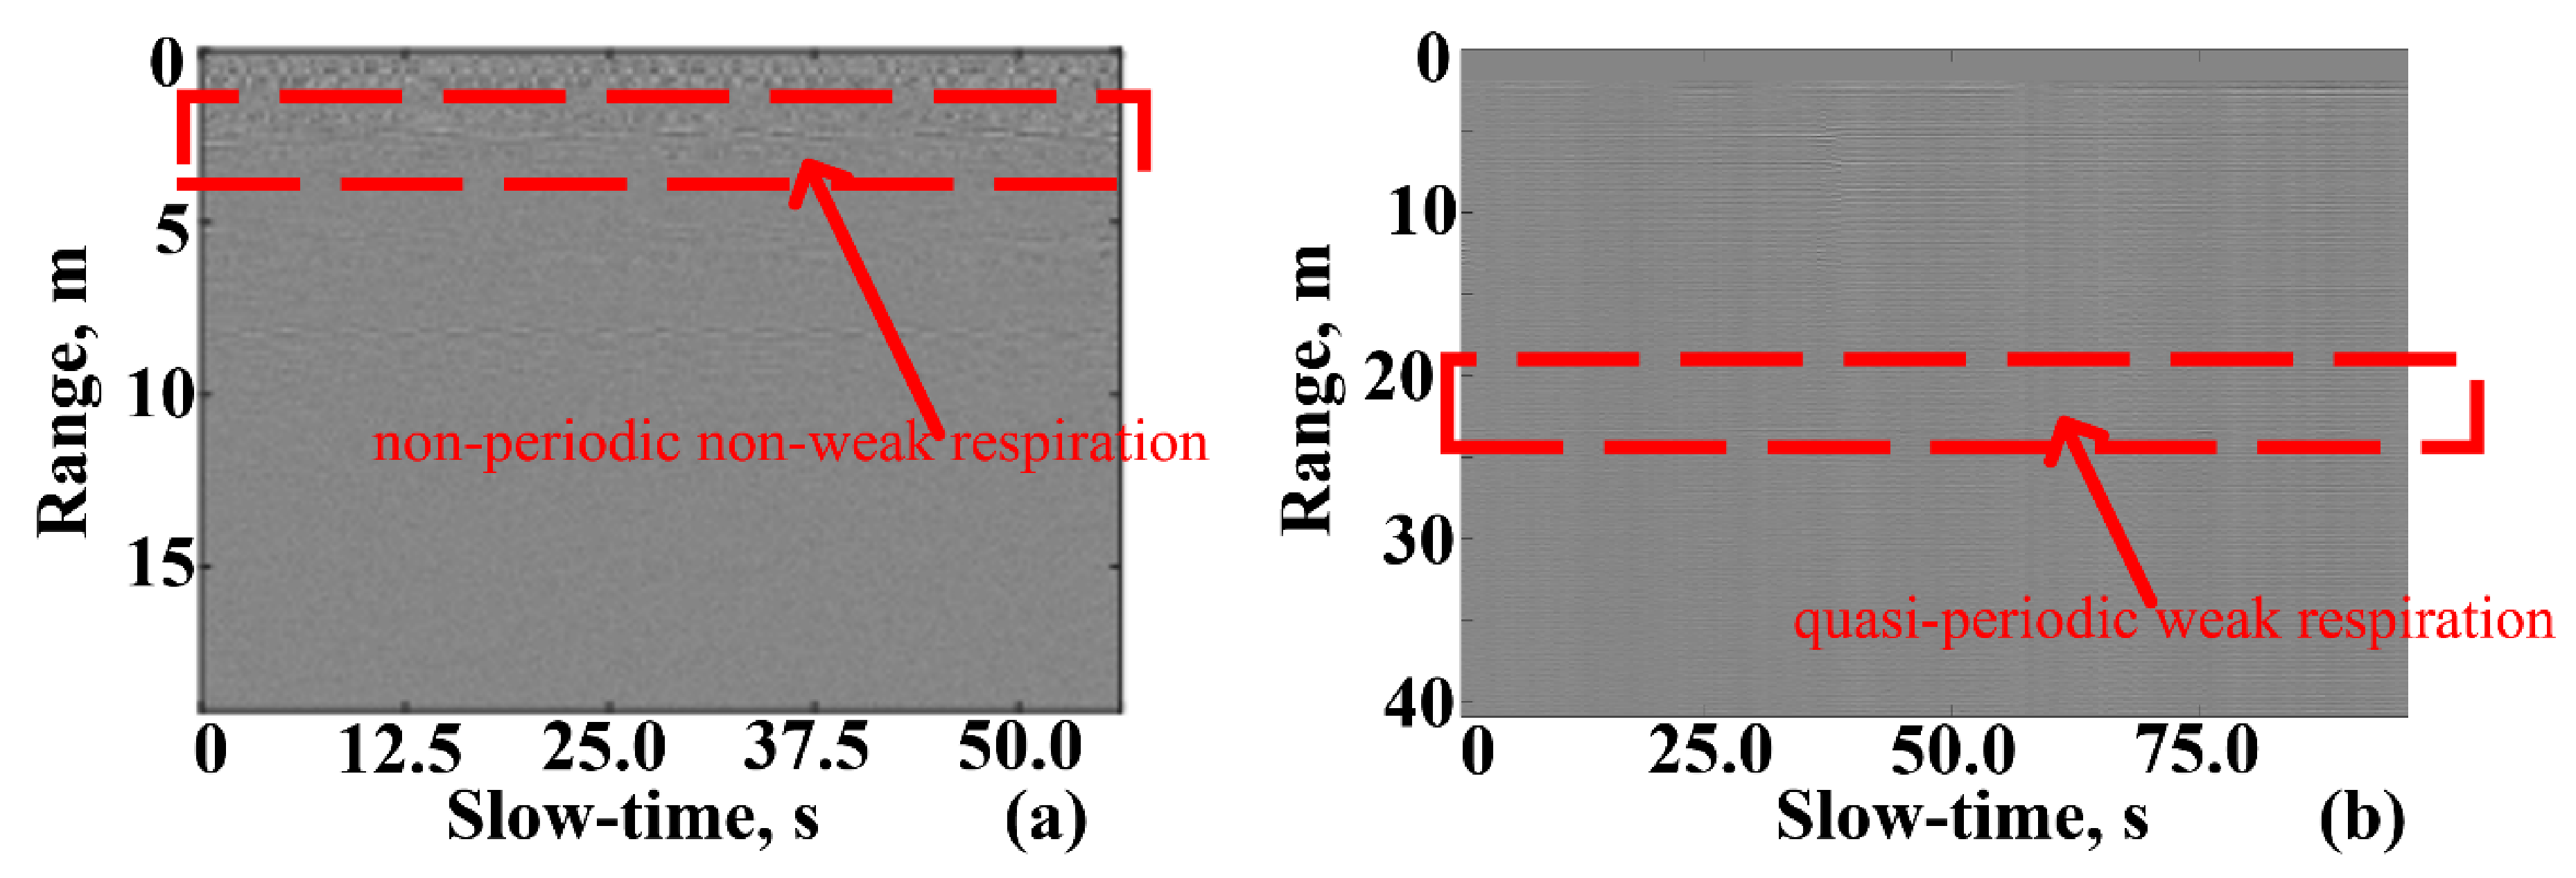
2.2.2. Two Types of Vital Signs

In this section, we introduce two types of vital signs, which are explained in detail below.
The first vital sign is defined as “non-periodic non-weak respiration”. When humans stand for a long time or are emotionally stressed, humans are likely to perform body shaking, irregular micro-movements and other behaviors, the corresponding radar echo signals show aperiodic and large amplitude characteristics. A radar slow-time range matrix including this type of vital sign is show in Figure 4a (in the red frame). Micro-motion response of the target can be seen obviously, but it is aperiodic. The target position calculated by the traditional FFT method has a large error, because the spectrum of aperiodic life signals is not constant. In contrast, the location of target can be estimated accurately by the proposed stationary operating mode.
The second vital sign is defined as quasi-periodic weak respiration. When a living body is unconscious or injured, the breathing amplitude tends to be decreased, and the corresponding respiration responses show the characteristics of quasi-period and small amplitude. The slow-time range matrix including this type of vital sign is shown in Figure 4b (marked in the red frame). The micro-movement of the target cannot be observed directly from the radar echoes, and it is difficult to effectively detect the target using a single radar. Due to the low signal-to-noise ratio, the target position cannot be estimated by the traditional FFT method. Notably, the scanning operation mode proposed in this paper can enhance the weak respiration response using the echoes from multiple radar observation points, improving the signal-to-noise ratio to obtain the target’s precise position.

2.2.3. Algorithm for Stationary Operating Mode

To remove respiration response from static objects around the human test subject, the time-invariant background must be estimated and subtracted from the measured data. Different approaches for estimating the static background have been proposed in Reference [37]. However, in cases where people are detected according to their micro-movement, respiration or cardiac activity, the reflected signals contained in measured radar echoes have the same time-delay and are always misinterpreted as static clutter using the background subtraction methods. Thus, people are almost invisible under these circumstances. To overcome this drawback, the adaptive background subtraction (ABS) method based on the exponential averaging and a vector of weighting coefficient α can be used [38].
p n m = α n m × p n 1 m + 1 α n m × q n m M × 1
Here, p n m and q n m are one-dimensional (1D) vectors with the size and contain ‘sampled background estimation’ and ‘measured impulse response’ in the raw echo matrix S m ,   n , respectively. M is the number of fast-time sampling points and m = 0 ,   1 ,   , M 1 , N is the number of slow-time sampling points and n =   0 ,   1 ,   , N 1 . The new background estimation takes a fraction of the previous estimation and a fraction of the measured radar echo. The time-variant weighted coefficient α , which has the size M × 1 , can be adjusted between 0 and 1 adaptively. According to Reference [38], α = 0.95 has a reasonable balance between background attenuation and micro-movement reservation.
According to (2), denote Sraw(k, m) as the slow-time range matrix obtained at a single observation point, where k = 0, 1,…, K−1 is the range cell index, and m = 0, 1,…, M−1 is the slow-time index. To eliminate the responses from static objects around the trapped human being, the time-invariant clutter/interference has to be estimated and subtracted from the slow-time range matrix, Sraw(k, m), using the pre-processing method, including the adaptive background subtraction, the linear trend suppression and the advance normalization (AN) [39]. The corresponding output slow-time range matrix is S(k, m), and it can be used to estimate the almost unchanged distance from the UWB life-detection radar for the quasi-static trapped human beings with non-periodic but non-weak respiration by the proposed detection method based on the ordered statistics constant false alarm rate (OS-CFAR) method. In Figure 5, we define xm, qm and zm as the mth column vector, adjacent cancellation vector and background subtraction vector of S(k, m), respectively. Define bm as the mth background, which can be estimated by bm−1, zm and the scale weighted factor a m as follows.
q m   =   x m     x m 1
z m   =   x m     b m 1
b m   =   b m 1   +   ( 1     a m 1 ) · z m
a m   ( k ) =   1   ,   k     s m   or   k     p m a m   ( k ) =   a   ,   otherwise
where k = 0, 1,…, K–1 is the range cell index. According to Reference [38],   α = 0.95 is the empirical constant scale weighted factor [39]. sm is the correlation output between the last output sm-1 and the OS-CFAR output s0m. Generally, with zm being the input of the OS-CFAR method, s0m might contain all the possible distances of the quasi-static trapped human beings away from the UWB life-detection radar. As the OS-CFAR method is the threshold-dependent method, some distances might be produced by the clutters or other interferences. Therefore, the correlation output sm is designed to eliminate these wrong distances. The estimated distances in s0m are assumed to be from the quasi-static trapped human beings in the case that the correlation between s0m and sm-1 equals to non-zero. The calculation of the correlation output pm follows the same way as sm:
s m ( i ) = s 0 m ( i ) s . t . E { s 0 m ( i ) s m 1 ( i ) } 0   s m   ( i )   =     s . t .   E { s 0 m   ( i ) · s m 1   ( i ) } = 0
p m ( j ) = p 0 m ( j ) s . t . E { p 0 m ( j ) p m 1 ( j ) } 0   p m   ( j )   =     s . t .   E { p 0 m   ( j ) · p m 1   ( j ) } = 0
where i = 1, 2,…, S is the index of s0m and j = 1, 2,…, P is the index of p0m. S and P are the number of the estimated distances in s0m and p0m, respectively. Finally, sm is used to determine the locations of the single/multiple quasi-static human beings dynamically by an online clustering algorithm. Clusters representing the quasi-static trapped human beings are updated as streaming samples in sm come in, and the center of each cluster is identified as the location of each quasi-static trapped human being.

2.2.4. Algorithm for Scanning Operating Mode

For the quasi-static trapped human beings with quasi-periodic but weak respiration, we denote Si(k, m) and Sj(k, m) as the output slow-time range matrices obtained from the ith and jth (ij) observation points after eliminating the time-invariant clutter/interference, respectively. Due to the fact that the cross-correlation function of the non-periodic noise is prone to zero, the cross-correlation between Si(k, m) and Sj(k, m) is applied to improve the low signal-to-noise ratio (SNR). However, the quasi-periodic component and its harmonic components contained in the slow-time signal Si(k, m) and Sj(k, m) are still preserved. Assume that the size of Si(k, m) and Sj(k, m) are Ku × Ma and Kv × Mb, respectively. The cross-correlation function Rij(u, v, m) is defined as:
R ij ( u ,   v ,   m )   =   E { S i ( k i=u   ,   m a ) · S j ( k v   ,   m b ) }
R         ij AN ( u ,   v ,   m )   =   max m { R ij ( u ,   v ,   m ) } · AN m { R ij ( u ,   v ,   m ) }
where the range cell index ku ∈ [0, Ku – 1] and kv ∈ [0, Kv – 1], the slow-time cell index ma ∈ [0, Ma – 1], mb ∈ [0, Mb – 1] and m = mamb. Then, the AN method is applied to Rij(u, v, m) so that the weak quasi-periodic component of the quasi-static trapped human being can be further enhanced. We denote the output result of the AN method as RANij(u, v, m). The Fourier transform of RANij(u, v, m) is taken in each slow-time dimension, and the maximum corresponds to the quasi-static trapped human being, i.e., (uimax,vjmax) indicates the possible range location of the quasi-static trapped human being depending on the different ith and jth observation points:
( u i max , v j max )   =   argmax uv { FFT m { R         ij AN ( u ,   v ,   m ) } } ,   u     v

3. Experimental Results

3.1. Experimental Results for Stationary Operating Mode

In the experiment shown in Figure 6, three human test subjects with non-periodic but non-weak respiration stood at 3, 5.5 and 10 m behind a wall, of which the thickness and the measured average dielectric constant are 24 cm and 4.93, respectively. The non-periodic but non-weak echo responses (marked by three red arrows) can be seen in the pre-processing slow-time range matrix depicted in Figure 7a. Due to the non-periodic, the vital sign features obtained by FFT (vital sign features (VSFs) marked by three red arrows in Figure 7b) are blurry, which is not suitable for the subsequent VSFs decision. However, as for the non-weak echo responses in amplitude, the proposed detection method based on the OS-CFAR method for stationary operating mode works well. As shown in the left part of Figure 8, the range locations of three human test subjects are detected and updated as slow time goes on. The conclusive range locations are determined by the online clustering algorithm (see the right part of Figure 8).

3.2. Experimental Results for Scanning Operating Mode

To comprehensively compare the improvement of the measurement sensitivity and specificity with that of previous studies, two laboratory experiments (named as the type-I and type-II experiments) and two practical experiments were carried out. Two Golay-coded radars were used to verify the proposed scanning operating mode. For simplicity, the two radars are labeled as No. 1 and No. 2 radars, respectively.

3.2.1. The Type-I Experiment

As shown in Figure 9, the type-I experiment was carried out in an office building, and two Golay-coded radars were placed on the same side of the 1 cm gypsum board, 1.8 m apart. The tested object was placed at the different distances from 5 to 51 m, with a 2 m interval.
Considering the uncontrollable breathing movement of personnel, we selected the metal plate beacon as the tested object to ensure the data consistency during the collection of radar echoes. To simulate the chest movement of the human body, the metal plate beacon was controlled by a screw stepper motor to drive the metal plate to vibrate periodically, as shown in Figure 10. In the type-I experiment, the metal plate beacon’s vibrating frequency was set as 0.28 Hz, and the amplitude was set as 1 cm.
Both the proposed “scanning operating mode” and the “FFT-based respiration detection method [29]” were applied to the collected radar echoes. The corresponding measurement results are shown in Table 3. The detection errors of the experiment for No. 1 and No. 2 radars are shown in Figure 11a,b, respectively. The blue error bars represent the detection errors of single-radar detection results via the “FFT-based respiration detection method”. The red error bars represent the detection errors via the “scanning operating mode”. In addition, the blue ‘×’ indicates the failure detection case.

3.2.2. The Type-II Experiment

To study the influence of the angle between people and radar on the observation results, we designed the type-II experiment including three measurements of A, B and C, which were carried out in our institute’s stadium. The experimental setup is shown in Figure 12, and the two radars were placed on the same side of a 37 cm brick wall, 1.8 m apart.
In the measurement A, the person under test stays still and breathes normally, standing 22 m behind the wall and at the center of the horizontal line of the two radars. Define the center of the horizontal line of the two radars as the center of the system. The center of the system and the subject are on the same horizontal line, so the angle between people and radars is 0°. The “scanning operating mode” is used to detect the vital signal, combining the data from two radars.
Figure 13a,b shows the output range-frequency images of the normal FFT-based respiration detection methods using the echoes from a single radar. Due to the low SNR in this experimental scene, the output range-frequency images are too noisy to distinguish the vital sign feature (VSF).
According to our proposed “scanning operating mode”, the cross-correlated range × range two-dimensional (2D) image is shown in Figure 13c, and the VSF is remarkable. In Figure 13d, the positioning result calculated by the radar system is compared with the actual position of the person. The red circle represents the actual position of the person, the blue × represents the estimated location through the “scanning operating mode” and the positioning error is 46 cm.
In the measurement B, the tested person with static state and normal breathing stands 22 m behind the wall and moves horizontally to the left by 3 m. The angle between people and radars is 7.84°.
Figure 14a,b shows the output range-frequency images of the normal FFT-based respiration detection methods using the echoes from a single radar. Similarly, they are too noisy to distinguish the VSF. According to our proposed “scanning operating mode”, the cross-correlated range × range 2D image is shown in Figure 14c, and the VSF is remarkable. The comparison results of the positioning result calculated by the radar system and actual position of the person are shown in Figure 14d, and the positioning error is 25 cm.
In the measurement C, the tested person stands 22 m behind the wall and moves horizontally to the left by 5 m, also in a static state and breathing normally, and the angle between people and radars is 13.14°.
Figure 15a,b shows the output range-frequency images of the normal FFT-based respiration detection methods using the echoes from a single radar. Similarly, they are too noisy to distinguish the VSF. According to our proposed “scanning operating mode”, the cross-correlated range × range 2D image is shown in Figure 15c, and the VSF is remarkable. The comparison results of the positioning result calculated by the radar system and actual position of the person are shown in Figure 15d, and the positioning error is 21 cm.

3.2.3. The Ruins Experiment

In the actual ruin scene shown in Figure 16, detecting the tested human subject buried by real ruins and debris is carried out in the China National Training Base for Urban Search and Rescue. Two Golay-coded radars are placed on the third floor with the interval of 2 m. The tested human subject lies on the first floor while breathing weakly and quasi-periodically. The distances between him and the No. 1 and No. 2 radars are 3.7 and 3.59 m, respectively. There are various bricks, metals and woods in the test environment, especially on the second floor.
For the scanning operating mode, the UWB life-detection radar was placed on two different observation points. The VSF might not be found using the FFT results for the first (Figure 17a) and second (Figure 17b) observation points. However, as the quasi-periodic characteristic, the proposed detection method for scanning operating mode gives the workable result, which makes the subsequent VSF decision easy (Figure 17d). The range locations of D1 = 3.66 m and D2 = 3.60 m corresponding to the first and the second observation points are consistent with the actual situation.

3.2.4. The Multistorey Building Experiment

Another practical experiment was carried out in a multistorey office building to test the performance of the designed radar system. The two Golay-coded radars are placed on the ground of the fifth floor of a laboratory building (Figure 18a) and the tested objects are located at the ground of the fourth floor (Figure 18b). The height between floors of this building is 5 m. The tested people lay still on the fourth floor, breathing normally. The distances between the target and the radar No. 1 and No. 2 are 5.35 and 5.41 m, respectively.
Figure 19a,b shows the output range-frequency images of the normal FFT-based respiration detection methods using the echoes from a single radar. Due to the low SNR in this experimental scene, the output range-frequency images are too noisy to distinguish the VSF. According to our proposed “scanning operating mode”, the cross-correlated range × range 2D image is shown in Figure 19c. The resultant VSF is remarkable, showing that the distances between the target and the radar No. 1 and No. 2 are D1 = 5.30 m and D2 = 5.34 m, respectively.

4. Discussion

In this article, we presented an effective detection strategy, including stationary operating mode and scanning operating mode, dealing with general and practical cases when there exist quasi-static trapped human beings.
Based on the experimental results for stationary operating mode, the proposed radar system with the “stationary operating mode” shows excellent VSF detection performance for non-periodic but non-weak micro-motion targets.
Based on the type-I experiment, the conclusions can be summarized as follows:
(1)
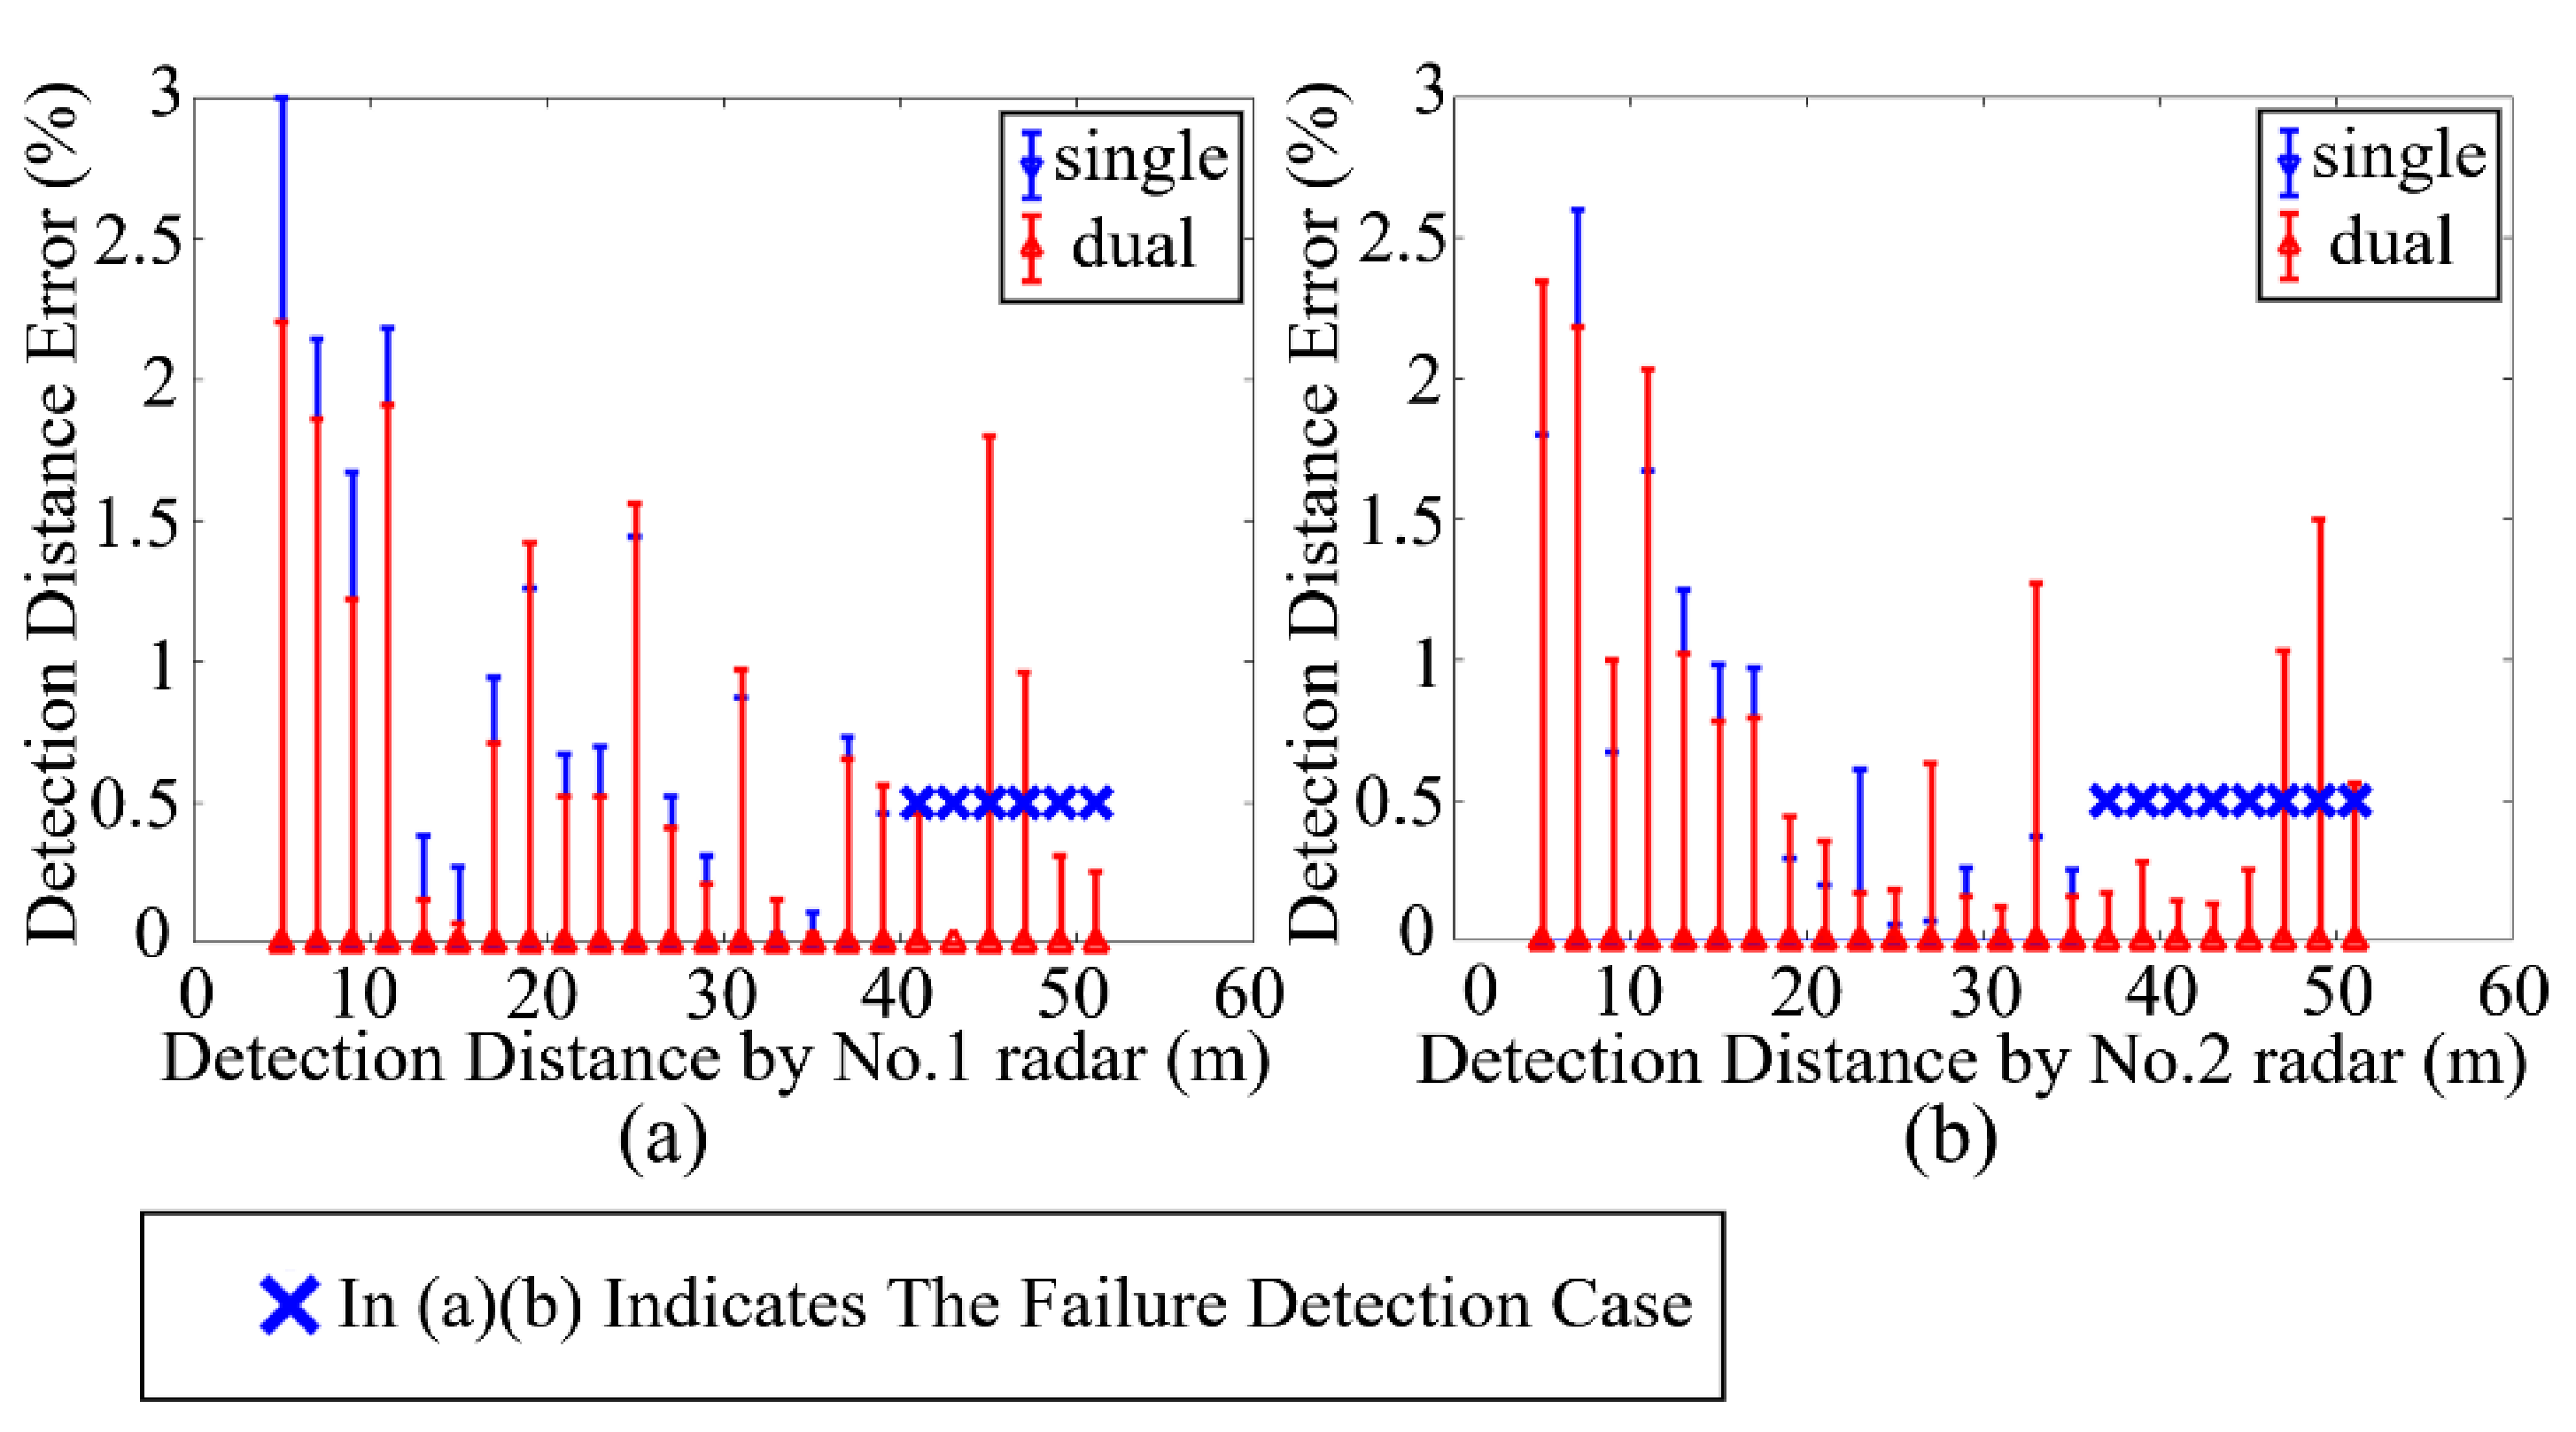
 When the distance between the beacon and the Golay-coded radar is within 35 m, compared to the “FFT-based respiration detection method”, the “scanning operating mode” always gives the results with higher accuracy.
(2)
 When the distance between the beacon and the Golay-coded radar ranges from 37 to 39 m, the No. 2 radar fails to locate the target using the “FFT-based respiration detection method”. Notably, the “scanning operating mode” can avoid the misjudgment to give the correct result.
(3)
 The most attractive case: When the distance between the beacon and the Golay-coded radar is longer than 41 m, the “FFT-based respiration detection method” fails to provide the correct location of the target due to the two failure observation points, while the “scanning operating mode” can still work.
Based on the type- II experiment, for the target located 22 m behind the wall, using a single radar to detect the vital signs is prone to failures and false alarms. In contrast, using the “scanning operating mode” proposed in the paper can provide accurate positioning results.
Based on the two practical experiments, the proposed radar system with the “scanning operating mode” showed excellent VSF detection performance in practical complex rescue environments.
In addition, for the scanning operating mode, based on the wireless control, the novel deployed UWB radar system for rescuing trapped persons can take advantage of the distributed radar configuration, where several Golay-coded radars are deployed on a 2D observation aperture and controlled in the network to capture information from all possible wave incident and scattering angles. Specifically, for the mono-static UWB radar at one observation point, the transmitter illuminates the target area, and the receiver collects the scattered field depending on the position of the observation point and the current posture of the trapped person. On the one hand, the SNR of vital sign is improved compared to that of the traditional case. On the other hand, different from the traditional 1D range information obtained from the observation point, the 2D azimuth locations of the trapped persons can also be obtained from the echoes received at different observation points, which can improve the rescue efficiency remarkably.
The choice of the two modes introduced in this article depends on the actual application scenario. In practical applications, the environment is completely unknown for the operators. The traditional detection strategy using the single-station quasi-static mode or the FFT method are firstly selected to detect the area of interest. If the target cannot be detected, the new detection strategy described in this paper is worth trying. The scanning mode combining multiple radars and multiple observation echoes is selected to detect the potential targets in the measured area. If the target has not been detected, it may be indicated that there is no target, or the vital signal is too weak to be extracted.

5. Conclusions

Through the stationary or scanning operating mode of the mono-static UWB life-detection radar, the two different methods proposed can deal with the cases when there exist quasi-static trapped human beings. The stationary operating mode can enhance and extract components with similar echo characteristics in the measured area by cross-correlation in the slow-time domain, achieving the accurate detection of the non-periodic but non-weak micro-motion targets. The scanning operating mode can enhance and extract components with similar echo characteristics in the measured area by distributed radar deployment, achieving the quasi-periodic but weak micro-motion targets’ accurate detection. A set of experiments show that the system has excellent performance in terms of detection range, scene adaptability and target distribution. The author made an interesting attempt in the actual rescue scene, indicating that the UWB radar system has better scene adaptability. Experimental results demonstrate the effectiveness of the proposed methods for detecting the weakly or quasi-/non-periodic echo responses of the trapped human beings.

Author Contributions

The research was performed by the authors as follows: Conceptualization, K.Y.; methodology, K.Y. and S.W.; software, K.Y. and S.W.; validation, K.Y.; formal analysis, S.W.; investigation, K.Y. and G.F.; resources, G.F.; data curation, K.Y.; writing—original draft preparation, K.Y.; writing—review and editing, S.W.; visualization, K.Y.; supervision, G.F.; project administration, S.W.; funding acquisition, G.F. All authors have read and agreed to the published version of the manuscript.

Funding

This research work was supported by the National Science Foundation of China under Grants 61971397 and 61501424. The authors wish to express their gratitude to the editor and the anonymous reviewers.

Institutional Review Board Statement

Not applicable.

Informed Consent Statement

Not applicable.

Conflicts of Interest

The authors declare no conflict of interest.

References

  1. Yilmaz, B.; Ozdemir, C. A Radar Sensor Design and Prototype for Through-the-wall Imaging Radar Applications. In Proceedings of the Radar Methods & Systems Workshop IEEE, Kiev, Ukraine, 27–28 September 2016; pp. 60–63. [Google Scholar] [CrossRef]
  2. Qiu, L.; Jin, T.; He, Y.; Lu, B.; Zhou, Z. Sparse and low-rank matrix decomposition based micro-motion target indication in through-the-wall radar. Electron. Lett. 2017, 53, 191–192. [Google Scholar] [CrossRef]
  3. Wang, X.; Li, G.; Liu, Y.; Amin, M.G. Two-level block matching pursuit for polarimetric through-wall radar imaging. IEEE Trans. Geosci. Remote Sens. 2018, 56, 1–13. [Google Scholar] [CrossRef]
  4. Song, Y.; Hu, J.; Chu, N.; Jin, T.; Zhang, J.; Zhou, Z. Building layout reconstruction in concealed human target sensing via UWB MIMO through-wall imaging radar. IEEE Geosci. Remote Sens. Lett. 2018, 15, 1199. [Google Scholar] [CrossRef]
  5. Tivive, F.H.C.; Bouzerdoum, A.; Amin, M.G. A subspace projection approach for wall clutter mitigation in through-the-wall radar imaging. IEEE Trans. Geosci. Remote Sens. 2014, 53, 2108. [Google Scholar] [CrossRef] [Green Version]
  6. Martone, A.F.; Ranney, K.; Le, C. Noncoherent approach for through-the-wall moving target indication. IEEE Trans. Aerosp. Electron. Syst. 2014, 50, 193. [Google Scholar] [CrossRef]
  7. Nezirovic, A.; Yarovoy, A.G.; Ligthart, L.P. Signal processing for improved detection of trapped victims using uwb radar. IEEE Trans. Geosci. Remote Sens. 2010, 48, 2005–2014. [Google Scholar] [CrossRef]
  8. Ding, Y.; Lei, C.; Xu, X.; Sun, K.; Wang, L. Human micro-doppler frequency estimation approach for doppler radar. IEEE Access 2018, 6, 6149–6159. [Google Scholar] [CrossRef]
  9. Liu, Z.; Kim, Y.; Bien, F. Indoor positioning and life detection by using asynchronous multiple frequency shift keying radar. Electron. Lett. 2015, 51, 1817–1819. [Google Scholar] [CrossRef]
  10. Liu, L.; Liu, Z.; Barrowes, B.E. Through-wall bio-radiolocation with UWB impulse radar - observation, simulation and signal extraction. IEEE J. STARS 2011, 4, 791–798. [Google Scholar] [CrossRef]
  11. Sakamoto, T.; Imasaka, R.; Taki, H.; Sato, T.; Yoshioka, M.; Inoue, K.; Fukuda, T.; Sakai, H. Accurate heartbeat monitoring using ultra-wideband radar. IEICE Electron. Expr. 2015, 12, 20141197. [Google Scholar] [CrossRef] [Green Version]
  12. Liu, X.; Zhang, J.; Guo, R.; Yang, G.; Ye, S.; Wu, S.; Fang, G. A novel interferometry positioning and tracking method with short baseline for UWB through-the-wall radar system. In Proceedings of the 17th International Conference on Ground Penetrating Radar (GPR), Rapperswil, Switzerland, 18–21 June 2018; pp. 1–4. [Google Scholar] [CrossRef]
  13. Dell’Aversano, A.; Natale, A.; Buonanno, A.; Solimene, R. Through the wall breathing detection by means of a doppler radar and MUSIC algorithm. IEEE Sens. Lett. 2017, 1, 3500904. [Google Scholar] [CrossRef]
  14. Wang, K.; Zeng, Z.; Sun, J. Through-Wall detection of the moving paths and vital signs of human beings. IEEE Geosci. Remote Sens. Lett. 2019, 16, 717. [Google Scholar] [CrossRef]
  15. Ding, Y.; Sun, Y.; Zhang, J.; Wang, L. Multiperspective target tracking approach for Doppler through-wall radar. IEEE Geosci. Remote Sens. Lett. 2018, 15, 1020. [Google Scholar] [CrossRef]
  16. Xia, Z.; Fang, G.; Ye, S.; Zhang, Q.; Chen, C.; Yin, H. A novel handheld pseudo random coded UWB radar for human sensing applications. IEICE Electron. Expr. 2014, 11, 20140981. [Google Scholar] [CrossRef] [Green Version]
  17. Ash, M.; Ritchie, M.; Chetty, K. On the application of digital moving target indication techniques to short-range FMCW radar data. IEEE Sens. J. 2018, 18, 4167–4175. [Google Scholar] [CrossRef] [Green Version]
  18. Ahmad, F.; Zhang, Y.; Amin, M.G. Three-dimensional wideband beamforming for imaging through a single wall. IEEE Geosci. Remote. Sens. Lett. 2008, 5, 176–179. [Google Scholar] [CrossRef] [Green Version]
  19. Xu, Y.; Wu, S.; Shao, J.; Chen, J.; Fang, G. Life Detection and Location by MIMO Ultra Wideband Radar. In Proceedings of the 14th International Conference on Ground Penetrating Radar (GPR), Shanghai, China, 4–8 June 2012; pp. 80–84. [Google Scholar] [CrossRef]
  20. Liu, J.; Kong, L.; Yang, X.; Liu, Q.H. First-order multipath ghosts’ characteristics and suppression in MIMO through-wall imaging. IEEE Geosci. Remote. Sens. Lett. 2017, 13, 1315–1319. [Google Scholar] [CrossRef]
  21. Jia, Y.; Guo, Y.; Chen, S.; Song, R.; Wang, G.; Zhong, X.; Yan, C.; Cui, G. Multipath ghost and side/grating lobe suppression based on stacked generative adversarial nets in MIMO through-wall radar imaging. IEEE Access 2019, 7, 143367. [Google Scholar] [CrossRef]
  22. Adib, F.; Hsu, C.Y.; Mao, H.; Katabi, D.; Durand, F. Capturing the human figure through a wall. ACM Trans. Graph. 2017, 34, 1. [Google Scholar] [CrossRef]
  23. Geng, Z. Evolution of netted radar systems. IEEE Access 2020, 8, 124961–124977. [Google Scholar] [CrossRef]
  24. Jia, Y.; Guo, Y.; Yan, C.; Sheng, H.; Zhong, X. Detection and localization for multiple stationary human targets based on cross-correlation of dual-station SFCW radars. Remote Sens. 2019, 11, 1428. [Google Scholar] [CrossRef] [Green Version]
  25. Hunt, A.R. Image Formation Through Walls using a Distributed Radar Sensor Array. In Proceedings of the 32nd Applied Imagery Pattern Recognition Workshop, Washington, DC, USA, 15–17 October 2003; pp. 232–237. [Google Scholar] [CrossRef]
  26. Debes, C.; Amin, M.G.; Zoubir, A.M. Target detection in single-and multiple-view through-the-wall radar imaging. IEEE Trans. Geosci. Remote Sens. 2009, 47, 1349–1361. [Google Scholar] [CrossRef] [Green Version]
  27. Xia, Z.; Zhang, Q.; Ye, S.; Wang, Y.; Chen, C.; Yin, H.; Fang, G. A novel low-frequency coded ground penetrating radar for deep detection. IEICE Electron. Expr. 2015, 12, 20150200. [Google Scholar] [CrossRef] [Green Version]
  28. Golay, M.J.E. Complementary series. IEEE Trans. Inf. Theory 1961, 7, 82–87. [Google Scholar] [CrossRef]
  29. Liu, X.; Yan, K.; Chen, Z.; Li, C.; Zhang, J.; Ye, S.; Fang, G. A m-sequence UWB radar system design and contrast test with an impulse radar. In Proceedings of the 17th International Conference on Ground Penetrating Radar (GPR), Rapperswil, Switzerland, 18–21 June 2018; pp. 1–4. [Google Scholar] [CrossRef]
  30. Zaikov, E. UWB radar for detection and localization of trapped people. In Proceedings of the 11th International Radar Symposium, Vilnius, Lithuania, 16–18 June 2010; pp. 1–4. [Google Scholar] [CrossRef]
  31. Texas Instruments: Time Synchronization Over the Air. 2017. Available online: https://software-dl.ti.com/simplelink/esd/simplelink_cc13x2_26x2_sdk/3.30.00.03/exports/docs/proprietary-rf/proprietary-rf-users-guide/proprietary-rf/time-synchronization.html#equation-eq-process-offset (accessed on 30 March 2021).
  32. Decawave: DWM1000 Module. 2016. Available online: https://www.decawave.com/product/dwm1000-module (accessed on 30 March 2021).
  33. Novoselov, S.; Donskov, O. Distributed local positioning system using DWM1000 location chip. In Proceedings of the 4th International Scientific-Practical Conference Problems of Infocommunications, Science and Technology (PIC S&T), Kharkov, Ukraine, 10–13 October 2017; pp. 489–492. [Google Scholar] [CrossRef]
  34. Gu, Y.; Yang, B. Clock compensation two-way ranging (CC-TWR) based on ultra-wideband communication. In Proceedings of the 8th International Conference on Instrumentation & Measurement, Computer, Communication and Control (IMCCC), Computer, Harbin, China, 19–21 June 2018; pp. 1145–1150. [Google Scholar] [CrossRef]
  35. Zhang, H.; Zhang, Z.; Gao, N.; Xiao, Y.; Meng, Z.; Li, Z. Cost-Effective Wearable Indoor Localization and Motion Analysis via the Integration of UWB and IMU. Sensors 2020, 20, 344. [Google Scholar] [CrossRef] [Green Version]
  36. Sang, C.L.; Steinhagen, B.; Homburg, J.D.; Adams, M.; Hesse, M.; Rückert, U. Identification of NLOS and Multi-Path Conditions in UWB Localization Using Machine Learning Methods. Appl. Sci. 2020, 10, 3980. [Google Scholar] [CrossRef]
  37. Daniels, D.J. Ground Penetrating Radar; IEE Press: Piscataway, NJ, USA, 2004. [Google Scholar]
  38. Zetik, R.; Crabbe, S.; Krajnak, J.; Peyerl, P.; Sachs, J.; Thomä, R. Detection and localization of persons behind obstacles using M-sequence through-the-wall radar. In Proceedings of the Conference on Sensors, and Command, Control, Communications, and Intelligence(C3I) Technologies for Homeland Security and Homeland Defense V, Kissimmee, FL, USA, 17 April 2006; p. 20060417. [Google Scholar]
  39. Wu, S.; Tan, K.; Xia, Z.; Chen, J. Improved human respiration detection method via ultra-wideband radar in through-wall or other similar conditions. IET Radar Sonar Navig. 2016, 10, 468. [Google Scholar] [CrossRef]
Figure 1. The block diagram of the Golay-coded radar.
Applsci 11 03129 g001
Figure 2. The prototyped radar system (left) and its antennas (right).
Applsci 11 03129 g002
Figure 3. The workflow timing.
Applsci 11 03129 g003
Figure 4. The slow-time range matrix including two types of vital signs. (a) Non-periodic non-weak respiration. (b) Quasi-periodic weak respiration.
Applsci 11 03129 g004
Figure 5. The flowchart of the proposed detection method based on the ordered statistics constant false alarm rate (OS-CFAR) method.
Applsci 11 03129 g005
Figure 6. Measurement scenes for quasi-static human being detection in stationary operating mode.
Applsci 11 03129 g006
Figure 7. Experimental results for stationary operating mode. (a) The preprocessing slow-time range matrix. (b) The resultant frequency range matrix.
Applsci 11 03129 g007
Figure 8. Experimental detection and classification result for stationary operating mode.
Applsci 11 03129 g008
Figure 9. The type-I experimental setup.
Applsci 11 03129 g009
Figure 10. The metal plate beacon.
Applsci 11 03129 g010
Figure 11. The summarization of the type-I experiment. (a) The detection errors of No.1 radar. (b) The detection errors of No.2 radar
Applsci 11 03129 g011
Figure 12. The type-II experimental setup.
Applsci 11 03129 g012
Figure 13. The experiment A result. (a,b) The output range-frequency images using the normal FFT-based respiration detection methods using the echoes from a single radar. (c) The output two-dimensional (2D) slice (range × range) image for the specific respiration frequency. (d) The positioning result calculated by the radar system is compared with the actual position of the person.
Applsci 11 03129 g013
Figure 14. The experiment B result. (a,b) The output range-frequency images using the normal FFT-based respiration detection methods using the echoes from a single radar. (c) The output two-dimensional (2D) slice (range × range) image for the specific respiration frequency. (d) The positioning result calculated by the radar system is compared with the actual position of the person.
Applsci 11 03129 g014
Figure 15. The experiment C result. (a,b) The output range-frequency images using the normal FFT-based respiration detection methods using the echoes from a single radar. (c) The output two-dimensional (2D) slice (range × range) image for the specific respiration frequency. (d) The positioning result calculated by the radar system is compared with the actual position of the person.
Applsci 11 03129 g015
Figure 16. Ruin scene for quasi-static human being detection in scanning operating mode.
Applsci 11 03129 g016
Figure 17. Measurement results for ruins scene. (a, b) The output range-frequency images using the normal FFT-based respiration detection methods using the echoes from a single radar. (c) The output cross-correlated range-frequency three-dimensional (3D) image, with the vital sign feature (VSF) marked in green. (d) The output two-dimensional (2D) slice (range × range) image for the specific respiration frequency.
Applsci 11 03129 g017
Figure 18. The experimental setup for a multistorey building. (a) The deployment of two Golay-coded radars. (b)The tested human object.
Applsci 11 03129 g018
Figure 19. Measurement results for multistorey building. (a, b) The output range-frequency images using the normal FFT-based respiration detection methods using the echoes from a single radar. (c) The output 2D slice (range × range) image for the specific respiration frequency.
Applsci 11 03129 g019
Table 1. The maximum detection range of typical radars around the world.
Radar NameDeveloperMax Distance (m)Characteristics
XaverCamero (Israel)8pulse radar, portable
LifeLocator TRxGSSI * (USA)12pulse radar, earlier used
CE400NovaSky (China)20FMCW radar, MIMO, bulky
Jia [24]UESTC * (China)5SFCW * radar, dual-station
“RF-Capture” [22]MIT * (USA)3FMCW radar, MIMO, 5.46~7.24 GHz
Xia [16]IECAS * (China)12.5Pseudo-random radar, portable
* GSSI: Geophysical Survey System Inc., UESTC: University of Electronic Science and Technology of China, MIT: Massachusetts Institute of Technology, IECAS: Institute of Electrics, Chinese Academy of Sciences, SFCW: Stepped-Frequency Continuous Wave.
Table 2. Key parameters of the proposed radar.
ParametersValue
Equivalent sampling frequency ( F S )16 GSPS *
Real-time sampling frequency125 MSPS *
Sampling points ( N )16,384
Average times ( N A )32
ADC * Resolution16 bits
* GSPS: Gigabit samples per second, MSPS: million samples per second, ADC: analog to digital converter.
Table 3. The measurement results of the type-I experiment.
Measurement No.The Actual Distance between No. 1 Radar
and Target
The Actual Distance between No. 2 Radar and TargetFFT *-Based Respiration Detection MethodMeasuring ErrorScanning Operating Mode MethodMeasuring Error
No. 1 Radar ResultNo. 2 Radar ResultNo. 1 Radar ResultNo. 2 Radar ResultNo. 1 Radar ResultNo. 2 Radar ResultNo. 1 Radar ResultNo. 2 Radar Result
15 m5.31 m4.85 m5.41 m−3.00%1.80%4.89 m5.19 m−2.20%−2.34%
27 m7.23 m6.85 m7.04 m−2.14%−2.60%6.87 m7.07 m−1.86%−2.18%
39 m9.18 m8.85 m9.24 m−1.67%0.67%8.89 m9.27 m−1.22%1.00%
411 m11.15 m10.76 m10.96 m−2.18%−1.67%10.79 m10.92 m−1.91%−2.03%
513 m13.12 m12.95 m12.96 m−0.38%−1.25%12.98 m12.99 m−0.15%−1.02%
615 m15.11 m14.96 m14.96 m−0.27%−0.98%14.99 m14.99 m−0.07%−0.78%
717 m17.10 m16.84 m16.93 m−0.94%−0.97%16.88 m16.96 m−0.71%−0.79%
819 m19.09 m19.24 m19.14 m1.26%0.29%19.27 m19.17 m1.42%0.44%
921 m21.08 m20.86 m21.12 m−0.67%0.20%20.89 m21.15 m−0.52%0.35%
1023 m23.07 m22.84 m22.93 m−0.70%−0.61%22.88 m23.03 m−0.52%−0.17%
1125 m25.06 m25.36 m25.08 m1.44%0.06%25.39 m25.11 m1.56%0.18%
1227 m27.06 m26.86 m27.08 m−0.52%0.07%26.89 m26.89 m−0.41%−0.63%
1329 m29.06 m28.91 m28.98 m−0.31%−0.26%28.94 m29.01 m−0.21%−0.16%
1431 m31.05 m31.27 m31.06 m0.87%0.03%31.3 m31.09 m0.97%0.12%
1533 m33.05 m33.01 m33.17 m0.03%0.37%32.95 m32.63 m−0.15%−1.27%
1635 m35.05 m34.96 m34.96 m−0.11%−0.25%34.99 m34.99 m−0.03%−0.16%
1737 m37.04 m37.27 mFailure0.73%-37.24 m36.98 m0.65%−0.17%
1839 m39.04 m39.18 mFailure0.46%-39.22 m39.15 m0.56%0.28%
1941 m41.04 mFailureFailure--41.19 m40.98 m0.46%−0.14%
2043 m43.04 mFailureFailure--43 m42.98 m0.00%−0.13%
2145 m45.04 mFailureFailure--44.19 m45.15 m−1.80%0.25%
2247 m47.03 mFailureFailure--46.55 m46.55 m−0.96%−1.03%
2349 m49.03 mFailureFailure--48.85 m48.3 m−0.31%−1.50%
2451 m51.03 mFailureFailure--50.87 m51.32 m−0.25%0.56%
*FFT: fast Fourier transform.
Publisher’s Note: MDPI stays neutral with regard to jurisdictional claims in published maps and institutional affiliations.

