Author Contributions
Conceptualization, S.M.A.-A. and M.F.M.Y.; methodology, S.M.A.-A., A.A., M.F.M.Y. and M.S.K.; software, S.M.A.-A. and M.F.M.Y.; validation, S.M.A.-A., A.A.-S., S.A. and M.F.M.Y.; investigation, S.M.A.-A., M.F.M.Y. and M.S.K.; resources, S.M.A.-A. and M.F.M.Y.; writing—original draft preparation, S.M.A.-A. and M.F.M.Y.; writing review and editing, M.F.M.Y., A.A., M.S.K., A.A.-S., M.I.M. and S.A.; Project administration: M.F.M.Y., M.I.M., A.A. and M.S.K. All authors have read and agreed to the published version of the manuscript.
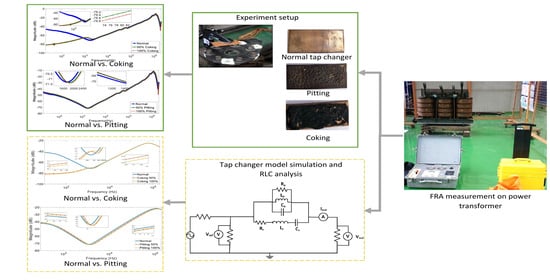
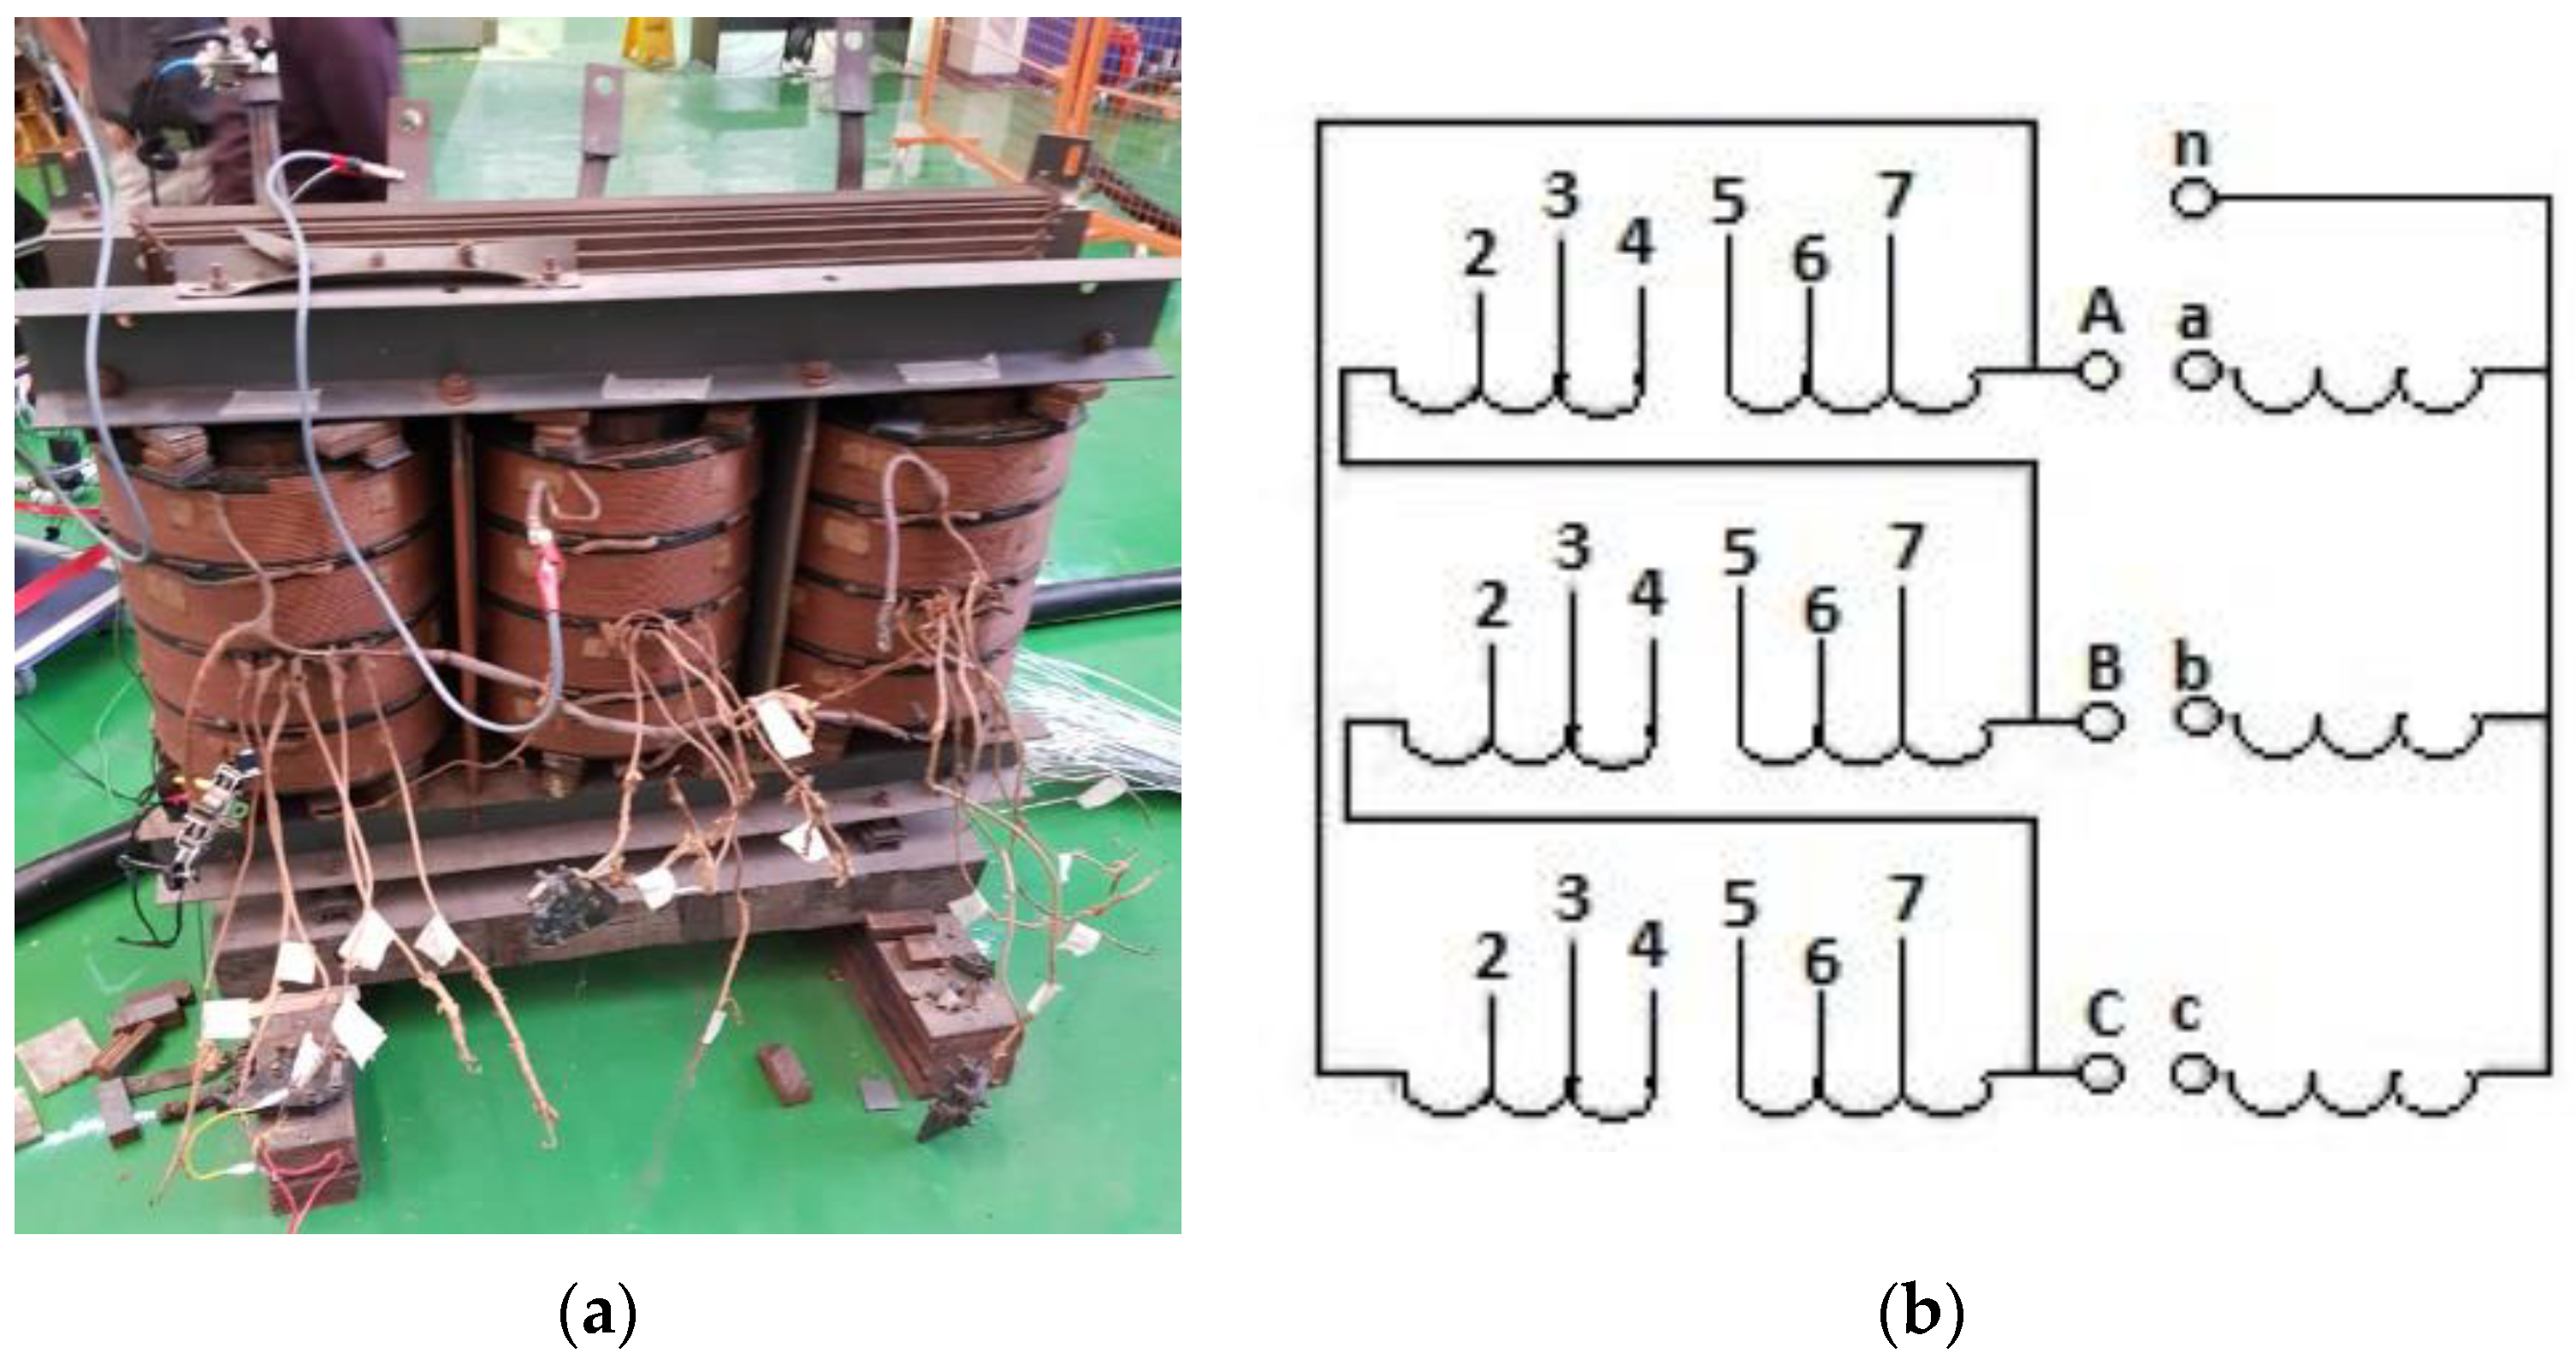
Figure 1.
(a) The 11/0.415 kV, 500 kVA distribution transformer and (b) winding configuration.
Figure 1.
(a) The 11/0.415 kV, 500 kVA distribution transformer and (b) winding configuration.
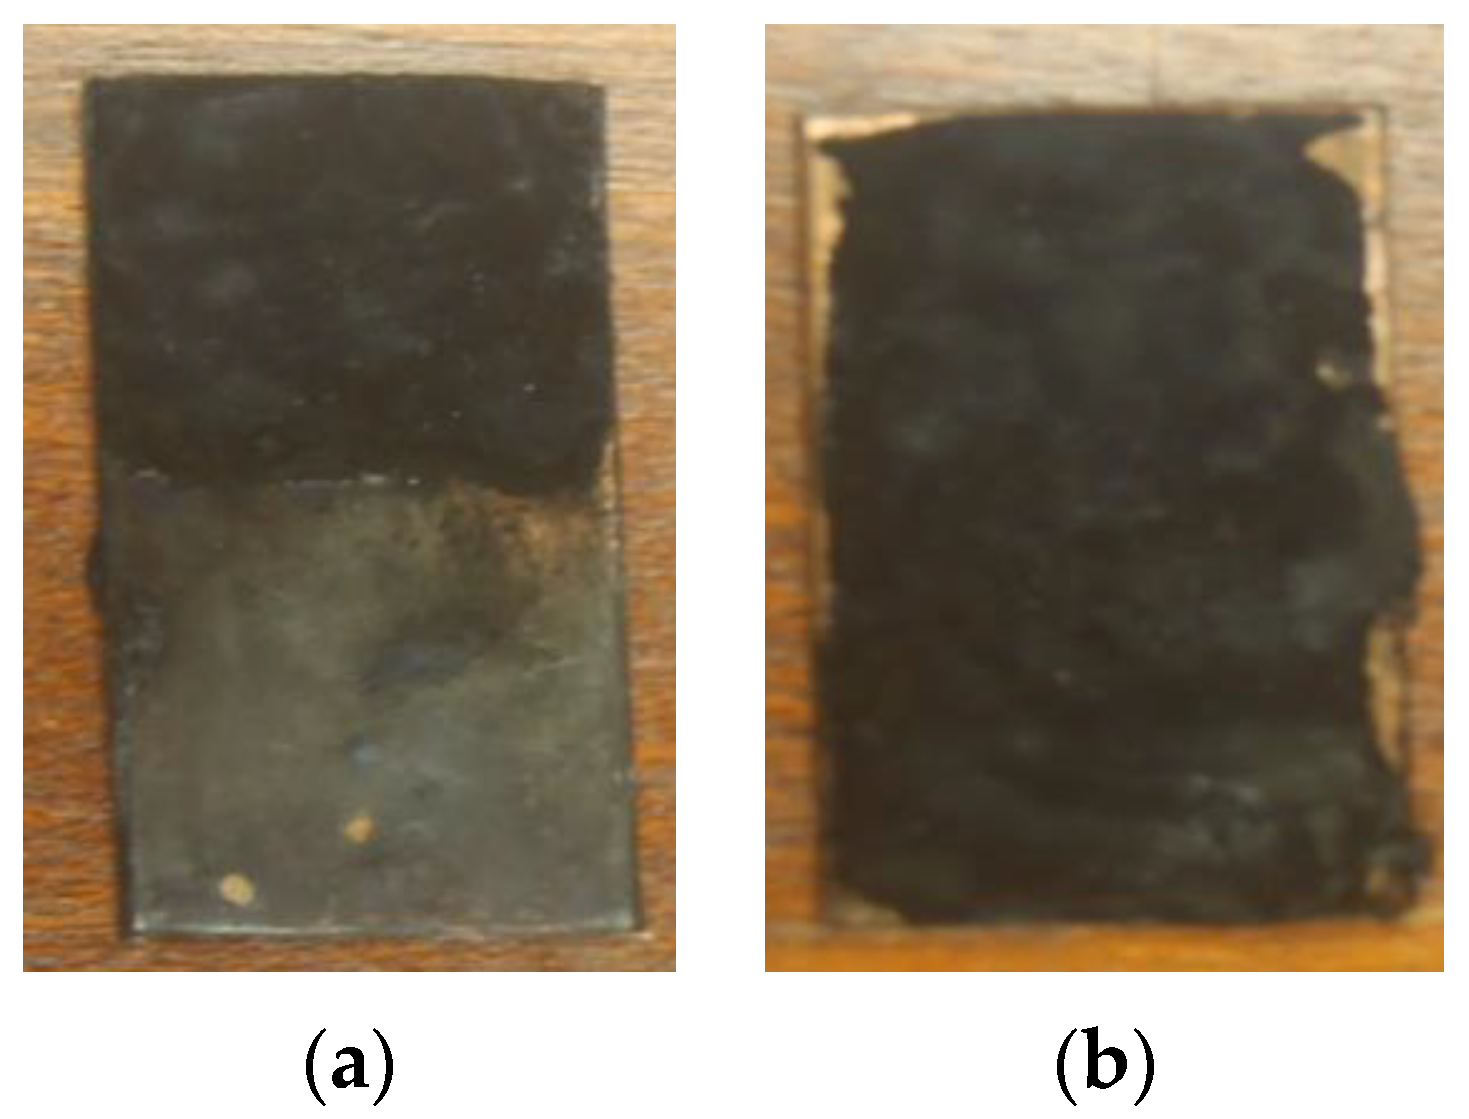
Figure 2.
Tap contacts coking (a) 50% and (b) 100%.
Figure 2.
Tap contacts coking (a) 50% and (b) 100%.
Figure 3.
Tap surface pitting (a) 50% and (b) 100%.
Figure 3.
Tap surface pitting (a) 50% and (b) 100%.
Figure 4.
Measured frequency response analysis (FRA) at all tap changer positions.
Figure 4.
Measured frequency response analysis (FRA) at all tap changer positions.
Figure 5.
Equivalent schematic resistance, inductance, and capacitance RLC network of transformer winding.
Figure 5.
Equivalent schematic resistance, inductance, and capacitance RLC network of transformer winding.
Figure 6.
Simulated tap changer RLC circuit using MATLAB/Simulink.
Figure 6.
Simulated tap changer RLC circuit using MATLAB/Simulink.
Figure 7.
Simulated FRA for at all tap changer positions.
Figure 7.
Simulated FRA for at all tap changer positions.
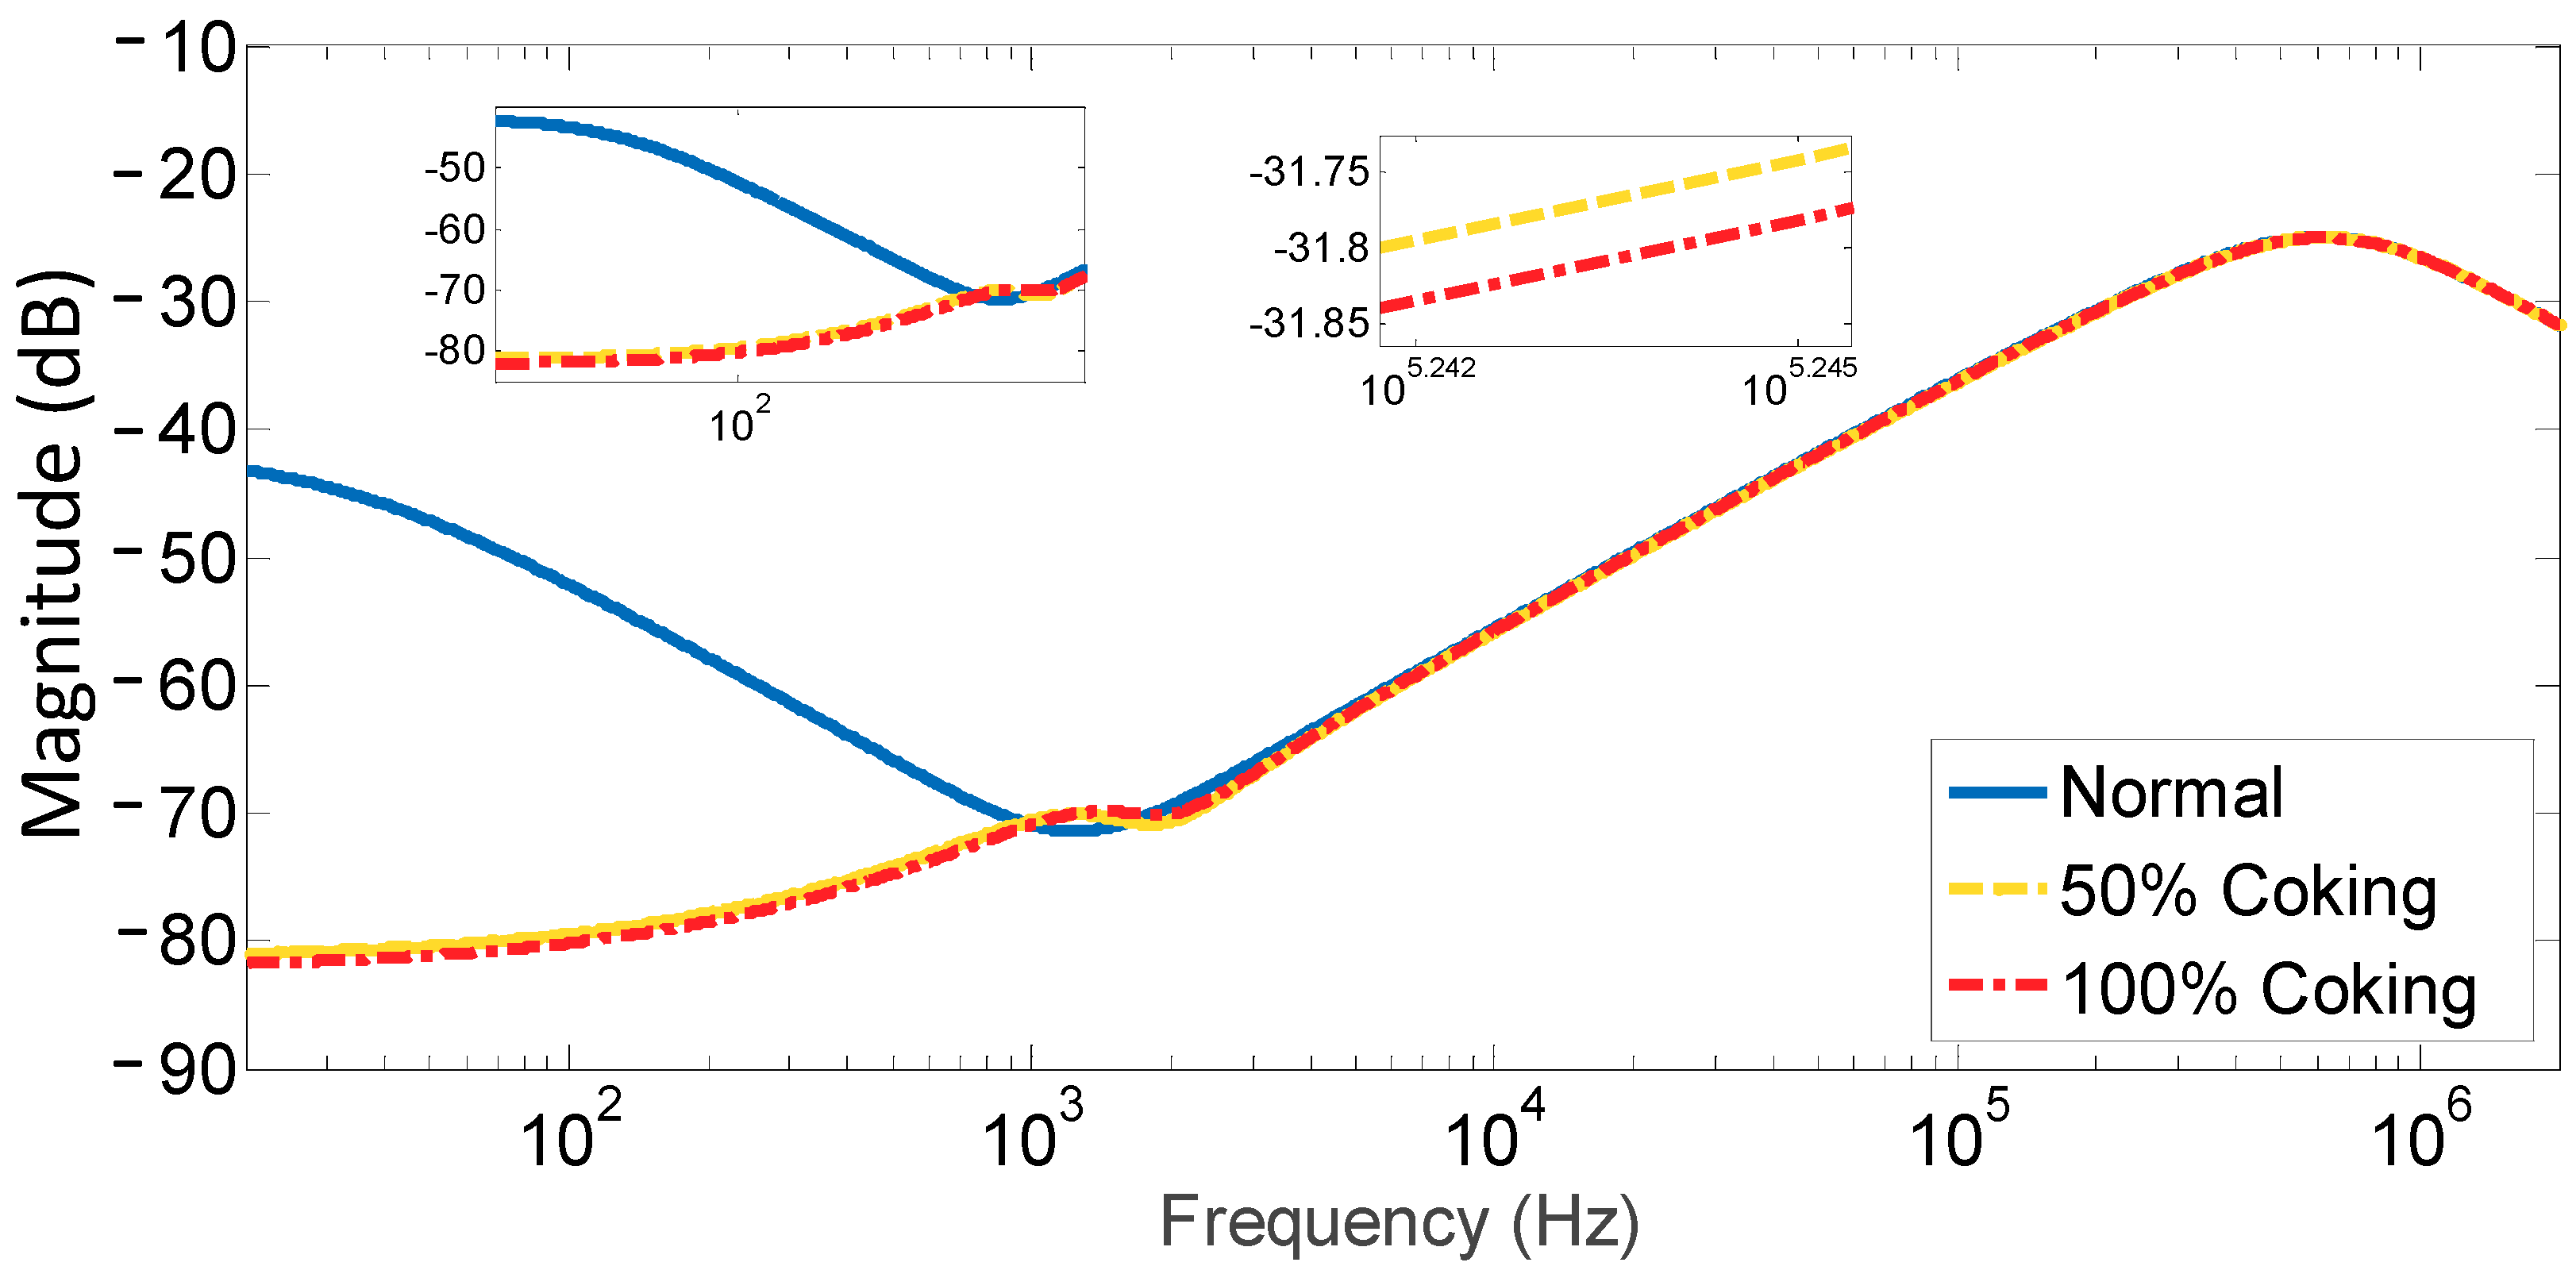
Figure 8.
Measured FRA for normal, 50%, and 100% coking.
Figure 8.
Measured FRA for normal, 50%, and 100% coking.
Figure 9.
Simulated FRA for normal, vs. 50% and 100% coking.
Figure 9.
Simulated FRA for normal, vs. 50% and 100% coking.
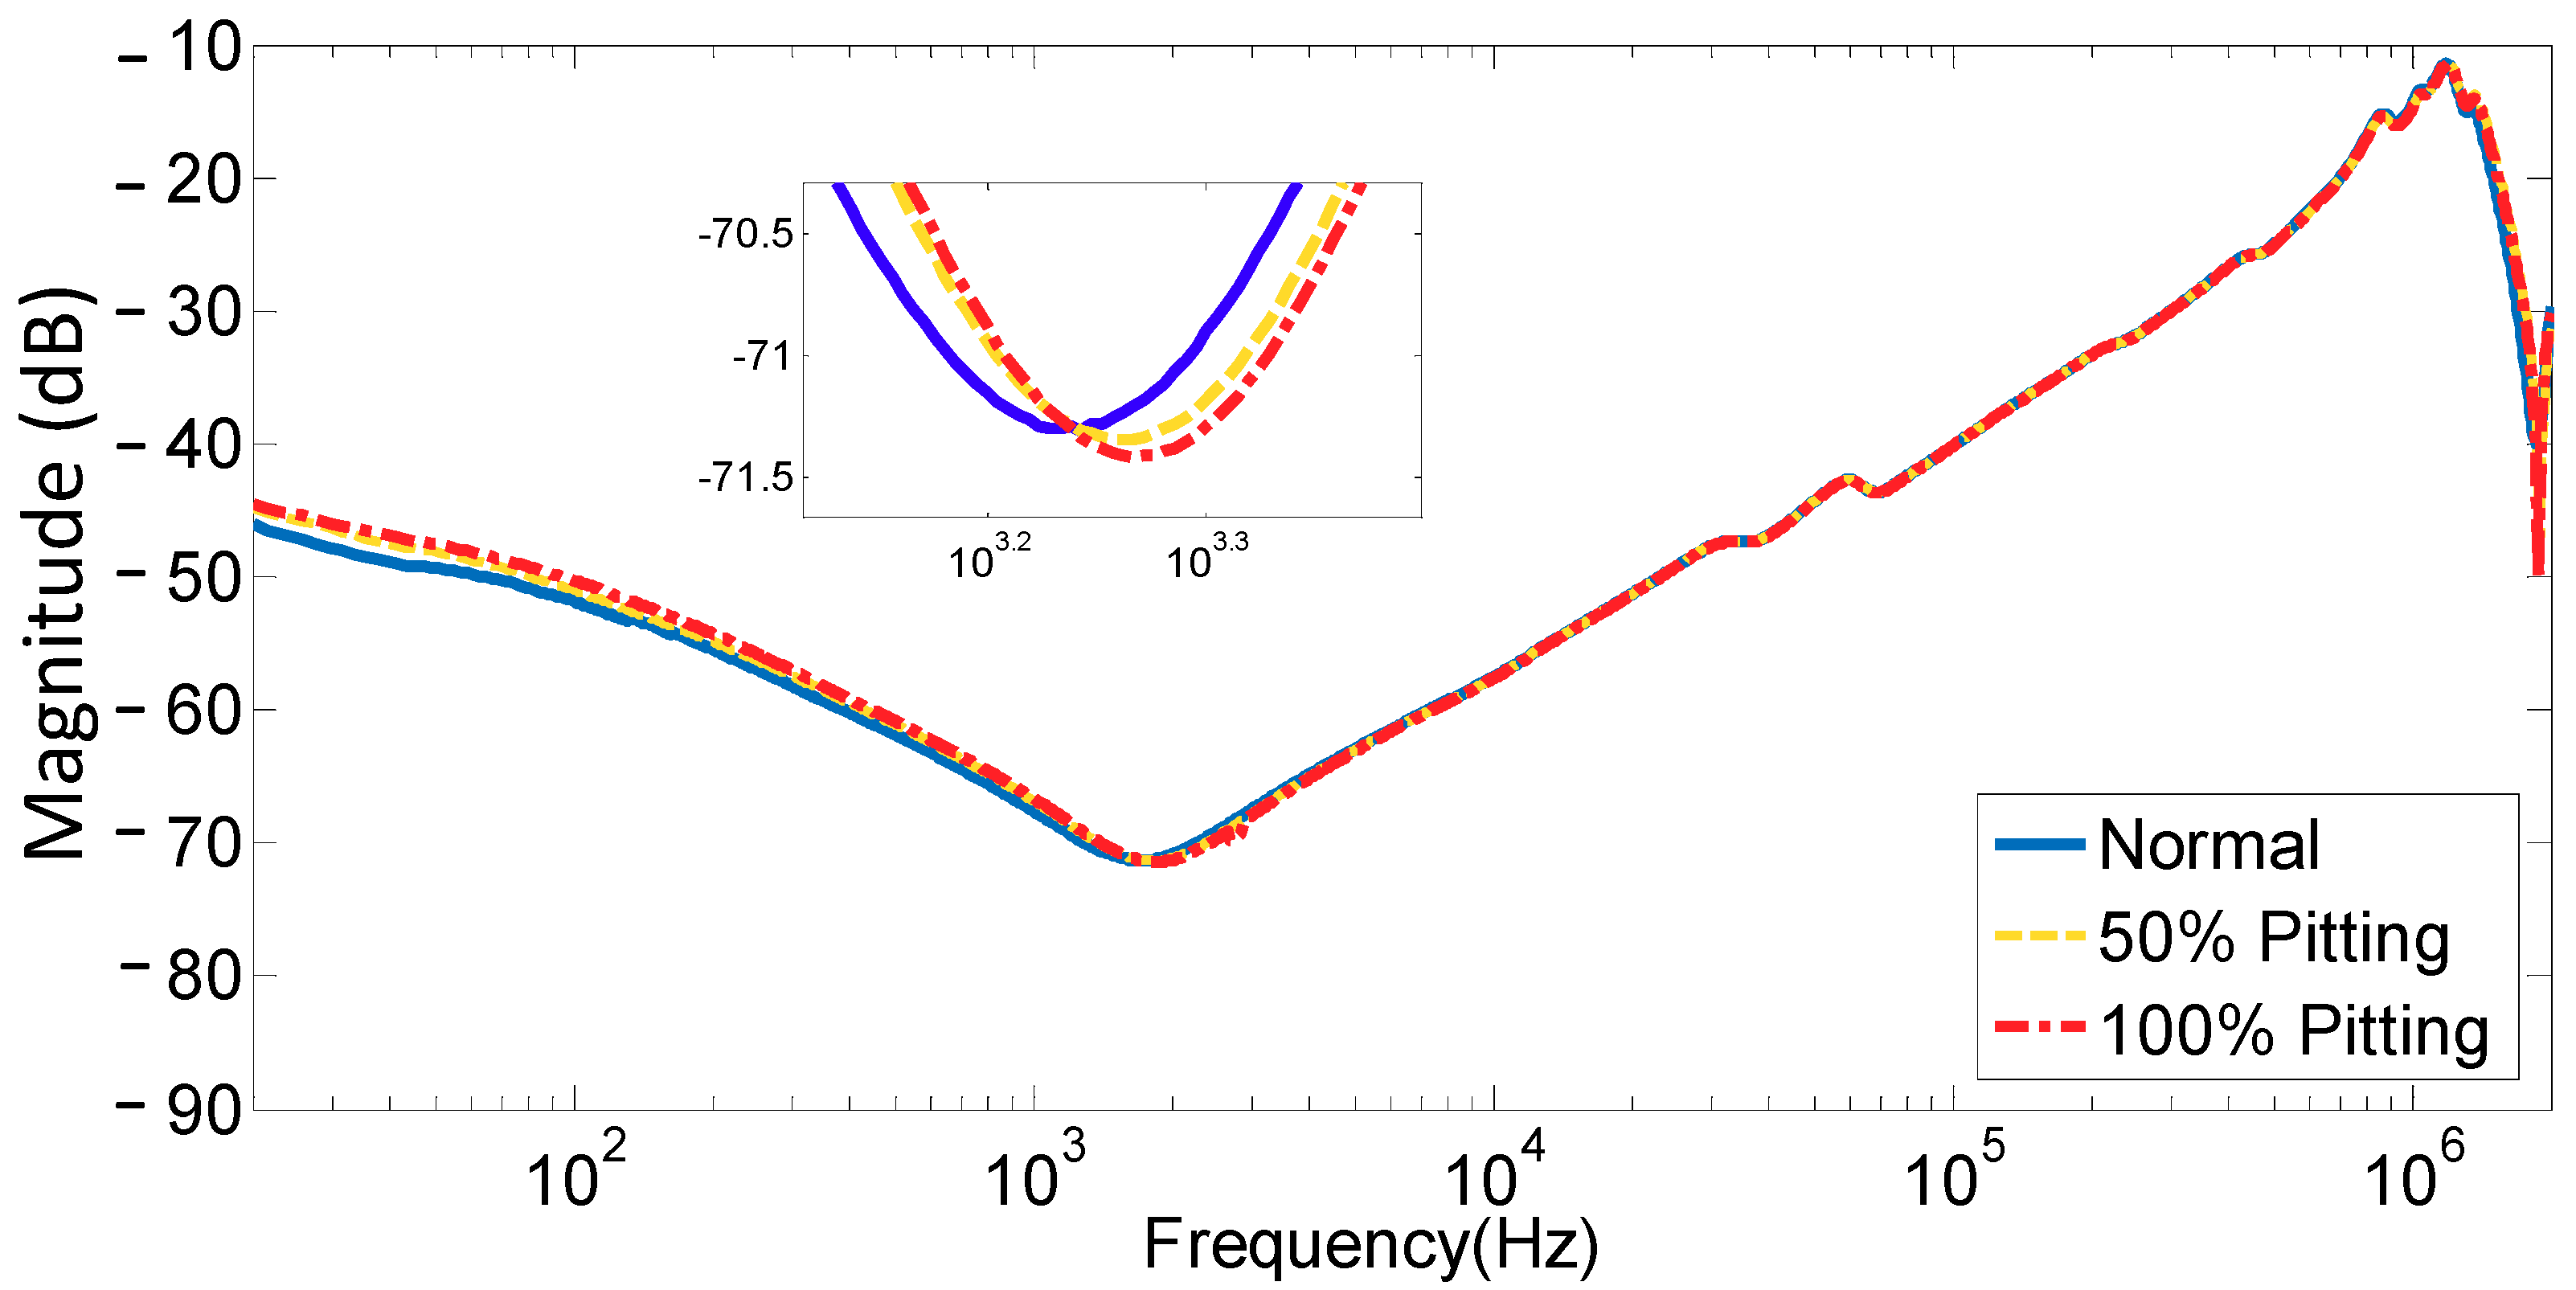
Figure 10.
Measured FRA for normal, vs. 50% and 100% pitting.
Figure 10.
Measured FRA for normal, vs. 50% and 100% pitting.
Figure 11.
Simulated FRA for normal, vs. 50% pitting and 100% pitting.
Figure 11.
Simulated FRA for normal, vs. 50% pitting and 100% pitting.
Figure 12.
The RLC circuit model for the tap changer under the FRA short circuit test.
Figure 12.
The RLC circuit model for the tap changer under the FRA short circuit test.
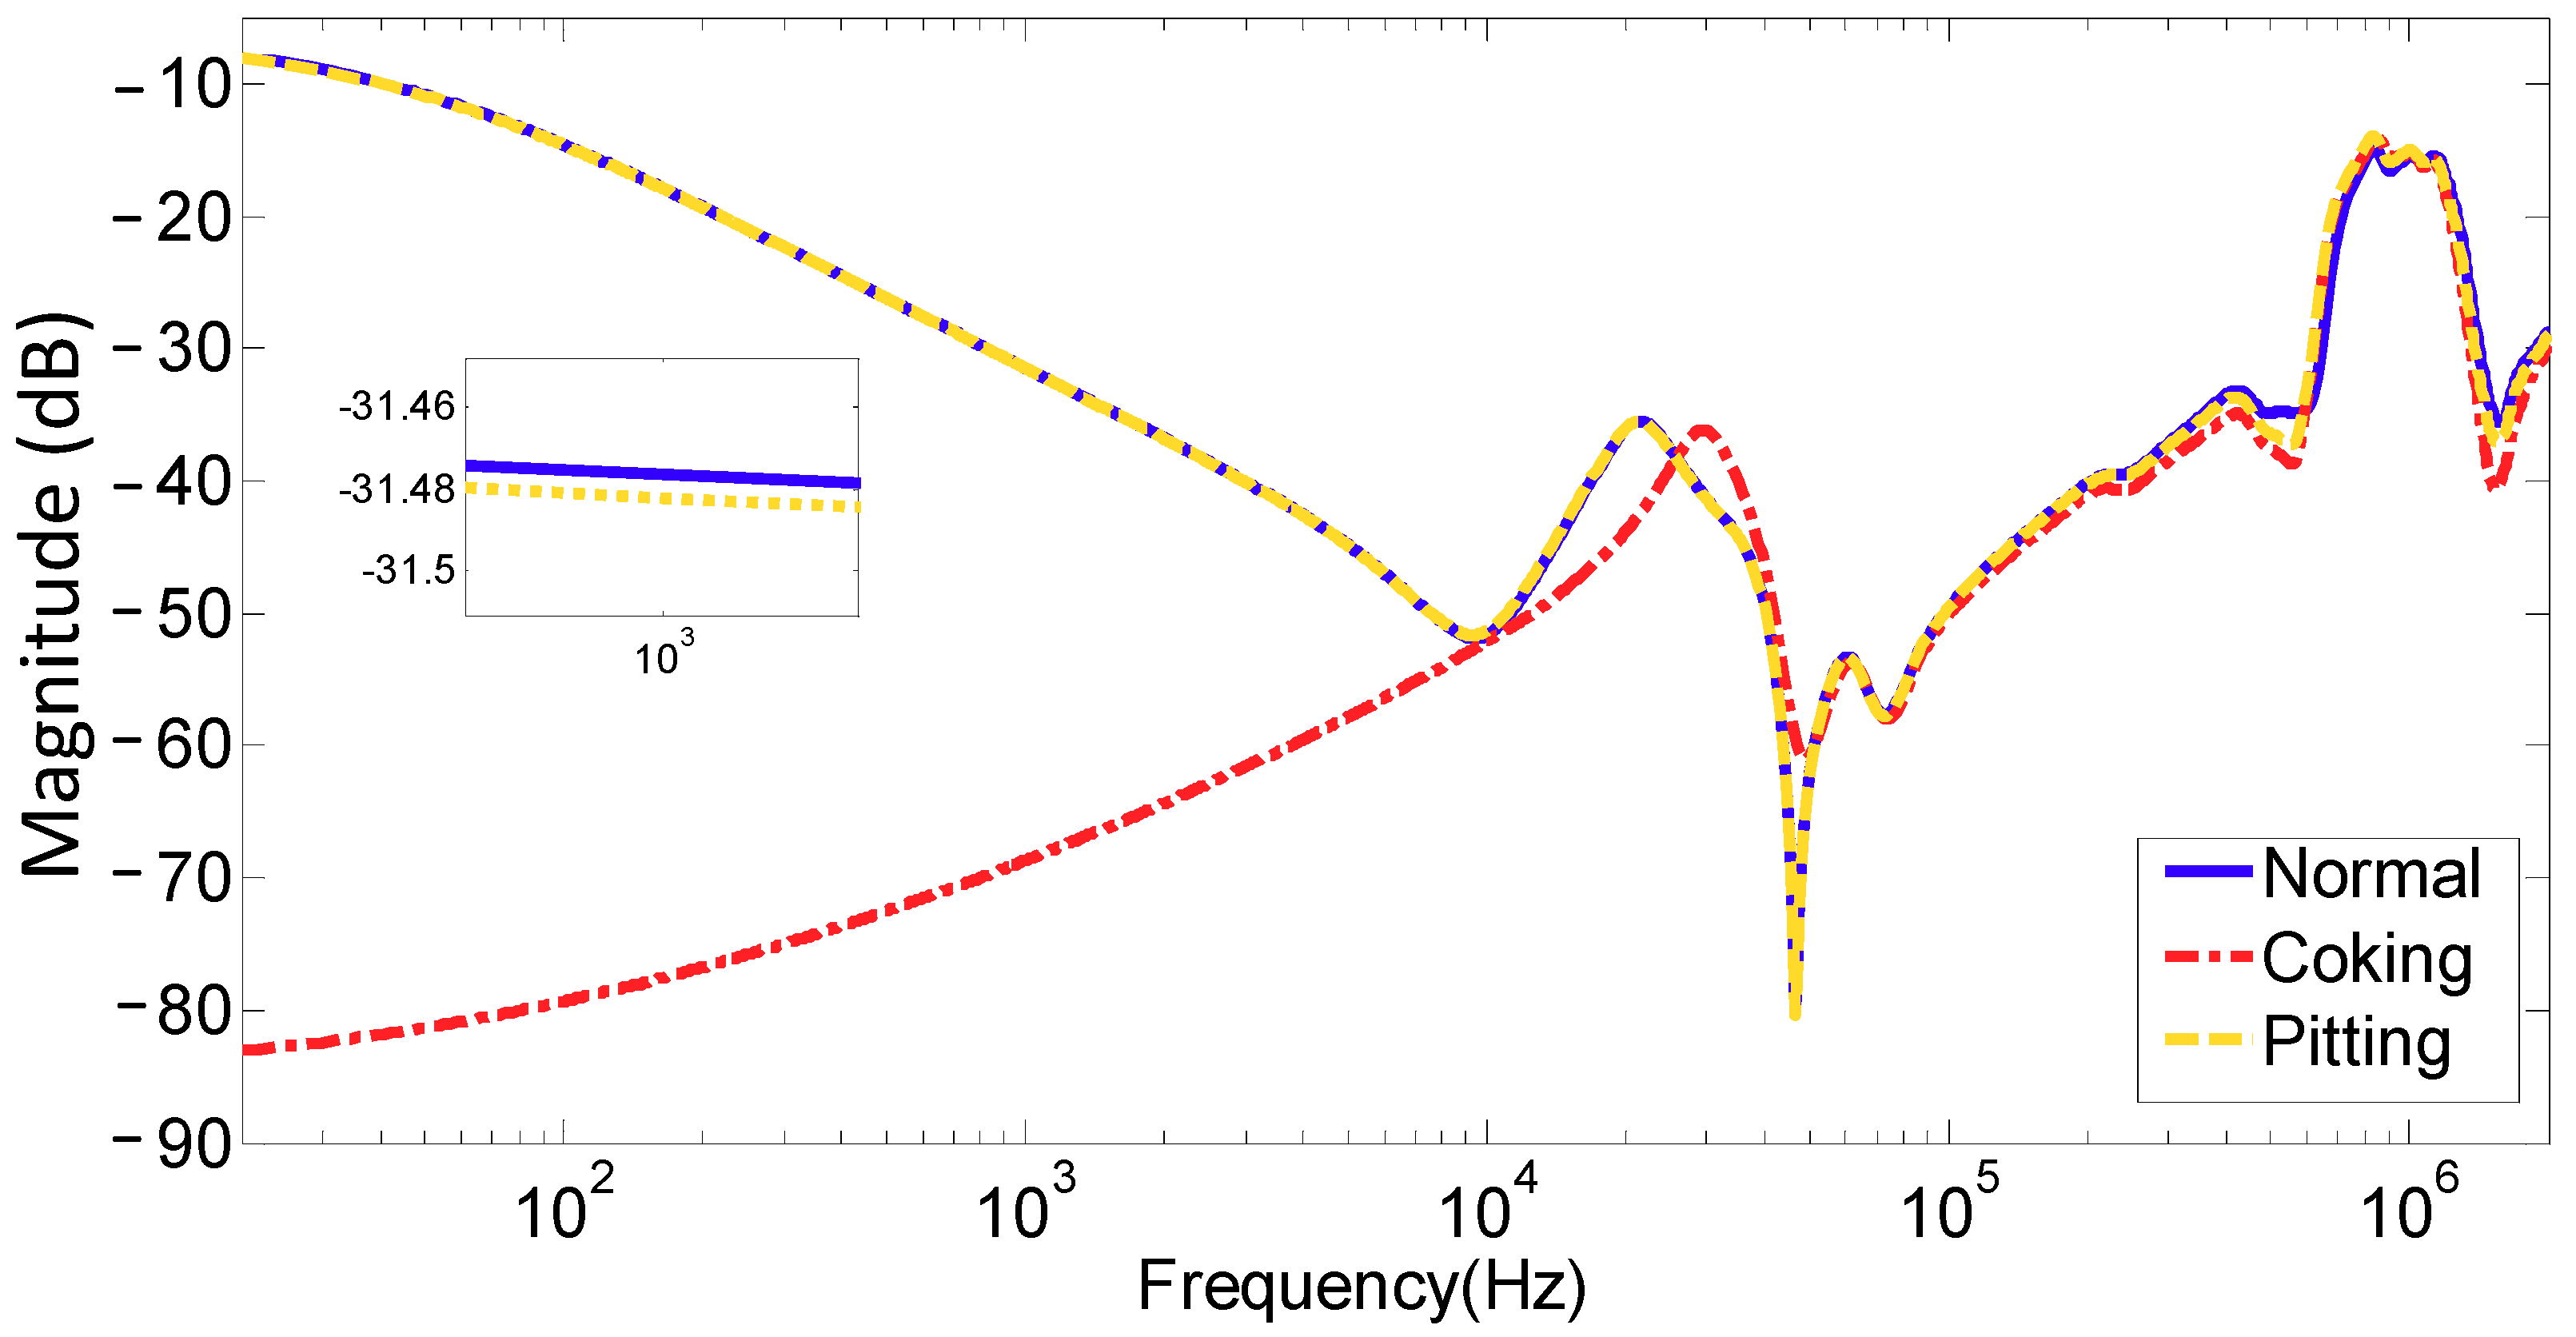
Figure 13.
Measured FRA for normal, vs. 100% coking and 100% pitting.
Figure 13.
Measured FRA for normal, vs. 100% coking and 100% pitting.
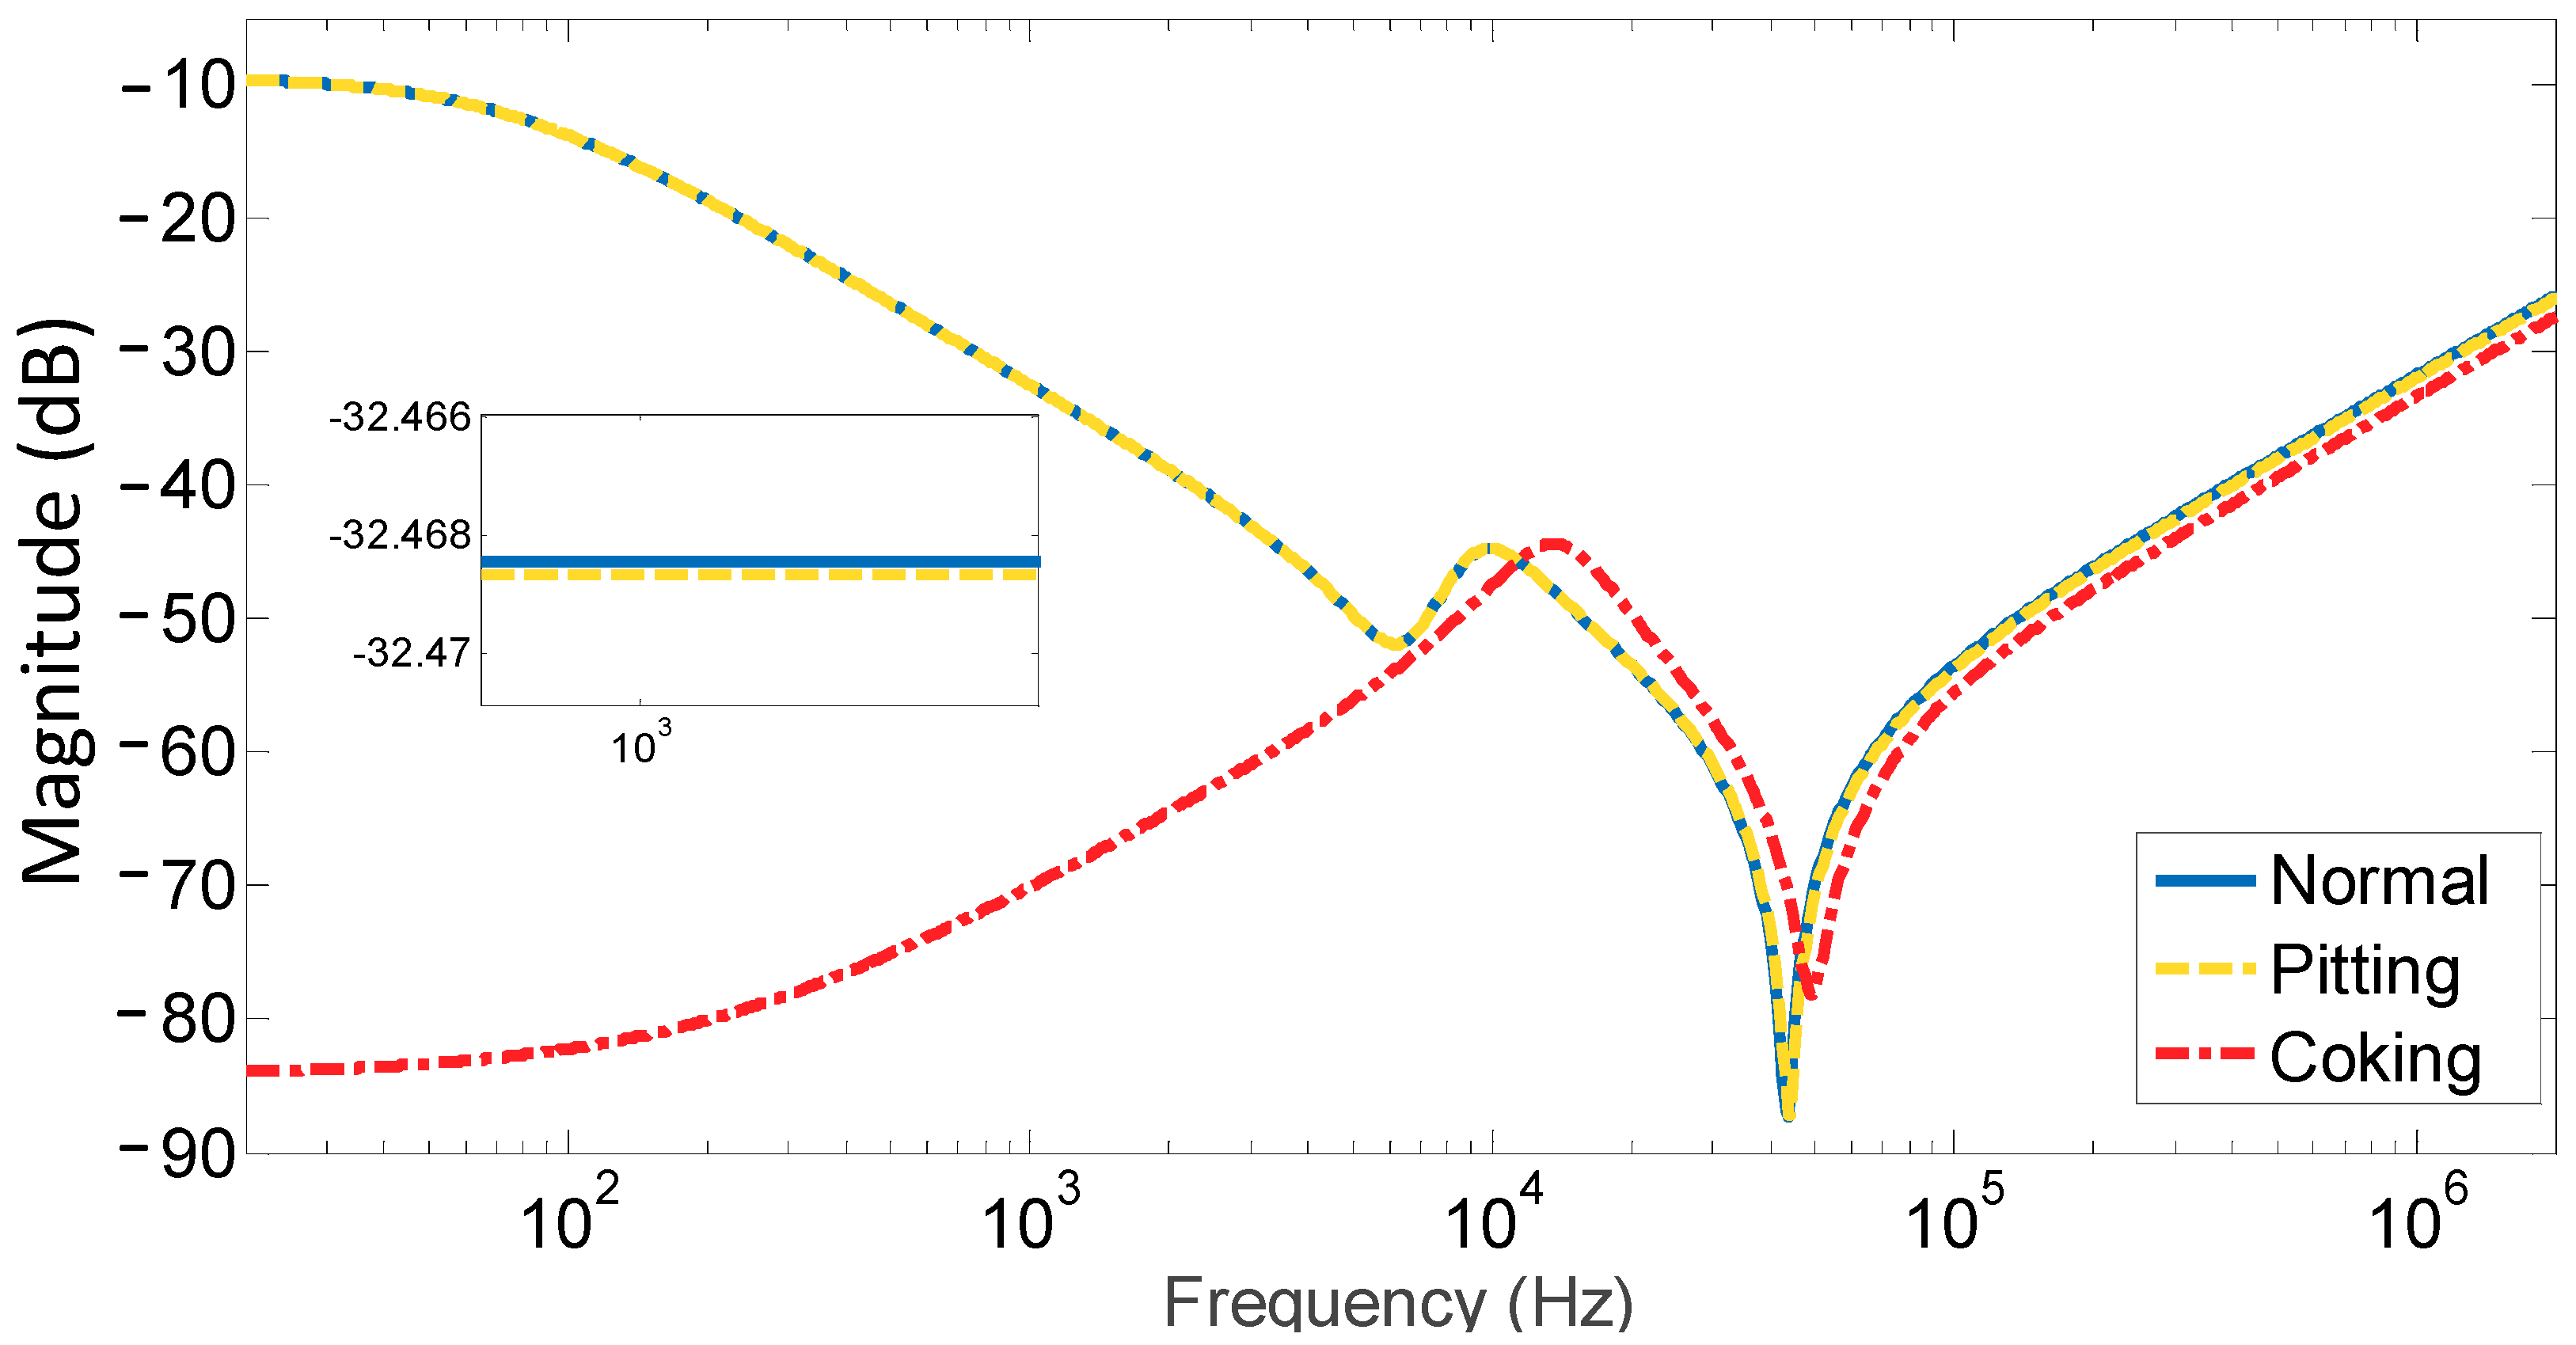
Figure 14.
Simulated FRA for normal, vs. 100% coking and 100% pitting.
Figure 14.
Simulated FRA for normal, vs. 100% coking and 100% pitting.
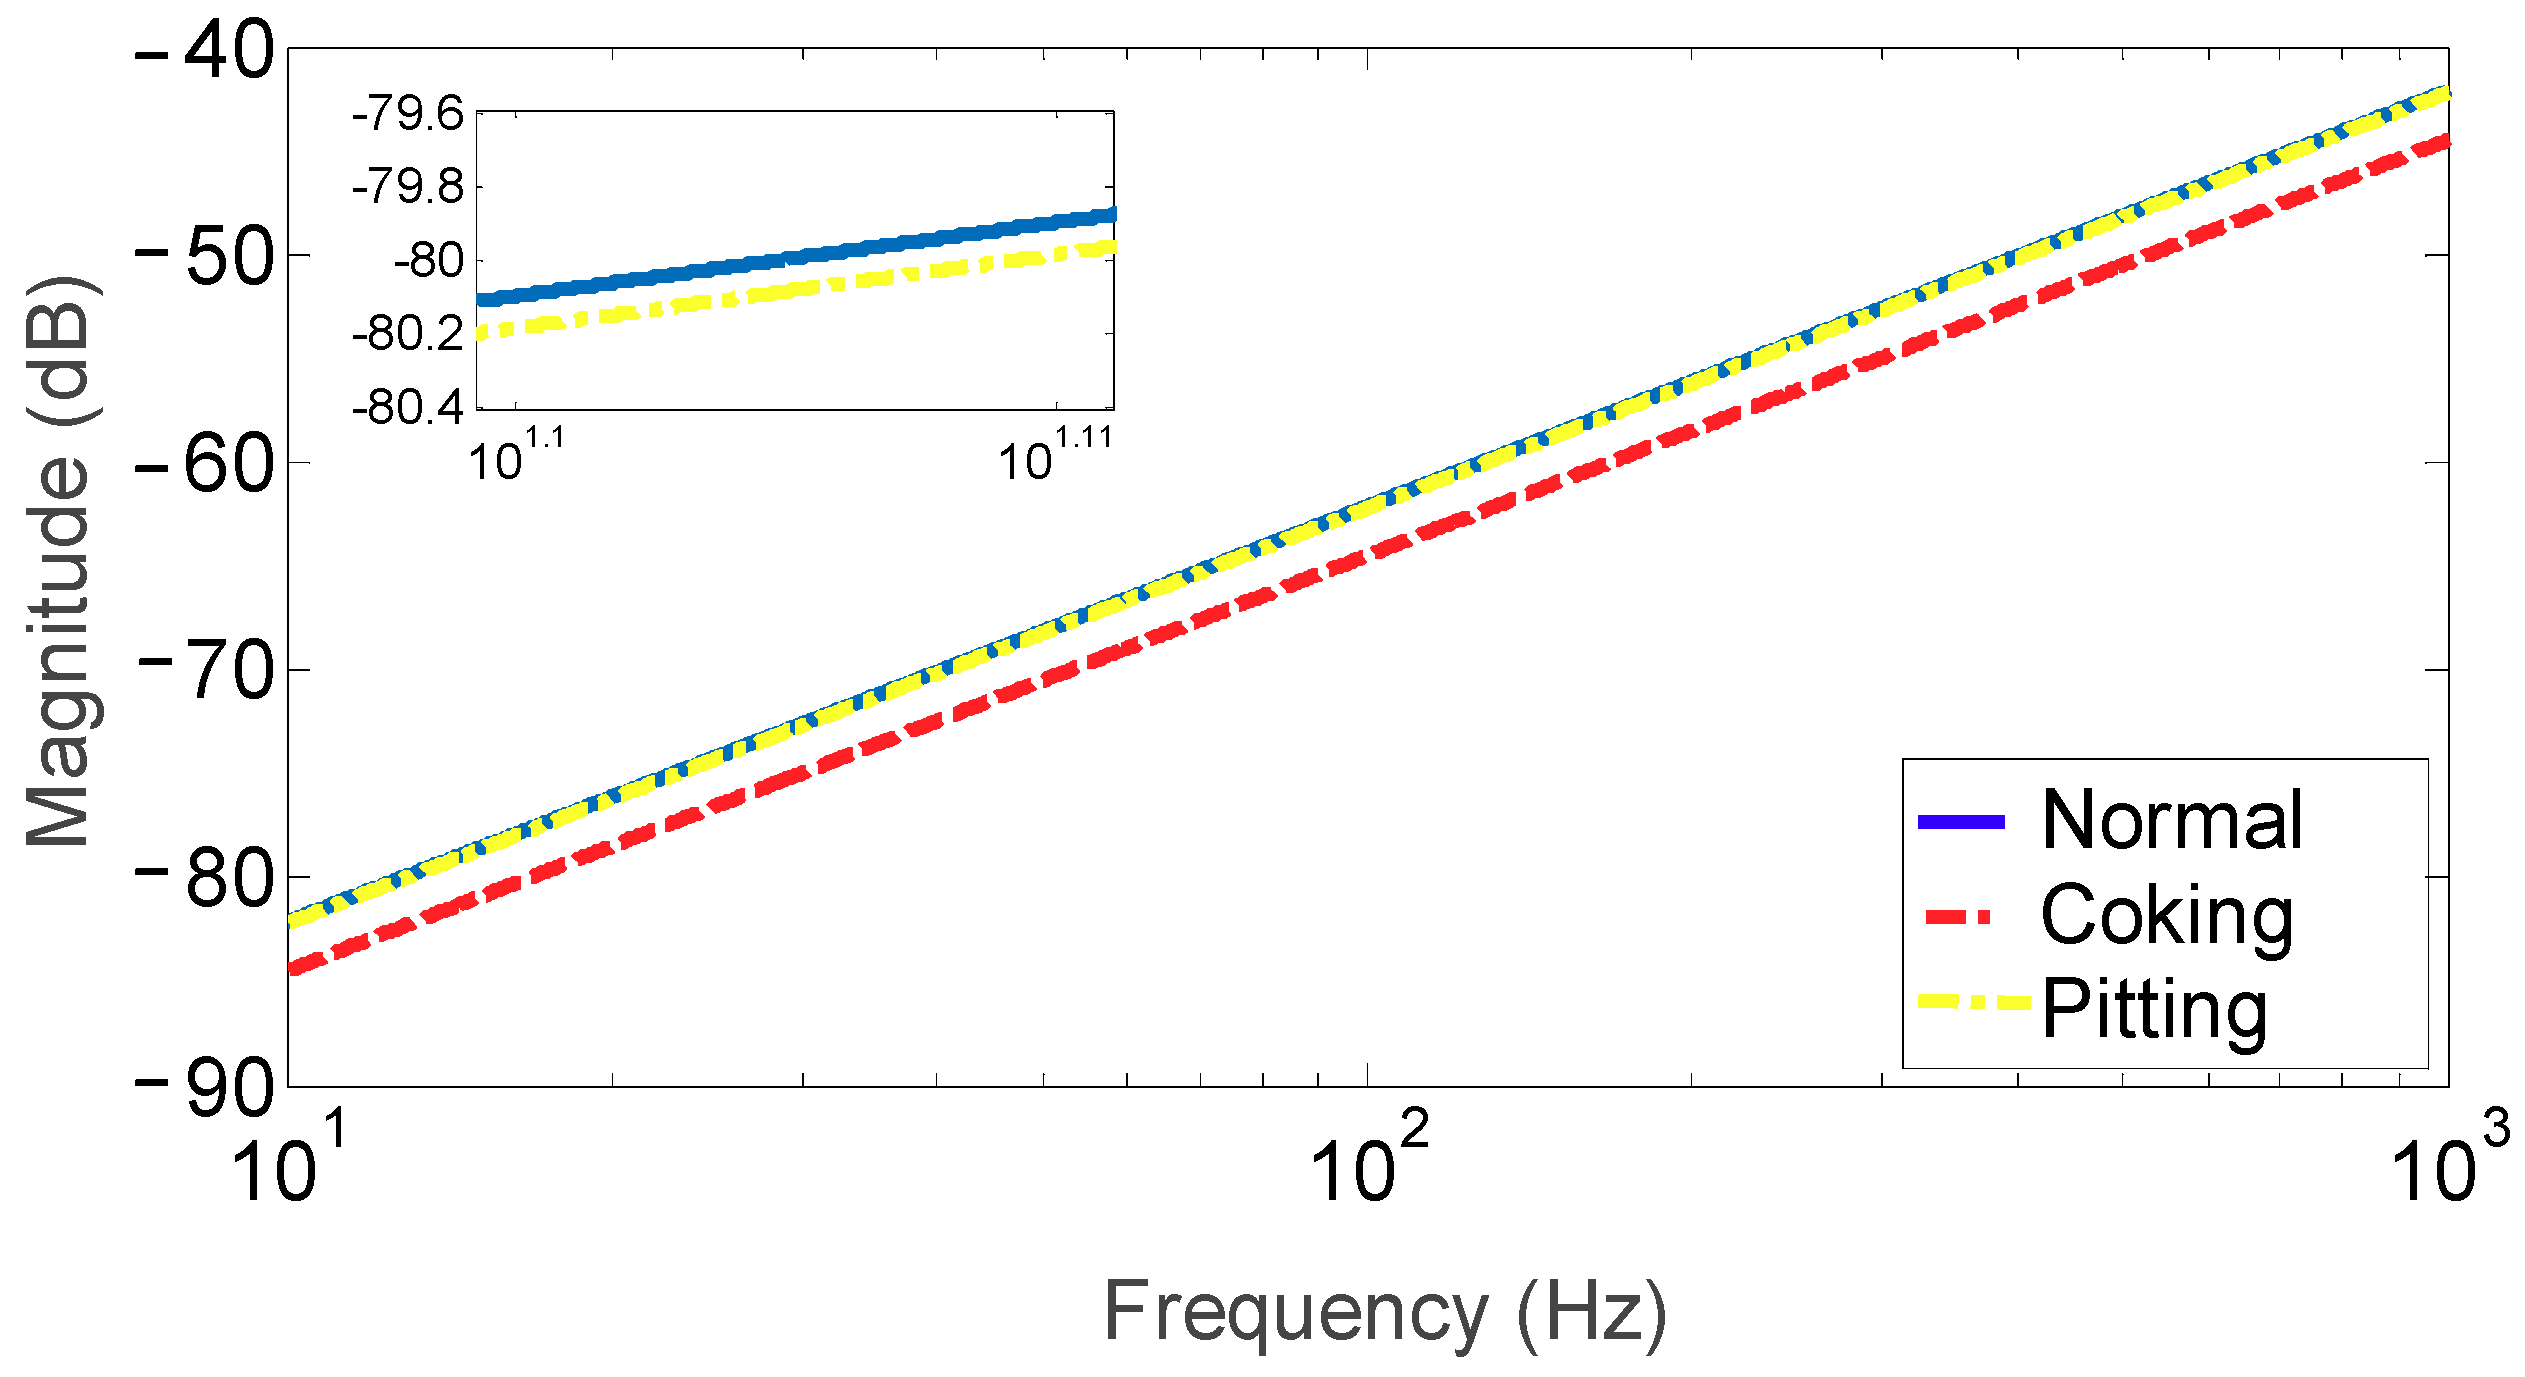
Figure 15.
Measured capacitive interwinding FRA for normal vs. 100% coking and 100% pitting tap conditions.
Figure 15.
Measured capacitive interwinding FRA for normal vs. 100% coking and 100% pitting tap conditions.
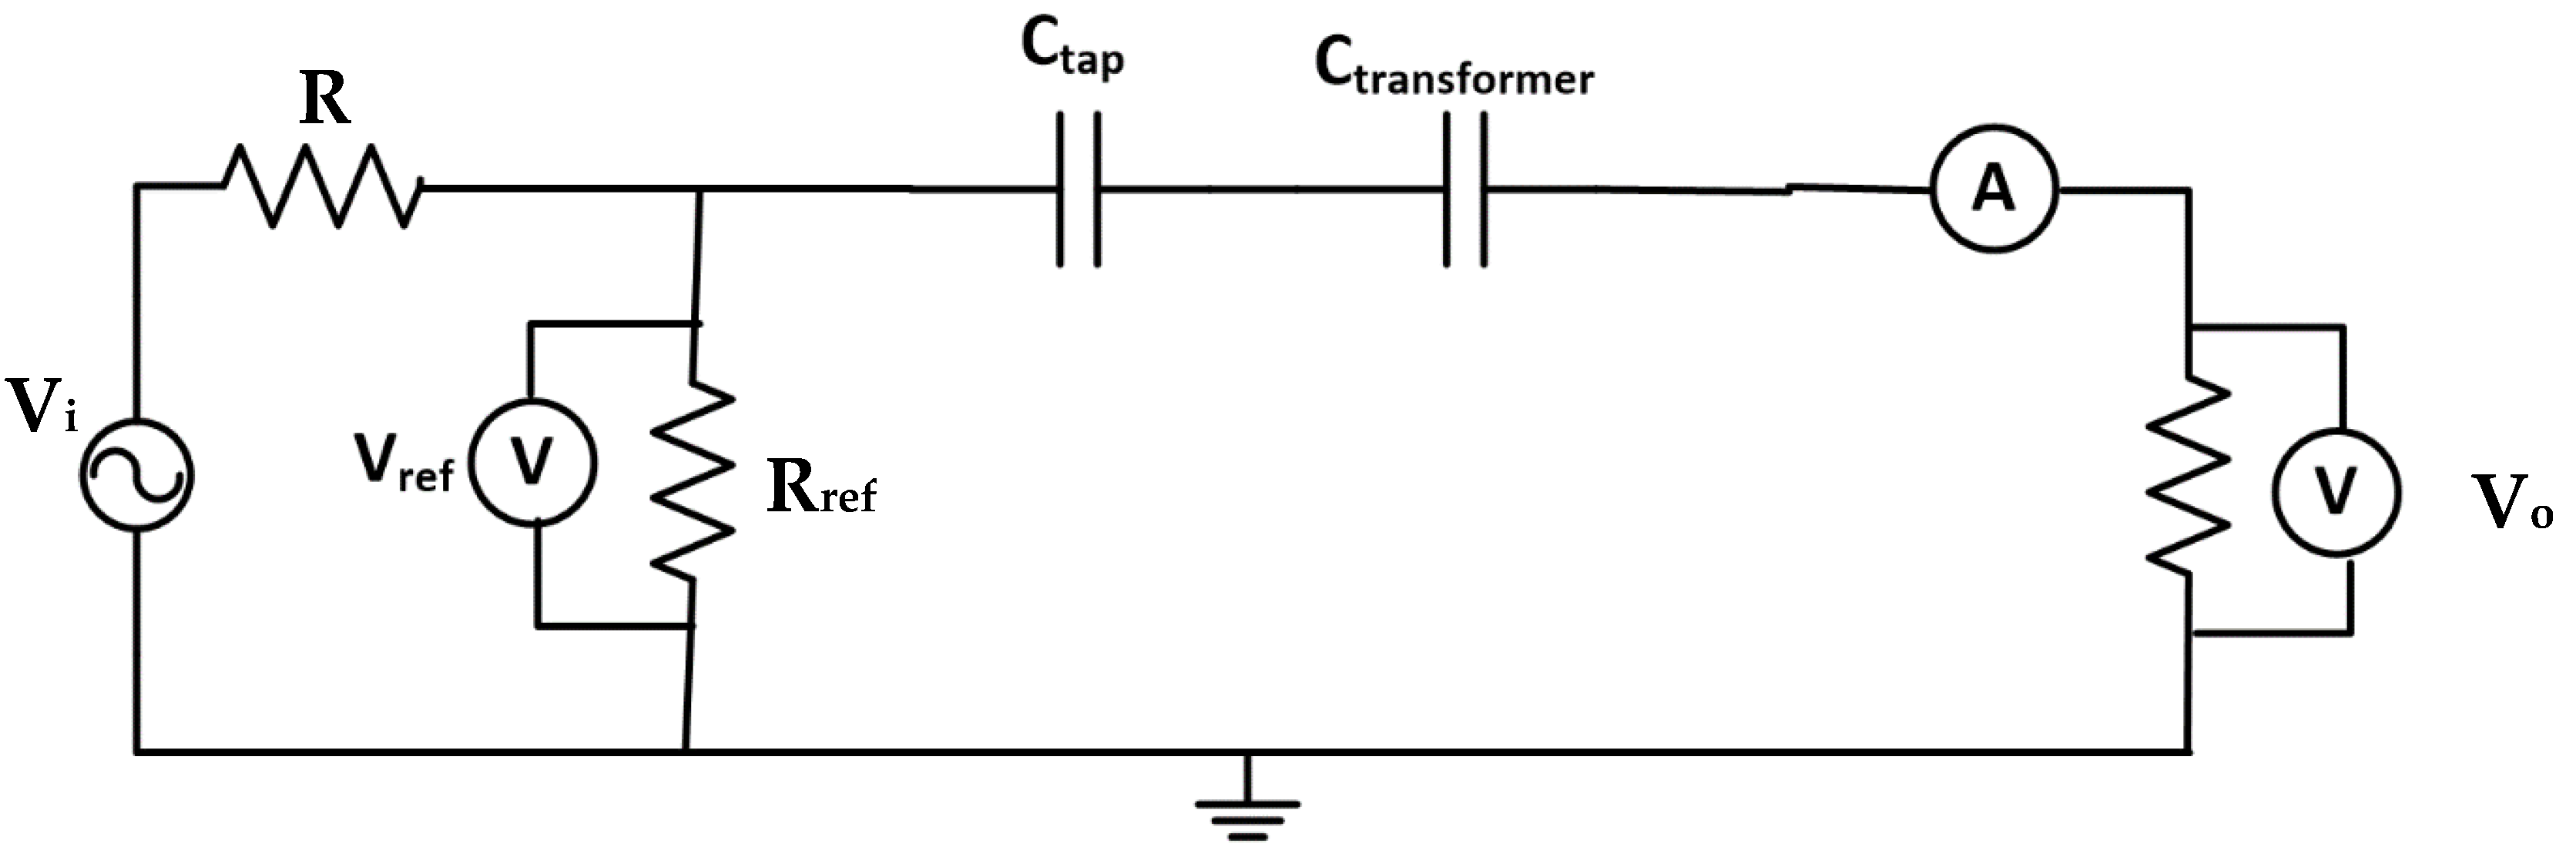
Figure 16.
Capacitive interwinding test configuration.
Figure 16.
Capacitive interwinding test configuration.
Figure 17.
Simulated capacitive interwinding FRA for normal vs. 100% coking and 100% pitting tap conditions.
Figure 17.
Simulated capacitive interwinding FRA for normal vs. 100% coking and 100% pitting tap conditions.
Figure 18.
Inductive interwinding test configuration.
Figure 18.
Inductive interwinding test configuration.
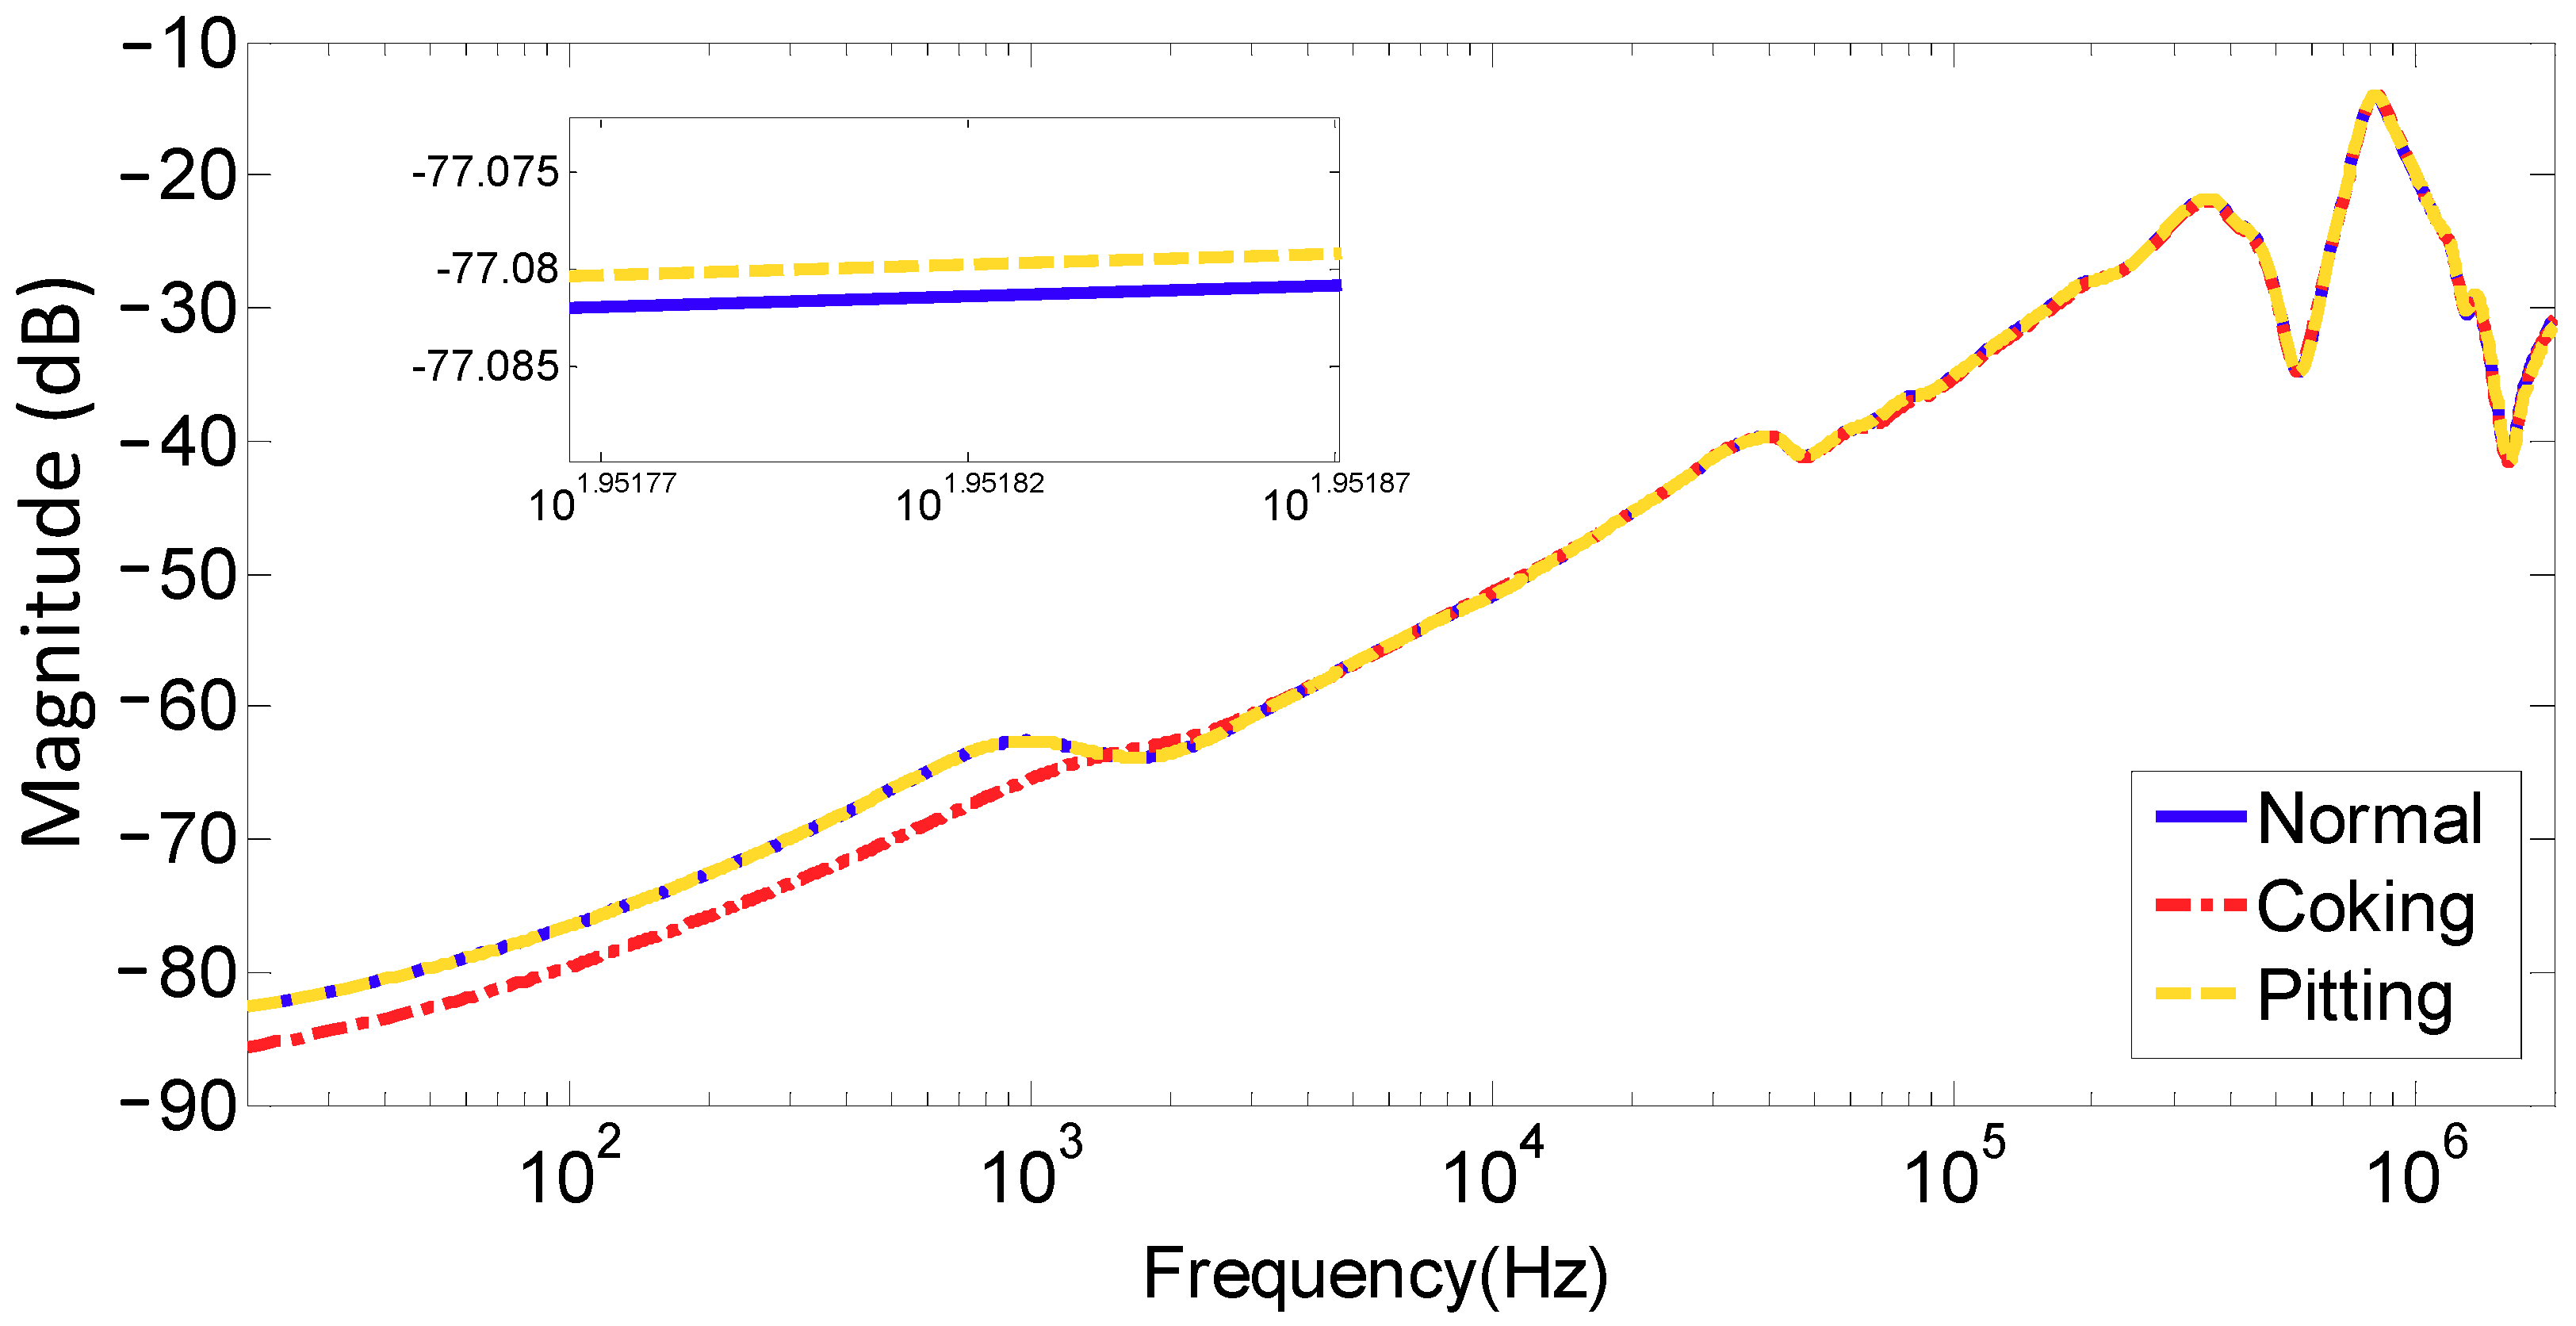
Figure 19.
Measured FRA for normal, 100% coking, and 100% pitting.
Figure 19.
Measured FRA for normal, 100% coking, and 100% pitting.
Figure 20.
Simulated FRA for normal, vs. 100% coking and 100% pitting.
Figure 20.
Simulated FRA for normal, vs. 100% coking and 100% pitting.
Table 1.
The 11/0.415 kV 500 kVA transformer tap changer configurations.
Table 1.
The 11/0.415 kV 500 kVA transformer tap changer configurations.
| Tap No. | Input Voltage (kV) | Connected Terminals in Figure 1b |
|---|
| Tap 1 | 11.550 | 4, 5 |
| Tap 2 | 11.275 | 5, 3 |
| Tap 3 | 11.000 | 3, 6 |
| Tap 4 | 10.725 | 6, 2 |
| Tap 5 | 10.450 | 2, 7 |
Table 2.
RLC circuit parameters for the tap changer at different positions for the FRA open circuit test.
Table 2.
RLC circuit parameters for the tap changer at different positions for the FRA open circuit test.
| Tap Position | L (µH) | Rs Ω | Ls (µH) | Cp (pF) |
|---|
| Tap 4–5 | 5.00 | 1 | 100 | 100 |
| Tap 5–3 | 4.75 | 1.5 | 110 | 95 |
| Tap 3–6 | 4.50 | 1.10 | 120 | 90 |
| Tap 6–2 | 4.25 | 1.15 | 130 | 85 |
| Tap 2–7 | 4.00 | 1.20 | 140 | 80 |
Table 3.
Simulated RLC model parametric values for normal and coking.
Table 3.
Simulated RLC model parametric values for normal and coking.
| Condition | L (µH) | Ls (µH) | Rs Ω | Cp (pF) |
|---|
| Normal | 5 | 1 | 1 | 0.593 |
| Coking 50% | 5 | 0.909 | 100 | 0.538 |
| Coking 100% | 5 | 0.909 | 110 | 0.538 |
Table 4.
Values of a simulated circuit model for pitting.
Table 4.
Values of a simulated circuit model for pitting.
| Condition | L (µH) | Ls (µH) | Rs Ω | Cp (pF) |
|---|
| Normal | 500 | 0.001 | 1 | 0.512 |
| Pitting 50% | 500 | 0.002 | 909.1 | 0.464 |
| Pitting 100% | 500 | 0.003 | 833.3 | 0.464 |
Table 5.
Values of simulated short circuit model parameters.
Table 5.
Values of simulated short circuit model parameters.
| Condition | Lp (mH) | Cp (pF) | Rs Ω | Ls (mH) | Cs (nF) |
|---|
| Normal | 1 | 0.10 | 1 | 100 | 1.12 |
| Pitting | 1 | 0.10 | 1000 | 100 | 1.12 |
| Coking | 1 | 0.83 | 1000 | 50 | 1.01 |
Table 6.
Capacitive intertwining value of different conditions.
Table 6.
Capacitive intertwining value of different conditions.
| Condition | Interwinding Capacitance (µF) |
|---|
| Normal | 0.05 |
| Pitting | 0.0495 |
| Coking | 0.0381 |
Table 7.
Values of simulated short circuit model parameters.
Table 7.
Values of simulated short circuit model parameters.
| Condition | Lp (mH) | Cp (µF) | Rs Ω | Cs (µF) |
|---|
| Normal | 1 | 1 | 2 | 2000 |
| Pitting | 1 | 1.5 | 2380 | 0.0202 |
| Coking | 1 | 1.27 | 2380 | 0.0263 |

 ,
, 


