Article

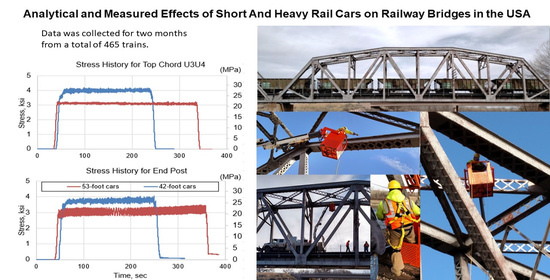
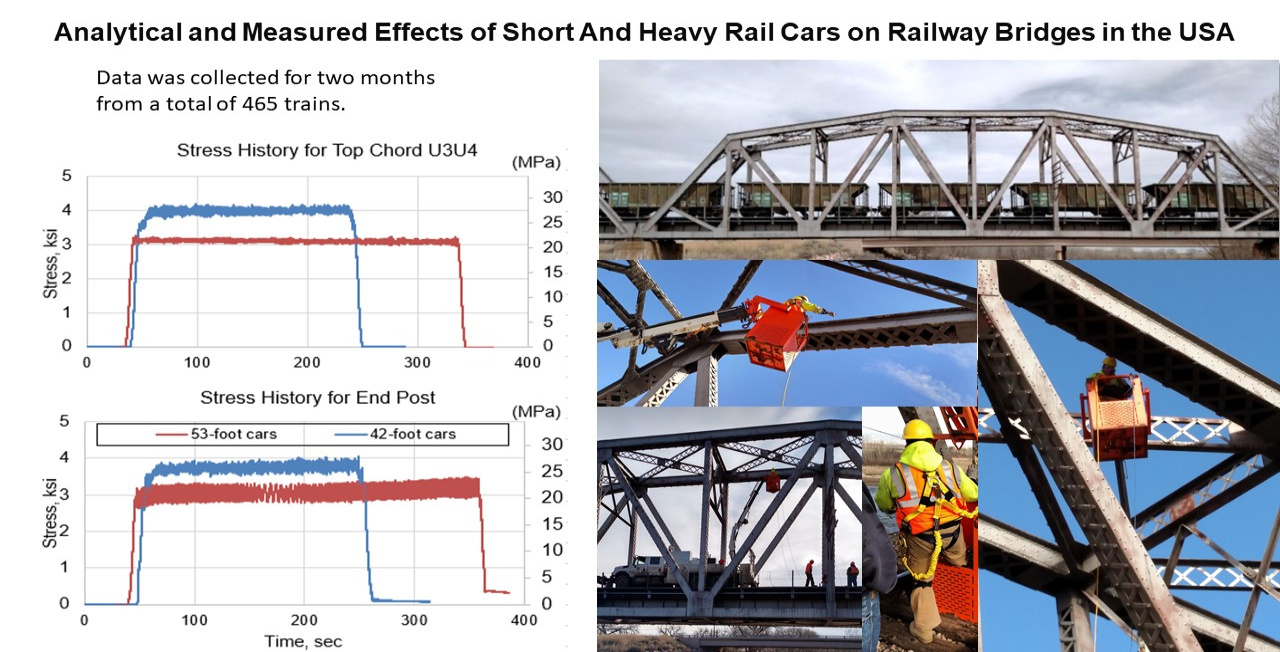
Analytical and Measured Effects of Short and Heavy Rail Cars on Railway Bridges in the USA

1
Road and Bridge Research Institute, 03-302 Warsaw, Poland
2
Transportation Technology Center, Inc., Pueblo, CO 81001, USA
3
Purdue University Bowen Laboratory, West Lafayette, IN 47907, USA
*
Author to whom correspondence should be addressed.
Appl. Sci. 2021, 11(7), 3126; https://doi.org/10.3390/app11073126
Submission received: 19 February 2021 / Revised: 29 March 2021 / Accepted: 29 March 2021 / Published: 1 April 2021
(This article belongs to the Special Issue Advanced Railway Infrastructures Engineering)

Abstract

:
The overall number of railcars recorded in the North American railcar fleet from 2010 to 2015 increased about 5%; the number of all 130 tonne (286,000 lb) gross weight railcars (heavy axle load (HAL) railcars) increased 19%. The increase in shipments in short railcars increases the loading on railway bridges, especially the 12.8-m railcars, commonly used to ship sand and cement, which is approximately a 25% increase in load per unit length compared to 16.2-m coal cars. Significant differences between maximum effects of shorter railcars and common 16.2-m railcars were predicted in analysis for bridge spans longer than 18.3 m. The differences were more prominent on spans 24.4 m and longer. This study presents analytical and measured effects of freight railcars on a two-span truss bridge, with spans of 61 m and 33.5 m, and a 35-m riveted steel deck plate girder (DPG) bridge. The investigation confirmed that short railcars cause higher load effects on main bridge components: the 35-m riveted steel DPG has 28% higher stresses at mid-span, while in the truss, the difference in stresses depends on the location of the member and ranges from 15 to 35%.

Graphical Abstract

1. Introduction

The increase in shipments in short railcars in North America increases the loading on railway bridges. The 12.8-m (42-ft) railcars commonly used to ship sand and cement are approximately a 25% increase in load per unit length compared to 16.2-m (53-ft) coal cars. This may cause overloading of the structure and require weight restrictions on railway bridges—especially on longer spans that accommodate multiple short railcars [1]. For example, on a 64-m (210-ft) span, five 12.8-m (42-ft) railcars can fit instead of only four 16.2-m (53-ft) railcars [2,3].
In the last years in North America, the number of railcars increased consistently; from 2010 to 2015 it increased about 5%, and the number of all HAL railcars increased 19% [4]. Figure 1 shows that the number of HAL railcars in the North American railcar fleet shorter than 14.6 m (48 ft) in length (primarily covered hopper cars) grew from ~73,000 in 2010 to more than 125,000 in 2015. Further, the number of railcars shorter than 12.8 m (42 ft) in length increased from ~40,000 in 2010 to more than 85,000 in 2015.
The other aspect of this research was to compare stresses calculated from measured strains and stresses calculated using analytical models. Strain measurements were performed in the field under regular train service. Load measurements can enhance bridge assessment because they better define the stress levels at considered locations [5]. The actual live load distribution is often significantly different than expected from conventional analytical approaches that were most likely used in the original design. The study by DelGrego [6] shows the necessity of using field monitoring to better understand the behavior of older bridges prior to the design of renovation approaches. Other researchers concluded that the average ratio of measured static to simple calculated static values was 78% [7]. This paper presents comparisons between analytical calculations and field measurements of the bridge performance under short 12.8-m (42-ft) railcars and typical 16.2-m (53-ft) coal railcars. The results of finite element method (FEM) models match the stresses calculated from measured strains with small discrepancies.

2. Modeling and Analysis of a Steel Railroad Bridge

2.1. Current Design of Railroad Bridges in North America

The equivalent Cooper loading is based on the design loading recommended by the American Railway Engineering and Maintenance of Way Association [8]. It is current practice to design railway bridges for Cooper E80 loads; however, many older railway bridges, which are still in service, were designed for lesser loads, such as Cooper E60.
In this study, the equivalent Cooper loading was calculated for a large number of bridge spans from 1.5 m to 122 m (5- to 400-ft) long. Figure 2 shows the flexural bending effect on bridge spans less than 18.3 m (60 ft) is lower for a 12.76-m (41 ft, 10.5 in.) AAR railcar (with a bogie (truck) center of 8.3 m (27 ft, 4 in.) than for a 16.2-m (53-ft) coal car (with a truck center of 12.3 m (40 ft, 6 in.). As is also shown in Figure 2, short railcars have greater equivalent Cooper loads compared to common 16.2-m (53-ft) railcars on bridge spans 18.3 m (60 ft) and longer, and the difference is more prominent on bridge spans of 24.4 (80 ft) and longer. A typical six-axle locomotive governs for bridge spans from 16.8 m to 24.4 m (55- to 80-ft) long, and the common 16.2-m (53-ft) long railcar governs for bridge spans less than 16.8 m (55 ft) [1,2,3].

2.2. Modeling and Analysis of a Steel Railroad Bridge Using FEM Model

The modeling and analysis of railway bridges under moving load may be divided into two groups: a very simple vehicle model with an advanced bridge model, and a very complicated vehicle model with a simple bridge model. In addition to these two groups, some models include excitation due to rail surface roughness while other models neglect it. The inseparable part of railway bridge modeling is a consideration of the track and its properties; however, the full vehicle-track-bridge model is not always necessary to evaluate the complex bridge response under moving loads. The very detailed and complicated vehicle models are unnecessary if the main purpose is to study the bridge’s structural response [9].
The advantage of the FEM model concerning the evaluation of existing bridges is that the structural performance and its actual load-carrying capacity can better represent the field measurements. The current bridge condition and rate of deterioration reported during the technical inspection can be introduced to the FEM model. The defects and various bridge conditions can be incorporated in the FEM models to simulate and analyze the structural performance. The 3D FEM model of the existing bridge that contains all components and connections can predict stress concentration in places that are difficult to measure in the field. For example, for fatigue evaluation, the stress ranges obtained from measured strains are often not sufficient for cycle accumulation at the locations measured on the spans. The location of the maximum stress concentration and stress range can be identified using the FEM model. However, the advanced FEM models should be validated with field measurements to provide the most accurate bridge structural behavior. Moreover, the dynamic computations (simulations) are more reliable when the analytical inputs, including rolling stock data, are provided by the railway authorities [10].
A real-time field data acquisition system is an important tool for obtaining the response of a structure under actual dynamic loading conditions. The results obtained from in-situ studies, with the whole range of operating and material conditions, are the most reliable [11]. The field data provides information about the actual behavior of the structure’s capacity, the degree of load distribution by individual elements, and the identification of dynamic parameters. The development of measuring equipment and signal processing technology enables field testing to be carried out in an automated manner, which leads to the creation of technical monitoring systems [12,13]. Leander et al. [14] used strain gauges for monitoring the Soerstrom Bridge in central Stockholm to find out the remaining fatigue life of stringers and cross beams. The researchers also explored differences between the theoretical strain values and the obtained field strain data in predicting the initiation of fatigue crack in bridge members.

2.3. Description of Tested and Analyzed Bridges

This study covered testing on two railway bridges. The first bridge is a ballasted deck bridge that contains two riveted truss spans with lengths of 33.5 m (110 ft) and 61 m (200 ft) [1,2,3]. The bridge is on a tangent alignment. Figure 3 presents the general dimensions of the bridge, and the colors on the diagram represent different cross-sections (symbol “U” refers to connection of upper chords, symbol “L” refers to connections of lower chords, and “M” is a connection on the middle of a diagonal).
All member sections are built-up sections. Two types of sections dominate over the main truss members: two laced C-sections and an inverted U-section. Table 1 provides more information about the geometric properties of the main members within the trusses. The stringers and floor beams are riveted built-up 1.2-m (48-in.) deep girder sections.
The second bridge has five ballasted riveted steel deck plate girder (DPG) spans on a curved alignment with north girders (G1) of 34.7 m (113 ft, 10 in.) overall length and 34 m (111 ft, 6 in.) between bearing centers, and south girders (G2) of 35 m (115 ft) overall length and 34.3 m (112 ft, 8 in.) between bearing centers [15]. Figure 4 illustrates detailed dimensions.

3. Results of Case Studies

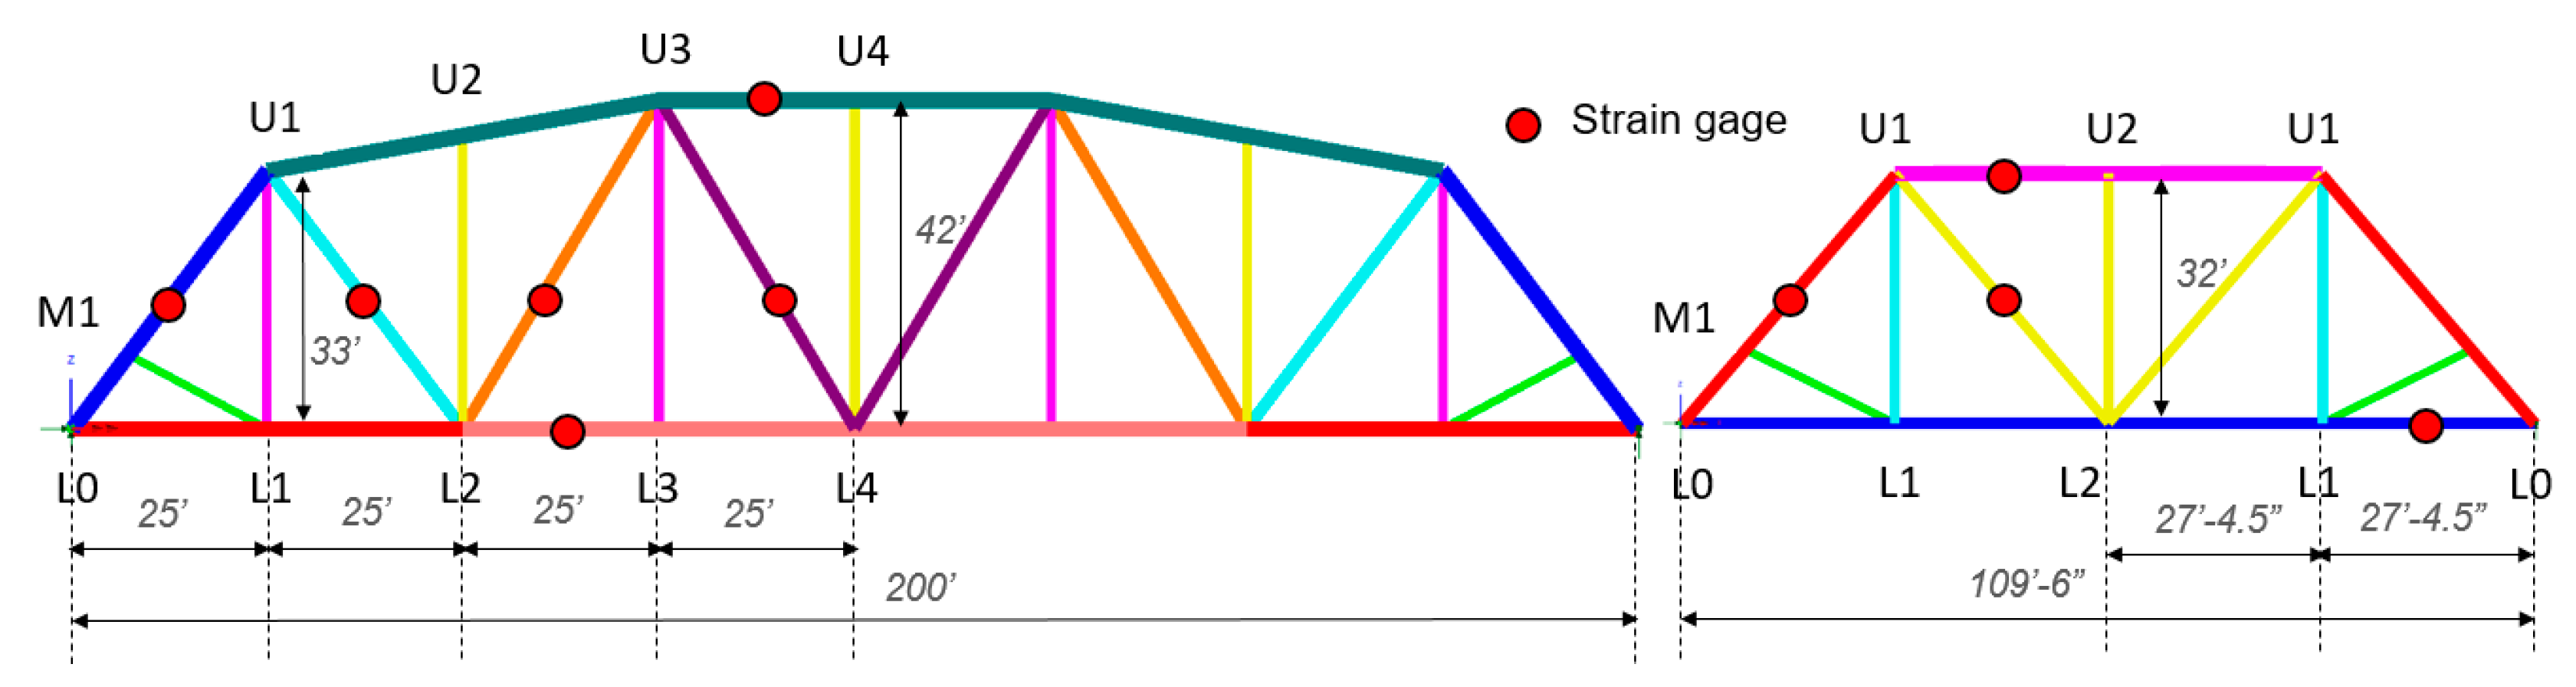
3.1. Riveted Truss Spans

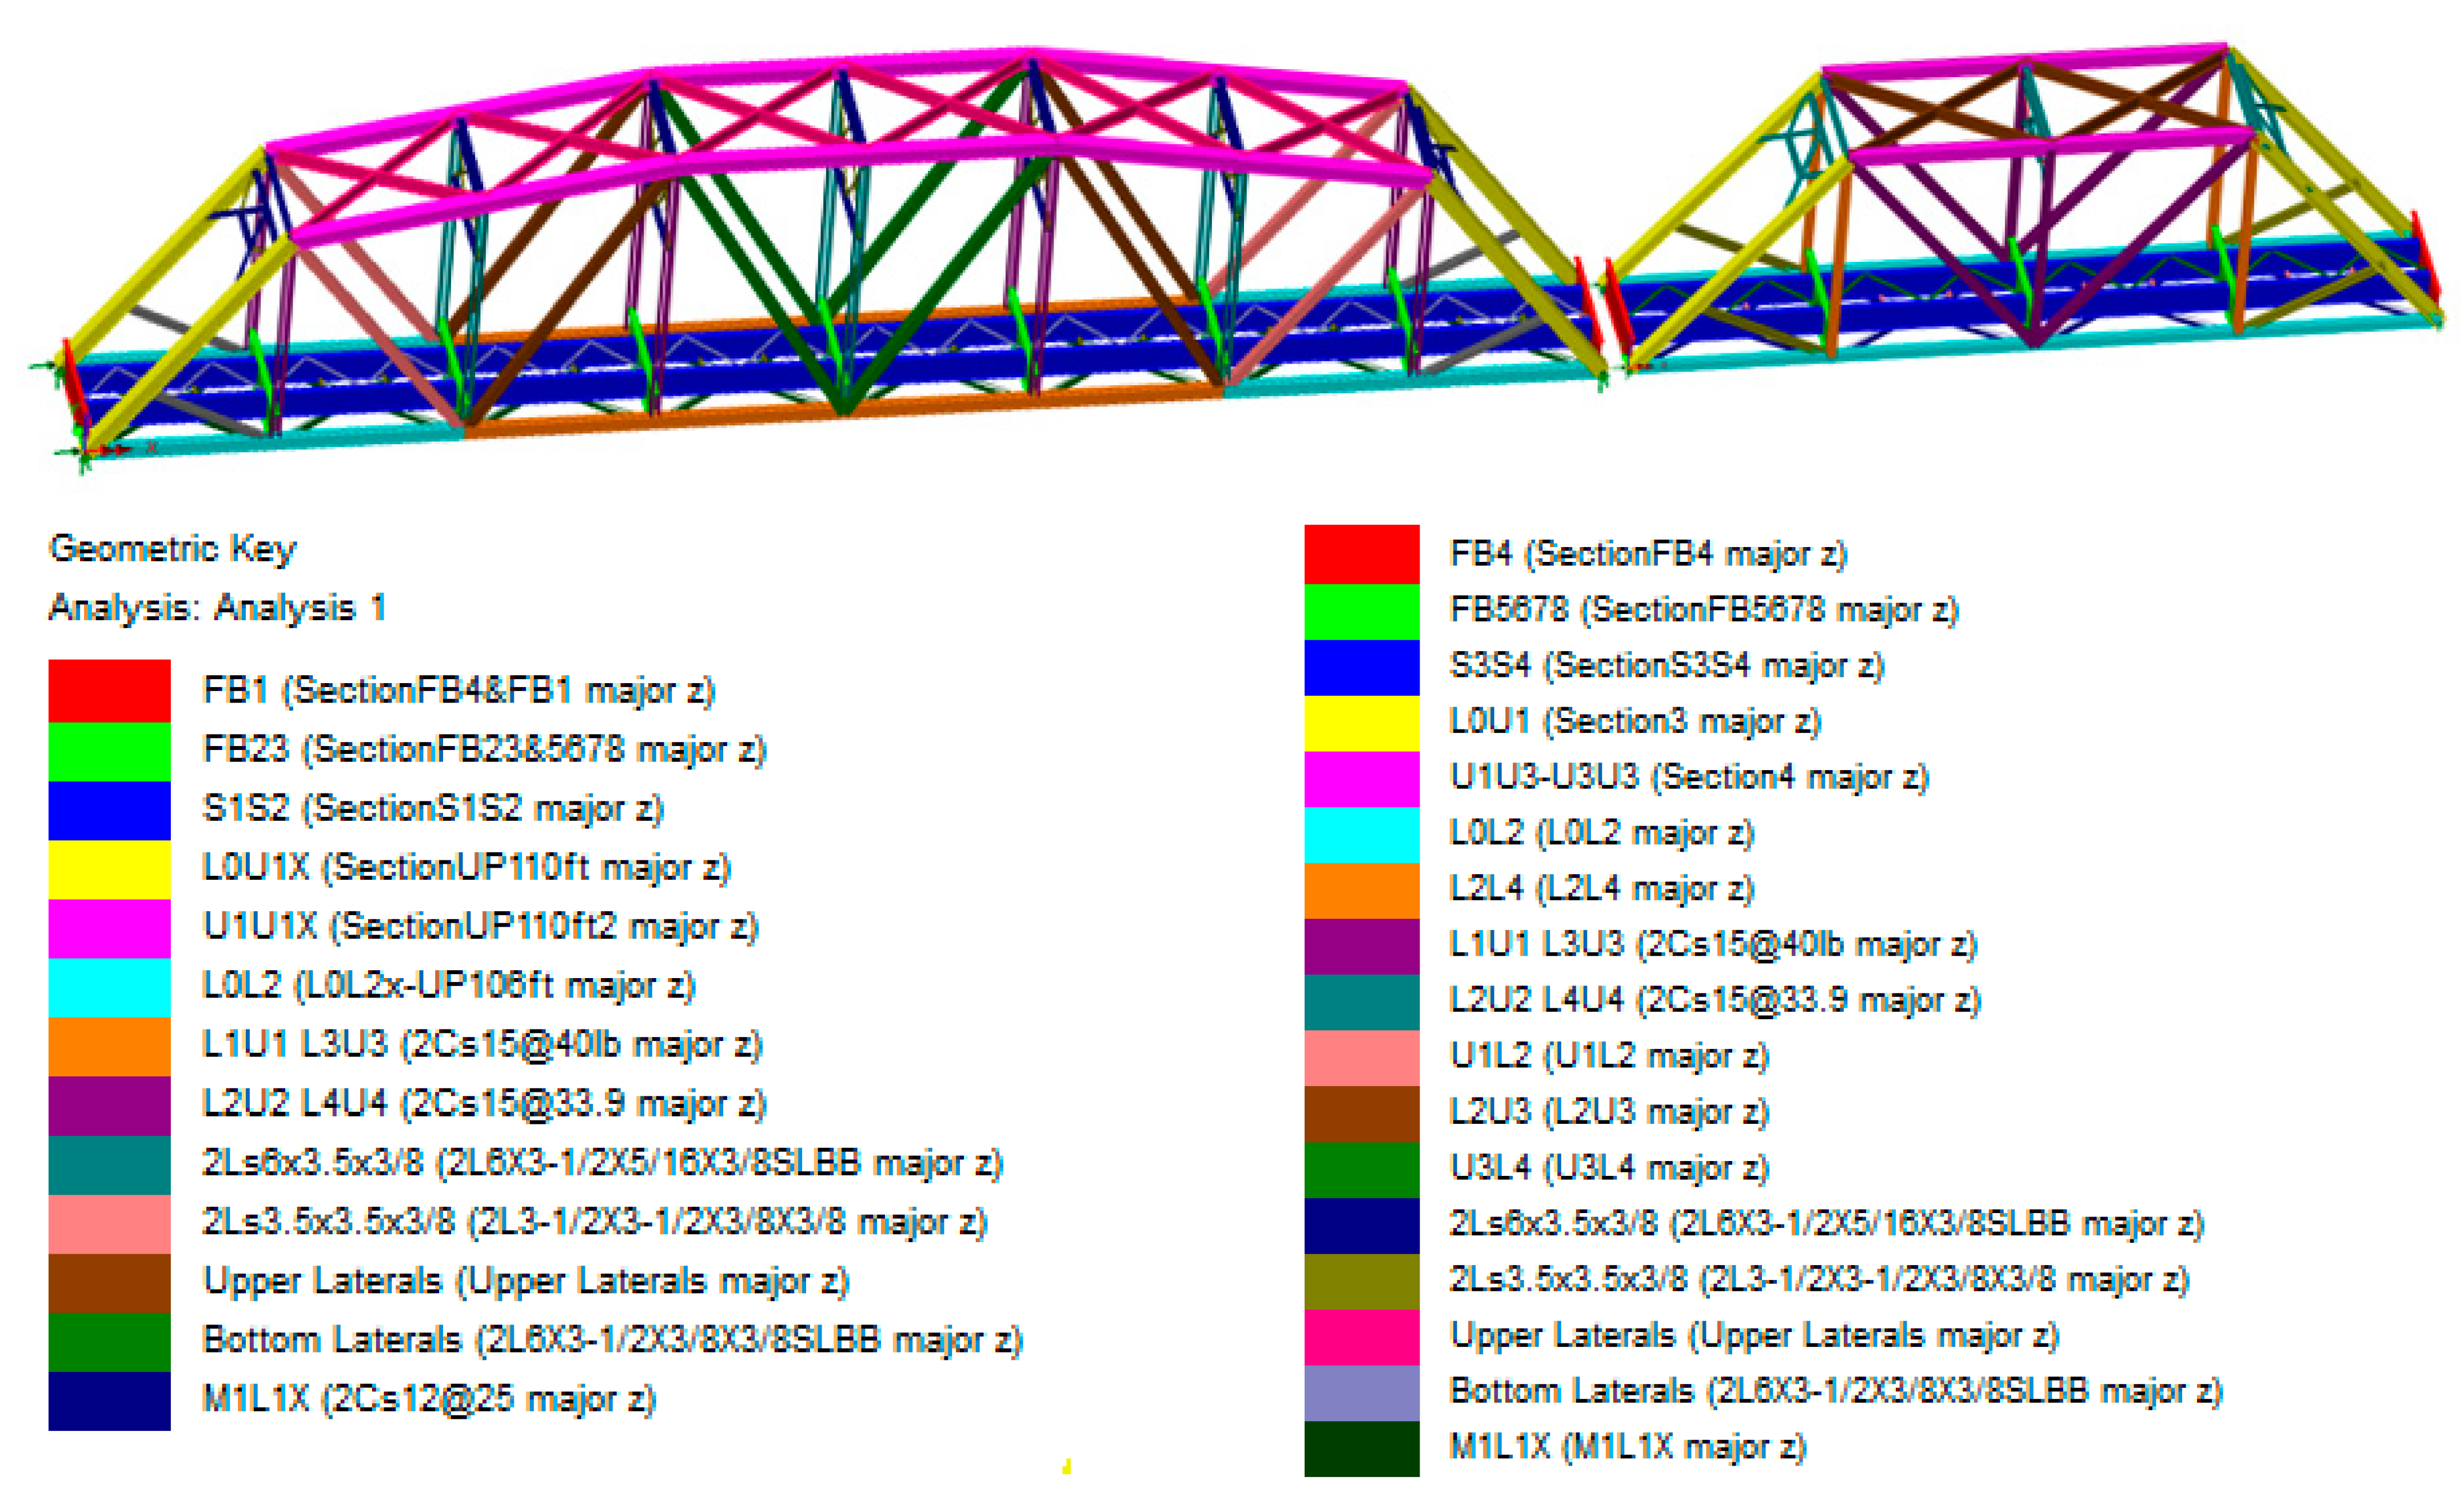
3.1.1. FEM Modeling and Analysis of Truss Bridge

A variety of loads can be applied to a structure at the same time. For instance, dead load and live load, impact, centrifugal force, temperature, and the wind should be considered in the analysis [16]. Therefore, with a proper FEM model validated with field measurements, the analysis can be carried out with additional load cases to examine bridge structural behavior. The 3D FEM model of the existing bridge that contains all components and connections can predict stress concentration in places that are difficult to measure in the field. In this study, the analytical calculations were performed to guide the test plan. The effects of railcar lengths on truss span members depend on the type and location of the member, as well as the type and length of the truss. To evaluate the load effects, a 3D FEM model was developed in LUSAS software, Bridge Plus 2020 [17]. The advantage of a 3D model is that it contains all components and connections that can closely replicate the actual behavior of the structure.
The bridge model was created using 3D beam and shell elements. The beam elements, with appropriate cross-sections, were used for all truss members that carry primarily axial forces. The floor beams and stringers were modeled using shell elements appropriate for members in which one dimension, the thickness, is significantly smaller than the other dimensions. The stringer-to-floor-beam connections were defined to replicate the continuous behavior of the stringers. However, the focus of the analysis was to find load effects on the main bridge components, not connections.
The bridge models were created both with and without the deck and ballasted track. The analytical results that match the stresses calculated from measured strains were obtained using the model without the deck and ballasted track (Figure 5).
The load was applied directly onto the stringers. When the track components, i.e., rail, sleepers (ties), and ballast (modeled as a volume), were added to the model, the stresses in the bottom flange of stringers were much lower than the test data. It seems likely that the ballast used in the model was not only distributing the load but also influencing the stress distribution in the cross-section of the stringer. It is recommended to investigate further this issue by measuring strains in the components of the floor system with a focus on connection behavior and potential composite action of stringers and floor-beam with the track system.
The ballast distribution can be easily introduced by replacing each point force corresponding to an axle load with a set of point forces distributed over three adjacent sleepers (Figure 6). More options of the axle load distribution and the effect of axle load spreading through the ballast as well as the effect of support stiffness were investigated on short-span railway bridges by Axellson et al. [18].
Stresses were calculated under moving loads for the entire span using common 16.2-m (53-ft) railcars and short 12.8-m (42-ft) railcars. Figure 7 presents examples of stress histories on selected bridge members due to a moving set of railcars.
The calculated stresses in the 61-m (200-ft) truss due to short railcars were 15 to 25% higher than for common length railcars in most of the primary members such as end posts, primary diagonals (U1L2), and top and bottom chords. The intermediate diagonals L2U3 and U3L4 experienced 13 and 7% higher stresses, respectively, due to common length railcars when compared to the short railcars. Figure 8 presents a comparison of predicted peak stresses for the main bridge components on the 61-m (200-ft) and the 33.5-m (110-ft) spans. In the 33.5-m (110-ft) long truss, predicted stresses were 7 to 26% higher due to short railcars when compared to the common length railcars for all truss members.
The stringers had only a small variation in stresses of ~5% due to different railcar lengths, which was likely related to the axle spacing and the panel length of the truss. Figure 9 shows the stress histories for the stringers. The stress histories indicate that stringers experienced a slight up-lift effect, which was due to partial continuity of the stringers connected with the floor beams. They behaved somewhat like a single continuous beam rather than separate simply supported beams.
The stress ranges due to 12.8-m (42-ft) short railcars and 16.2-m (53-ft) standard length railcars were predicted to be less than 6.9 MPa (1.0 ksi) for all primary members in both trusses. Higher stress ranges, up to 13.8 MPa (2.0 ksi), were predicted on secondary diagonals due to 16.2-m (53-ft) railcars. As expected, the largest stress ranges were seen on stringers, as noted above.
To verify the analysis, a test was performed in 2016 on a two-span truss bridge, with spans of 61 m (200 ft) and 33.5 m (110 ft). The analytical calculations indicated that the effect of short railcars was most prominent on the end posts, diagonals, and top and bottom chords; therefore, the locations of the gauges were selected to be placed on the primary members.

3.1.2. Results from Test of Truss Bridge

The strain gauge data were collected on a two-span truss bridge, with spans of 61 m (200 ft) and 33.5 m (110 ft), for two months to compare the structural response under typical 16.2-m (53-ft) coal cars as well as shorter railcars of cement trains and rock trains and to show the differences due to railcar lengths. A total of 24 strain gauges were installed on main members of trusses to record axial stresses, and four additional strain gauges were installed on stringers to record bending stresses [3].
Based on the results from initial FEM analysis, several members of both trusses were selected to be instrumented to verify the differences due to various railcar lengths. On the 61-m (200-ft) span, 14 strain gauges to evaluate axial forces were installed on the bottom chord (L2L3) and top chord (U3U4) close to the center span, end post (L0U1), and diagonals (U1L2, L2U3, and U3L4). Similarly, on the 33.5-m (110-ft) span, strain gauges were installed on the bottom (L1L2) and top (U1U2) chords close to the center span, end post (L0U1), and diagonal (U1L2). The bottom chords were instrumented on both inside and outside of the cross-section.
Data were collected under a total of 465 trains, which were comprised of 299 empty unit trains, 120 mixed freight trains, and 46 loaded unit trains [3]. The research focused specifically on loaded trains; therefore, data from the 46 loaded unit trains were then separated by the length of their cars. Thirteen loaded unit coal trains of 16.2-m (53-ft) common length railcars, nineteen loaded unit rock trains of 13.1-m (43-ft) railcars, and eight loaded unit cement trains of 12.8-m (42-ft) short railcars were analyzed to validate the analytical results. Figure 10 compares the stress histories calculated from measured strains for a train with 12.8-m (42-ft) railcars and a train with 16.2-m (53-ft) railcars.
As predicted by analysis, the 12.8-m (42-ft) short railcars caused higher stresses in the top chord and end post of the 61-m (200-ft) span. Figure 11 illustrates the typical peak stresses caused by unit trains of 16.2-m (53-ft) common length railcars and unit trains of 12.8-m and 13.1-m (42- and 43-ft) short railcars on the top, bottom, and diagonal members of the 61-m (200-ft) span.
The top and bottom chords experienced stress increases of 31 and 28%, respectively. The end post saw a 20% stress increase, whereas the diagonal U1L2 saw a 21% stress increase. A 4–6% stress increase was recorded in the intermediate diagonals.
The test yielded similar results for the 33.5-m (110-ft) span. Figure 12 shows the comparison of stresses between 12.8-m and 13.1-m (42- and 43-ft) short railcars and 16.2-m (53-ft) common length railcars along with the members of the 33.5-m (110-ft) span.
The top and bottom chords each experienced a 30% increase in stresses due to the short railcars. The end post saw an 18% increase, and the diagonal U1L2 saw a 13% stress increase due to short railcars.
Stress ranges were calculated to determine the fatigue cycles that each member experienced. Figure 13 shows the stress ranges for the sets of the 12.8-m and 13.1-m (42- and 43-ft) short railcars and 16.2-m (53-ft) common length railcars on the 33.5-m and 61-m (110- and 200-ft) spans. The stress ranges of the top chord were not included, because they were close to zero.
All of the stress ranges calculated from measured strains for the main span members were well below the variable amplitude fatigue limit of 41 MPa (6 ksi) according to AREMA provisions [8]. For the main span members, fatigue was not a concern for either of the trusses due to the 16.2-m (53-ft) common length railcars or to the 12.8-m (42-ft) short railcars.
Four strain gauges were also placed on the stringers of the 61-m (200-ft) span. Figure 14 shows the general location of these gauges. Figure 15 shows the comparison of stress time histories for 12.8-m (42-ft) short railcars and for 16.2-m (53-ft) common length railcars in Stringer S2. The typical peak stresses due to different railcar types on the stringers were calculated using the same methods as on the other bridge members. Figure 16 shows the comparisons for 12.8-m and 13.1-m (42- and 43-ft) short railcars and for 16.2-m (53-ft) common length railcars.
The stringers behaved differently due to the short railcars than the other members of the bridge. For example, Stringer S2 experienced 15% less stress, and S3 experienced 10% less stress due to short railcars. This was related to the ratio of the railcar length to the stringer length that was previously discussed by Dick et al. [19]. The stringers connected by floor beams developed partial continuity, which also affected the results.
The effect of railcar length on stringers was also visible when evaluating stress ranges. The stringers developed higher stress range cycles due to 16.2-m (53-ft) common length railcars than due to the 12.8-m and 13.1-m (42- and 43-ft) short railcars (Figure 17).
The reported stress ranges for stringers were below the variable amplitude fatigue limit of 41 MPa (6 ksi). Therefore, fatigue was not a concern for stingers either due to the 16.2-m (53-ft) common length railcars or to the 12.8-m (42-ft) short railcars according to AREMA provision. However, the stress ranges due to longer cars were higher and were close to the limit of 41 MPa (6 ksi).

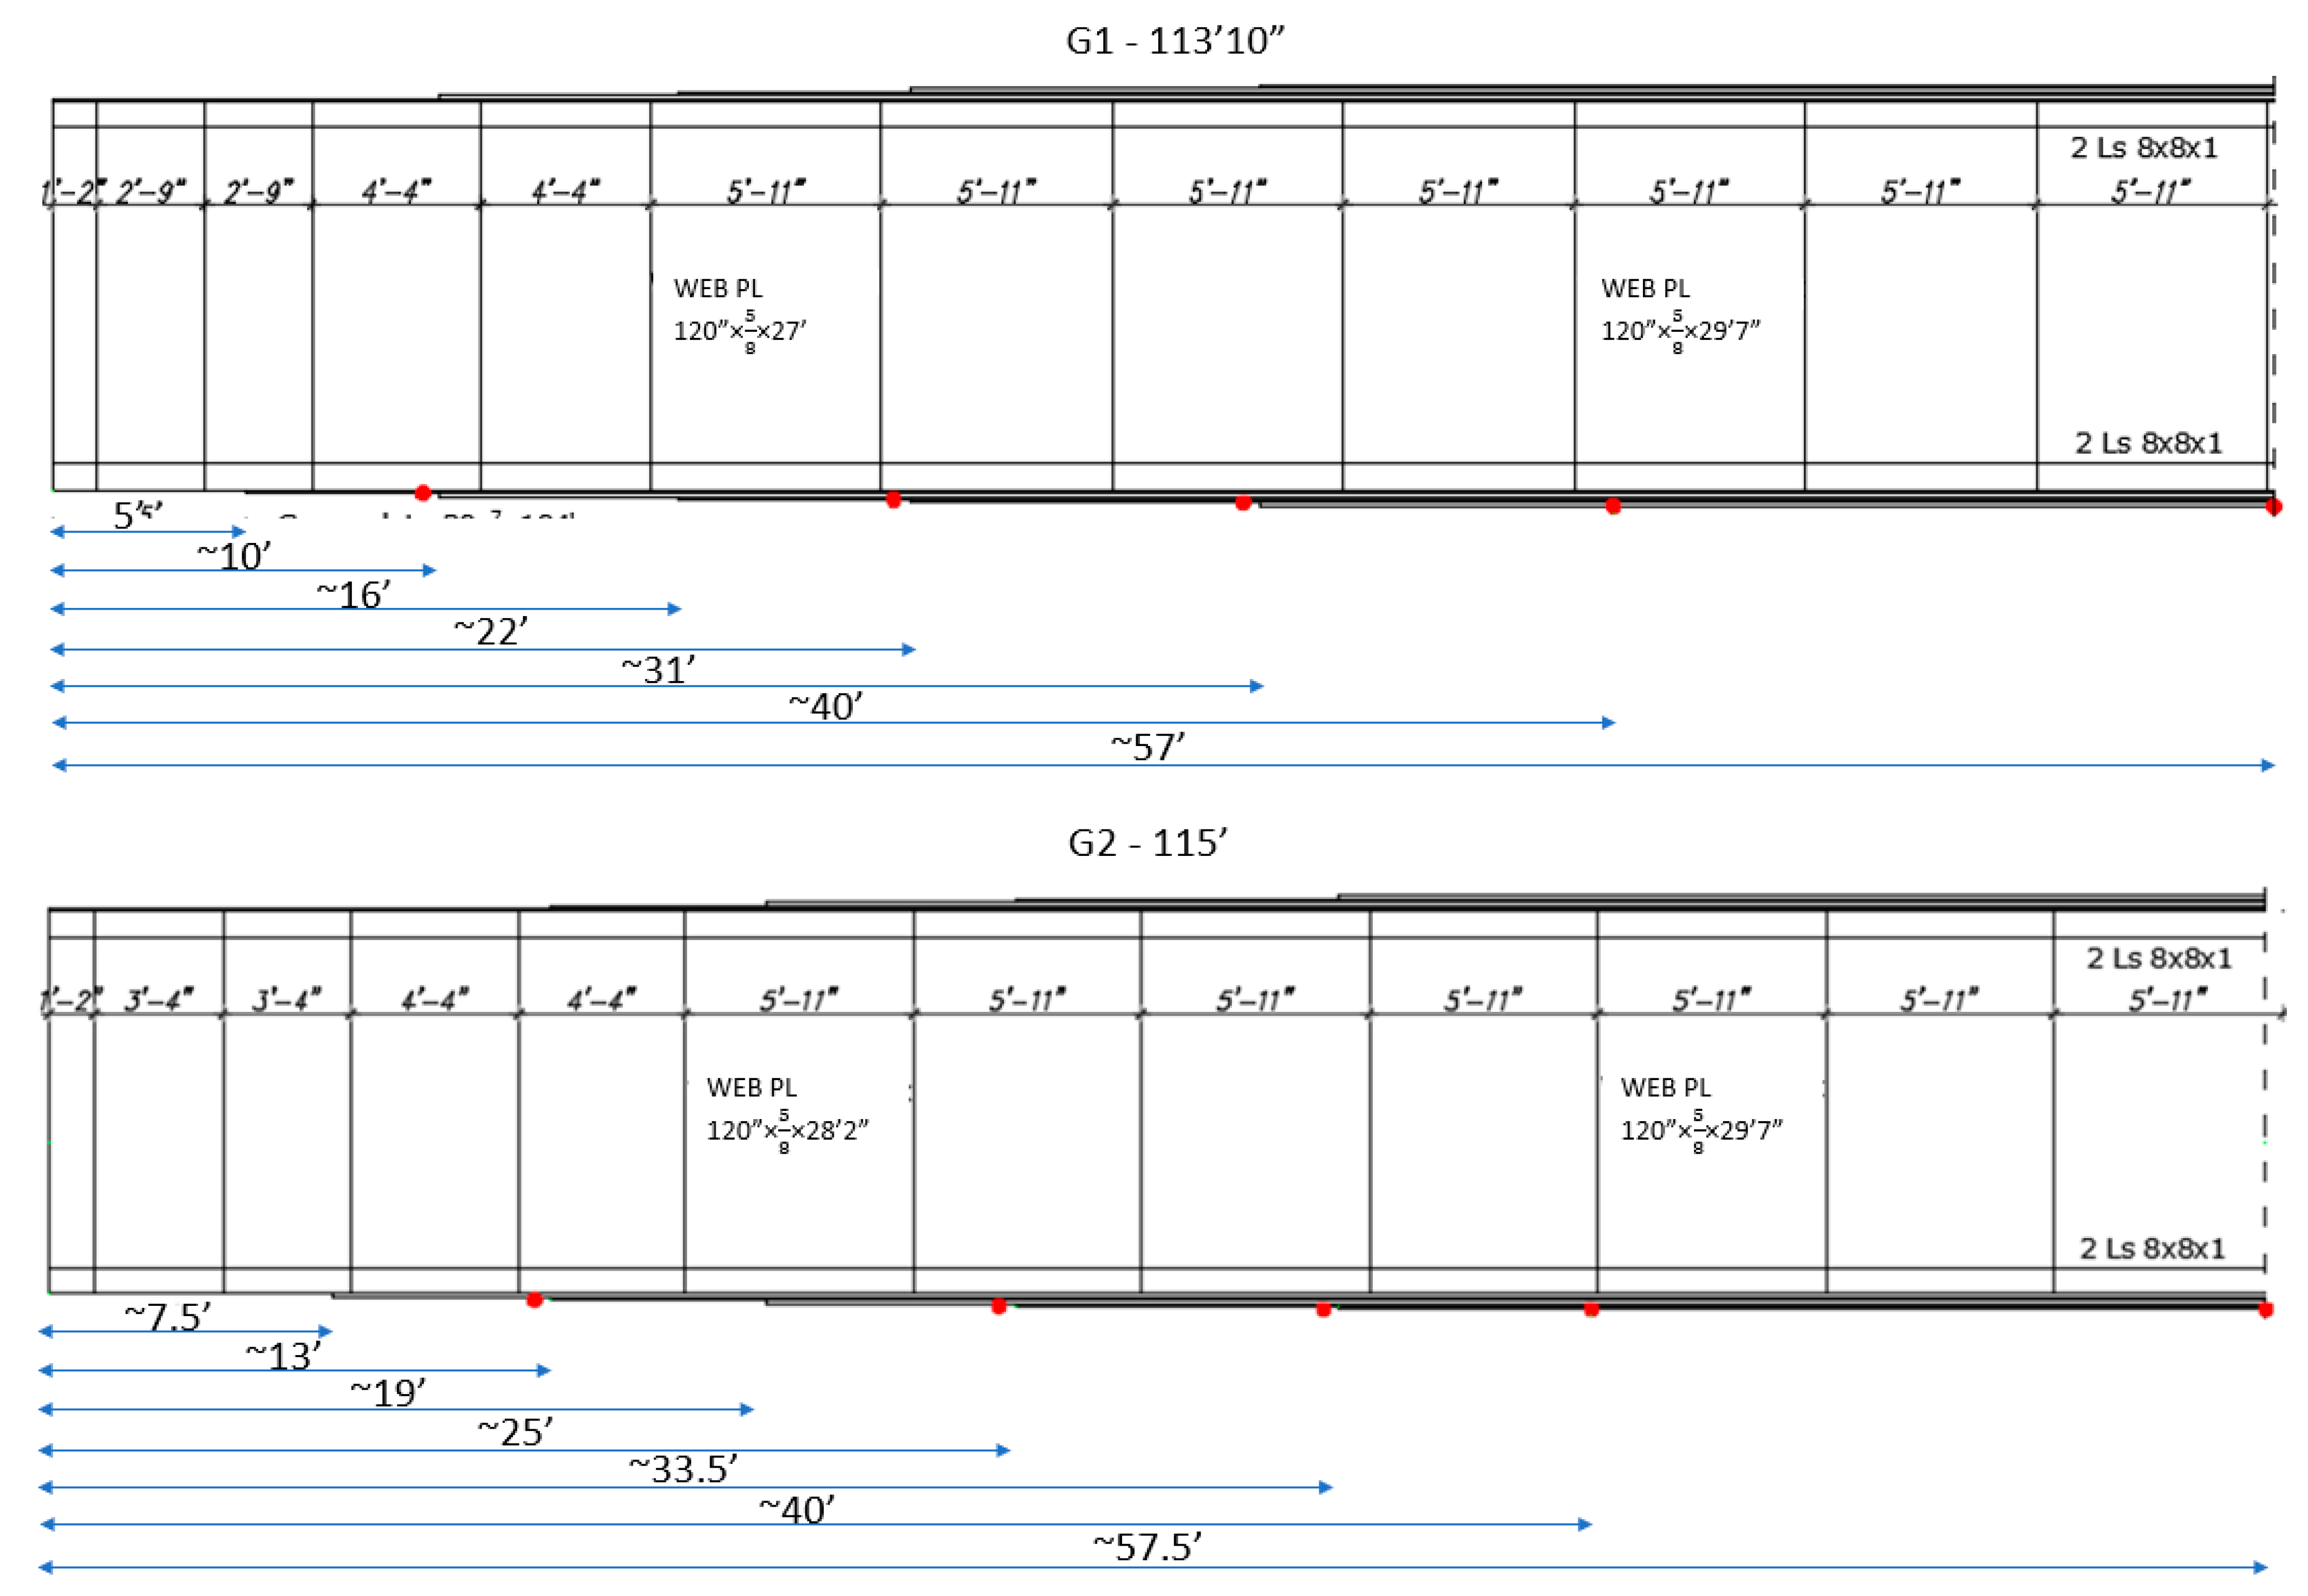
3.2. Riveted DPG Spans

3.2.1. FEM Modeling and Analysis of DPG Bridge

The analytical investigation of the riveted steel DPG span included a simple beam model and an FEM model. To evaluate the load effects, a 3D model was developed in LUSAS™ software [17]. The bridge model was created using shell elements appropriate for members in which the primary stresses are due to bending. Stresses were calculated under moving loads for the entire span using standard 16.2-m (53-ft) railcars and short 12.8-m (42-ft) railcars. Figure 18 presents examples of bending stress histories at mid-span and the quarter-span location due to a moving set of railcars.
The results show that the 12.8-m (42-ft) railcars produced higher stresses than 16.2-m (53-ft) railcars. In addition, it was visible that the quarter span location experienced higher stress ranges than the mid-span location, particularly under the 16.2-m (53-ft) common length railcars. This means that on the long girder span, the mid-span is not the most critical location for fatigue for common railcars (Dick et al. 2002). Figure 19 shows the stress ranges that were calculated for three common unit train cars (12.8-m (42-ft) sand or cement hoppers, 16.2-m (53-ft) coal cars, and 18.3-m (60-ft) grain cars) using gross section and zero impact. As the stress range envelopes showed, the mid-span location had an amplitude of stress cycles close to zero for the coal and grain cars, while other locations, specifically cover plate terminations, showed higher cyclic stress ranges. Therefore, cover plate terminations are critical areas for fatigue evaluation, particularly on longer bridge spans.

3.2.2. Results from Test of DPG Bridge

Measurements were taken in revenue service and data were collected for loaded coal trains, as well as for other loaded unit trains (grain cars, tank cars) [14]. A total of 10 strain gauges were installed on the girders to evaluate bending stresses: mid-span, 12.2 m (40 ft) from the end, and three cover plate cutoffs (see Figure 4 for more details). In Figure 4, the locations of cover plate terminations are shown for the south girder (G2) and the north girder (G1). Note that the location of cover plate terminations and the overall lengths of each of the two girders are slightly different. The girders are asymmetric because the bridge is located on a curve. Strains due to unit coal trains, unit grain trains, a unit tank train, and several mixed freight trains were recorded. One of the mixed freight trains contained a block of short (12.8-m (42-ft)) cement cars that was also used in the analysis [14].
Figure 20 compares the stress histories for a train with 13.7-m (45-ft) tank cars and a train with 16.2-m (53-ft) coal cars. As predicted by analysis, higher strain ranges were measured at cover plate terminations than at mid-span. The mid-span stress histories showed one large stress range due to a train and very small stress ranges due to individual railcars.
Figure 21 illustrates the typical peak stresses caused by unit trains of 12.8-m (42-ft) cement cars, 13.7-m (45-ft) tank cars, 16.2 m (53-ft) coal cars, and unit trains of grain cars on girders G2 and G1.
The mid-span location of the south girder experienced bending stresses 26% higher due to short railcars when compared to 16.2-m (53-ft) common length railcars. Stresses at 12.2 m (40 ft) from the end were also more than 10% higher due to shorter railcars. In addition, the 12.8-m (42-ft) and 13.7-m (45-ft) short railcars caused slightly higher stresses at the mid-span location than the 16.2-m (53-ft) coal cars, which were predicted by analytical calculations, as well as measurements on other long spans.
The test yielded similar results for the north girder. Compared to 16.2-m (53-ft) coal cars, the shorter railcars produced mid-span bending stresses 22% higher and stresses at 12.2 m (40 ft) from the end 10% higher. The maximum bending stresses at other locations along the span were less prominent.
Figure 22 compares stress ranges calculated from measured strains at various locations along the span for four types of railcars: 18.3-m (60-ft) grain cars, 16.2-m (53-ft) coal cars, 13.7-m (45-ft) tank cars, and unit trains of 12.8-m (42-ft) cement cars. The highest stress ranges were due to 16.2-m (53-ft) coal cars and 18.3-m (60-ft) grain cars. Based on the span length from center to center of bearings, the span to railcar length ratio was 2.13 for the coal cars and approximately 1.92 for the grain cars. The span to railcar length ratio for the tank cars was about 2.56 and 2.70 for the cement cars. The effect of span to railcar length ratio on service life was discussed in previous publications [19].
The span locations that experienced the highest stress ranges are at cover plate terminations, as was predicted analytically and shown on Figure 20. The stress range calculated from measured strains due to 16.2-m (53-ft) coal cars at cover plate 2 termination on girder G2 was about 7.9 MPa (1.15 ksi). This matches the analytical calculation of the stress range of 8.3 MPa (1.2 ksi) (red line, Figure 20). The stress range calculated from measured strains due to 16.2-m (53-ft) coal cars at mid-span of girder G2 was about 0.7 MPa (0.1 ksi). The analytical calculation showed a stress range of 0.5 MPa (0.07 ksi), which essentially matched the actual stress range calculated from measured strains. All of the stress ranges calculated from measured strains were well below the variable amplitude fatigue limit of 41 MPa (6 ksi). Therefore, fatigue was not a concern for any of the tested girders at measured locations due to the 16.2-m (53-ft) and the 12.8-m (42-ft) railcars.
The differences between girders G1 and G2 are related to the differences in geometry. The girders varied slightly in overall length and also had different lengths of cover plates.

4. Discussion

To validate the model, the stresses from the FEM were compared to the field data. Figure 23 and Figure 24 present comparisons between the measured data and the calculated stresses from the FEM model. In the field, the stresses on the east and west sides of the trusses were slightly different, whereas in the FEM model, both sides were the same, since the model was created to be symmetrical. For comparison, the average of east and west test results was used. Most of the model results were within 15% variation of the test results except for some diagonals.
For the 33.5-m (110-ft) truss, the model was conservative. It overestimated the stresses compared to the stresses obtained from actual strain measurements. The relative differences due to railcar length were predicted accurately. For the 61-m (200-ft) truss, the model was not conservative. The stresses obtained from measured strains were higher than those predicted by the model. In the calculations, the assumption was made that each of the C-shapes in built-up members of diagonals takes 50% of the load; however, it is possible that the axial force is not distributed equally between two parts of the members. The measurements were taken only from one side of the C-shapes, so this cannot be verified using the available data. It is recommended to investigate further this issue by measuring strains on the elements with two components and analyze the load distribution between them. In addition, the strains can be measured close to the connection to ensure the model was used properly with the free-end-rotation at the connections.

5. Conclusions

The analytical calculations indicated that the effect of short railcars was most prominent on the primary members such as end posts, diagonals, top and bottom chords in truss spans, and bending stresses in girder spans. The test data confirmed that short railcars produced higher stresses on longer bridge spans, as follows: The 12.8-m (42-ft) short railcars produced stresses 29 to 31% higher than 16.2-m (53-ft) common length railcars in top and bottom chords and produced stresses 20 to 21% higher on the end post and diagonal on the 61-m (200-ft) truss span.
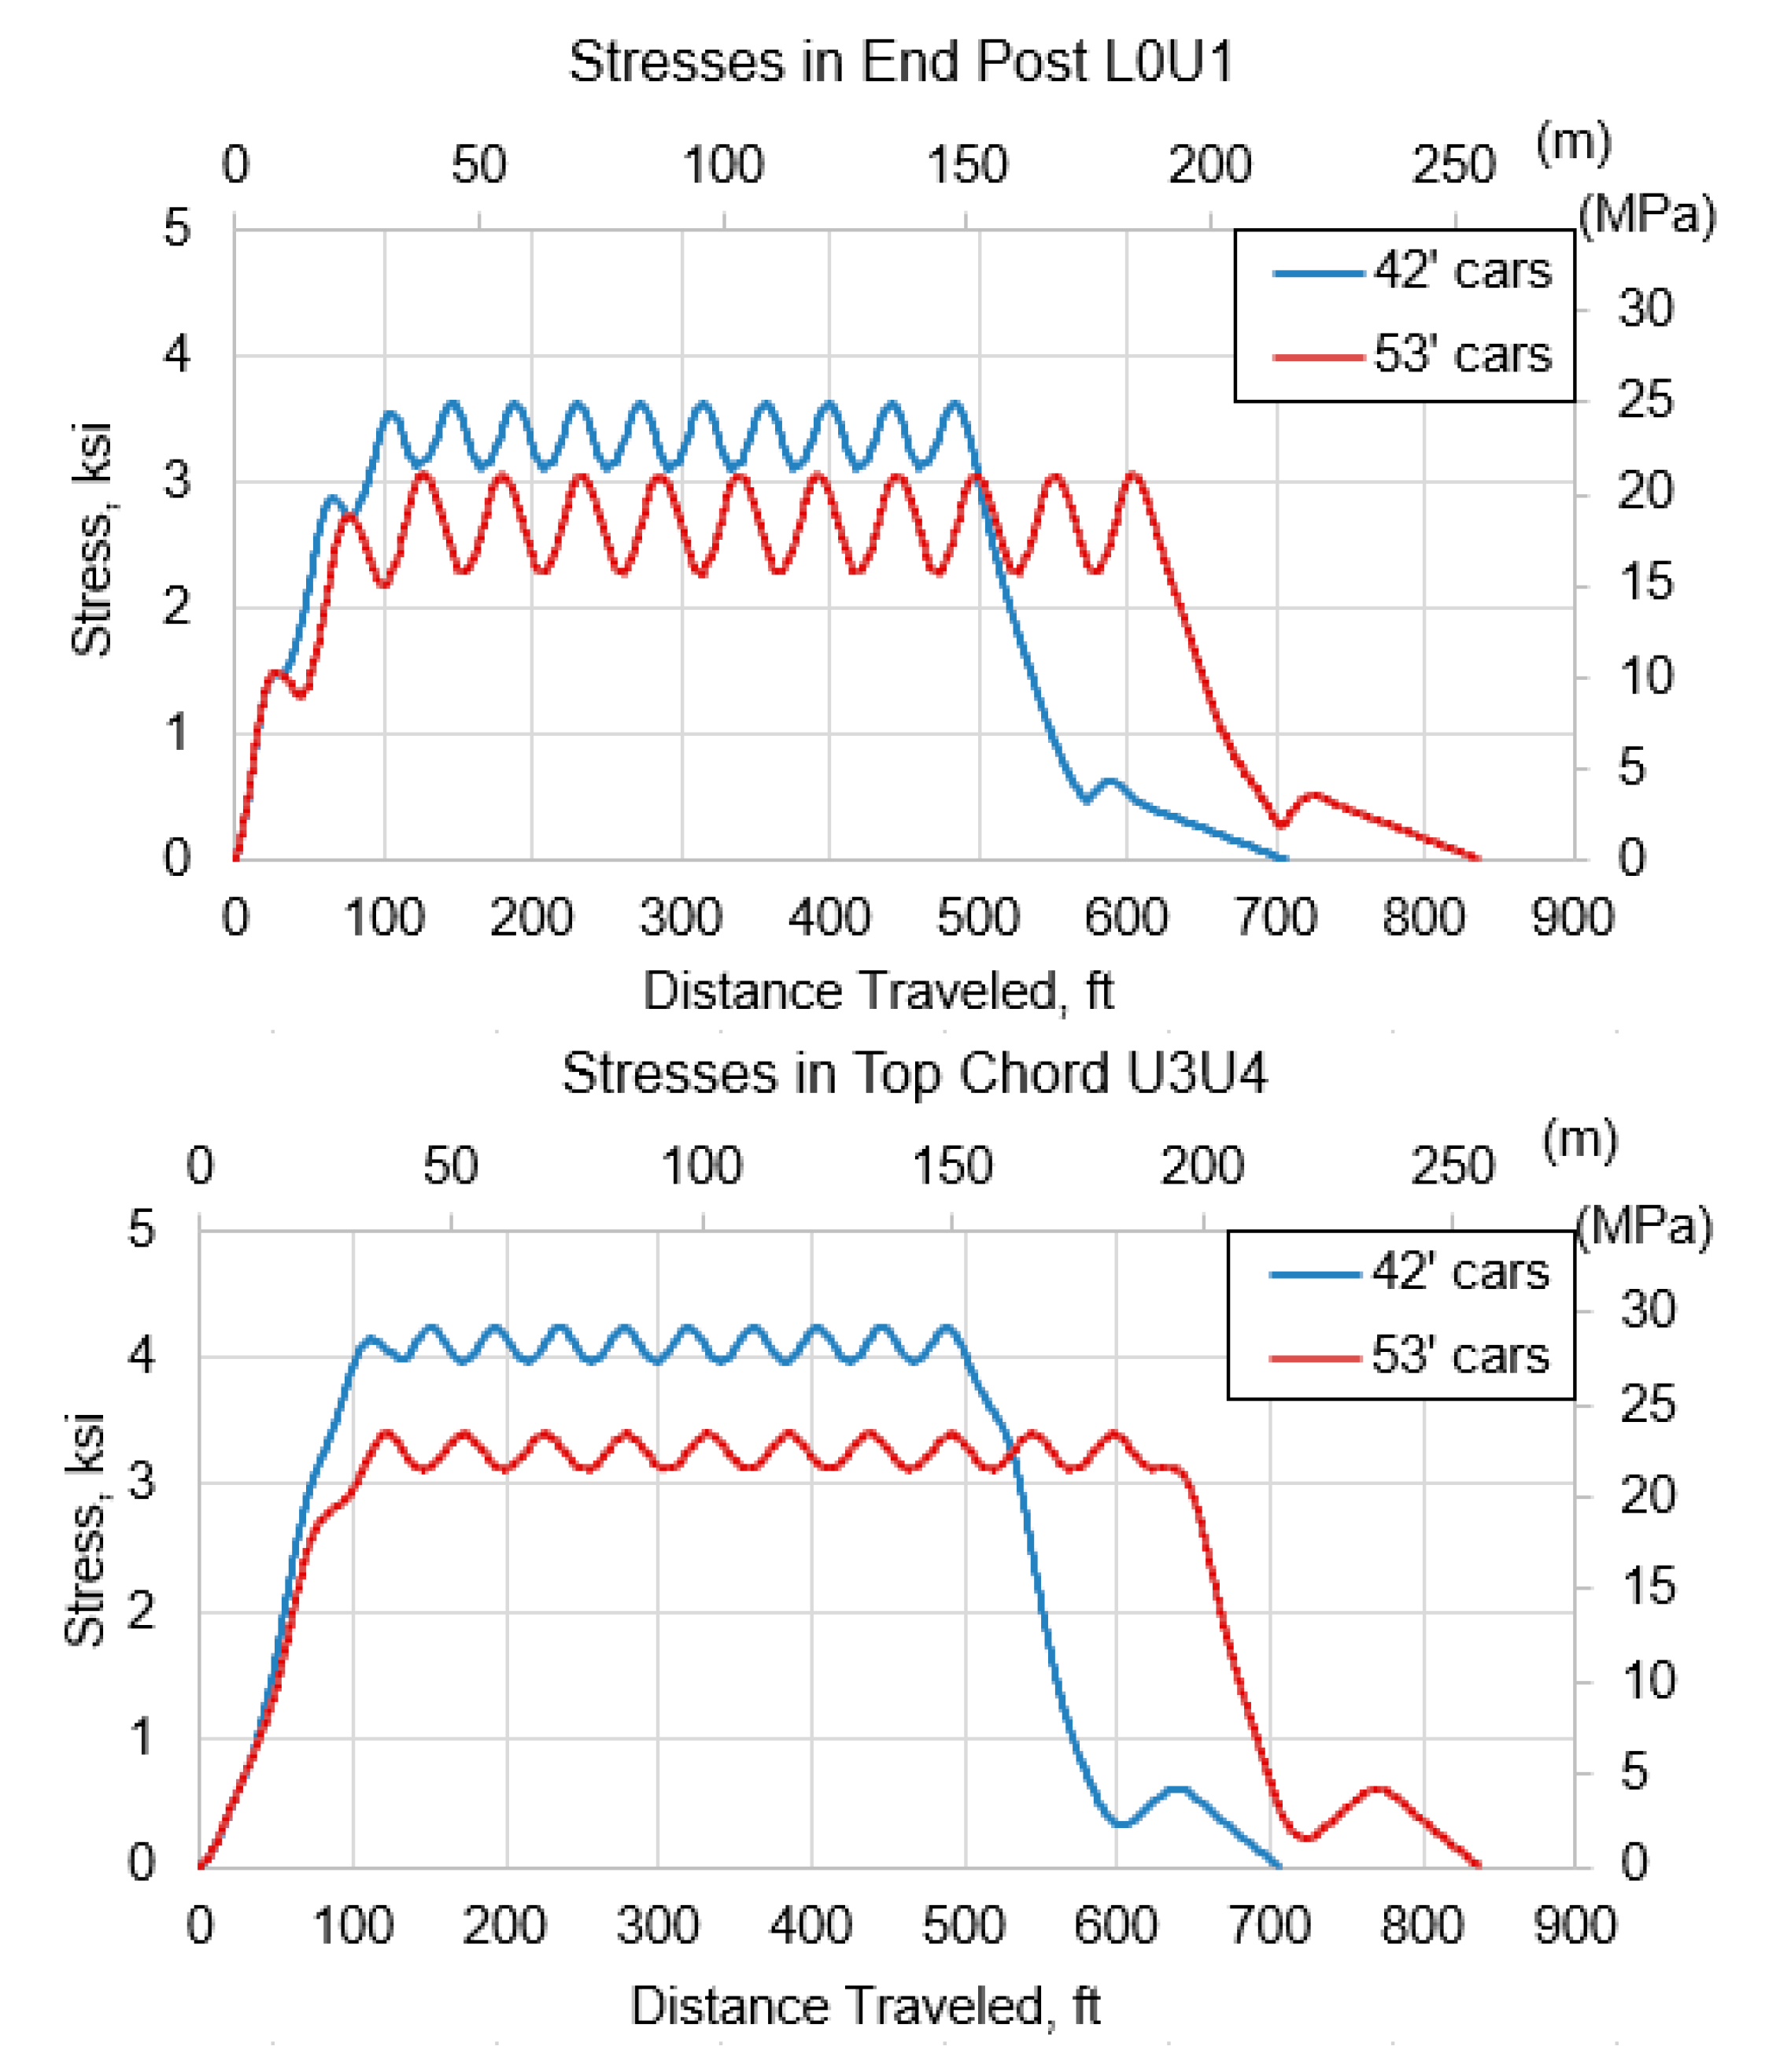
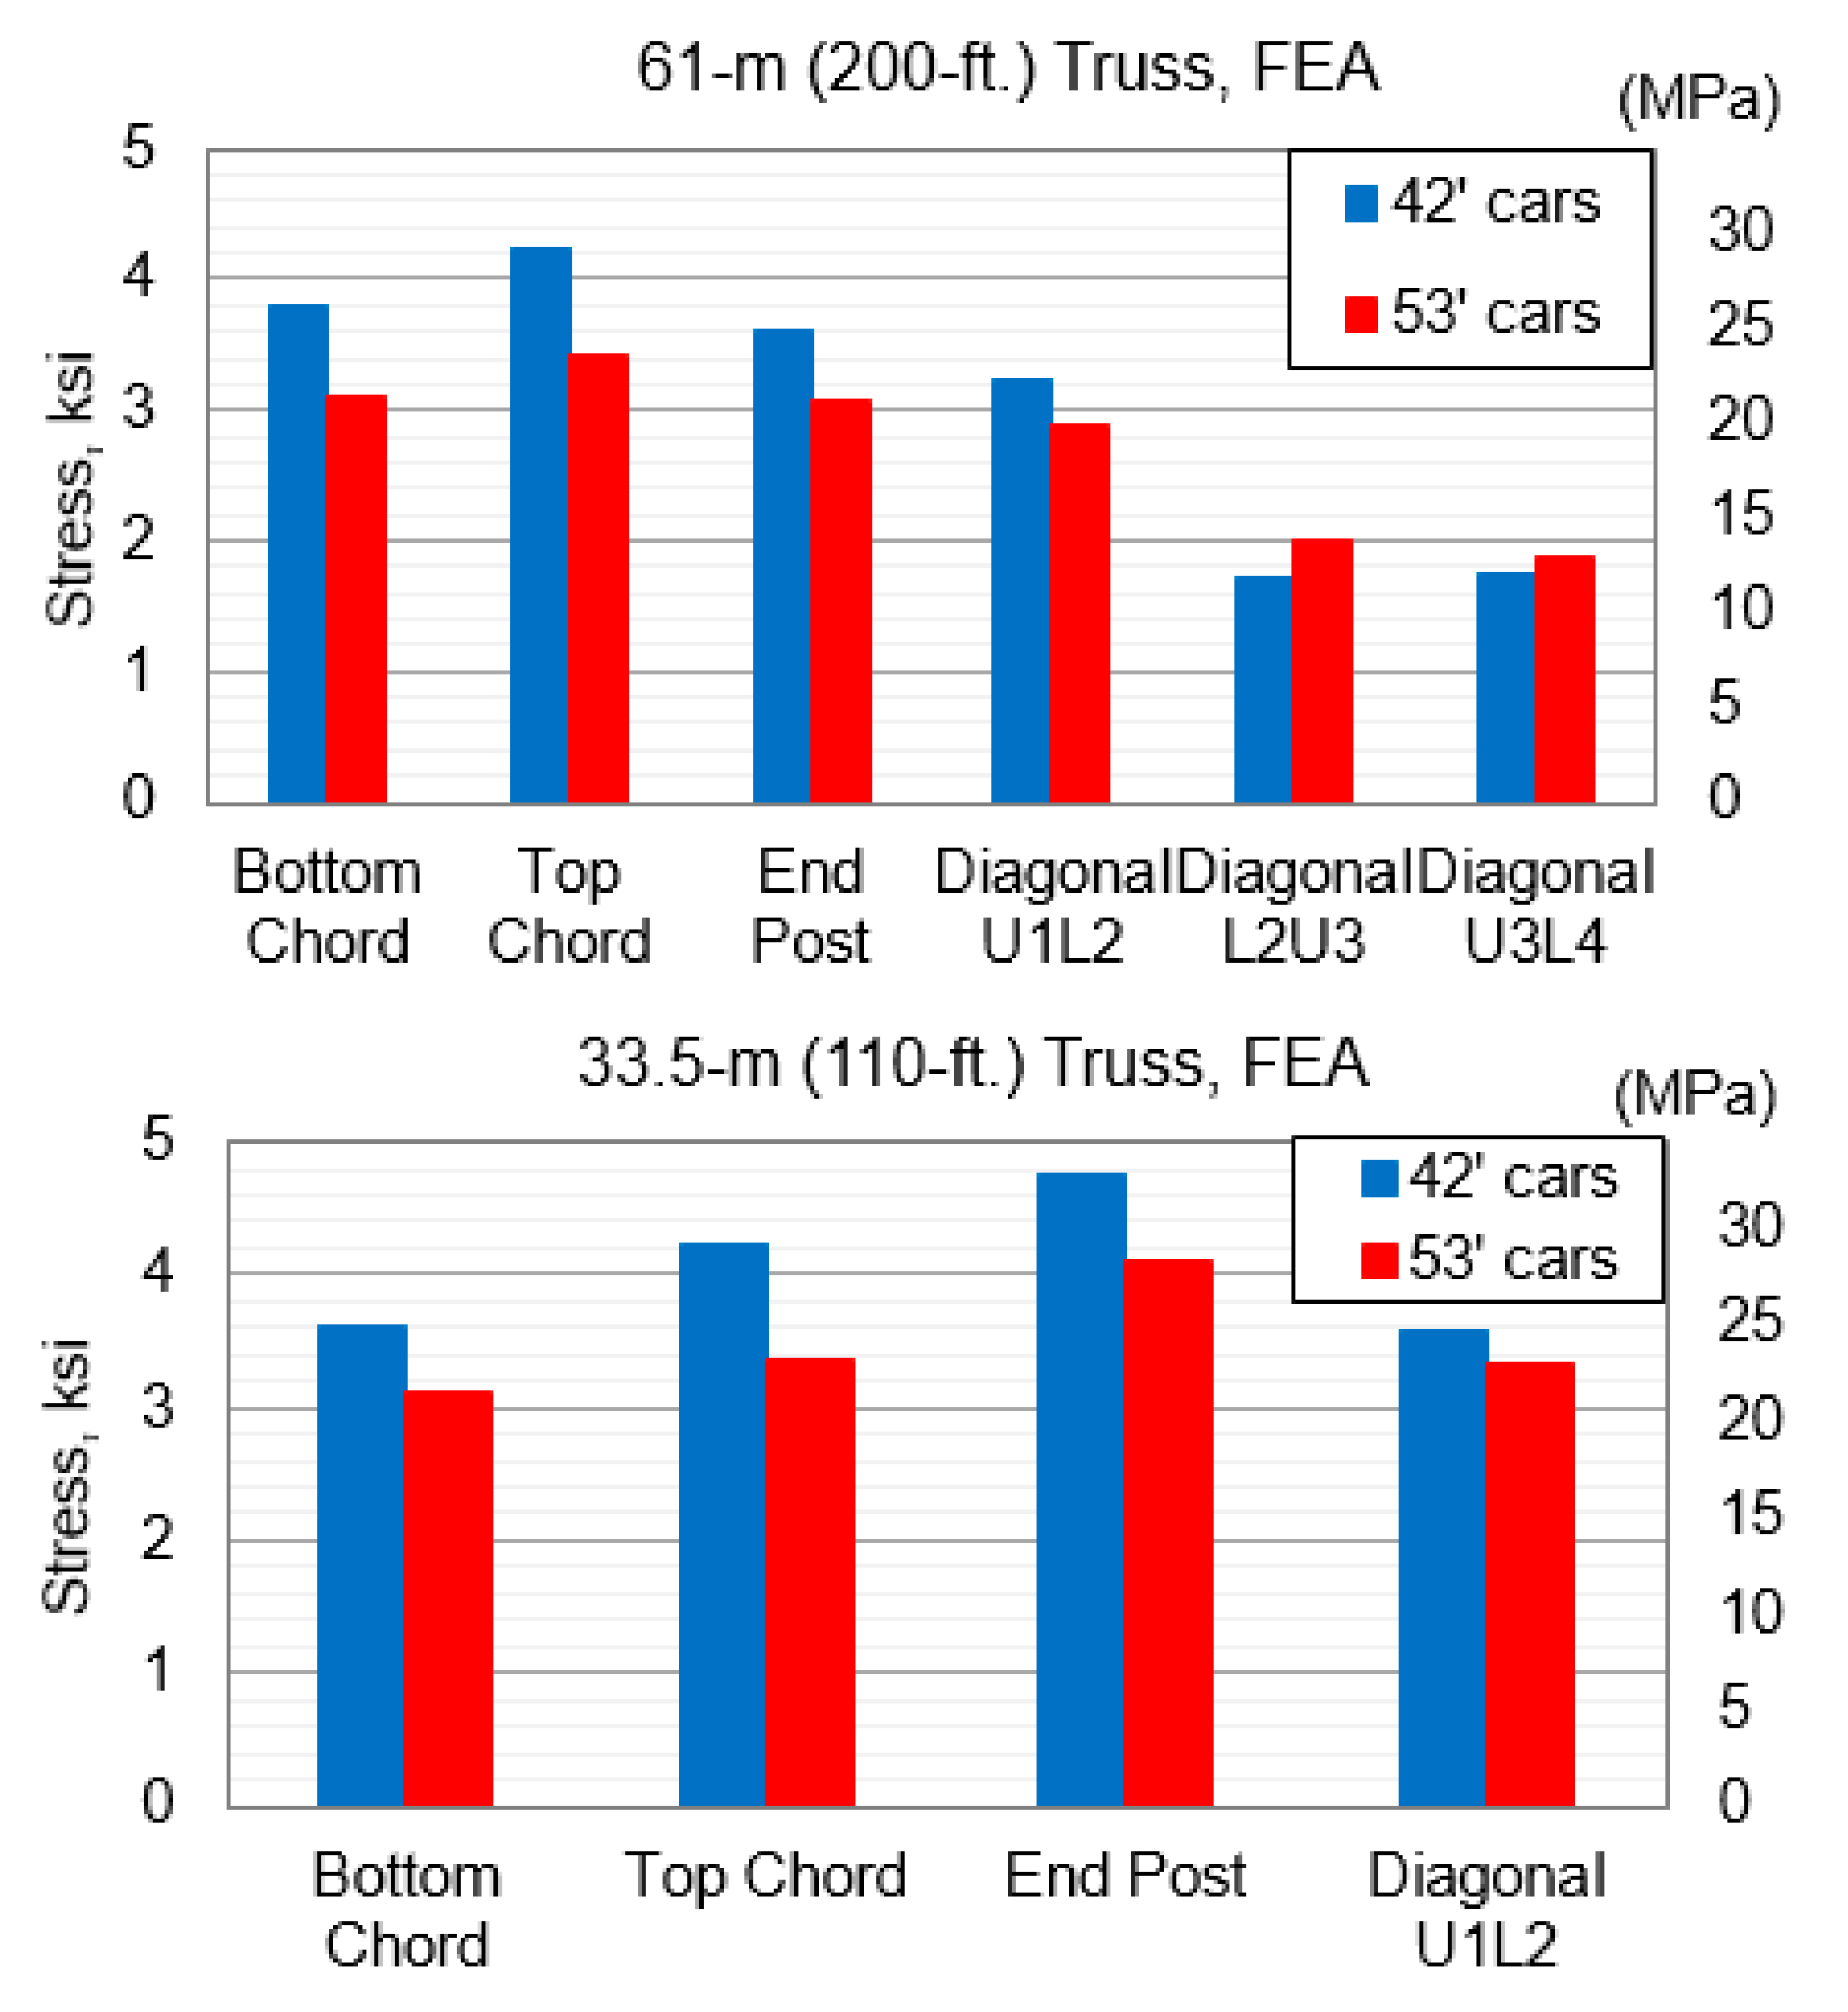
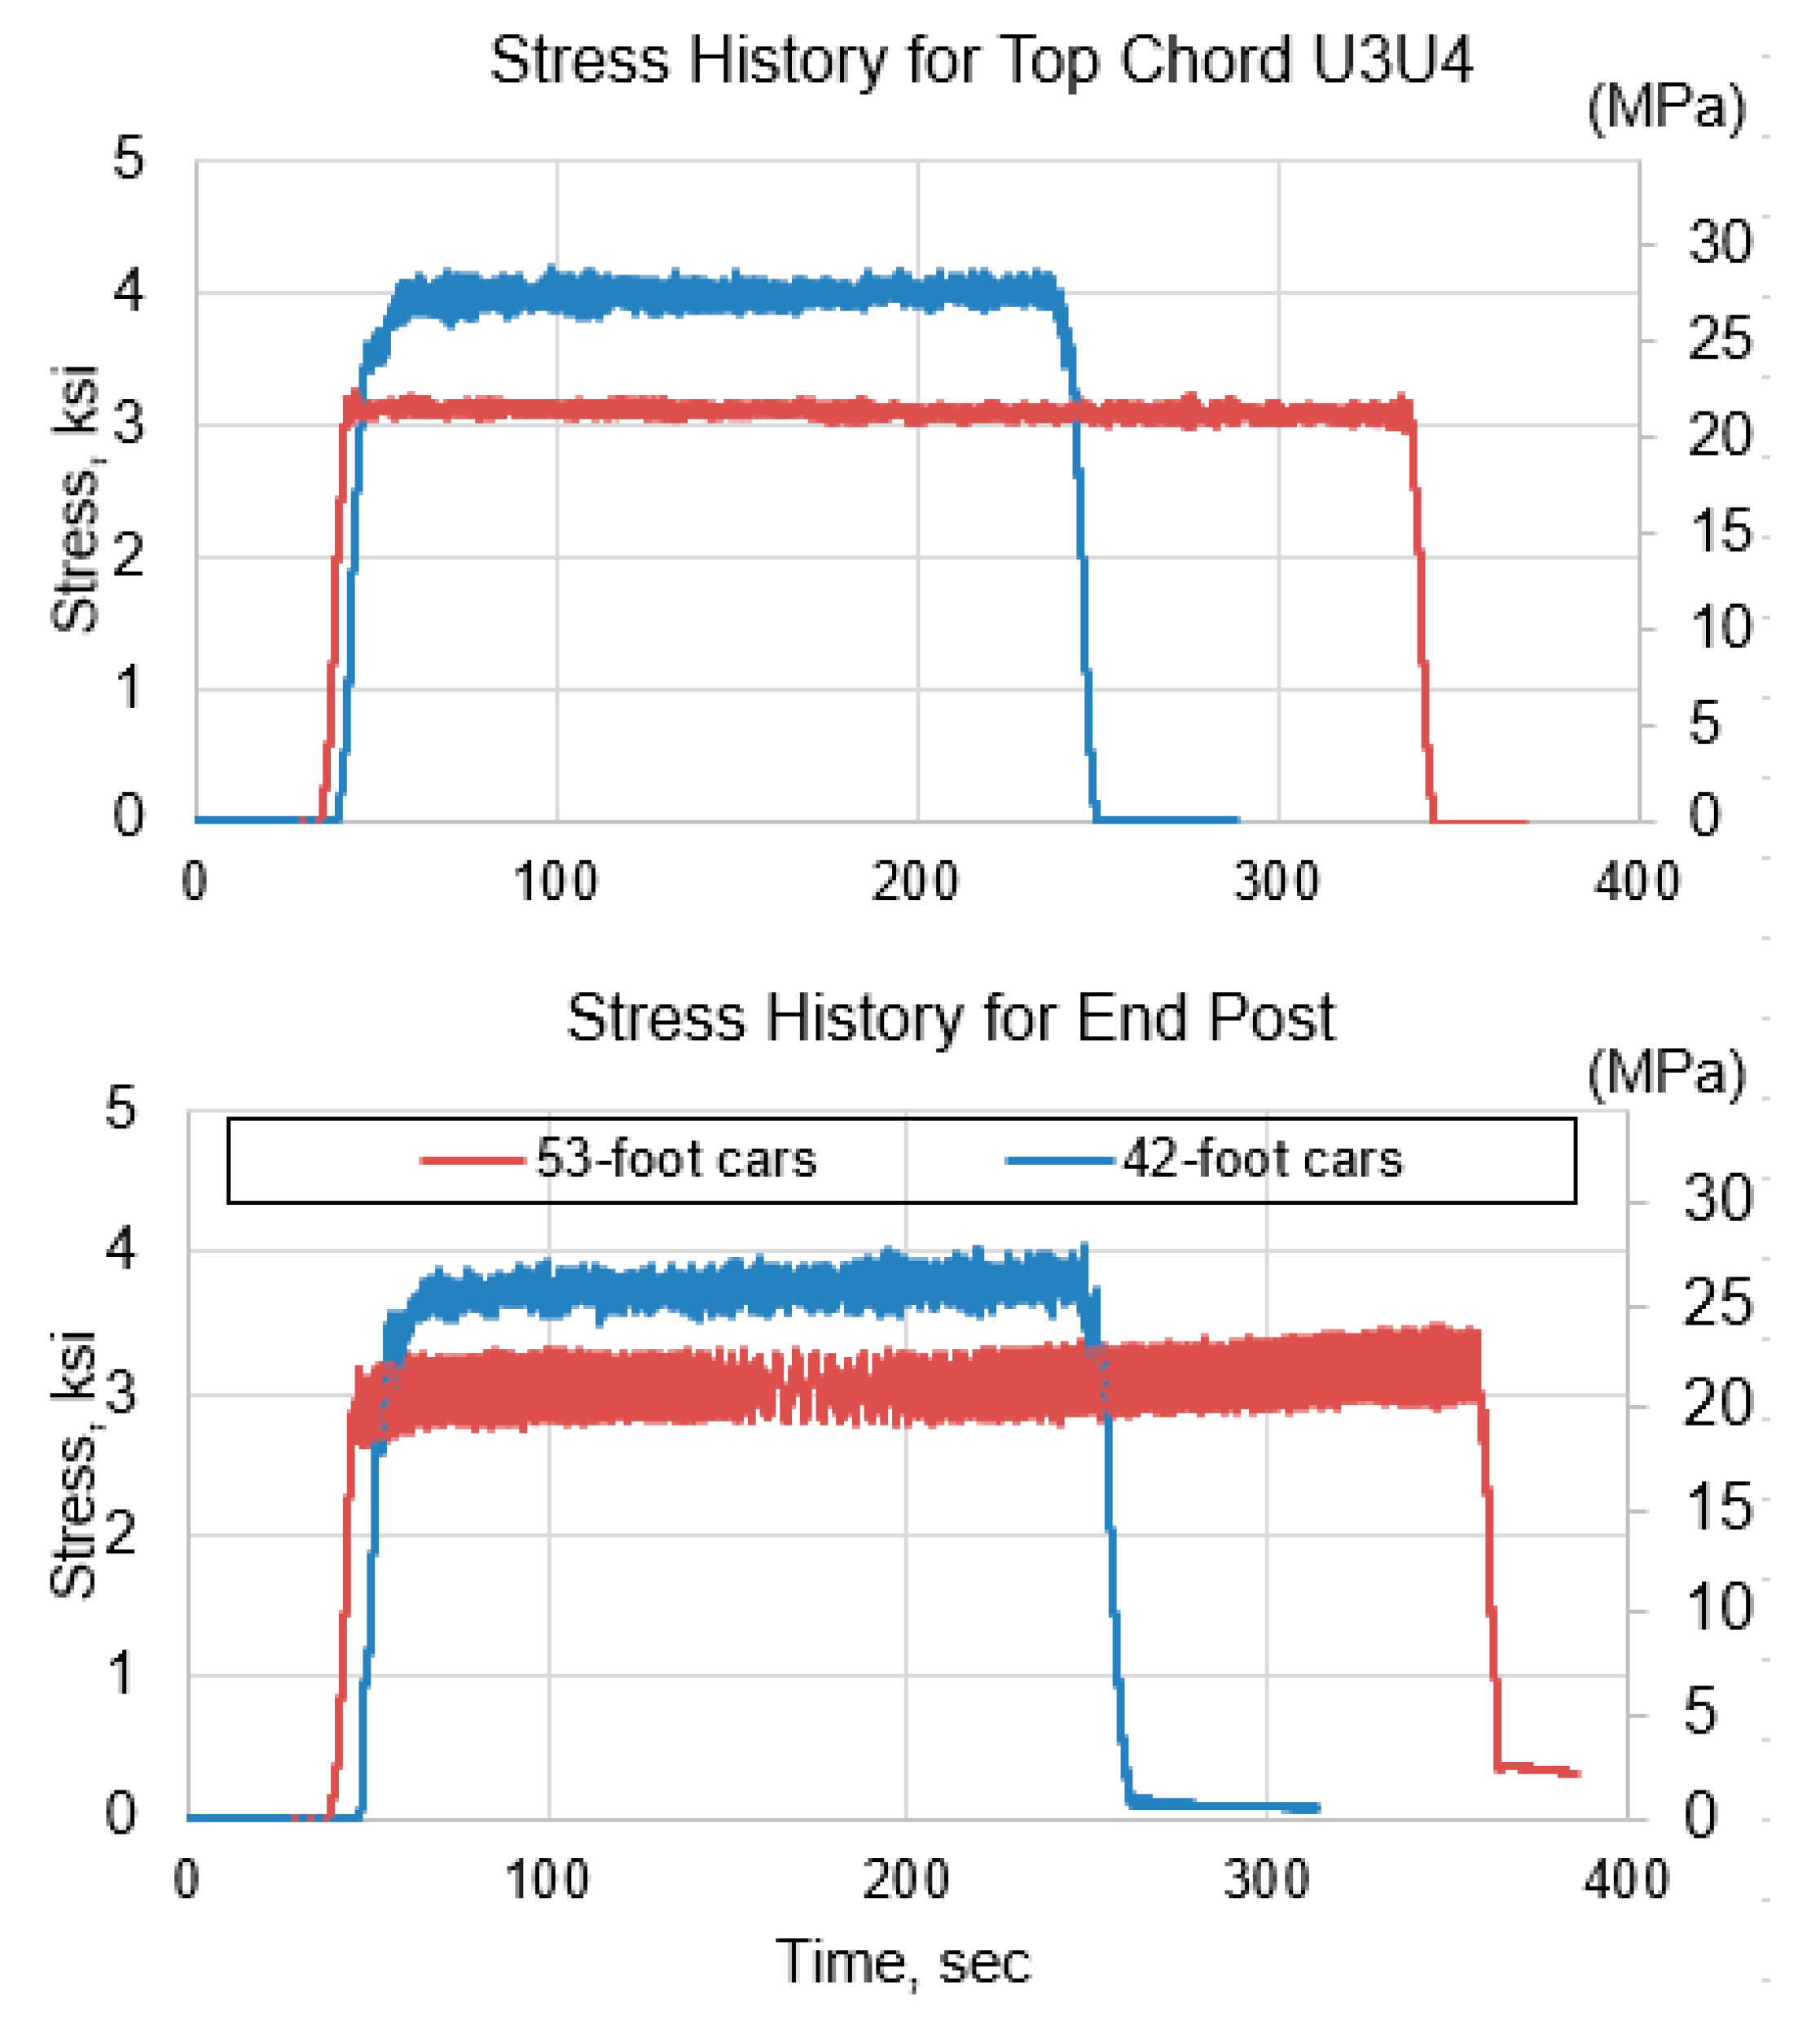
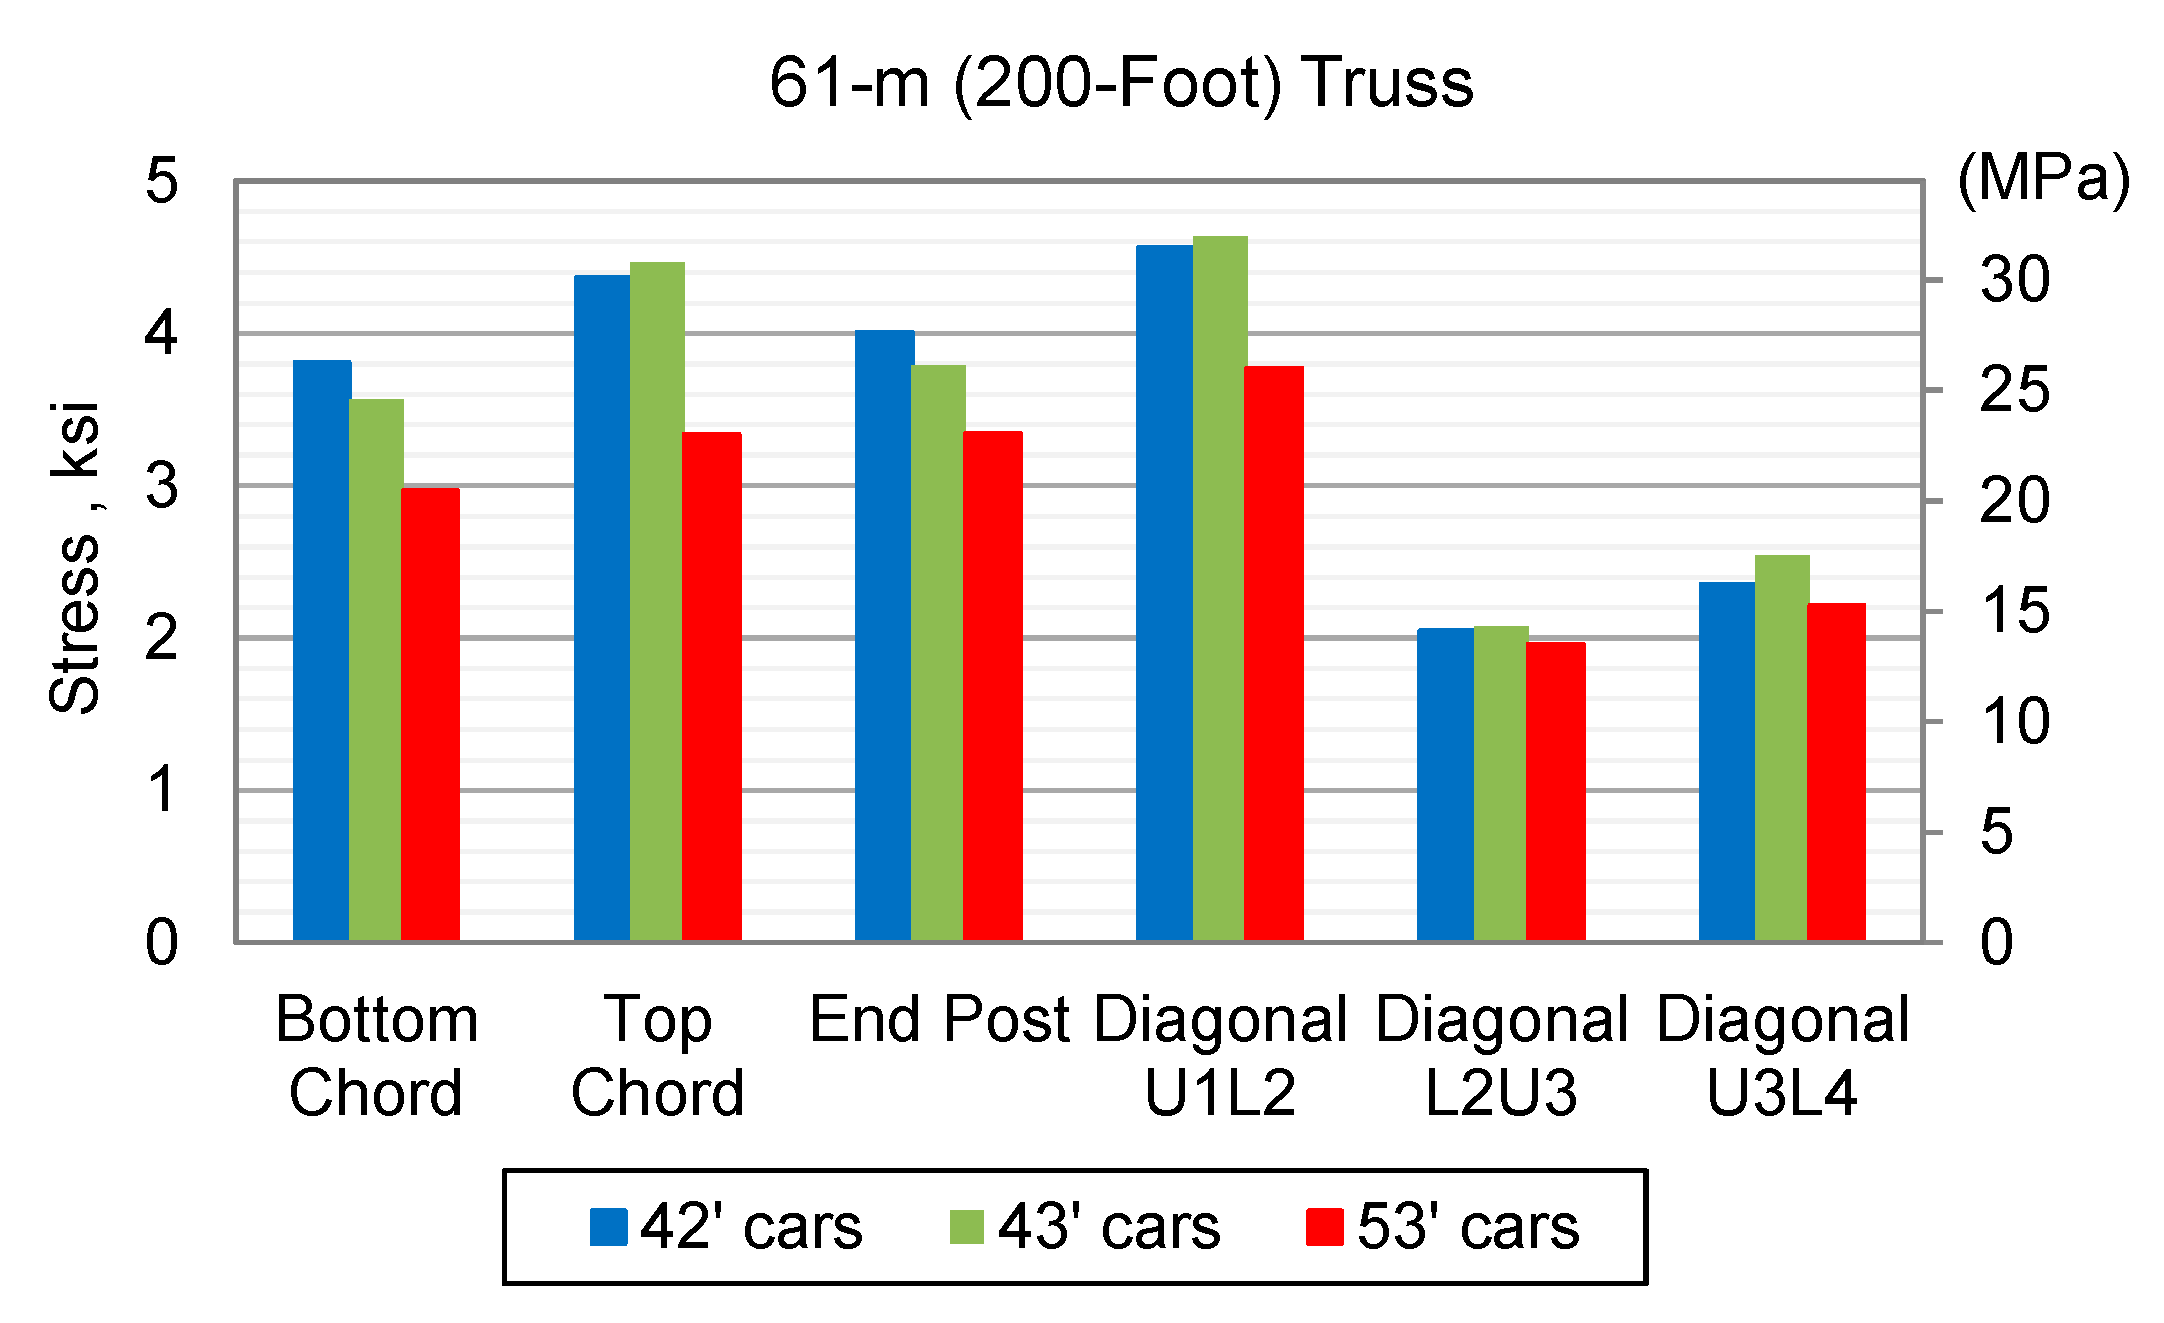
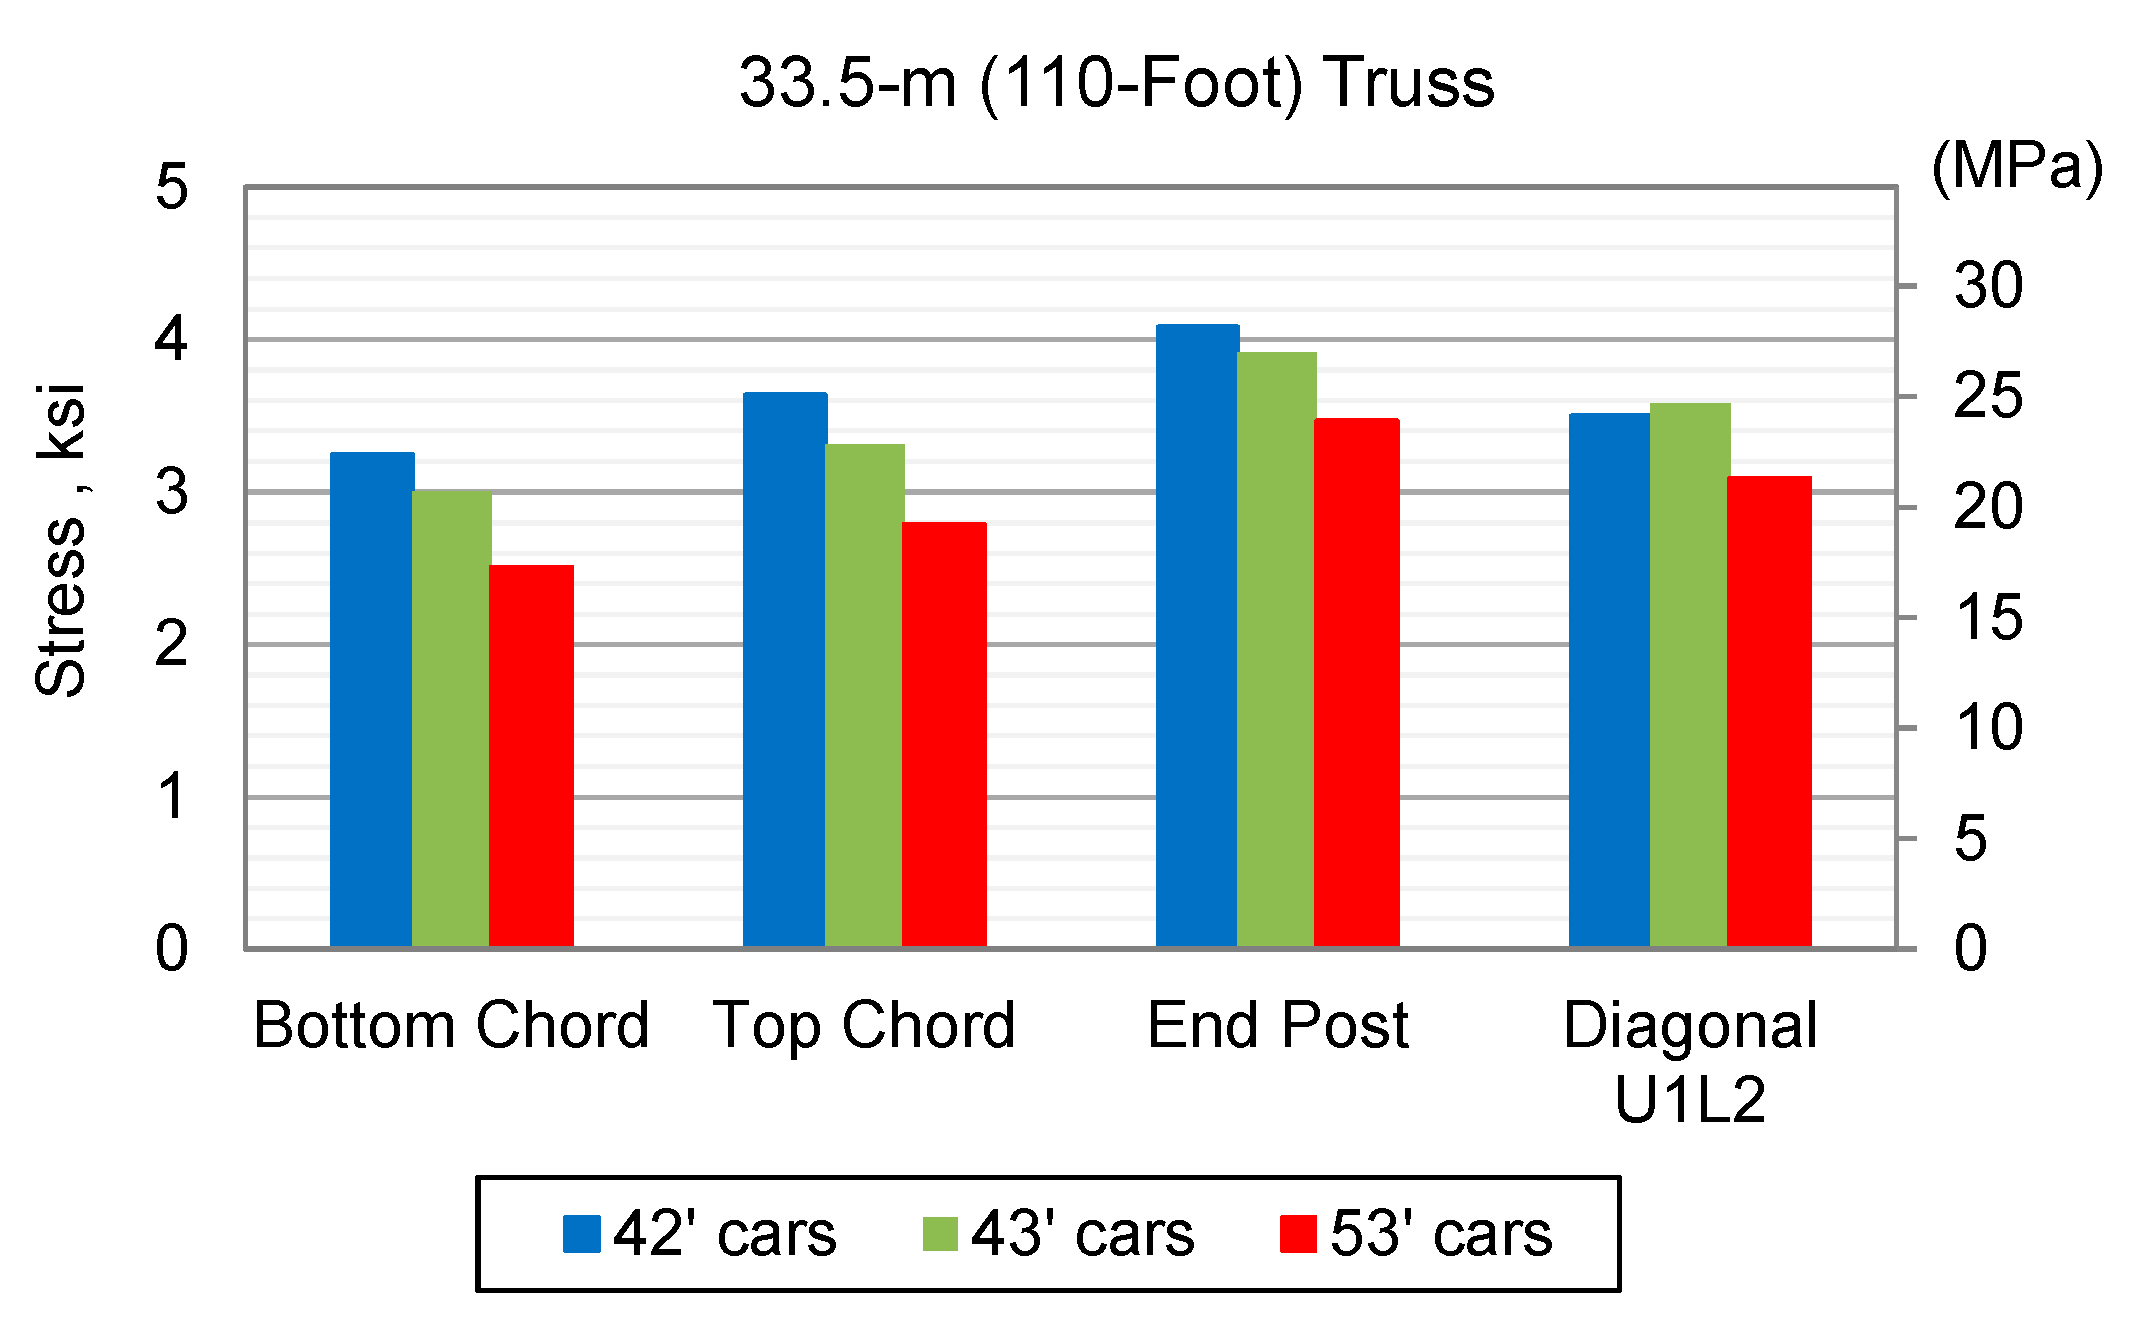
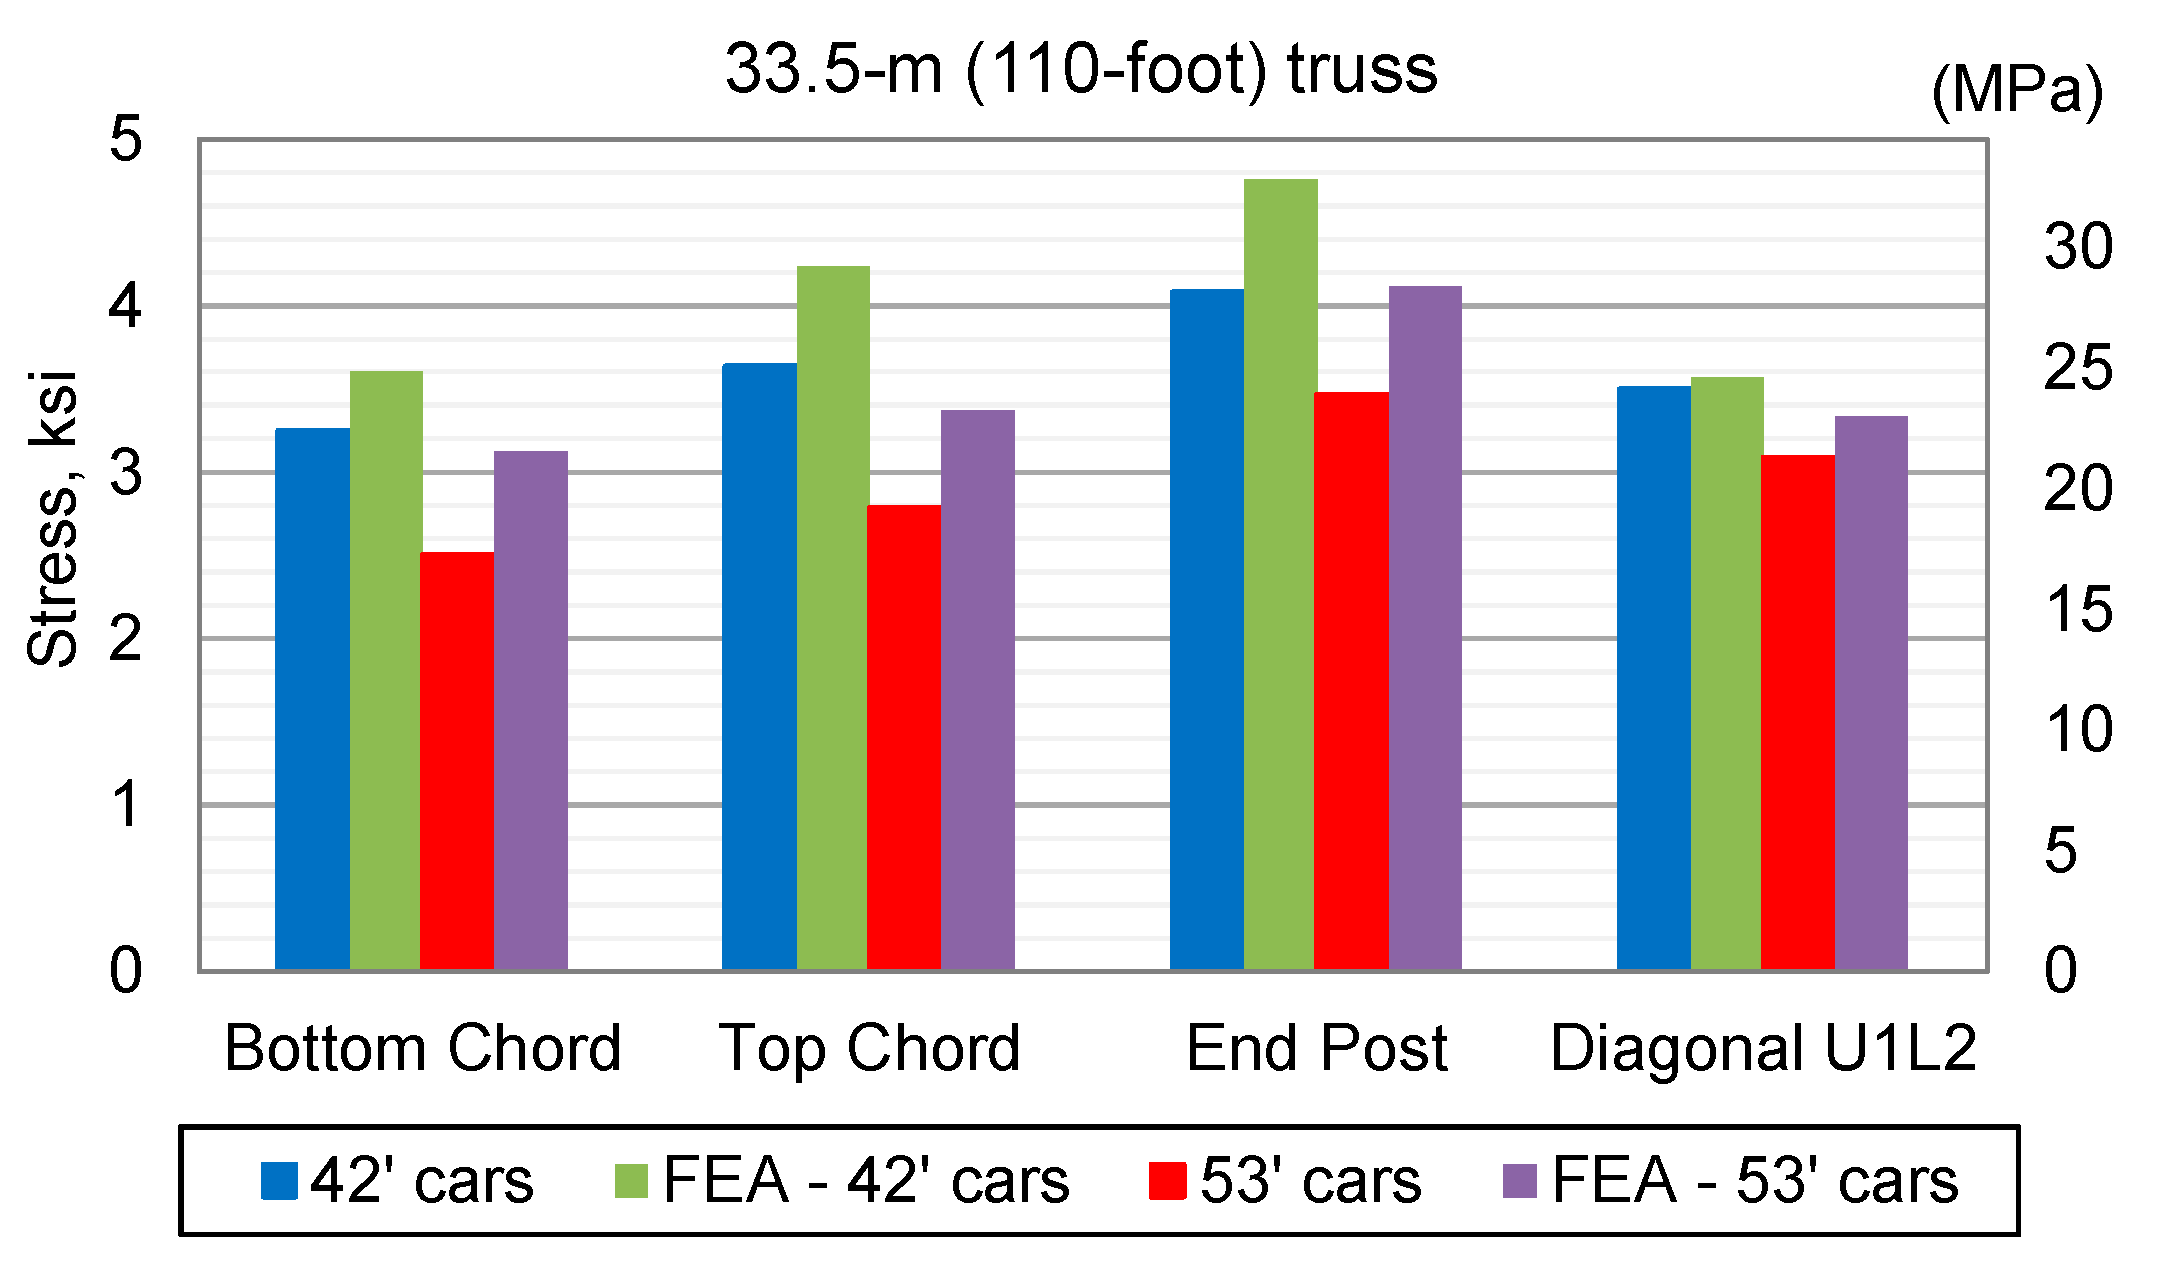
  • Short railcars caused a 30% increase in stress in both the top and bottom chords of the 33.5-m (110-ft) truss span. The end post experienced a 26% stress increase due to short railcars.
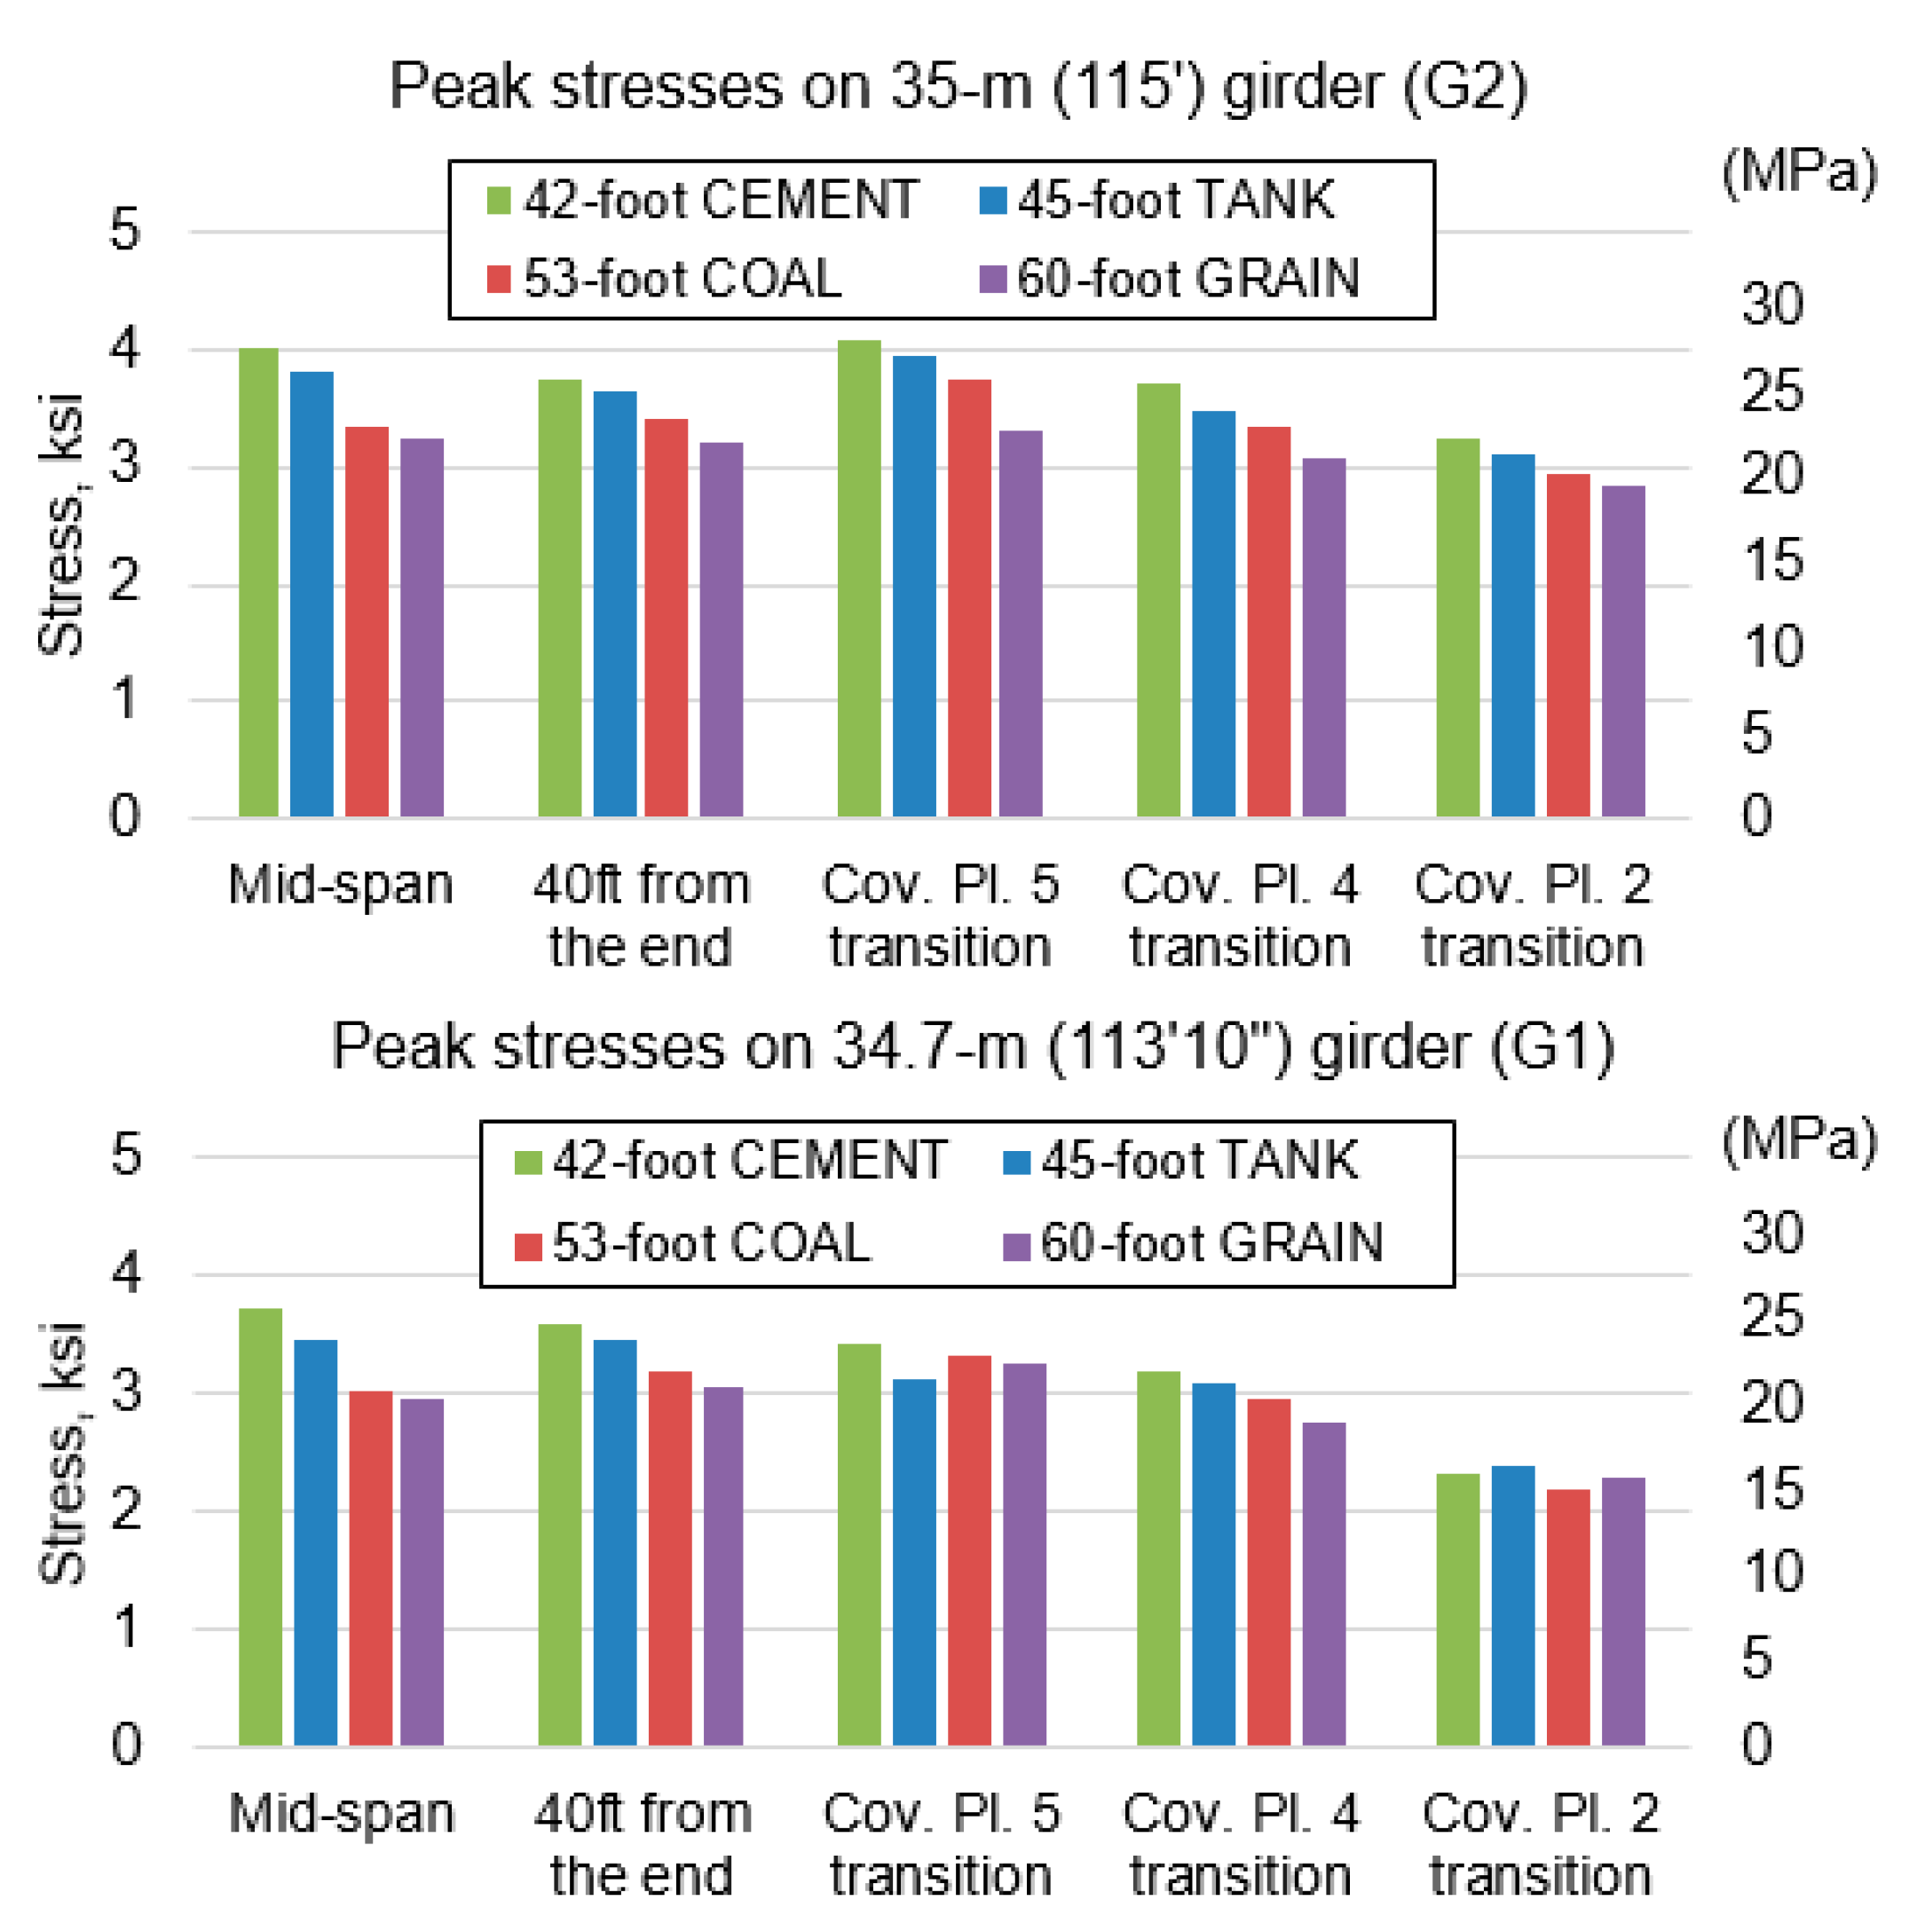
  • The 12.8-m (42-ft) short railcars produced maximum live load stresses of 22 and 26% higher than 16.2-m (53-ft) common length railcars at mid-span locations of the 34.7 m (113-ft, 10-in.) girder and 35-m (115-ft) girder, respectively.
  • The considered members in trusses and the location on the riveted steel DPG span govern the overall load capacity of the bridge, so shipments of multiple car blocks of short railcars should be carefully planned.
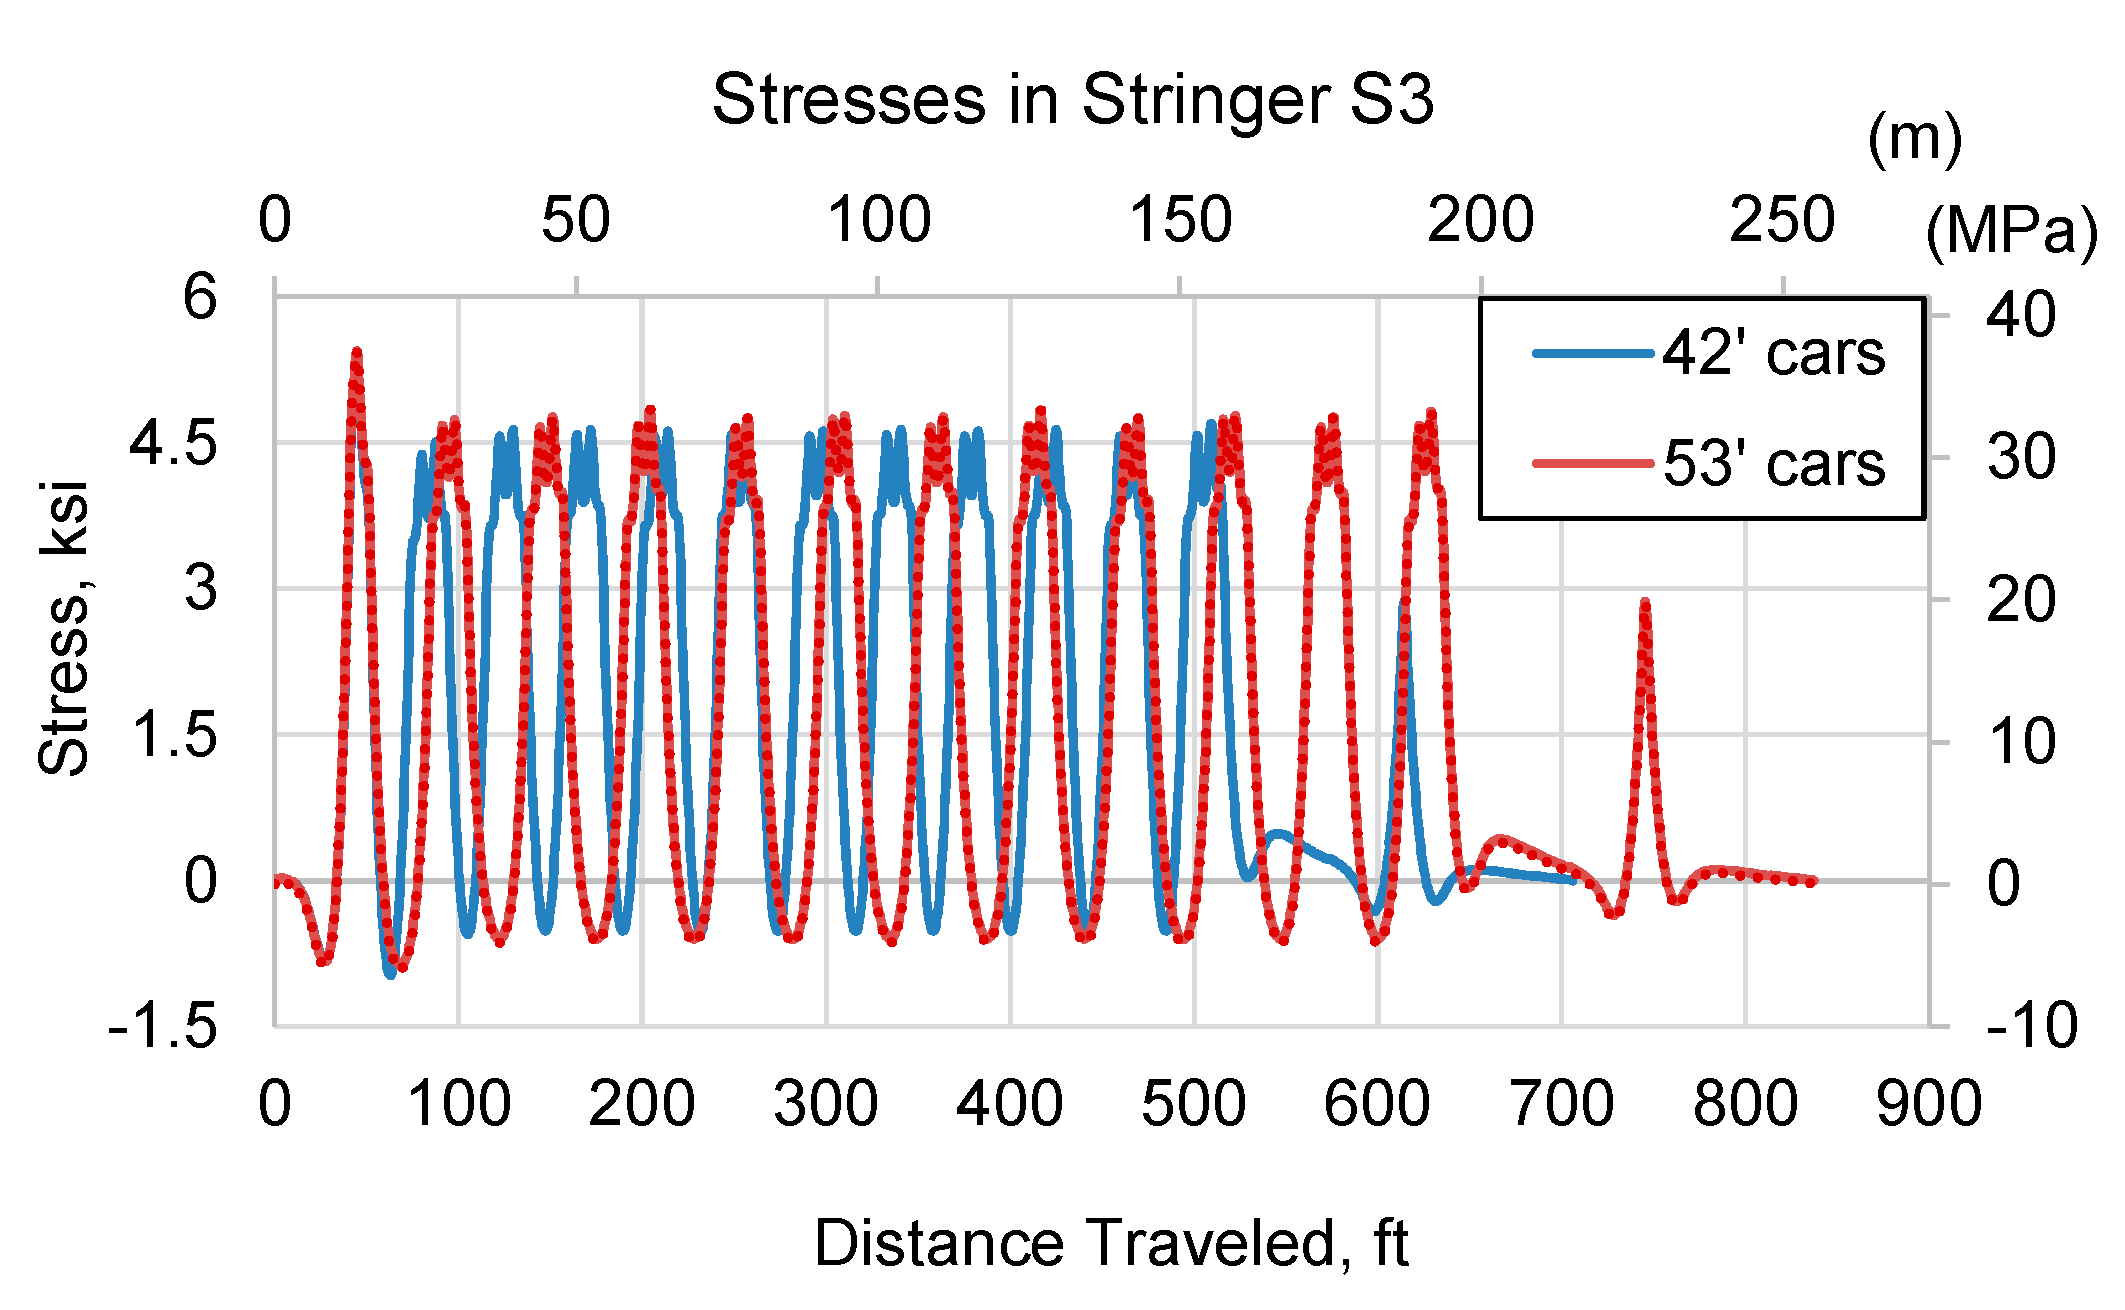
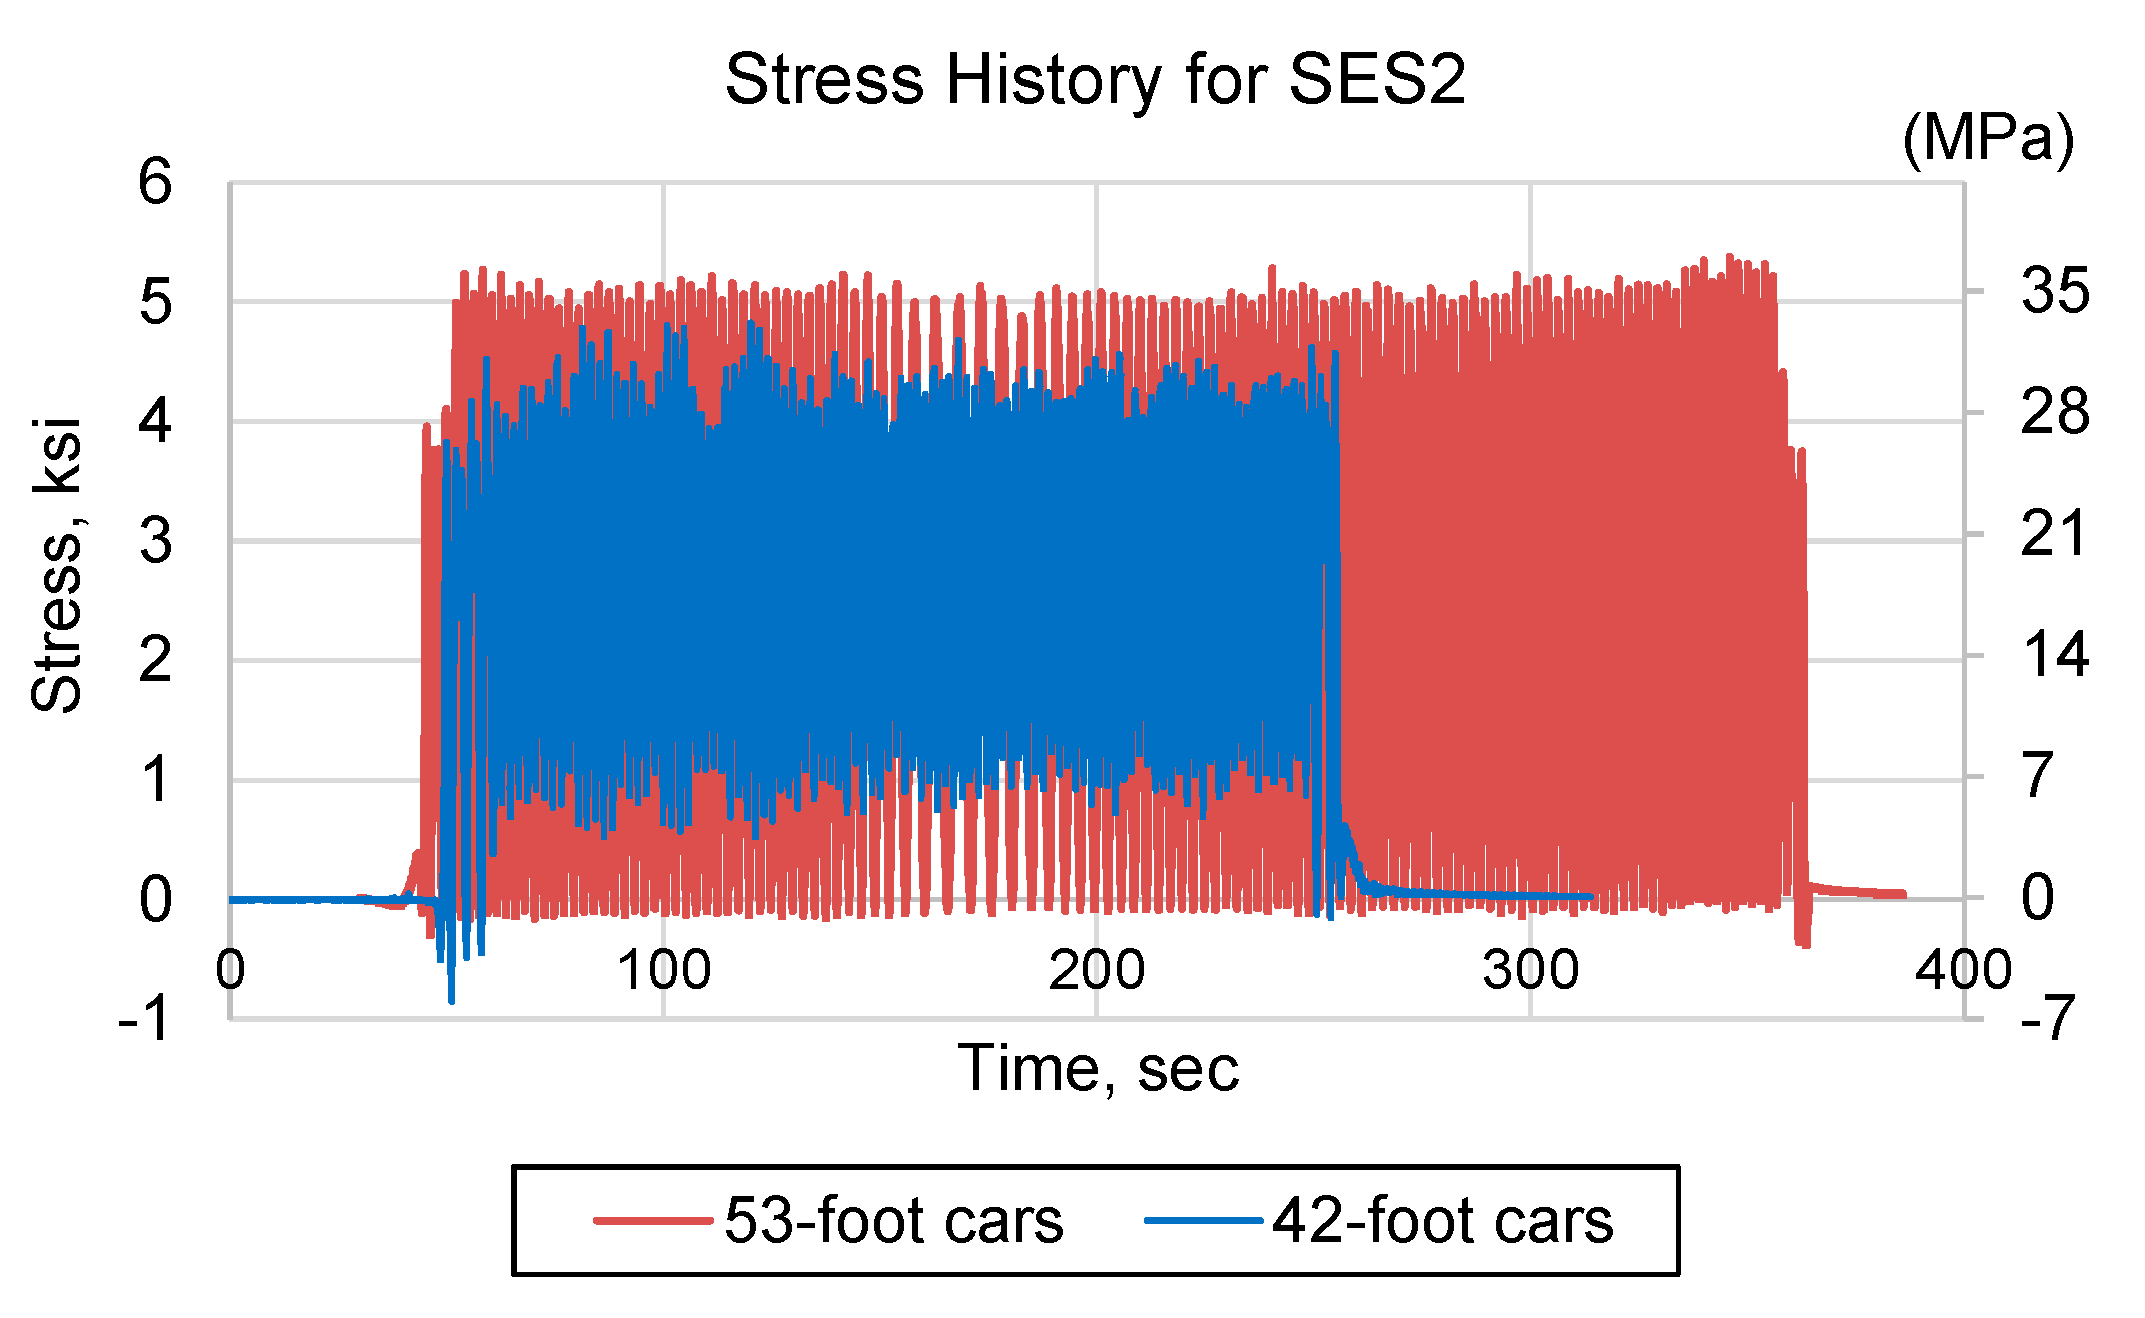
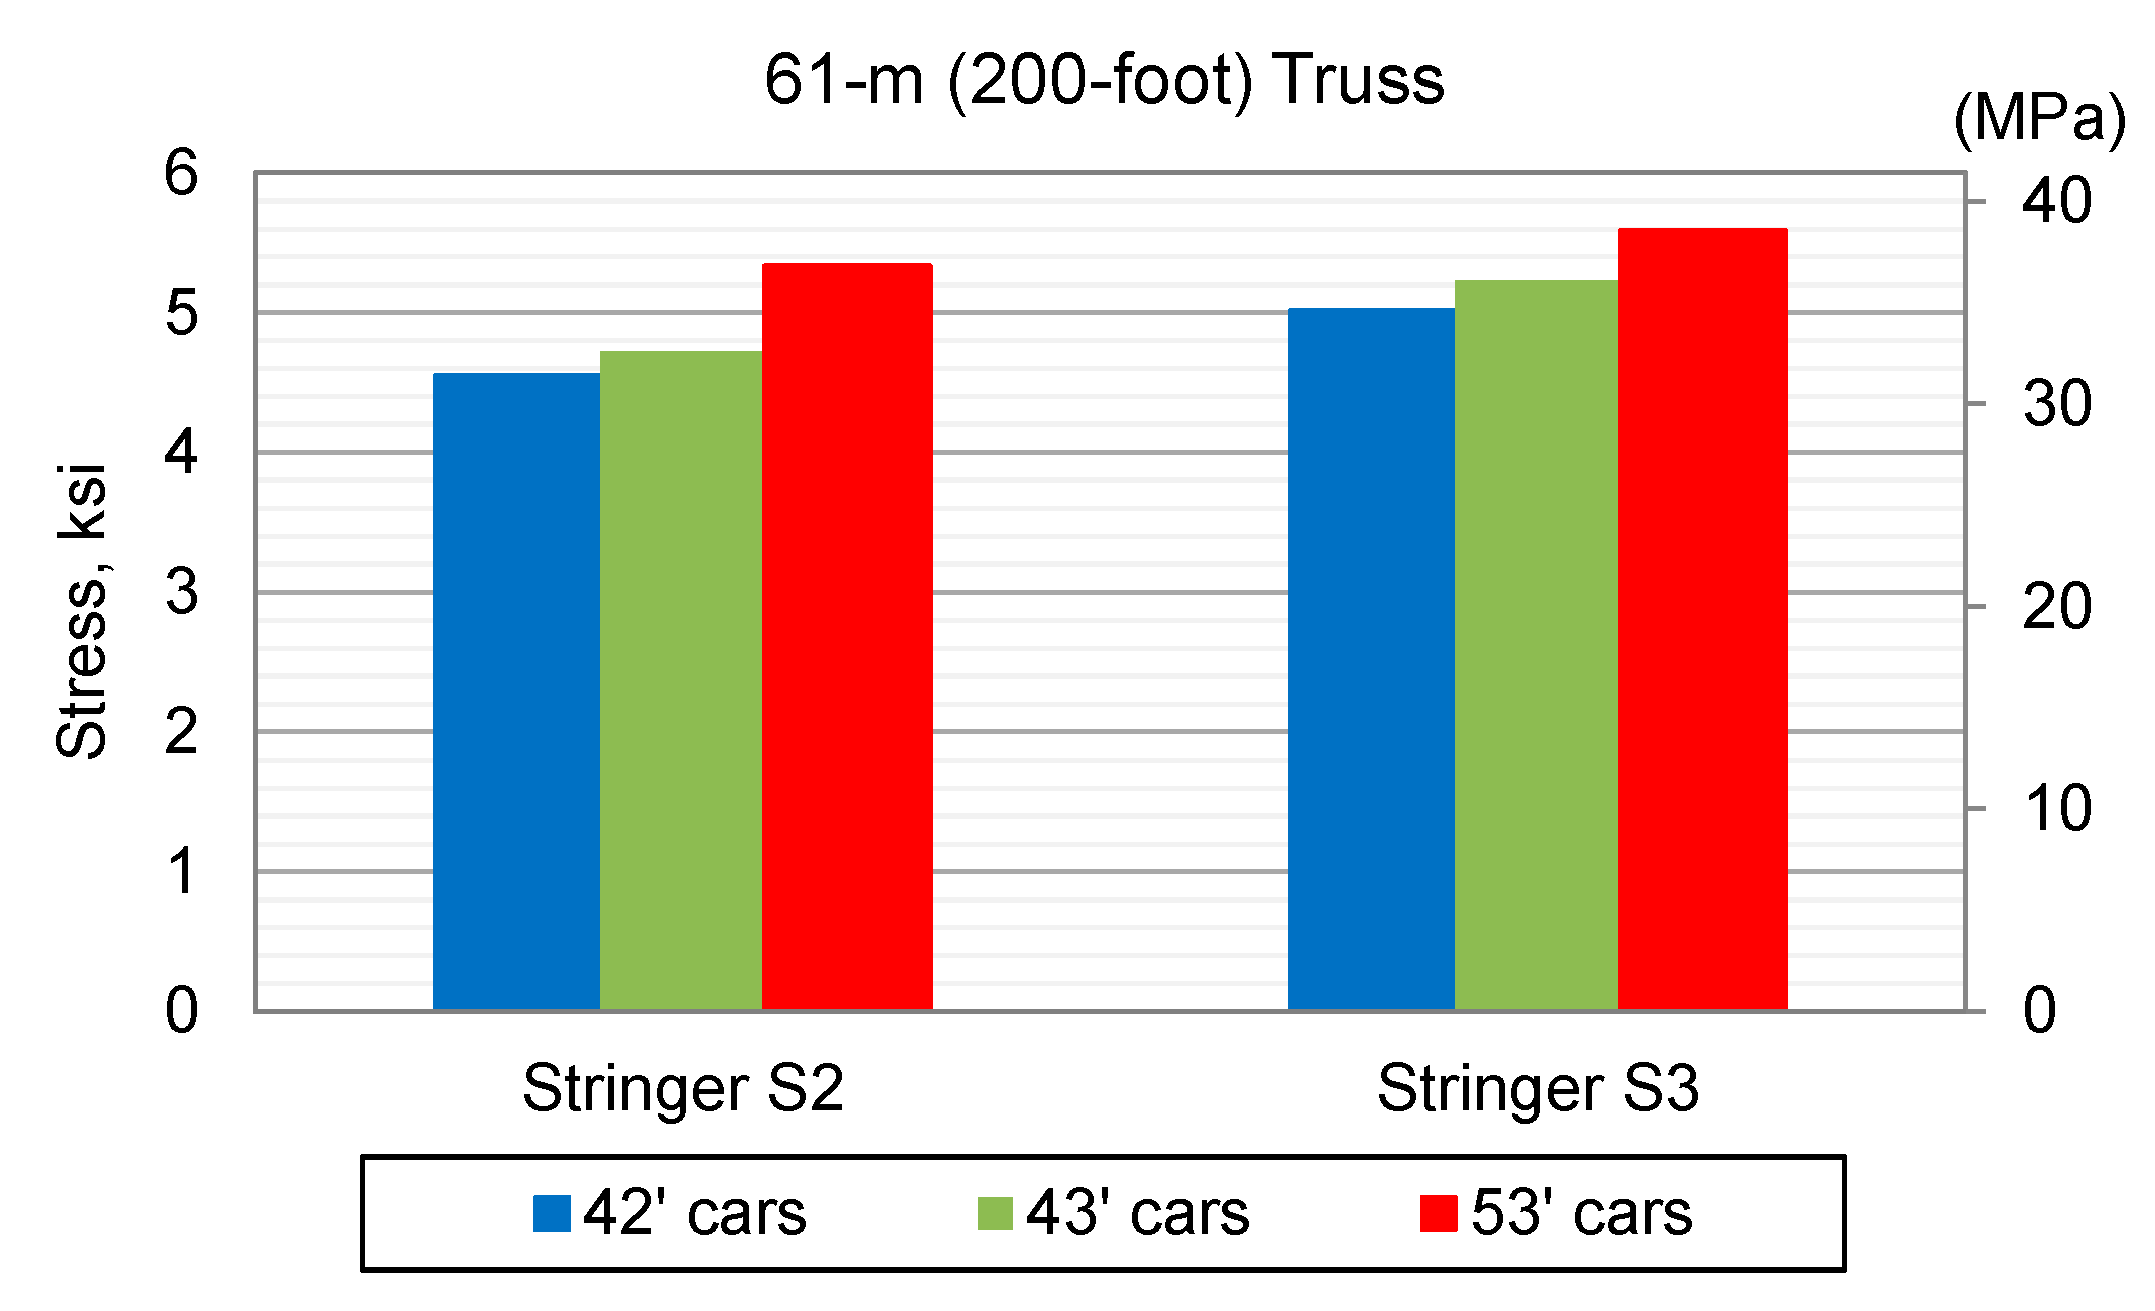
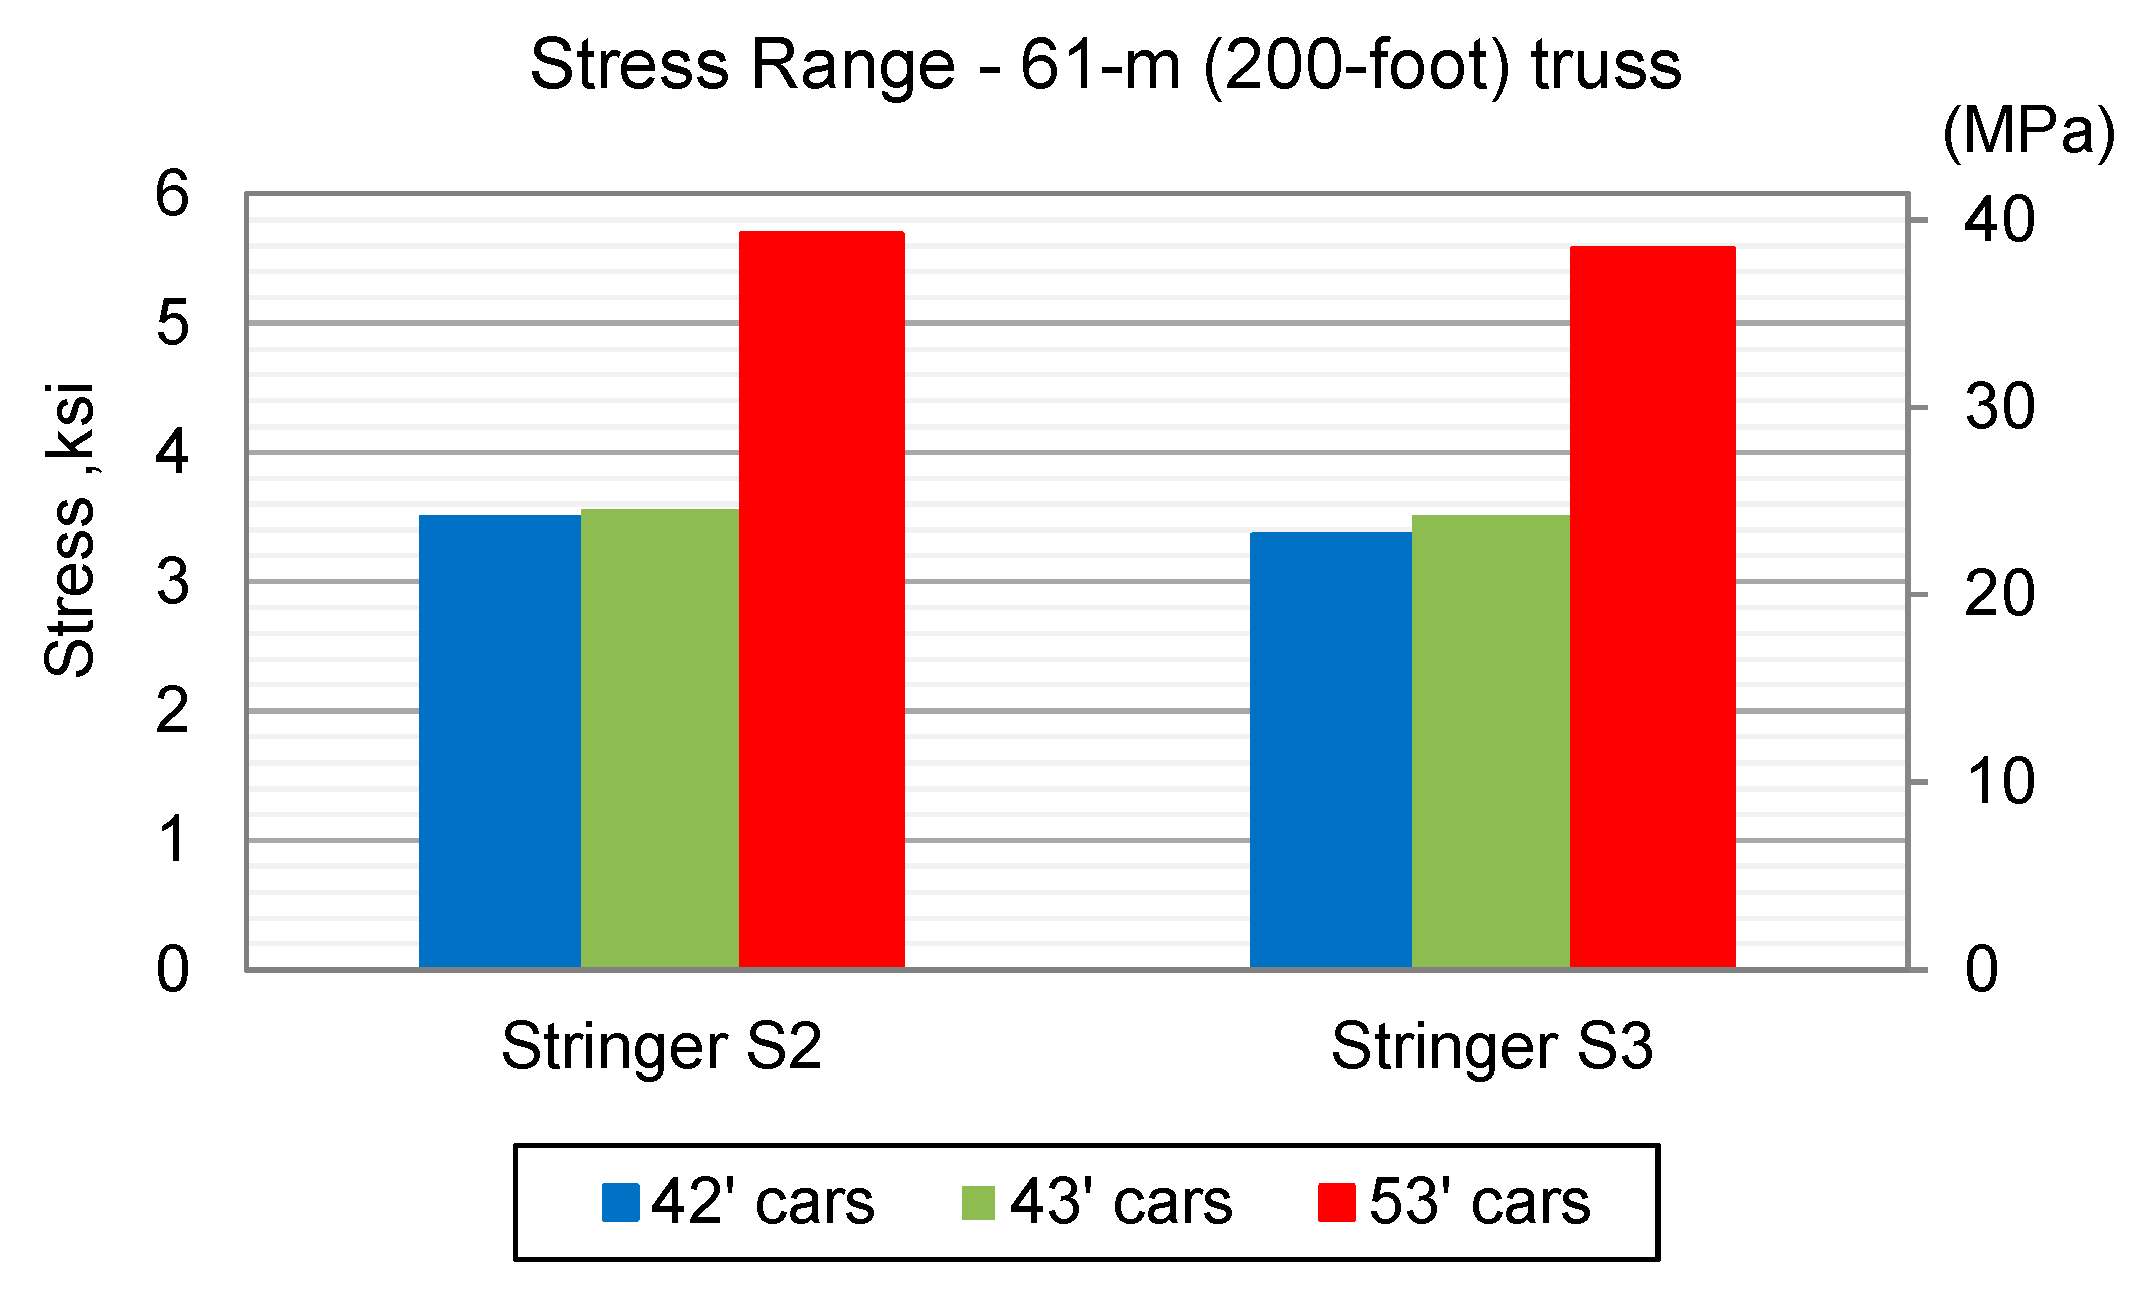
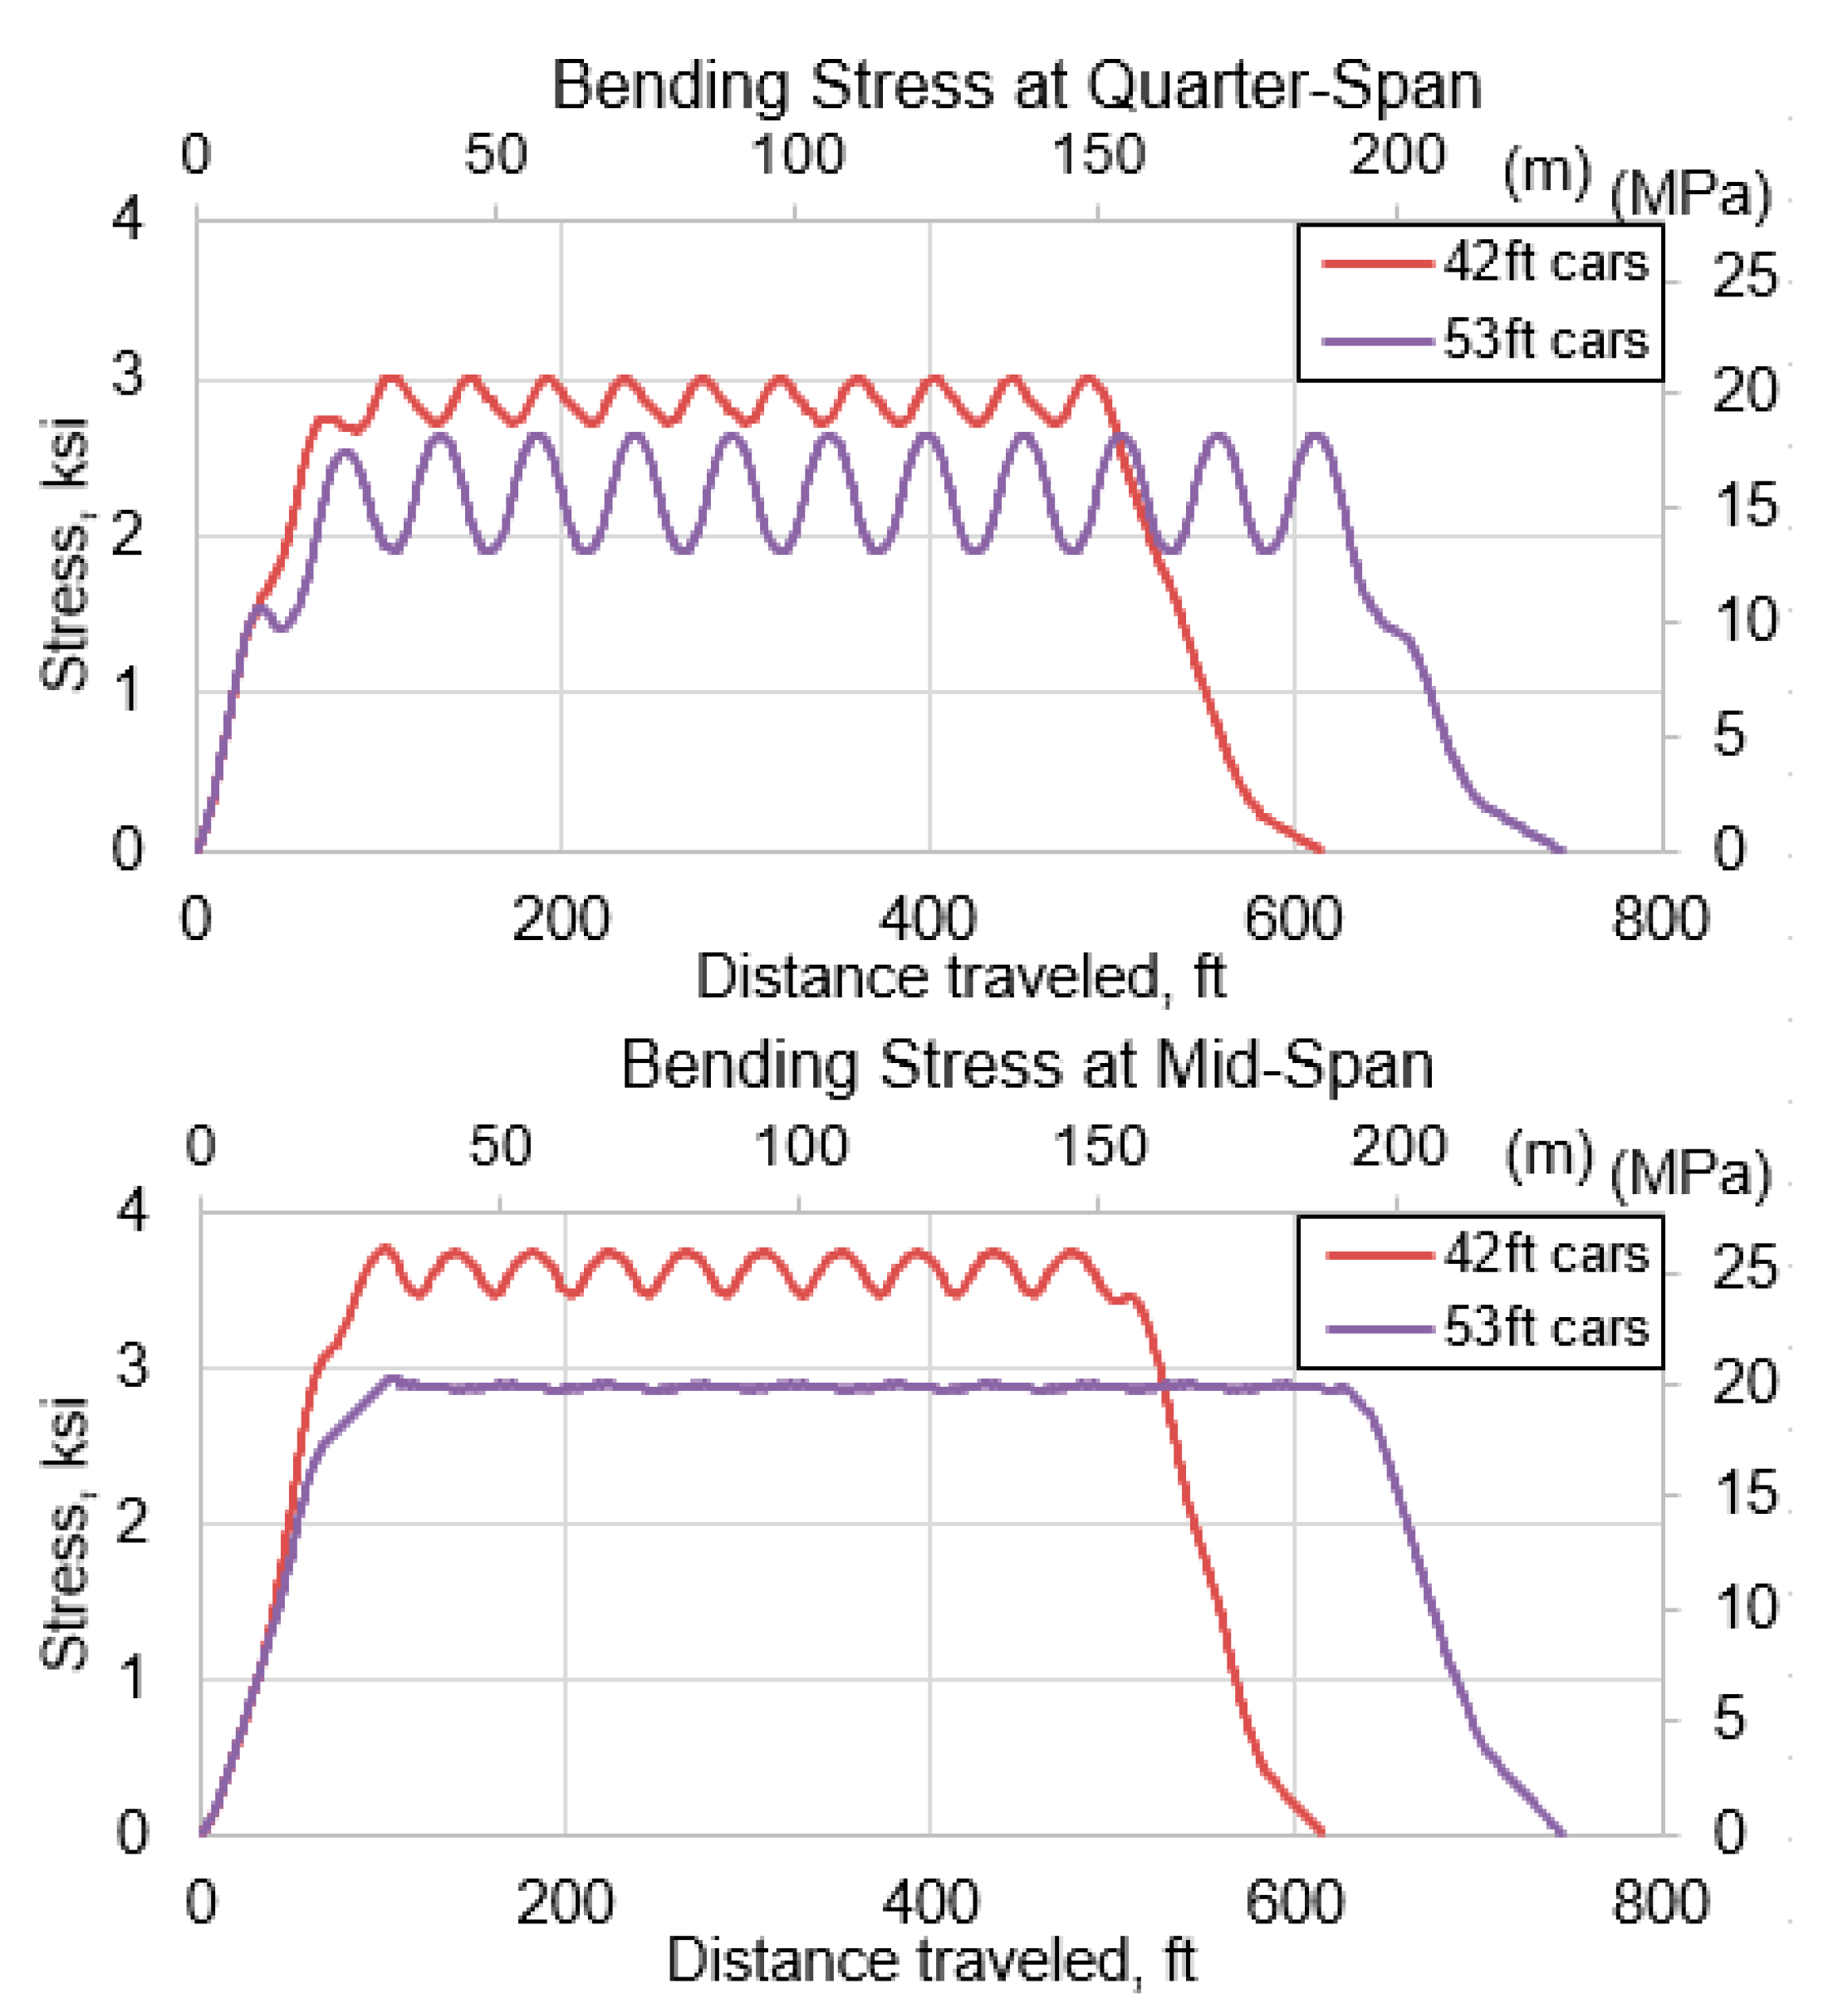
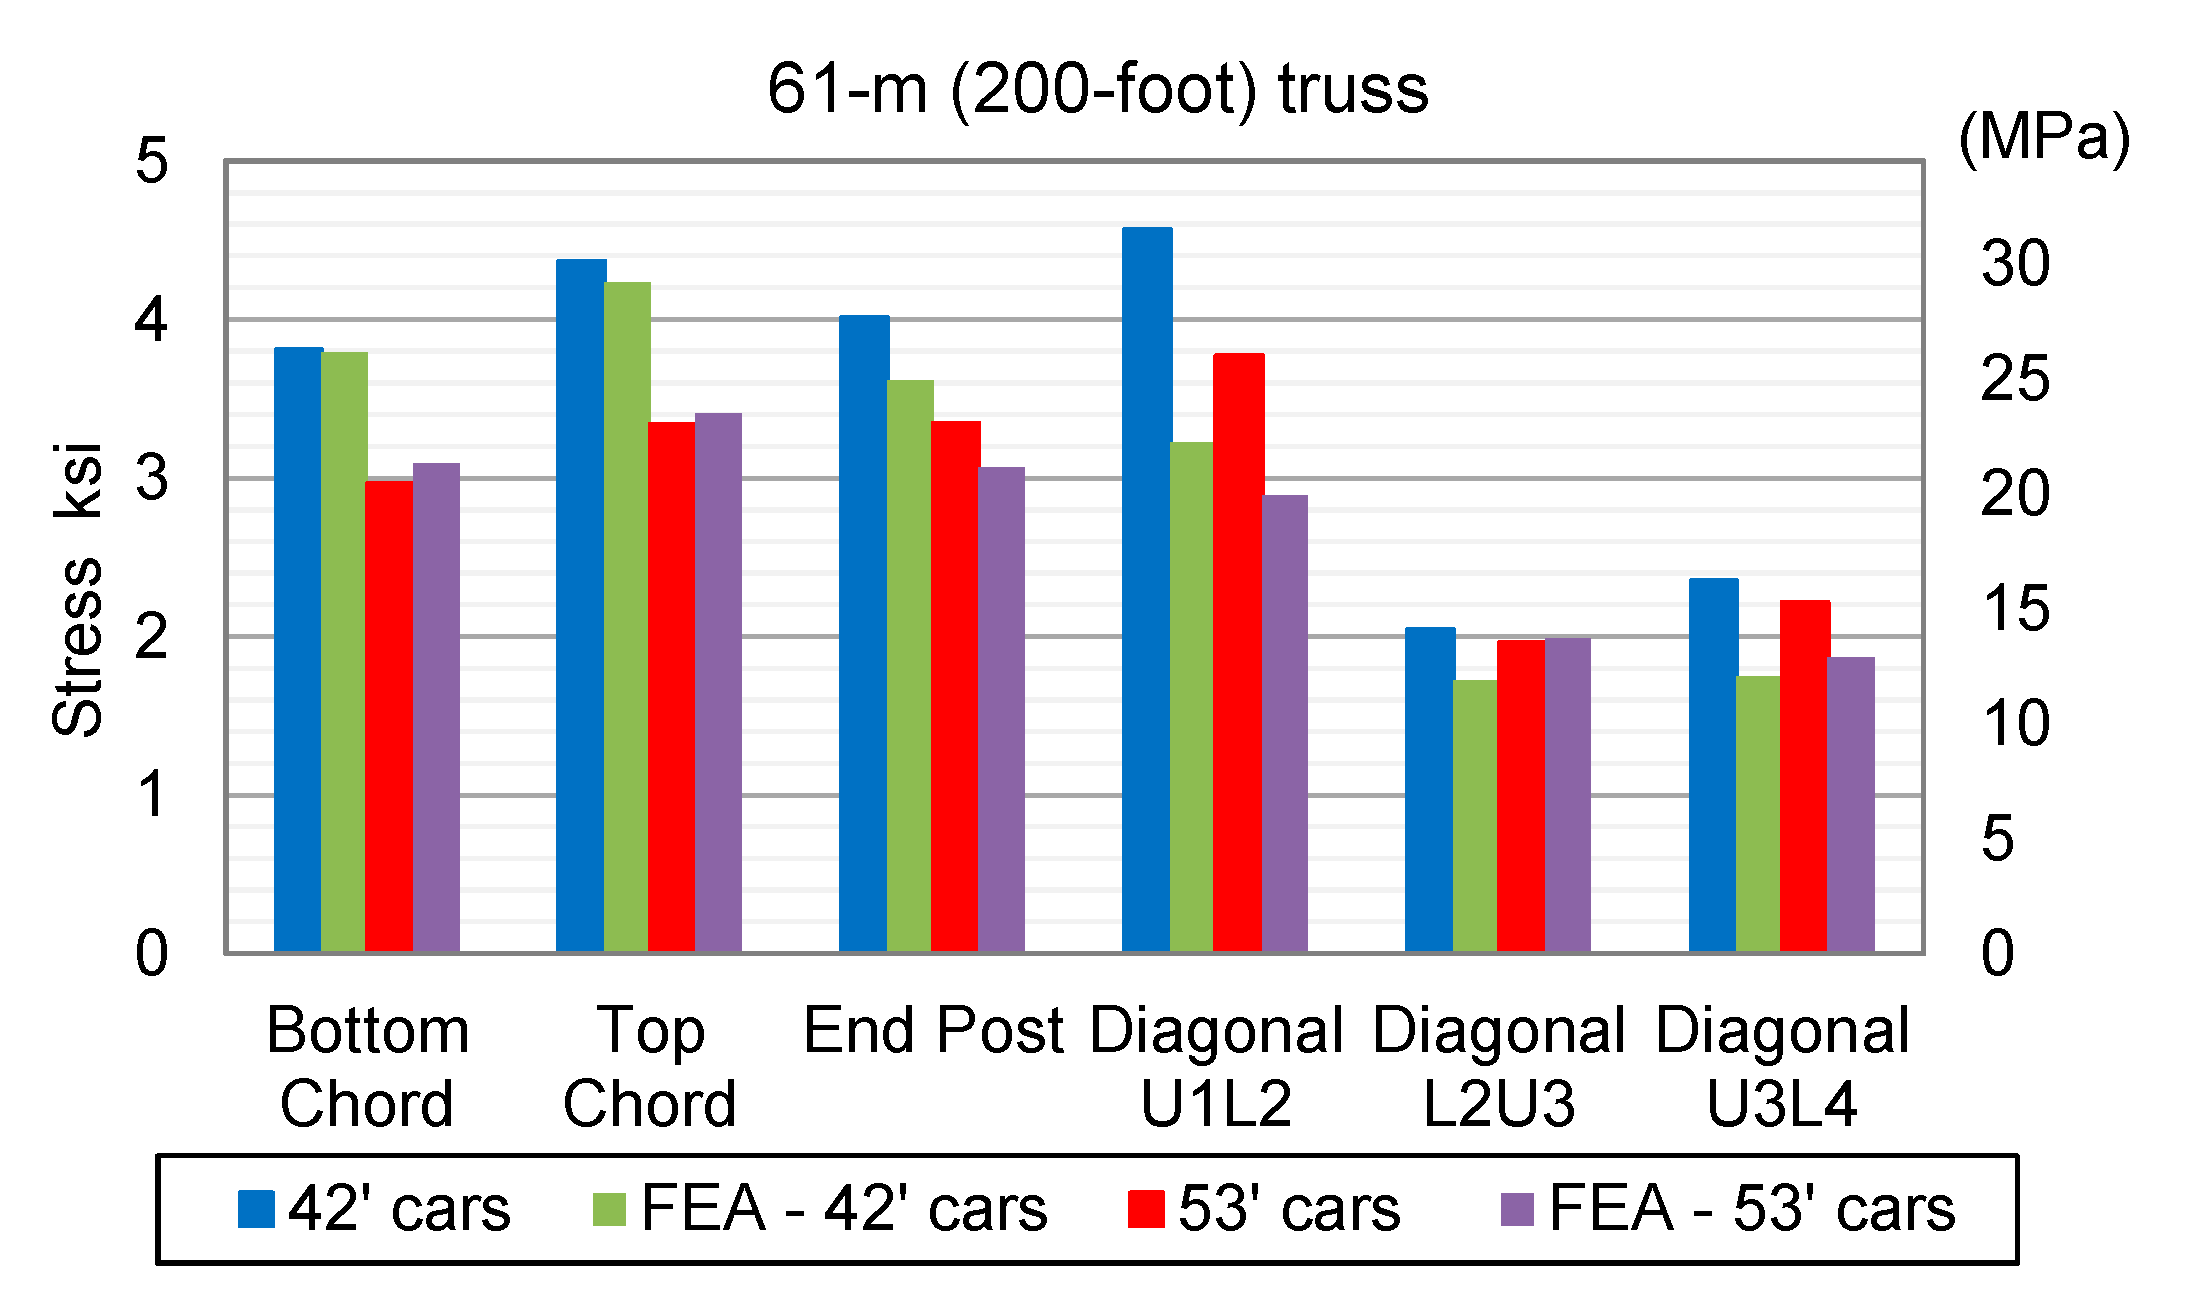
  • Stringers of the 61-m (200-ft) span did not experience any increase in stresses due to short railcars. However, the stringers experienced full unloading as the train traversed, and therefore, they can be more susceptible to fatigue.
The test data confirmed that stringers of the 61-m (200-ft) span did not experience any increase in stresses due to short railcars. The 12.8-m (42-ft) short railcars did not create an increase in fatigue cycle accumulation in the stringers. However, the stringers, which are relatively short when compared to other truss members, experienced full unloading as the train traversed. Since fatigue is governed by the stress range or magnitude of the stress cycles, these short bridge components can be more susceptible to fatigue as compared to longer components that did not experience full unloading due to the train passage.
The tested riveted steel DPG span further validated the analytical bridge fatigue model developed at TTCI for girder spans. The analytical calculations indicated that the mid-span might not be the most critical location for fatigue depending on railcar length and span length considerations. Stress ranges at cover plate terminations were the highest for this particular span. The test data confirmed the analytical predictions.
Based on the findings from the research presented in the paper, the following implications to be considered by bridge owners and railway bridge engineers are proposed:
  • Bridge load capacity ratings and railway operating restrictions need to consider railcar length in addition to railcar weight.
  • Shorter rail cars can limit the carload capacity of a bridge due to increased load on a span.
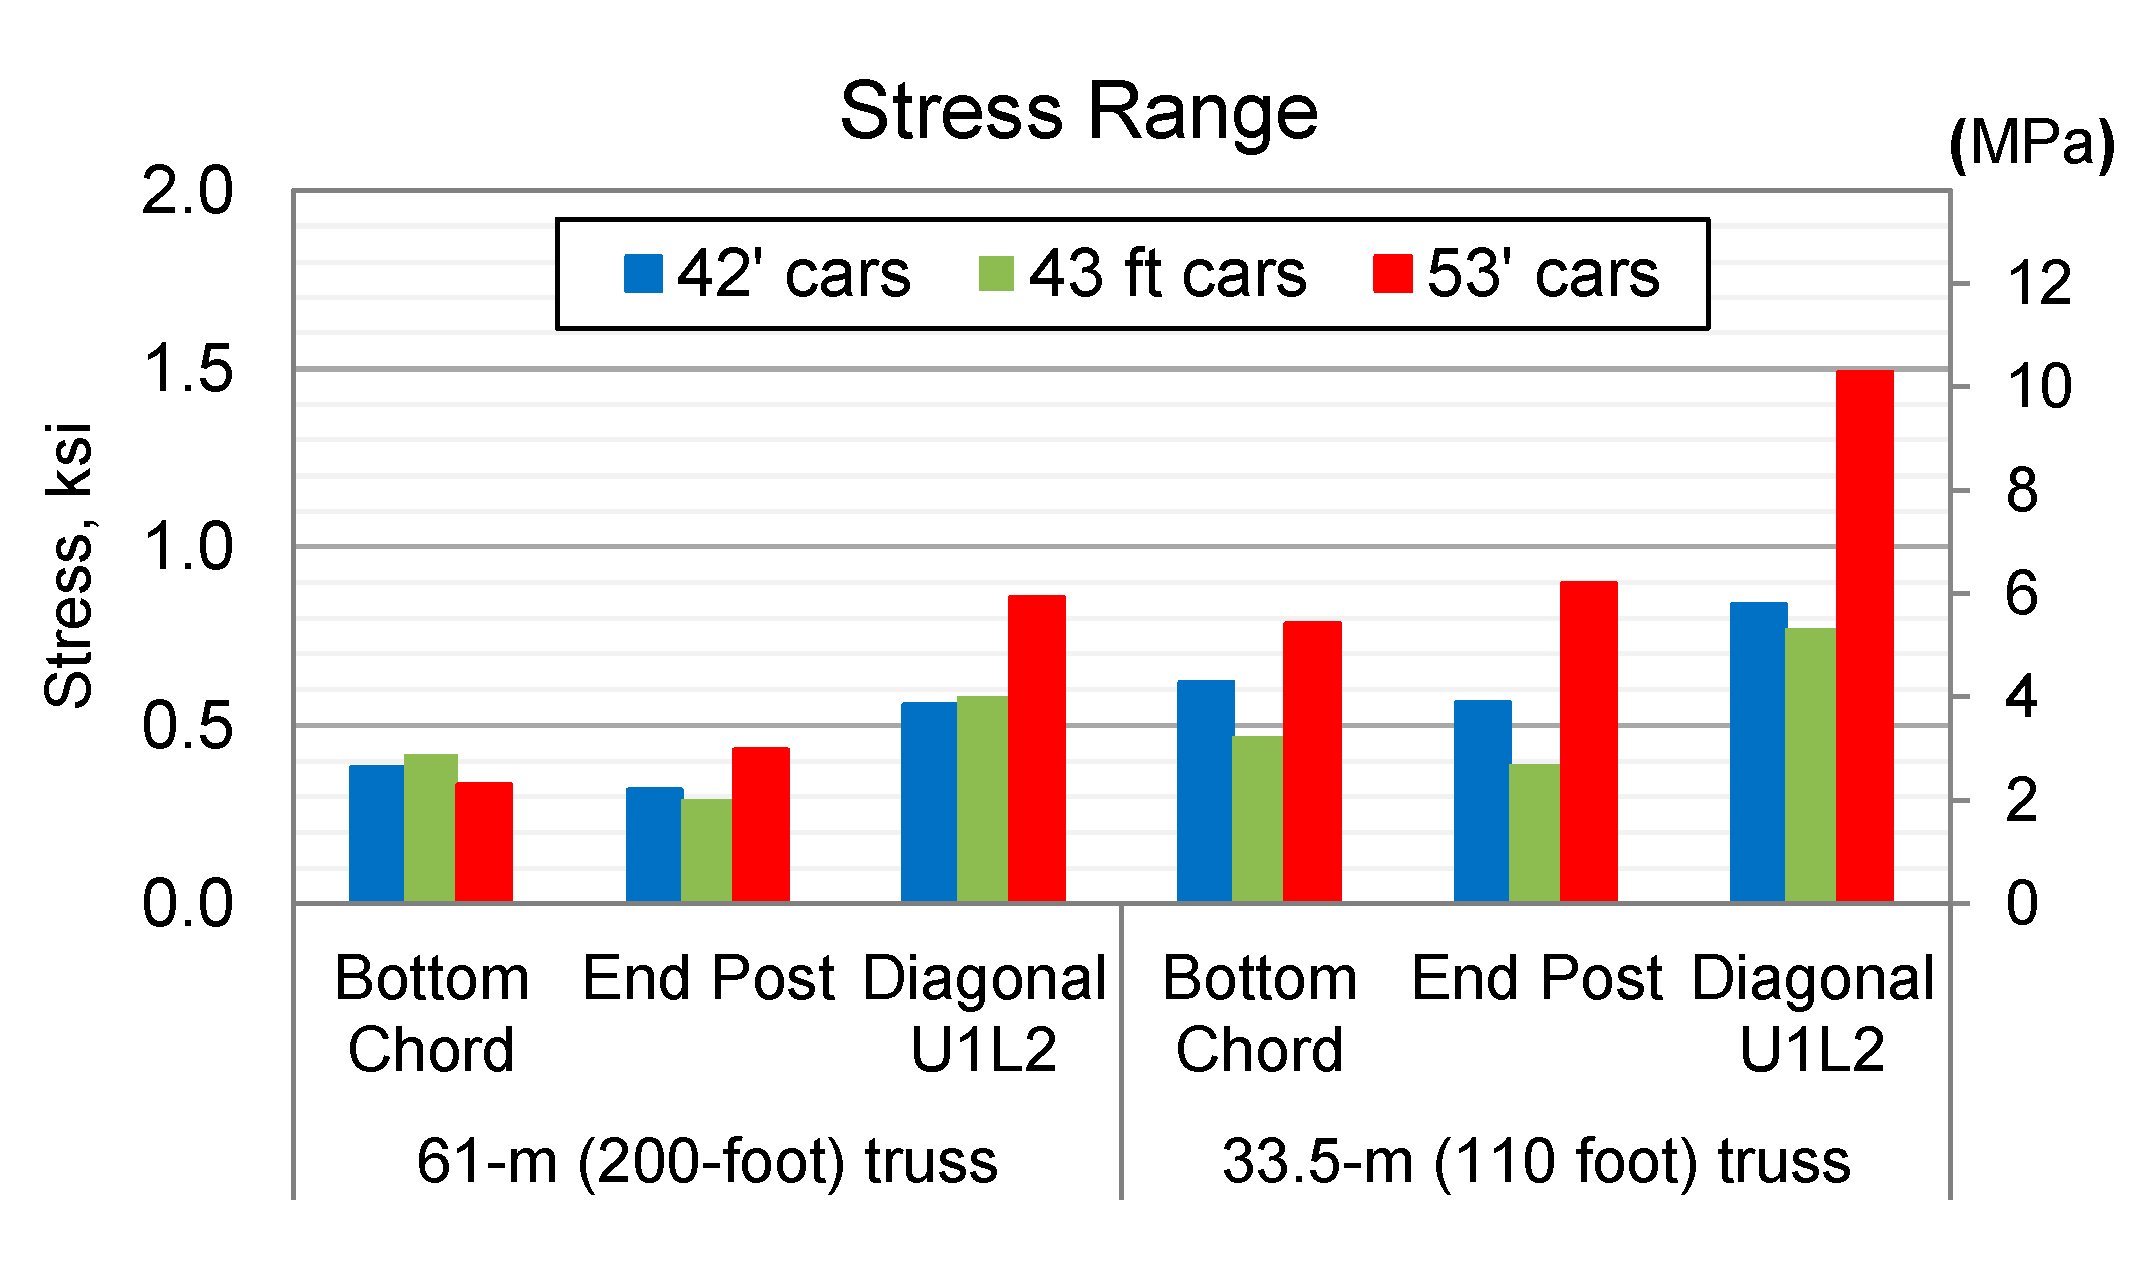
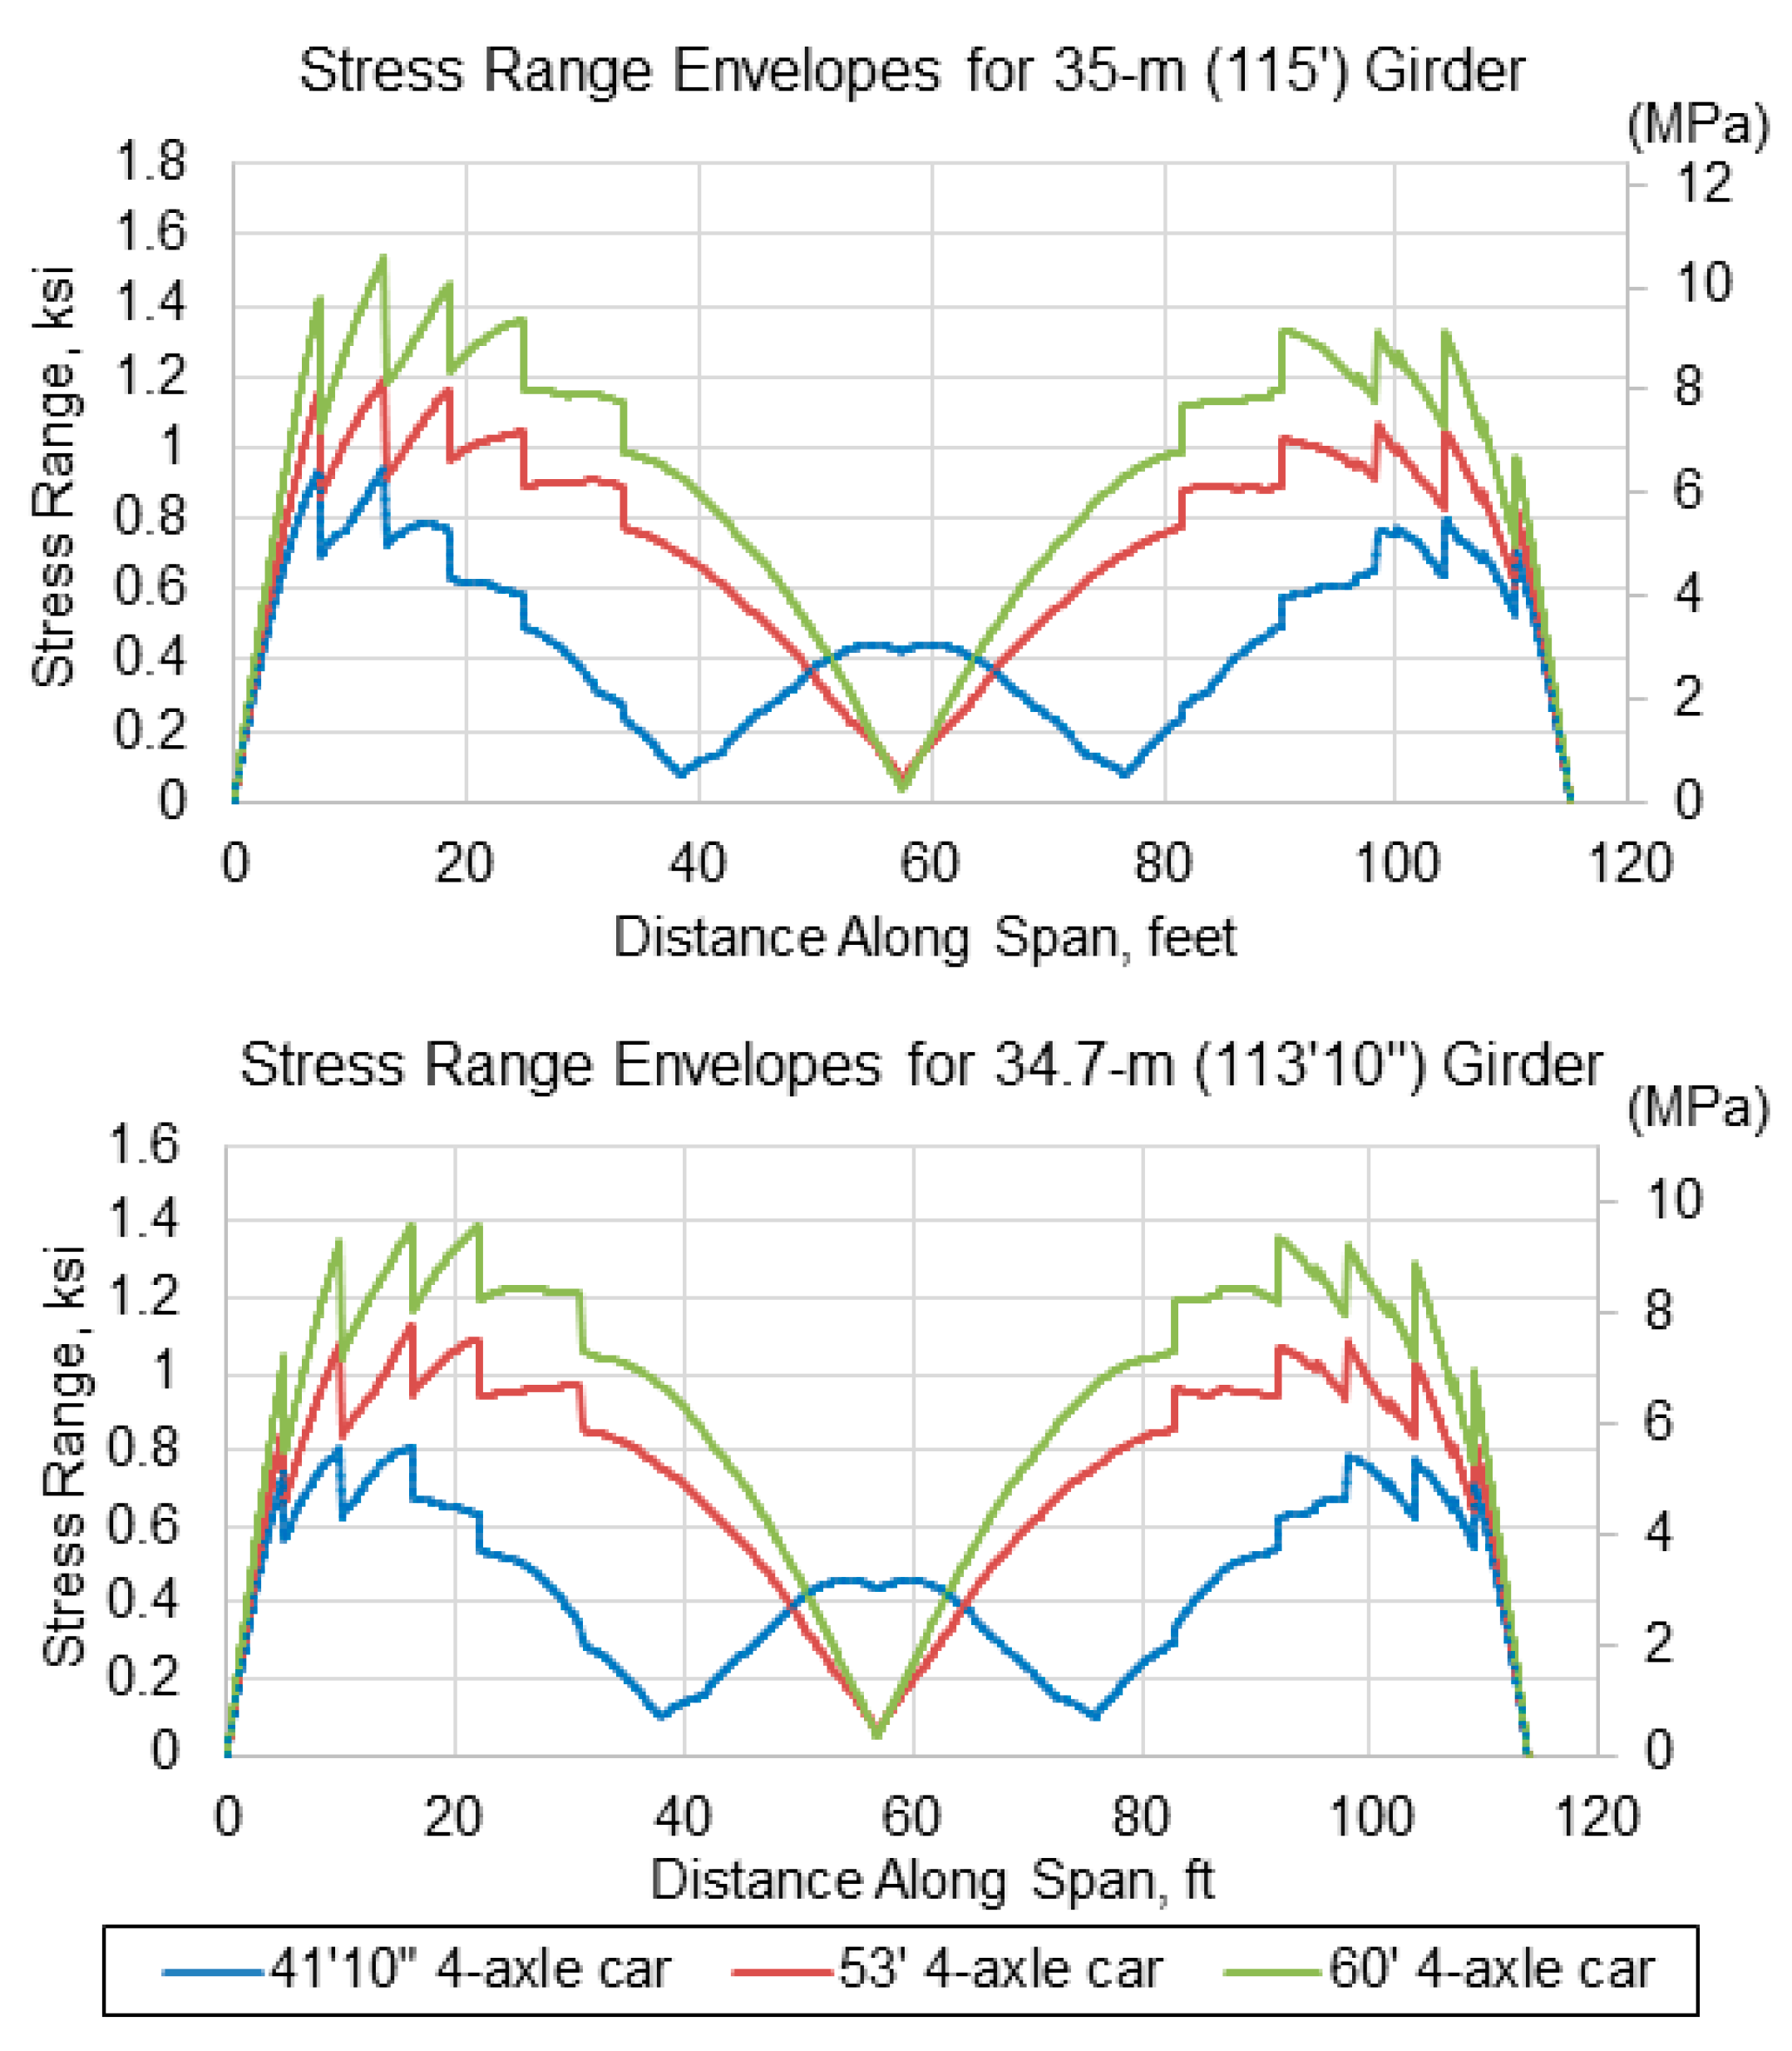
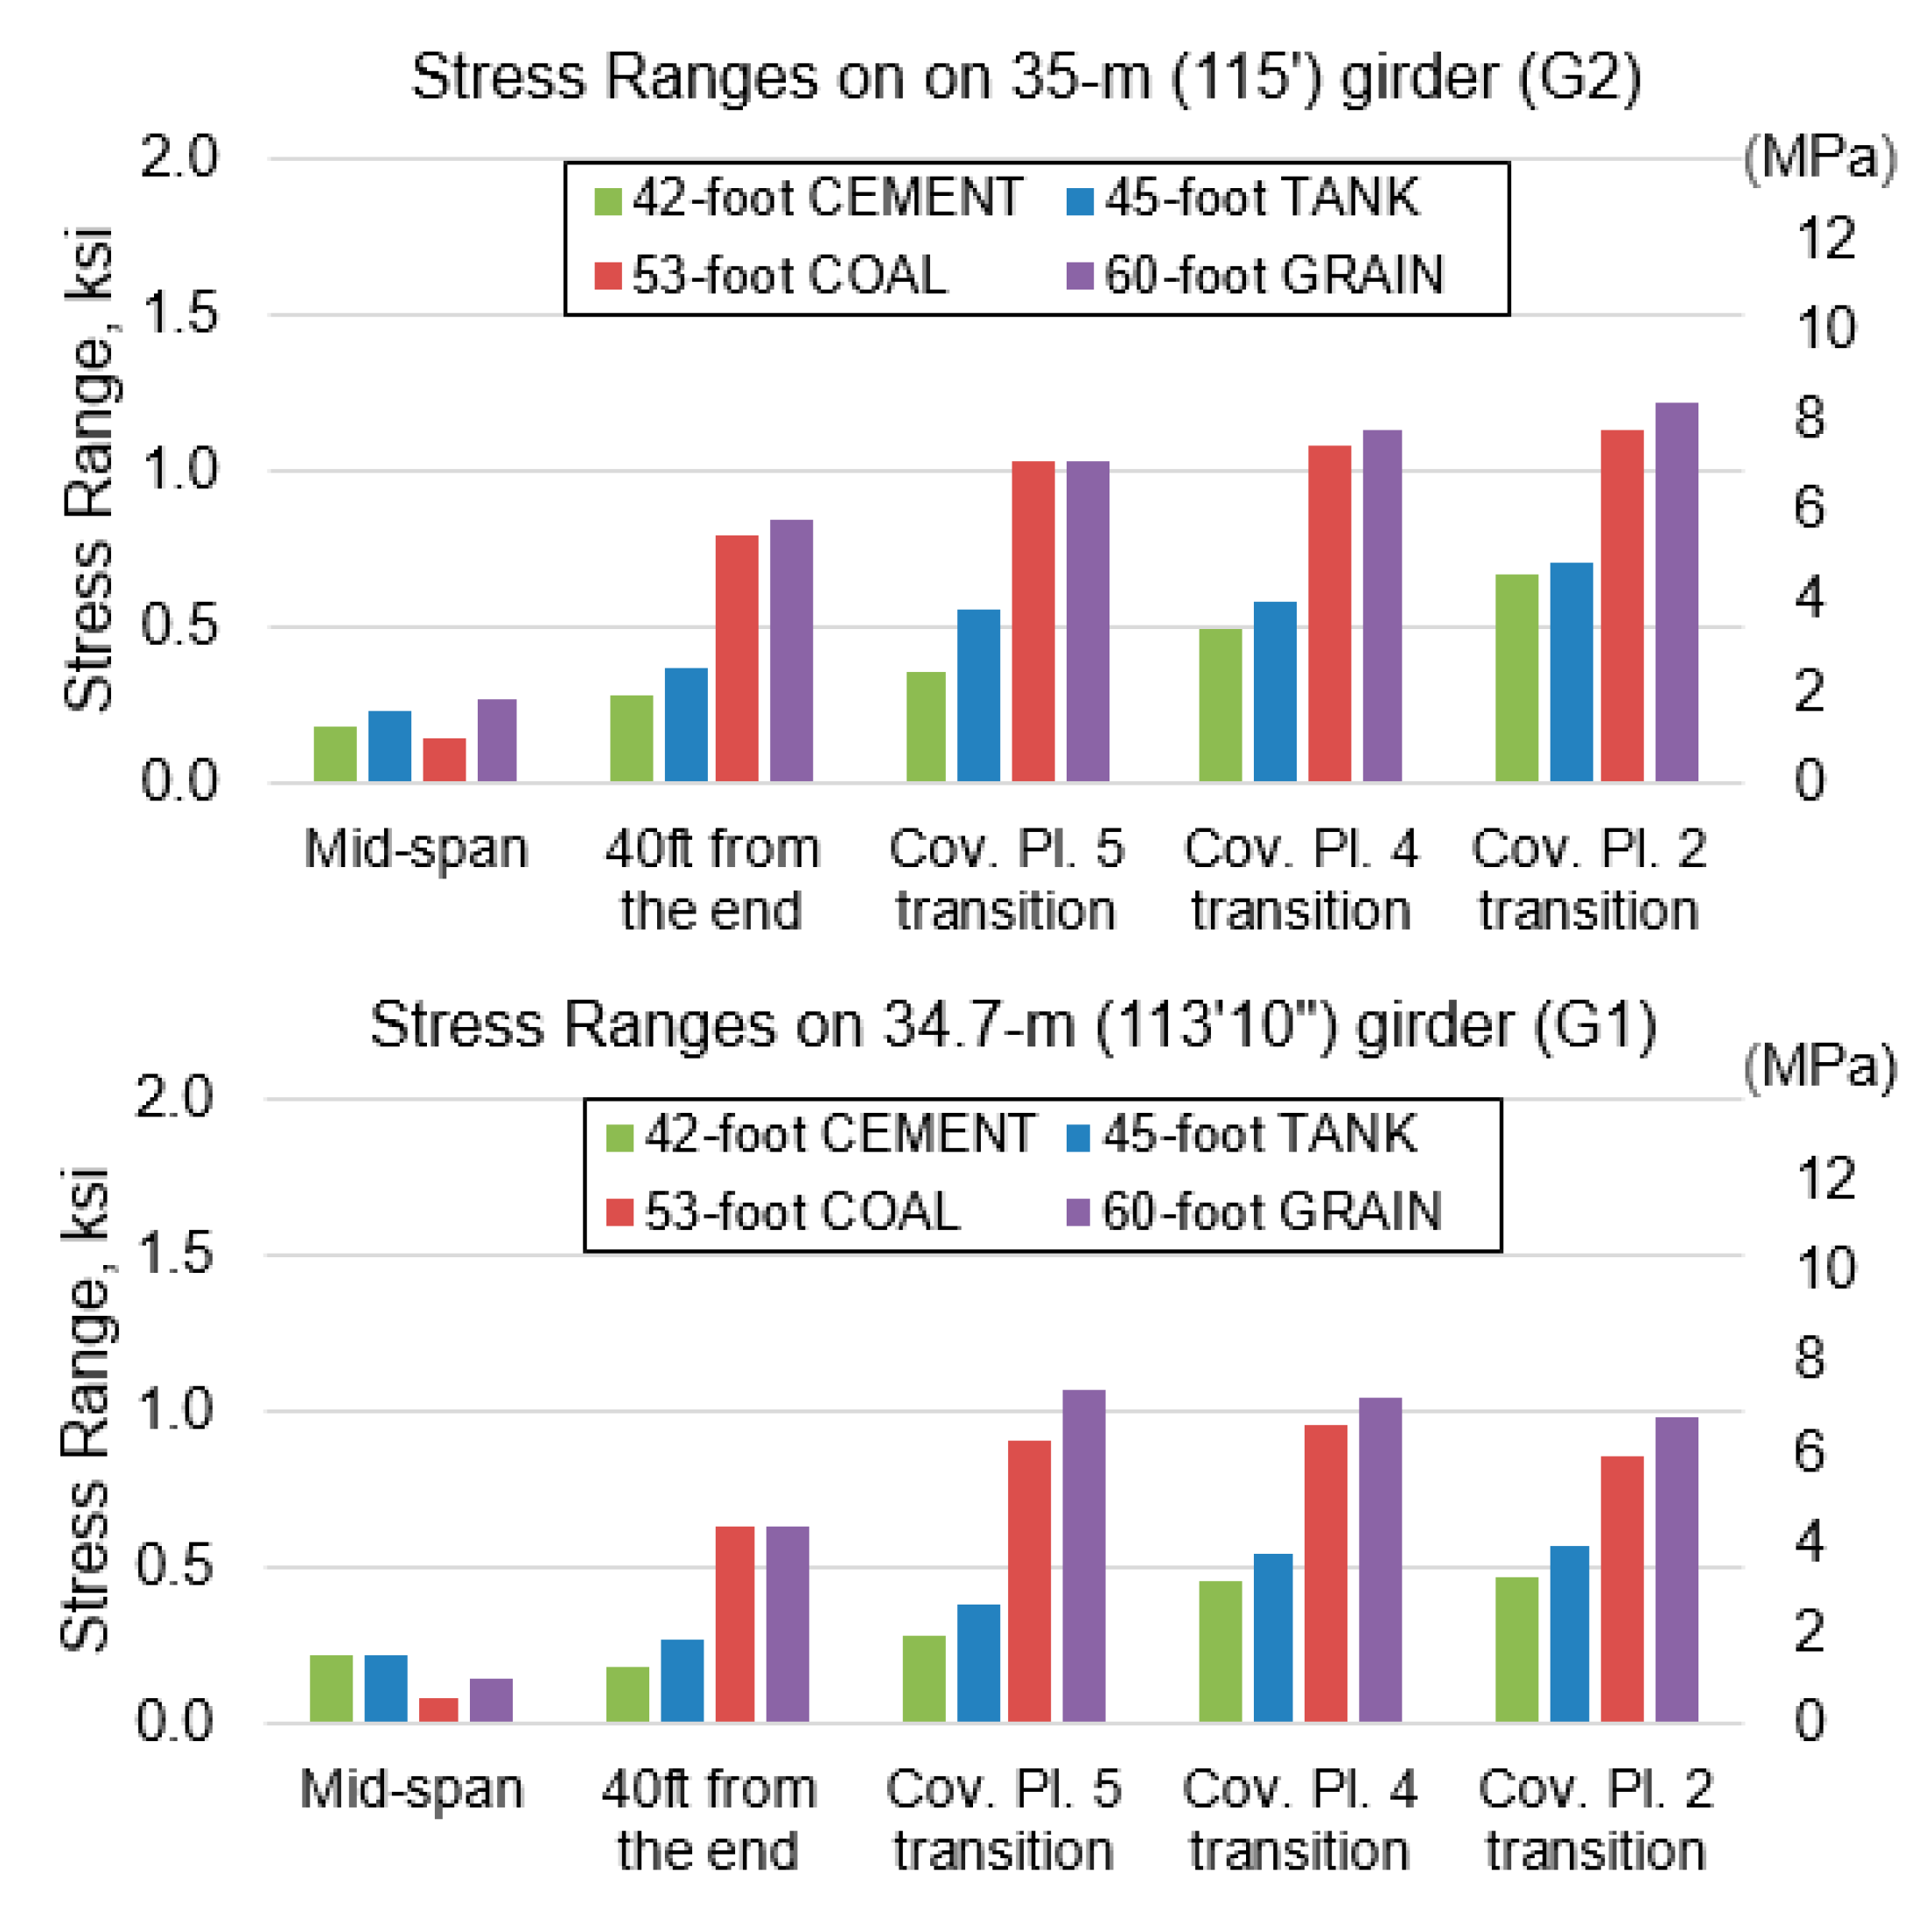
  • Longer rail cars can shorten the fatigue life of a bridge due to larger stress ranges caused by greater unloading between axles.
  • The ratio of rail car length to span length is a key parameter.

Author Contributions

Conceptualization, A.M.R. and D.E.O.; Data curation, A.M.R.; Formal analysis, A.M.R.; Investigation, A.M.R., D.E.O. and S.M.D.; Methodology, A.M.R. and S.M.D.; Validation, A.M.R.; Visualization, A.M.R.; Writing—original draft, A.M.R.; Writing—review and editing, D.E.O. and S.M.D. All authors have read and agreed to the published version of the manuscript.

Funding

This research was conducted as part of the Association of American Railroads’ Strategic Research Initiatives Program.

Institutional Review Board Statement

Not applicable.

Informed Consent Statement

Not applicable.

Data Availability Statement

The study did not report any data outside of this publication.

Acknowledgments

The authors would like to thank the participating Class 1 Railroads for allowing the TTCI team to take measurements on their bridges and for their valuable support.

Conflicts of Interest

The authors declare no conflict of interest. The funders had no role in the design of the study; in the collection, analyses, or interpretation of data; in the writing of the manuscript; or in the decision to publish the results.

References

  1. Rakoczy, A.M.; Otter, D.E.; Basye, C. Effects of Short Cars on Bridges and Track. In Proceedings of the AREMA Conference, Orlando, FL, USA, 26–29 September 2016. [Google Scholar]
  2. Rakoczy, A.; Otter, D.; Dick, S. Short Heavy Axle Load Cars: Analysis of Longer Bridge Spans; Technology Digest TD-16-047; TTCI/AAR: Pueblo, CO, USA, 2016. [Google Scholar]
  3. Rakoczy, A.; Prough, B.; Otter, D.; Dick, S. Short Heavy Axle Load Cars: Testing of Longer Bridge Spans; Technology Digest TD-16-048; TTCI/AAR: Pueblo, CO, USA, 2016. [Google Scholar]
  4. Rakoczy, A.M.; Shushu, L.; Otter, D.E.; Dick, S.M. Current Loading Spectra for Evaluation of Railway Bridges; Report R-1028; AAR/TTCI: Pueblo, CO, USA, 2018. [Google Scholar]
  5. Cremona, C.; Eichler, B.; Johansson, B.; Larrson, T. Improved Assessment Methods for Static and Fatigue Resistance of Old Metallic Railway Bridges. J. Bridg. Eng. 2013, 18, 1164–1173. [Google Scholar] [CrossRef]
  6. DelGrego, M.R.; Culmo, M.P.; DeWolf, J.T. Performance Evaluation through Field Testing of Century-Old Railroad Truss Bridge. J. Bridge Eng. 2008, 13, 132–138. [Google Scholar] [CrossRef]
  7. Sweeney, R.A.P. Factors Derived from Tests for Fatigue Evaluation of Typical North American Steel Railway Bridges. ASCE J. Bridge Eng. 2018, 23, 04018036. [Google Scholar] [CrossRef]
  8. American Railway Engineering and Maintenance of Way Association (AREMA). Manual for Railway Engineering, Chapter 15; AREMA: Washington, DC, USA, 2020. [Google Scholar]
  9. Fryba, L. Dynamics of Railway Bridges; Thomas Telford: London, UK, 1996; ISBN 0-7277-2044-9. [Google Scholar]
  10. Zobel, H.; Zbiciak, A.; Oleszek, R.; Michalczyk, R.; Mossakowski, P. Numerical Identification of the Dynamic Characteristics of a Steel-Concrete Railway Bridge. Roads Bridges 2014, 13, 275–301. [Google Scholar] [CrossRef]
  11. Wichtowski, B. Load-Carrying Capacity of Steel Railway Bridges of the Second Half of XIX Century—Discussion. Roads Bridges 2014, 13, 261–269. [Google Scholar] [CrossRef]
  12. Chróścielewski, J.; Rucka, M.; Banaś, A.; Malinowski, M.; Miśkiewicz, M.; Rutkowski, R. Systemy monitorowania stanu technicznego konstrukcji na przykładzie trzech mostów. Mosty 2011, 2, 32–40. [Google Scholar]
  13. Malinowski, M.; Rutkowski, R. Monitorowanie w trakcie 3-letniej eksploatacji Mostu III Tysiąclenia im. Jana Pawła II w Gdańsku. Inżynieria I Budownictwo 2005, 6, 323–326. [Google Scholar]
  14. Leander, J. Refining the Fatigue Assessment Procedure of Existing Steel Bridges. Ph.D. Thesis, KTH Royal Institute of Technology, Stockholm, Sweden, 2009. [Google Scholar]
  15. Rakoczy, A.; Otter, D.; Dick, S. Testing of 115-ft. In Girder Span for Fatigue Loading and Railcar Length Effects; Technology Digest TD-17-029; TTCI/AAR: Pueblo, CO, USA, 2017. [Google Scholar]
  16. Bujňák, J.; Gocál, J.; Hlinka, R. Assessment of Railway Steel Bridge Structures. Procedia Eng. 2016, 156, 75–82. [Google Scholar] [CrossRef]
  17. LUSAS Bridge/Bridge Plus. Available online: https://www.lusas.com/products/bridge_tour_overview.html (accessed on 20 June 2014).
  18. Axellson, E.; Syk, A.; Ulker-Kaustell, M.; Barttini, J.M. Effect of Axle Load Spreading and Support Stiffness on the dynamic response of short span Railway Bridges. Struct. Eng. Int. 2014, 24, 457–465. [Google Scholar] [CrossRef] [Green Version]
  19. Dick, S.M.; McCabe, S.L. Fatigue Analysis of Steel Railway Girder Bridges. In Proceedings of the 2002 Conference of the American Railway Engineering & Maintenance of Way Association, AREMA, Lanham, MD, USA, 2002. [Google Scholar]
Figure 1. Quantity of short HAL railcars from 2010 to 2015.
Applsci 11 03126 g001
Figure 2. Cooper rating for bridge spans up to 122 m (400 ft) evaluated in flexural bending.
Applsci 11 03126 g002
Figure 3. Investigated truss bridge dimensions and strain gauge locations (1 ft = 0.305 m).
Applsci 11 03126 g003
Figure 4. Investigated deck plate girder (DPG) bridge dimensions and strain gauge locations (1 ft = 0.305 m).
Applsci 11 03126 g004
Figure 5. FEM model of investigated truss bridge.
Applsci 11 03126 g005
Figure 6. Set of forces corresponding to axles load.
Applsci 11 03126 g006
Figure 7. FEM stress histories in end post (top) and top chord (bottom) of 61-m (200-ft) span.
Applsci 11 03126 g007
Figure 8. FEM stress comparison, 61-m (200-ft) span and 33.5-m (110-ft) span.
Applsci 11 03126 g008
Figure 9. FEM stress comparison, 61-m (200-ft) span and 33.5-m (110-ft) span.
Applsci 11 03126 g009
Figure 10. Stress histories calculated from measured strains in 61-m (200-ft) span: top chord (top) and end post (bottom).
Applsci 11 03126 g010
Figure 11. Typical peak stress calculated from measured strains, comparison for 61-m (200-ft) span.
Applsci 11 03126 g011
Figure 12. Typical peak stress calculated from measured strains, comparison for 33.5-m (110-ft) span.
Applsci 11 03126 g012
Figure 13. Stress range calculated from measured strains, comparisons for 33.5-m (110-ft) and 61-m (200-foot) spans.
Applsci 11 03126 g013
Figure 14. Gauge locations in stringers.
Applsci 11 03126 g014
Figure 15. Stress calculated from measured strains, comparison for stringer S2 southeast.
Applsci 11 03126 g015
Figure 16. Typical peak stress calculated from measured strains, comparisons for stringers.
Applsci 11 03126 g016
Figure 17. Typical peak stress calculated from measured strains, comparisons for stringers.
Applsci 11 03126 g017
Figure 18. FEM stress histories for 35-m (115-ft) girder of DPG span.
Applsci 11 03126 g018
Figure 19. Calculated cyclic stress range envelopes.
Applsci 11 03126 g019
Figure 20. Stress histories obtained from measured strains in south girder G2.
Applsci 11 03126 g020
Figure 21. Typical peak stress calculated from measured strains—comparison for south girder (top) and north girder (bottom).
Applsci 11 03126 g021
Figure 22. Stress range calculated from measured strains—comparisons for girder G1 and G2.
Applsci 11 03126 g022
Figure 23. Stress comparison of measured data and FEM results, 61-m (200-ft) span.
Applsci 11 03126 g023
Figure 24. Stress comparison of measured data and FEM results, 33.5-m (110-ft) span.
Applsci 11 03126 g024
Table 1. Geometry properties of truss members.
Bottom Chords and DiagonalsTop Chords and End Posts
Scheme of the cross-section Applsci 11 03126 i001 Applsci 11 03126 i002
61 m truss membersBottom Chord L0L2:
4Ls 6 × 4 × 1/2
2Pls 2 × 7/16
Upper Chords U1U3, U3U3:
2Ls 4 × 4 × 1/2
2Ls 6 × 4 × 1/2
1 Cov. Pl 27 × 5/8
2 Web Pls 24 × 5/8
Bottom Chord L2L4
4Ls 6 × 4 × 5/8
2Pls 24 × 5/8
Diagonal U1L2:
4Ls 6 × 4× 1/2
2Pls 18 × 3/4
Diagonal L0U1:
2Ls 4 × 4 × 5/8
2Ls 6 × 4 × 5/8
1 Cov. Pl 27 × 5/8
2 Web Pls 24 × 3/4
Diagonal L2U3:
4Ls 4 × 4 × 5/8
2Pls 18 × 1/2
Diagonal U3L4
4Ls 4 × 4 × 3/8
2Pls 18 × 1/2
33.5 m truss membersBottom Chord L0L2:
4Ls 4 × 4 × 3/8
2 Pls 18 × 3/8
Upper Chords U1U3:
4Ls 4 × 4× 3/8
1 Cov. Pl 24 × 1/2
2 Web Pls 18 × 3/8
Diagonal U1L2:
2 Cs [email protected]
Diagonal L0U1:
4Ls 4 × 4 × 3/8
1 Cov. Pl 24 × 1/2
2 Web Pls 18 × 1/2
Publisher’s Note: MDPI stays neutral with regard to jurisdictional claims in published maps and institutional affiliations.

